Photovoltaic system optimization by new maximum power point tracking (MPPT) models based on analog components under harsh condition

Abstract
Photovoltaic (PV) energy has become a promising energy source because the demand for electrical energy from renewable energy sources is increasing worldwide in recent decades. Due to efficiency issues, the Maximum Power Point Tracking (MPPT) has been developed to optimize the solar panel’s performance. This paper presents an MPPT model, made up of the analog component, which overcomes traditional MPPT methods’ weakness via the Perturb and observes (P&O) technique. In this case, the PV system includes a PV array, a DC/DC boost converter, a battery, and a load. The proposed method was precisely built and simulated using the Powersim, MATLAB Simulink, and SimCoupler Module. The components of the analog MPPT system were designed practically in detail. The experiment was carried out by using European Efficiency Test 50530, and the results showed the proposed model has higher efficiency over the digital MPPT technique, about 99.99% as maximum. Moreover, MPPT methods were tested under steady-state, irradiation variation, and space conditions to verify the system’s potential capability with PV module Solbian 52L.
Introduction
Nowadays, renewable energy (De Matos, e Silva, and Ribeiro 2014; Irmak et al. 2014; Mai et al. 2014; Molotov, Vaskov, and Tyagunov 2018; Usova and Velkin 2018) has been considered as the key factor to reduce the burden of traditional energy source comes from polluting fossil fuels (Molotov, Vaskov, and Tyagunov 2018). About electricity generation, solar photovoltaic energy (Jain, Mehta, and Mittal 2011; Lekbir et al. 2019) is one of the best alternative solutions because of its abundant source and environment-friendly product. The connection and use of photovoltaic (PV) on the world should be in line with the sustainable energy development framework worldwide. However, the PV system shows a non-linear current-voltage characteristic varying with the irradiance and temperature, affecting its power output. Typically, the maximum power point tracking (MPPT) technique is used to deliver the highest possible power in different conditions continuously (Cao and Kim 2015; Javed, Ashfaq, and Sing 2019; Mao et al. 2017; Zhang et al. 2018). The MPPT control is important key for the success of a PV generation system. Perturb and observes (P&O) (Sharma and Katti 2017) is the most popular MPPT algorithm with high performance, which is usually implemented into a microcontroller as a digital device. To achieve the same response time to a change in solar panel conditions, digital implementations of MPPT algorithms are more complicated than analog ones (Esram and Chapman 2007).
Moreover, digital MPPT is not well adapted to operation when environmental conditions change rapidly. Therefore, an analog method with optimized MPPT efficiency is essential to design many challenging circumstances with an unpredictable variation of irradiation from low to high, especially in space conditions. The analog MPPT has already been researched (Mhiri et al. 2017). However, the MPPT system is still complicated, requiring multiple operation procedures, and the system needs more challenging tests for hard circumstances. Therefore, this paper aims to design an analog MPPT model based on the P&O principle. The operating efficiency proposed system is compared with traditional MPPT based on EN 50530 (Andrejašič, Jankovec, and Topič 2011; Ishaque and Salam 2014). The components of the analog system were designed practically to maximize the working efficiency of the whole tracking process. The behavior of analog P&O MPPT was tested and analyzed in detail under steady-state and hard circumstances such as transient irradiation and space conditions. The solar generator is simulated based on a real PV module: Solbian 52L (Solbian 2020).
The paper is organized as follows: Firstly, the features of PV module Solbian 52L and DC/DC Step-Up Converter is described, then I-V curve, as well as MPP of the PV module, is demonstrated. The next part concentrates on MPPT description and component design. The final section is about results and analysis.
Study case
PV module
The test will be carried out on the PV module Solbian 52; the main parameters are reported in Table 1.
PV module Solbian 52L features.
| PV module Solbian 52L | |
|---|---|
| Maximum power (W) | 52 |
| Max power voltage Vmp (V) | 9.1 |
| Max power current Imp (A) | 5.7 |
| Open circuit voltage Voc (V) | 10.9 |
| Short circuit current Isc (A) | 6.0 |
Real I-V curve
Practically, the real PV parameters always varied, not exactly the same as the manufactured data. Hence, the real PV parameters are simulated by Powersim to show corresponding current-voltage (I-V) and power and voltage (P-V) curves, as Figure 1.
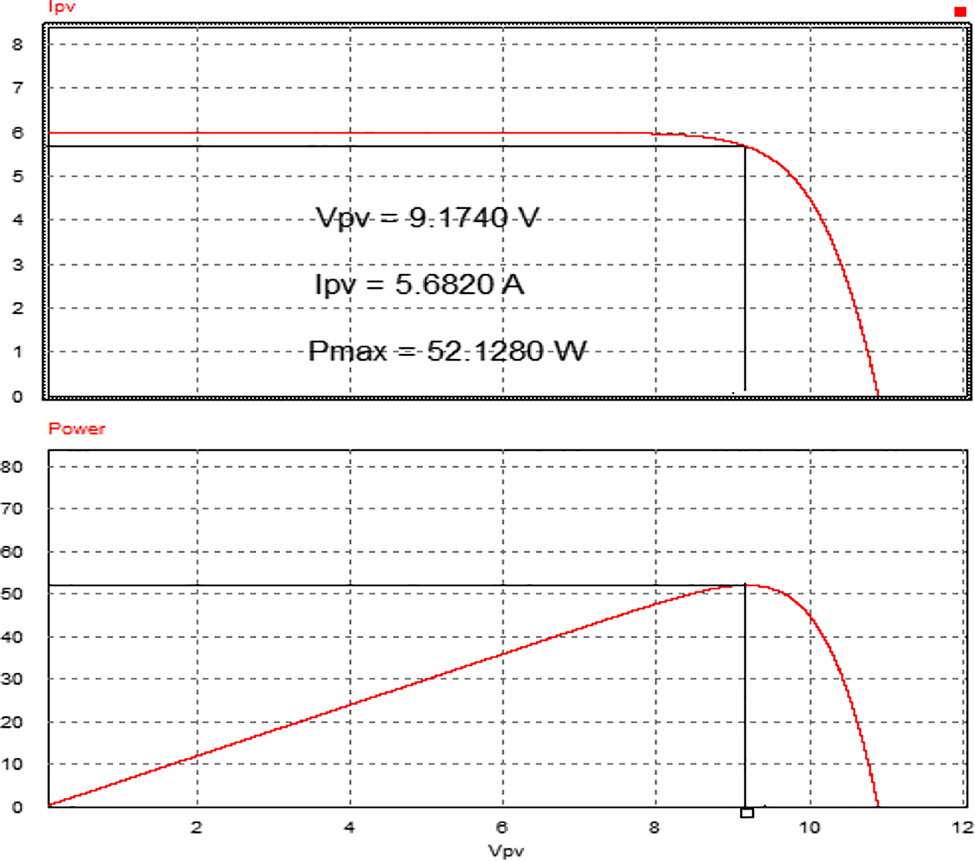
MPP of PV module.
DC/DC step-up converter
A DC/DC converter is calculated for PV module Solbian 52L like Table 2 to investigate the operation of the MPPT controller.
Boost converter parameter and working conditions.
| Boost parameters | Nominal values |
|---|---|
| Input capacitance Cin | 110 µF |
| Equivalent series resistance of Cin | 5 mΩ |
| Output capacitance Cout | 44 µF |
| Inductance L | 13.8 µH |
| Equivalent series resistance of L | 20 mΩ |
|
|
|
| Operating conditions | Nominal values |
|
|
|
| Switching frequency fs | 200 kHz |
| Battery voltage Vbat | 12 V |
| Voltage sensor gain | 1 |
| Current sensor gain | 1 |
MPPT techniques
Digital MPPT
The (P&O) method measures the PV’s terminal voltage and output current, then the actual power can be calculated. The DC-DC converter varies the duty cycle until the MPP is accomplished. The P&O operates the DC-DC converter with the initial set duty cycle and then starts increasing the duty cycle with a specific step width. The power is observed with the addition of each step. When a certain point the power gets less than its previous values, which means that the duty cycle should get one step in the opposite direction.
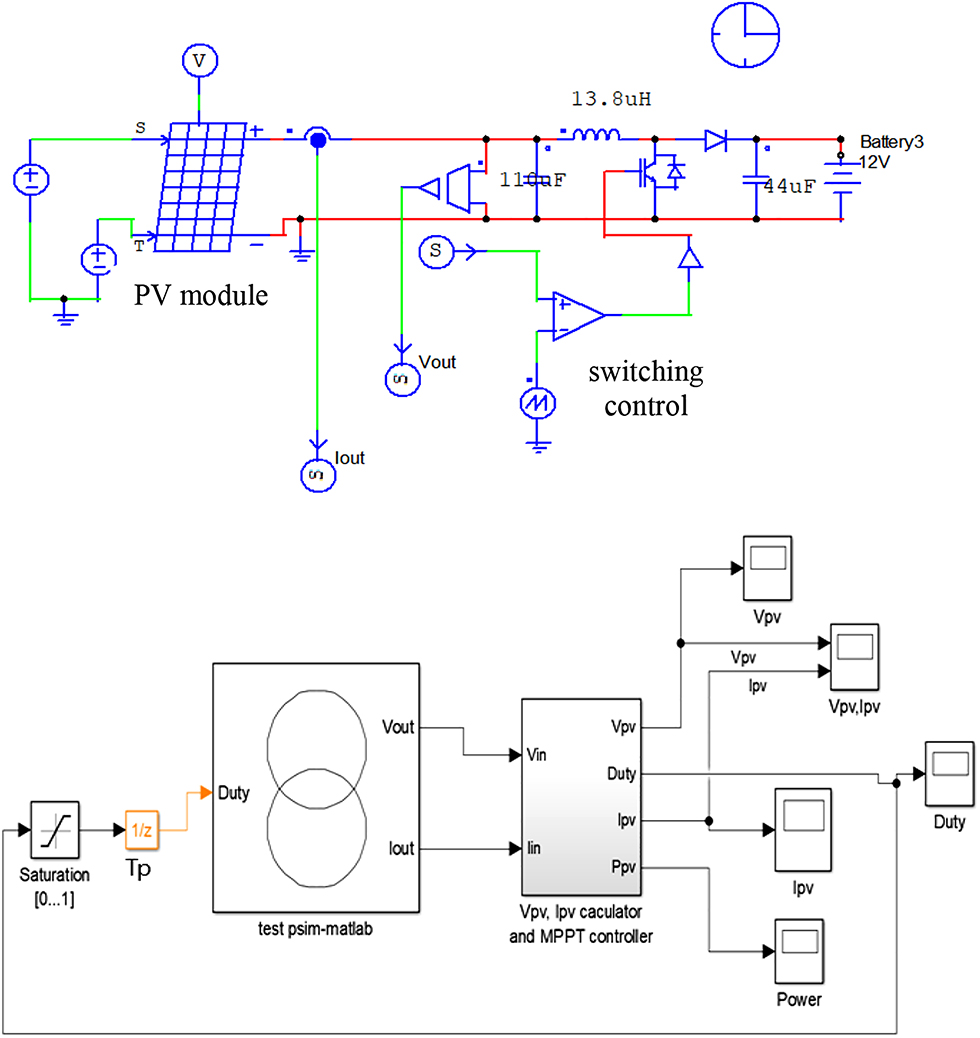
The SimCoupler Module is an add-on option to the PSIM software. It provides an interface between PSIM and Matlab/Simulink for co-simulation, as shown in Figure 2. With the SimCoupler Module, part of a system can be implemented and simulated in PSIM and the rest of Simulink’s system. One can, therefore, make full use of PSIM’s capability in power simulation and Matlab/Simulink’s capability in control simulation in a complementary way (Powersim 2018).
Digital MPPT simulation model.
Here, the PV module and DC/DC converter designed by Powersim then sent the voltage and current value to the Matlab Simulink. The P&O code is implemented to the MPPT controller in Matlab function like described in (Femia 2013).
The right value of the Perturbation period of the duty cycle (Tp) will ensure a stable three-point behavior. Tp’s too-small value can confuse the P&O algorithm, and the operating point can become unstable, entering disordered or chaotic behavior. On the contrary, a too high value of Tp penalizes the MPPT speed.
The settling time Tε ensuring that small-signal variations around the steady-state values of power are confined within a band of relative amplitude +/−ε.
To avoid the transient oscillation of the PV system caused by its action
While:
where ζ: the damping factor, ωn: the natural frequency, ε = 0.1 is chosen according to the classical control system theory, Rmpp is the maximum power point resistance (Ω) based on battery resistance, Rcin and RL are Equivalent series resistance of Cin and L respectively (see Figure 3).
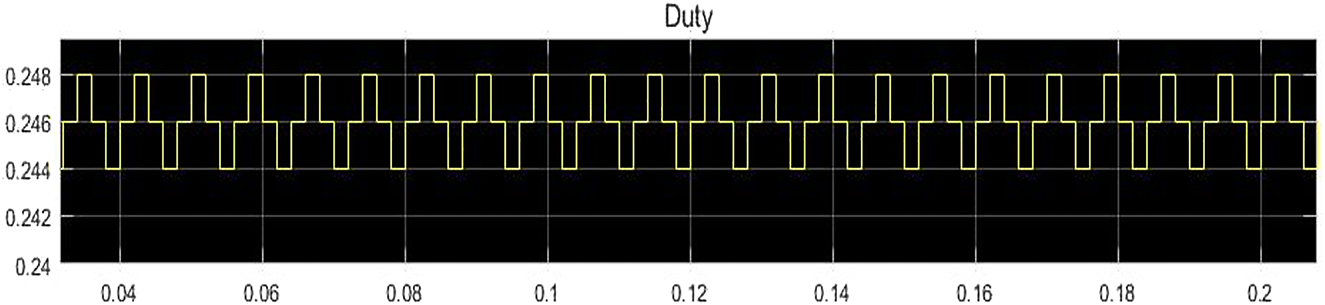
Duty cycle generation.
The maximum power point (MPP) is tracked around three points of peak curve as shown in Figure 4, depending on duty cycle generation.
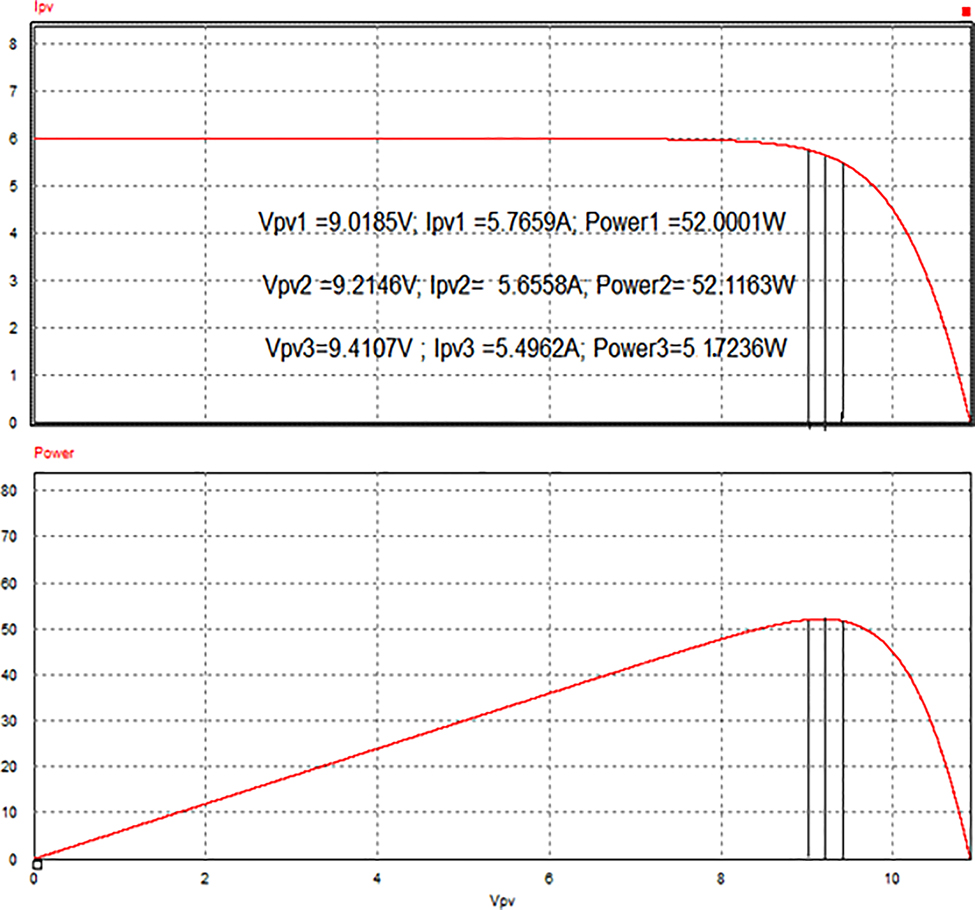
MPPT behavior by traditional P&O.
Analog MPPT
As we mentioned above, an analog method with optimized MPPT efficiency is essential to design for many hard circumstances having an unpredictable variation of irradiation from low to high, especially space. For that reason, the hybrid between the traditional algorithm P&O and the analog structure were researched with the advanced features: high competences, optimized efficiency and still maintains the simplicity. At any instant of time, the goal of MPPT is to trace a voltage level such that maximum power is obtained. The power increases in raising the voltage. Thus the next perturbation would be further increased in voltage level. At point two, the power decreases in reducing the voltage level. Therefore, the next perturbation will be an increment in voltage level. In the case voltage rises up, the power will decrease, so the next perturbation would be reduced in voltage level. At point four, if the voltage drops, the power increases. Thus, the next perturbation would be further reducing voltage till VMPP is reached. The summary of the algorithm P&O shown as below in Table 3:
P&O principle.
| Perturbation (change in voltage at an instant) | Change in power | Next perturbation (next change in voltage) |
|---|---|---|
| Increase | Increase | Increase |
| Decrease | Decrease | Increase |
| Increase | Decrease | Decrease |
| Decrease | Increase | Decrease |
This truth table is obtained by considering any increase denoted by a high or ‘1’ and decrement is shown by low or ‘0’. Thus, the truth table is demonstrated as Table 4
P&O logic conversion.
| Perturbation | Change in power | Next perturbation |
|---|---|---|
| 1 | 1 | 1 |
| 1 | 0 | 0 |
| 0 | 1 | 0 |
| 0 | 0 | 1 |
From the truth table, we can infer that this MPPT based on the P&O algorithm works on simple XNOR logic. The two inputs are the same, only when the output is high. The power and panel voltage signals are sent to differentiators, which detect the power and panel voltage trend. The signals after differentiators are dP/dt and dVpv/dt. The current and voltage derivatives are fed into hysteretic comparators to get sign (dP/dt) and sign (dVin/dt). The sign signals are the inputs to an XNOR gate to determine if the two signs are in phase or out of phase.
The XNOR gate’s output, as the earlier method, is the input to a Sample and Hold (S&H) block. The S&H with fast acquisition time reduces the length of the sampling interval and the power annulment period. The S&H also has a low drop rate to avoid the deviation of the PV operating point from the MPP during the sampling period (Ishaque and Salam 2014).
An integrator is placed following the output of the S&H block to generate the voltage signal Vref then a capacitor is used to minimize the oscillation of voltage. Finally, Vref is compared to a 200 kHz sawtooth waveform to produce the PWM waveforms for the DC/DC boost converter operation. To distinguish with digital MPPT, the Ipv and Vpv will be noted as Isys and Vsys on the scheme as Figure 5.

Analog P&O MPPT.
For this analog MPPT, the S&H has the main role in the controller structure which gets the XNOR signal as its input then generates the output signal based on S&H clock. It is clever to observe on Figure 6 that the rising edge of S&H clock activates the sample mode and the falling edge activates the hold mode. Like that, the XNOR signal sampled and held through the S&H function.
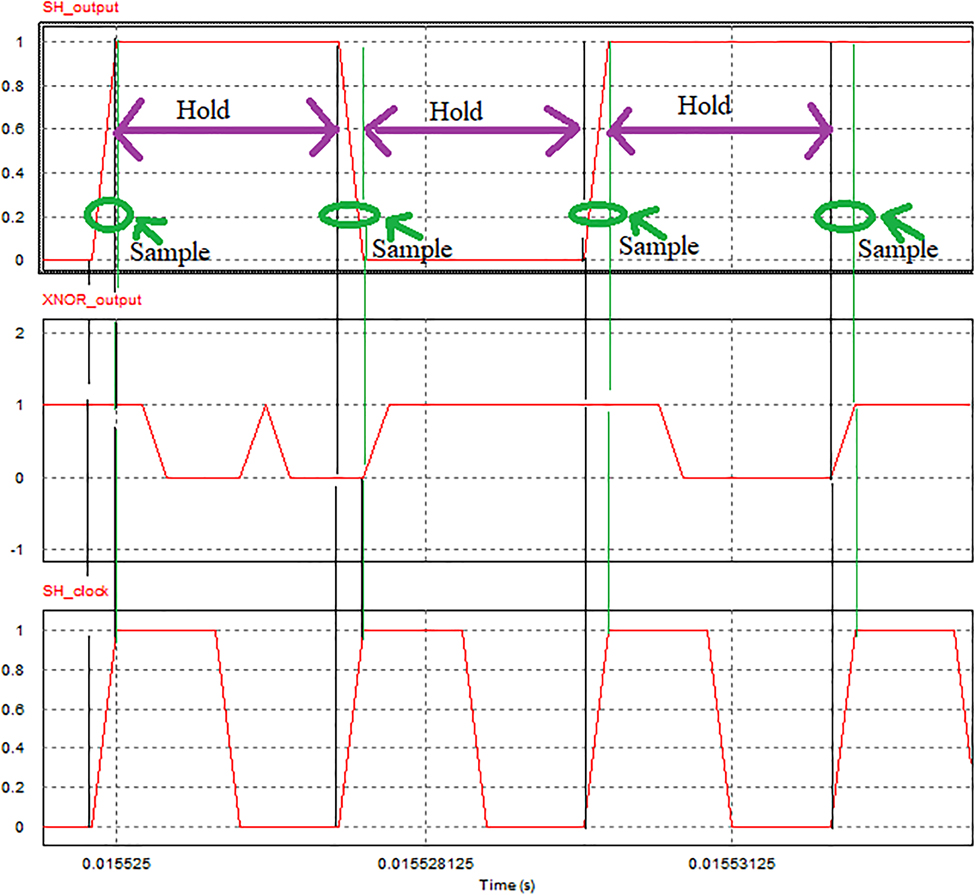
S&H working mode.
After that proceed, S&H output fed into the integrator to generate the reference voltage, compared with the sawtooth signal. As a demonstration of Figure 7:
When Vref > Vsawtooth → PWM generates on mode.
When Vref > Vsawtooth → PWM generates off mode.

PWM controller behavior.
With this operating principle, the MPPT controller regulates the switching device to detect the PV maximum power.
Different from the digital P&O method, the analog MPPT directly tracks the optimized point of PV power with only a small variation instead of moving around three points, as demonstrated in Figure 8.

Tracking mechanism on PV curve.
Design of practical components for MPPT system
Design of R-C circuit
S&H Clock: D = 0.5, fSH = 500 Hz, tSH = 0.002 s, ton = toff = 0.001 s
Discharging time parameters (τ2):
Charging time parameters:
The proposed design is charging time faster than the discharging time five times
Differentiator
In this design, a small value capacitor C2 is connected across the feedback resistor R2, which avoids the differentiator circuit to run into oscillations (that is, become unstable), and a resistor R1 is connected in series with the capacitor C1, which limits the increase in gain to a ratio of R2/R1 (see Figure 9).
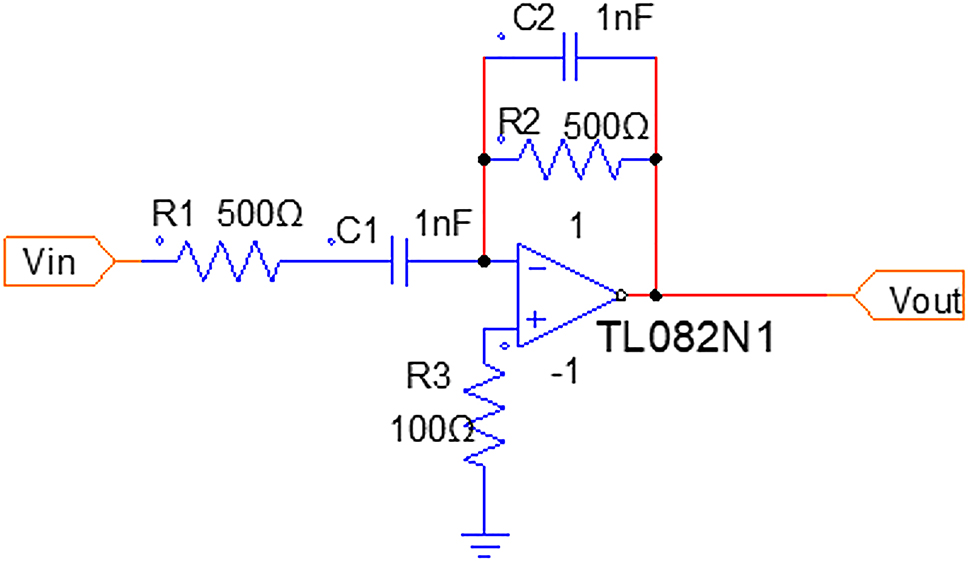
Differentiator design.
Since negative feedback is present through the resistor R, we can apply the virtual ground concept, that is, the voltage at the inverting terminal = voltage at the noninverting terminal = 0.
Call fa as the highest frequency of input signal. Here, we design the differentiator under the operation R1C1 = R2C2 = R2C1 > R1 = R2 and C1 = C2 there occurs one zero at s = 0 and two poles at:
For such a differentiator circuit, the frequency response would be:
Set fa = 319 kHz, The operating frequency is always smaller than fa as a differentiator otherwise, it works as an integrator (see Figure 10).
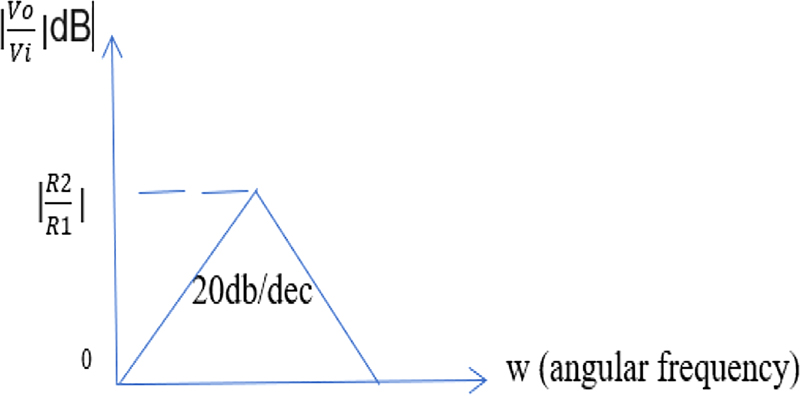
Differentiator characteristics.
Selection: R1 = R2 = 500 Ω, C1 = C2 = 1 nF
Integrator
In this case, Rf is R6 (feedback resistance) (see Figure 11).

Integrator design.
The crossover frequency fb, at which the gain is 0 dB, is given by:
The 3 dB cutoff frequency of the practical circuit is given by
The gain is relatively constant up to the cutoff frequency and decreases by 20 = dB per decade beyond it. The integration operation occurs for frequencies in the range [fa, fb]:
Here we select the high crossover frequency to achieve the fast response with transient. fb = 15,9235 Hz.
Selection: R4 = 10 kΩ, R6 = 20 kΩ
To neglect the effect of the input bias current at the positive terminal of op-amp, it is necessary to set:
R5 = 10 kΩ
Result and analysis
Comparision between two MPPT methods by EN 50530 MPPT efficiencies
In this part, the evaluation of MPPT techniques’ performance was carried out by using the European Efficiency Test, EN 50530, which is specifically devised for the dynamic performance of the PV system. The involved test procedure of CENELEC standard EN 50530 is implemented to test and compare the presented algorithms’ dynamic performance. The standard defines a test procedure for the measurement of MPPT efficiency of the PV systems that simulate a PV generator’s output characteristics. It is readily used for DC-DC converters because the main aim is to evaluate the MPPT algorithm’s performance, rather than conversion efficiency itself. The dynamic MPPT algorithm efficiency is determined by two test sequences of different irradiance levels. Sequence ‘A’ covers the interval from 10 to 50% while sequence ‘B’ covers the irradiance from 30 to 100% of standard test conditions (GSTC = 1000 W/m2/s). The sequences of ramp having slopes ranging from 0.5 W/m2/s up to 100 W/m2/s are utilized.
The dynamic efficiency of MPPT (ηMPPT dyn) is calculated as the ratio of extracted energy and available energy of the procedure within the time during each sequence as below:
where Vpv(t) and Ipv(t) represent the instantaneous voltage and current at the output of the PV simulator. The PMPP(t) represents the available maximum Power of the PV simulator with respect to the instantaneous PMPP. T represents the time duration of the whole sequence. We used the defined procedure to investigate the dynamic MPP tracking efficiency of the three algorithms.
The test will be carried out by sequence A: Low to medium insolation (100–500 W/m2) and sequence B: Medium to high insolation (300–1000 W/m2) like Figures 12 and 13 respectively. The irradiation’s repeating sequence was designed following the standard EN 50530 to test both digital and analog P&O.
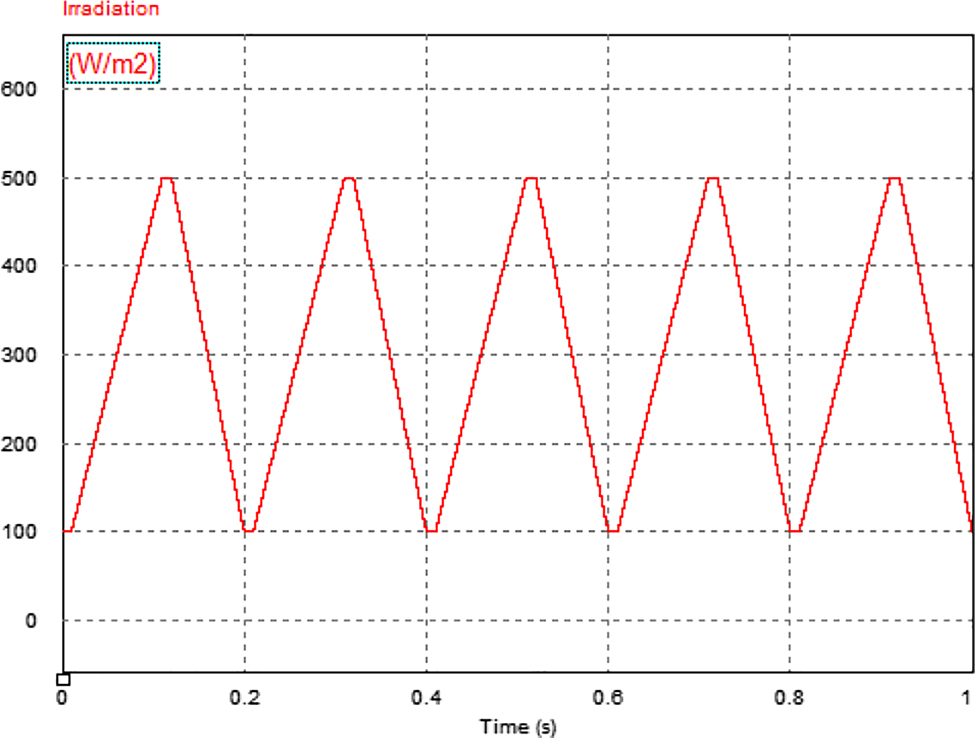
Low to medium insolation irradiation.
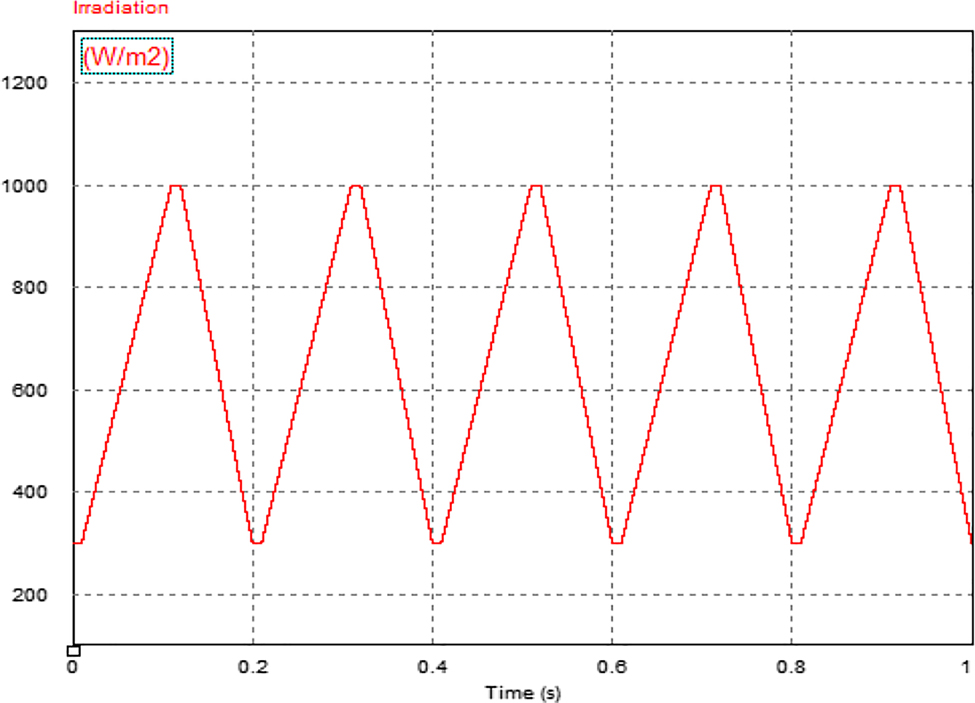
Medium to high insolation irradiation.
Applying the principle of EN 50530, the MPPT efficiencies have been obtained for both Low to Medium insolation and Medium to High insolation. As we can see Table 5, all of two methods work better at Medium to high insolation. For the P&O digital technique, each test for each slope change, a new calculation for the perturbation amplitude was made with respect to the criteria’s formula. The good MPPT efficiency is achieved. The proposed analog technique shows a highly advanced performance with permanent stability and balanced MPPT efficiency at both of two testing sequences thanks to the fast-tracking and response to irradiation variation in the whole system mechanism.
EN 50530 results for two analyzed methods.
| Number of ramps per slop | Slope (W/m2/s) | η Digital MPPT (%) | η Analog MPPT (%) |
|---|---|---|---|
| Sequence ‘A’ (irradiance variation 10 → 50% of GSTC) | |||
| 2 | 0.5 | 98.88 | 99.95 |
| 2 | 1 | 98.85 | 99.95 |
| 3 | 2 | 98.85 | 99.94 |
| 4 | 3 | 98.79 | 99.94 |
| 6 | 5 | 98.81 | 99.94 |
| 8 | 7 | 98.78 | 99.94 |
| 10 | 10 | 98.80 | 99.93 |
| 10 | 14 | 98.79 | 99.92 |
| 10 | 20 | 98.76 | 99.92 |
| 10 | 30 | 98.76 | 99.92 |
| 10 | 50 | 98.74 | 99.89 |
| Sequence ‘B’ (irradiance variation 30 → 100% of GSTC) | |||
| 10 | 10 | 99.09 | 99.99 |
| 10 | 14 | 99.12 | 99.98 |
| 10 | 20 | 99.13 | 99.98 |
| 10 | 30 | 99.11 | 99.98 |
| 10 | 50 | 99.09 | 99.97 |
| 10 | 100 | 99.01 | 99.96 |
Series tests for analog MPPT
Steady state
The standard tests of steady state applied to the analog MPPT with the multiplier. The results indicate an outstanding performance of the MPPT controller with minimal oscillation. The tracking power already achieved the maximum available power from PV panels as shown in s 14 and. This point is an advanced aspect over other methods because other ones only can reach very close to the PV maximum power. Still, this manner attains the absolute value of the panel 52.128 W, precisely the actual power data of the Solbian 52L curve.
Since the tracking power has a very small oscillation, so we had to observe on a narrow scale to see its behavior clearly (see Figures 14 and 15)
1000 W/m2
500 W/m2
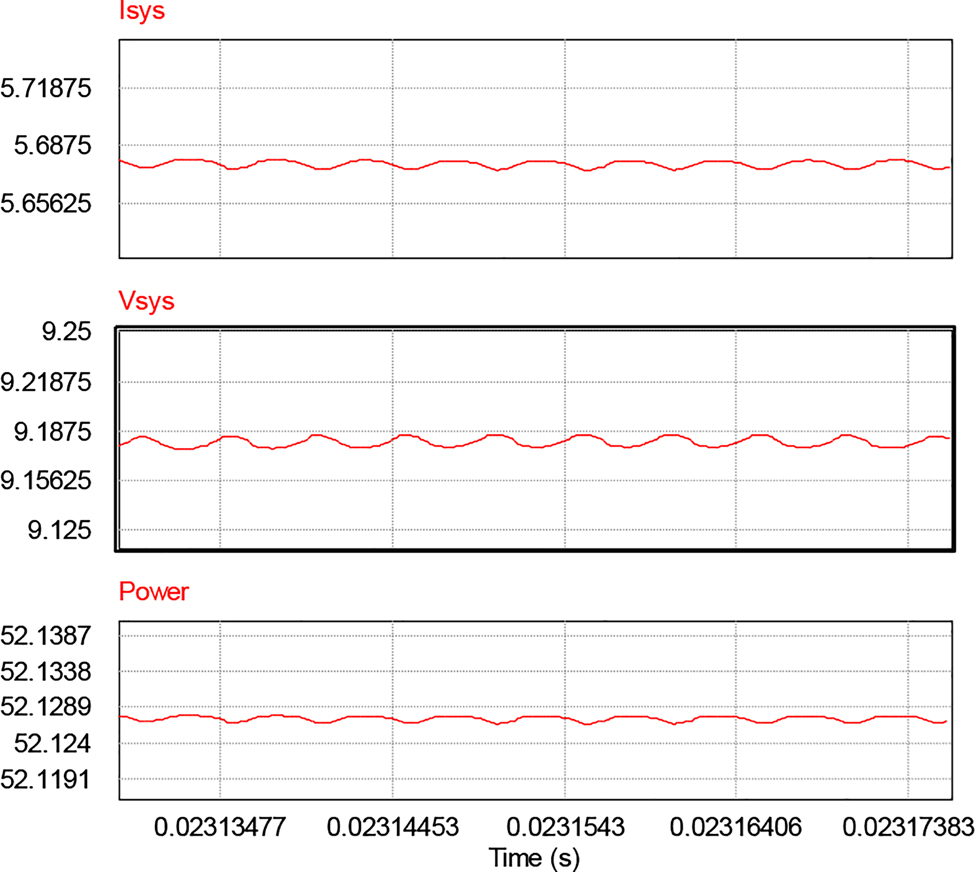
The results of MPPT system at 1000 W/m2.
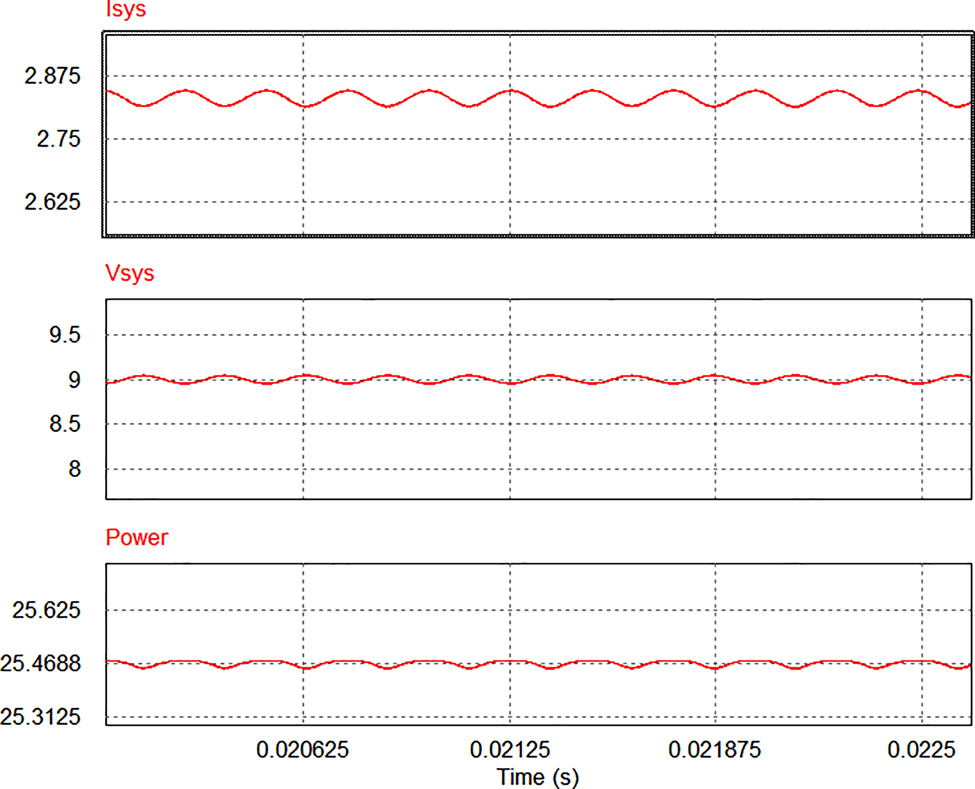
The results of MPPT system at 500 W/m2.
At irradiation 500 W/m2, like the above test, the sinusoidal behavior proceeded during the tracking process, and the MPPT efficiency guaranteed with a tiny swing on the P-V curve. The tracked Power is approximately half of 1000 W/m2 condition that shows the correct operation of the MPPT system.
Irradiation variation
The constant change rate of irradiation
As usual, an irradiation change’s rate of 100 W/m2/s was applied to test the controller’s operation. The rapid evolution of light irradiation requires the fast response of the MPPT controller to the ambient. It is clear to observe in Figure 16 that the tracking trend power moves to correspond to irradiation change. The depreciation of oscillation contributes to the superb efficiency of the whole system.
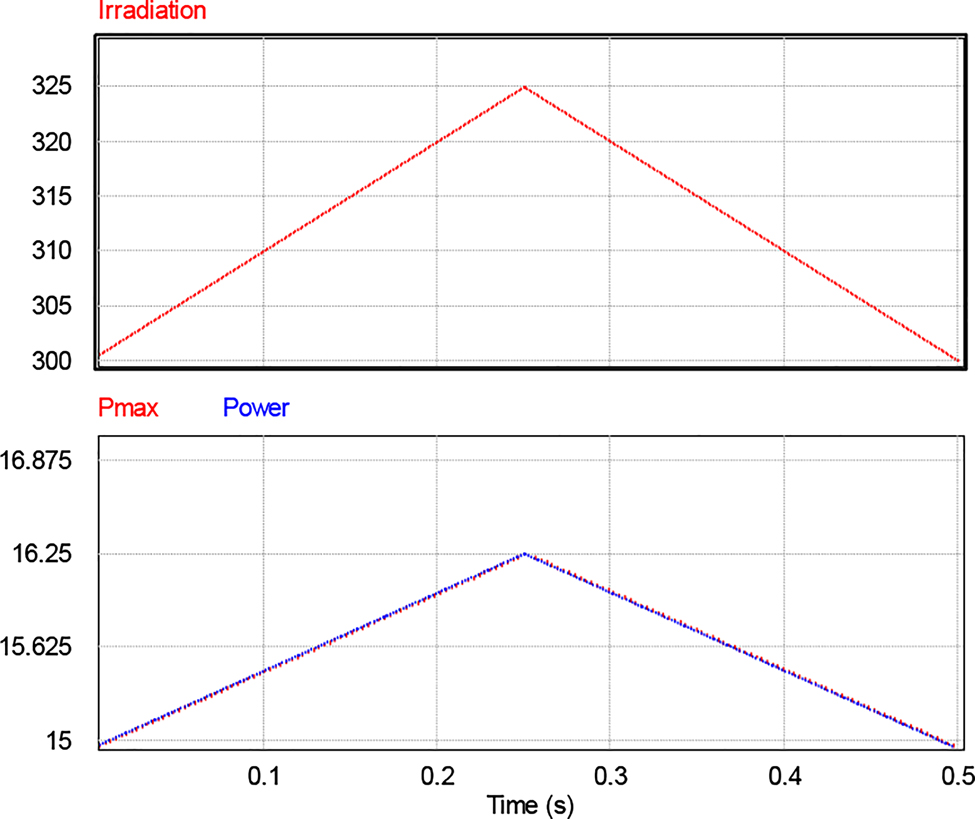
The PV power versus the irradiation variation.
Irradiation transient
Based on the impressive result as above simulations, the transient test with wide range of irradiation level: rising stair (400–5000 W/m2) and falling stair (4000–100 W/m2). This test also examines the maximum range where the system is capable of working on.
Firstly, the stair-up transient is tested as Figure 17, which attains a good MPPT controller performance under this circumstance. The MPPT controller perfectly performs its tracking procedures. Until the irradiation 4000 W/m2, the tracking power starts to fall away from absolute MPP about 2% and continue to move down from MPP at higher irradiation. Thus, this analog MPPT will be applied for the irradiation level at 4000 W/m2 as the maximum limit to accomplish the high efficiency.

PV power versus stair-up transient.
Considering the irradiation limit of stair-up transient, the stair-down transient only transpired from 4000 to 100 W/m2.
Generally, the MPPT controller is well designed for the irradiation variation, as shown in Figure 18. Figure 19 shows the MPPT efficiency at each level of irradiation transient, about 99.99% as average.

PV power versus stair-down transient.
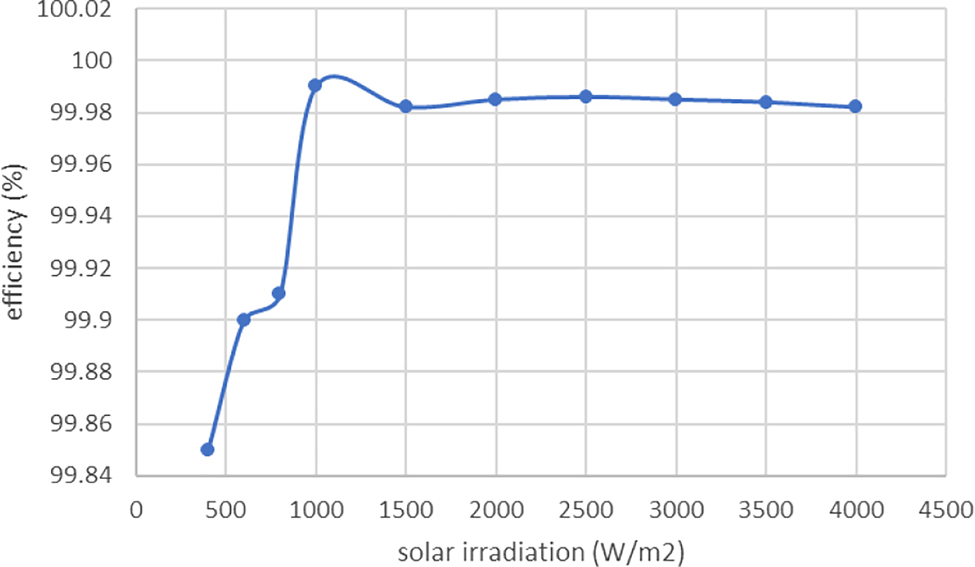
MPPT efficiency at irradiation transient.
Space testing conditions for PV
The panel temperature is computed, considering the direct sun radiation, the albedo radiation, the irradiation to deep space, and irradiation between the earth’s surface and the panel itself. The sun illumination is variable during the year and considering only missions around the planet it may range between 1315.0 (summer solstice) and 1426 W/m2 (winter solstice).
Due to the elliptical path of the earth around the sun, the variation in the earth-sun distance results in about ±3% in the extraterrestrial solar flux. The formula expresses the extraterrestrial solar radiation intensity GSC, which is given by (Lotfy et al. 2017).
All of the tests will be proceeded according to the ratio of extraterrestrial irradiance at normal incidence to solar constant NASA test criteria in (National Aeronautics and Space Administration 1971).
Variation of solar irradiation
High temperature: 107 °C in dry nitrogen gas, or simulated eclipse conditions. The solar irradiations vary from 1315 W/m2 to 1426 W/m2 as demonstrated in Figure 20.
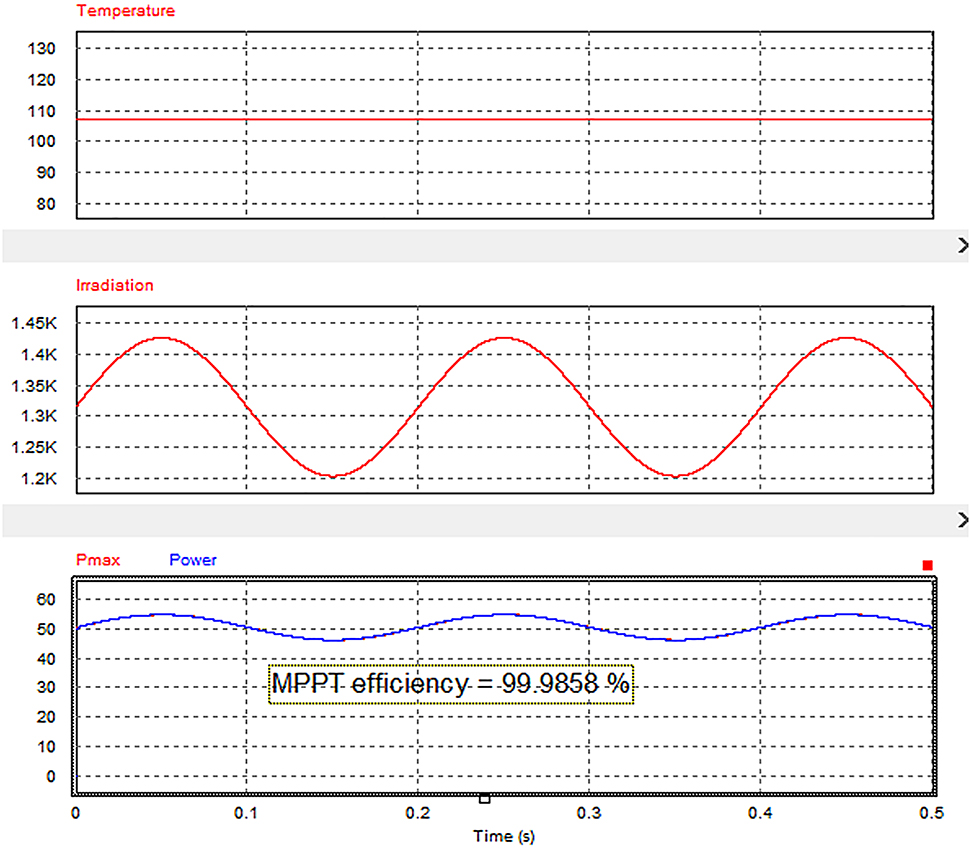
Power at space irradiation variation.
Variation of temperature
Temperature cycling: Five cycles between −55 °C and +125 °C. The minimum solar irradiations on space: 1315 W/m2 as Figure 21.
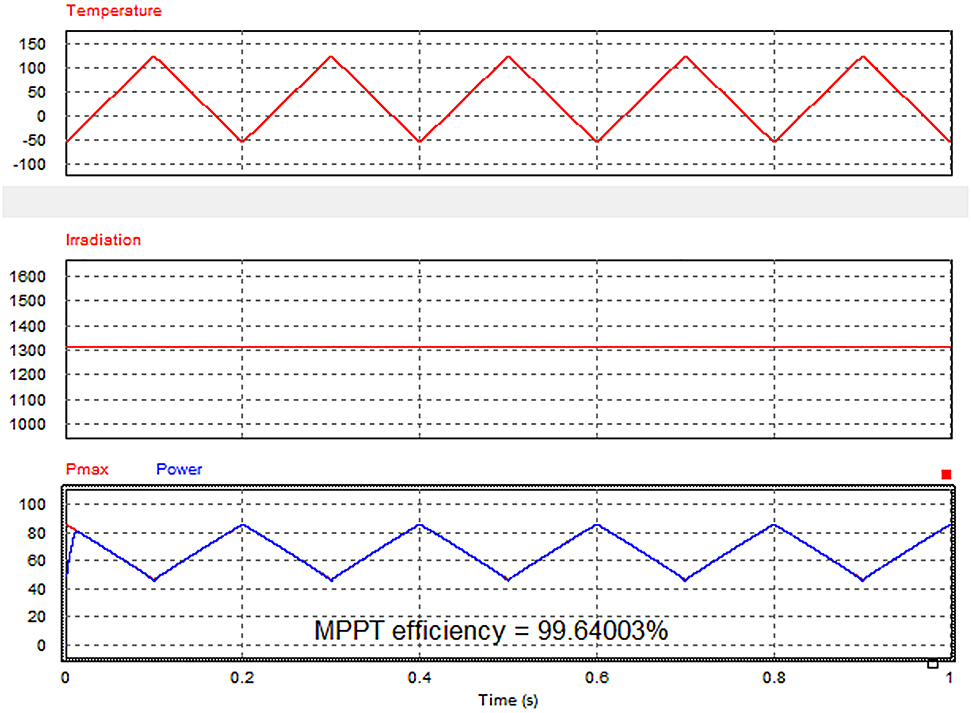
Power at space temperature variation.
Generally, it was evident that this technology successfully attains the high MPPT efficiency at all necessary tests for space conditions.
At first test, at high temperature and irradiation variation, the MPPT controller adjusts its tracking process according to the trend of the irradiation adequately
At the second test, the rapid change of temperature in space does not affect the controller’s performance. Instead of moving far away from the maximum available power of PV source when the temperature approaches its peak point, the tracking trend continues to cling to the PV energy move.
After two tests based on the space environment, the Analog MPPT offers a superb response to the swift variation of temperature as well as irradiation that shows the high potential capability to place this MPPT controller on the satellites.
Conclusion
In this work, the evolution of MPPT method from digital to analog was demonstrated. The proposed MPPT system was designed successfully with significant improvement in power tracking efficiency. Besides, the analog MPPT performance has a good command of working under harsh conditions with fast response to solar irradiation variation and high potential to work in a space environment in an extended range of temperatures, intense solar radiation. With a stable structure system, this analog MPPT is a competitive candidate for PV system optimization in numerous applications.
Funding source: Università degli Studi di Salerno
-
Author contributions: All the authors have accepted responsibility for the entire content of this submitted manuscript and approved submission.
-
Research funding: The study was financially supported by Università degli Studi di Salerno.
-
Conflict of interest statement: The authors declare no conflicts of interest regarding this article.
References
Andrejašič, T., M. Jankovec, and M. Topič. 2011. “Comparison of Direct Maximum Power Point Tracking Algorithms Using EN 50530 Dynamic Test Procedure.” IET Renewable Power Generation 5 (4): 281, https://doi.org/10.1049/iet-rpg.2010.0175.Search in Google Scholar
Cao, G., and H. J. Kim. 2015. “A Novel Analog Maximum Power Point Tracker for Low-Cost and Low-Power Distributed PV Systems.” IEEJ Transactions on Electrical and Electronic Engineering 10 (4): 474–78, https://doi.org/10.1002/tee.22108.Search in Google Scholar
De Matos, J., F. e Silva, and L. Ribeiro. 2014. “Power Control in AC Isolated Microgrids with Renewable Energy Sources and Energy Storage Systems.” IEEE Transactions on Industrial Electronics 62 (6): 3490–8, https://doi.org/10.1109/tie.2014.2367463.Search in Google Scholar
Esram, T., and P. L. Chapman. 2007. “Comparison of Photovoltaic Array Maximum Power Point Tracking Techniques.” IEEE Transactions on Energy Conversion 22 (2): 439–49, https://doi.org/10.1109/tec.2006.874230.Search in Google Scholar
Femia, N. 2013. Power Electronics and Control Techniques for Maximum Energy Harvesting in Photovoltaic Systems. Boca Raton: CRC Press, Taylor & Francis Group.Search in Google Scholar
Irmak, E., M. S. Ayaz, S. G. Gok, and A. B. Sahin. 2014. “A Survey on Public Awareness towards Renewable Energy in Turkey.” In 2014 International Conference on Renewable Energy Research and Application (ICRERA), October. Milwaukee, WI: IEEE, https://doi.org/10.1109/icrera.2014.7016523.Search in Google Scholar
Ishaque, K., and Z. Salam. 2014. “Dynamic Efficiency of Direct Control Based Maximum Power Point Trackers.” In 5th International Conference on Intelligent Systems, Modelling and Simulation, January, https://doi.org/10.1109/isms.2014.79.Search in Google Scholar
Jain, A., R. Mehta, and S. K. Mittal. 2011. “Modeling Impact of Solar Radiation on Site Selection for Solar PV Power Plants in India.” International Journal of Green Energy 8 (4): 486–98, https://doi.org/10.1080/15435075.2011.576293.Search in Google Scholar
Javed, K., H. Ashfaq, and R. Singh. 2019. “A New Simple MPPT Algorithm to Track MPP under Partial Shading for Solar Photovoltaic Systems.” International Journal of Green Energy 17 (1): 48–61, https://doi.org/10.1080/15435075.2019.1686001.Search in Google Scholar
Lekbir, A., M. Meddad, A. Eddiai, S. Benhadouga, and R. Khenfer. 2019. “Higher-Efficiency for Combined Photovoltaic-Thermoelectric Solar Power Generation.” International Journal of Green Energy 16 (5): 371–77, https://doi.org/10.1080/15435075.2019.1567515.Search in Google Scholar
Lotfy, A., W. R. Anis, M. M. A. Atalla, J. V. M. Halim, and M. Abouelatta. 2017. “Design an Optimum PV System for the Satellite Technology Using High Efficiency Solar Cells.” International Journal of Computer Application 168 (3): 6–11, https://doi.org/10.5120/ijca2017914327.Search in Google Scholar
Mai, T., M. M. Hand, S. F. Baldwin, R. H. Wiser, G. L. Brinkman, P. Denholm, D. J. Arent, G. Porro, D. Sandor, D. J. Hostick, M. Milligan, E. A. DeMeo, and M. Bazilian. 2014. “Renewable Electricity Futures for the United States.” IEEE Transactions on Sustainable Energy 5 (2): 372–78, https://doi.org/10.1109/tste.2013.2290472.Search in Google Scholar
Mao, M., L. Zhang, Q. Duan, O. J. K. Oghorada, P. Duan, and B. Hu. 2017. “A Two-Stage Particle Swarm Optimization Algorithm for MPPT of Partially Shaded PV Arrays.” International Journal of Green Energy 14 (8): 694–702, https://doi.org/10.1080/15435075.2017.1324792.Search in Google Scholar
Mhiri, N., A. Alahdal, H. Ghulman, and A. Ammous. 2017. “A Novel Analog Circuit Design for Maximum Power Point Tracking of Photovoltaic Panels.” Advances in Power Electronics 2017: 1–9, https://doi.org/10.1155/2017/9409801.Search in Google Scholar
Molotov, P., A. Vaskov, and M. Tyagunov. 2018. “Modeling Processes in Microgrids with Renewable Energy Sources.” In 2018 International Ural Conference on Green Energy (UralCon), October. Chelyabinsk: IEEE, https://doi.org/10.1109/uralcon.2018.854433.Search in Google Scholar
National Aeronautics and Space Administration. 1971. Nasa Space Vehicle Design Criteria (Guidance and Control). NASA.Search in Google Scholar
Powersim Inc. 2018. PSIM Electronic Simulation Software|Powersim. https://powersimtech.com/ (accessed June 17, 2018).Search in Google Scholar
Sharma, R. S., and P. K. Katti. 2017. “Perturb & Observation MPPT Algorithm for Solar Photovoltaic System.” In 2017 International Conference on Circuit, Power and Computing Technologies (ICCPCT), April. Kollam: IEEE, https://doi.org/10.1109/iccpct.2017.8074191.Search in Google Scholar
Solbian n.c. 2020. SP 52 L. https://www.solbian.eu/en/sp-series/23-sp-52-l.html (accessed January 25, 2020).Search in Google Scholar
Usova, M. A., and V. I. Velkin. 2018. “Possibility to Use Renewable Energy Sources for Increasing the Reliability of the Responsible Energy Consumers on the Enterprise.” In 2018 International Ural Conference on AC Electric Drives (ACED), March. Ekaterinburg: IEEE, https://doi.org/10.1109/aced.2018.834162.Search in Google Scholar
Zhang, J., K. Ding, R. Mei, and Y. Cai. 2018. “Global Maximum Power Point Tracking Method Based on Sorting Particle Swarm Optimizer.” International Journal of Green Energy 15 (13): 821–36, https://doi.org/10.1080/15435075.2018.1529579.Search in Google Scholar
© 2021 Minh Long Hoang, published by De Gruyter, Berlin/Boston
This work is licensed under the Creative Commons Attribution 4.0 International License.
Articles in the same Issue
- Frontmatter
- Research articles
- Design and Analysis of a Hybrid Solar and Vibration Energy Harvester
- Photovoltaic system optimization by new maximum power point tracking (MPPT) models based on analog components under harsh condition
- Piezoelectric energy generation in India: an empirical investigation