Impact of an Economic Crisis on Youth Employment: Evidence from 2008 Financial Crisis in Spain
-
Miguel Á. Martínez-García

 and
Ángeles Cámara
and
Ángeles Cámara

Abstract
This article addresses the impact that the previous economic crisis had on Spanish economy, focusing on the effects on employment. Therefore, the data on the employed population drawn from the economically active population surveys are broken down by age groups, to analyse the 2008 financial crisis. The model created makes it possible to quantify the losses in production and employment in all sectors, highlighting construction, manufacturing, real estate, and professional and administrative activities as the most affected sectors due to the fall in youth employment. The results obtained allow different employment policies to be focused on sectors most affected by the economic crisis and show that crises do not equally affect all works, because younger workers have suffered disproportional job losses.
1 Introduction
Unemployment rates soared worldwide because of the 2008 economic recession. According to the European Union’s official statistics, 17 million people were jobless in the eurozone in 2015, well above the 12 million pre-crisis unemployment rate. Among these workers, almost 6 million had been out of work for more than 24 months (Eurostat, 2021).
The labour market recovered in the eurozone in 2015 with the creation of over 1.5 million jobs and a decrease in the unemployment rate by one percentage point to 10.7% with respect to the previous year (Eurostat, 2021). According to the Organisation for Economic Cooperation and Development (OECD, 2022), Spain, Ireland, Slovakia, Portugal, and Italy experienced the sharpest employment declines during this year.
Falling employment in EU member states after the economic recession was accompanied by the rise in part-time employment, especially in the countries with the highest unemployment rates. Furthermore, fixed-term contracts gained prominence over open-ended employment contracts. Spain, Ireland, Greece, and Italy suffered the most adverse effects of the crisis but experienced a faster acceleration in job creation, while Germany remained stable, and Finland and France had a slight setback (Cuenca Morales, Fernández Vidaurreta, & Martínez Turégano, 2016).
New jobs arose mainly for workers with higher educational attainment, while job losses slowed down among low-educated workers. Older workers kept their jobs as a consequence of delayed retirement, and especially those aged 30–49. According to the (OECD, 2022.), unemployment for young people aged 15–24 years in Eurozone registered a 48.5% in 2015. Meanwhile, a 4.2% of the jobs, on average, were taken by people from outside European Community countries (Cuenca Morales et al., 2016).
During the crisis, the highest employment levels were concentrated in market services, whereas in industry, this concentration slowed down, this sector being highly dependent on exports. In addition, in construction, job losses slowed down after 3 years of losses mainly due to Spain’s recovery, even as the remaining EU countries continued their downward trend (Cuenca Morales et al., 2016).
The effects of the crisis have mainly affected youth employment, hindering access to good full-time jobs so that independence can be achieved (the countries that bore the heaviest losses were Greece, Italy, and Spain). Additionally, a substantial number of young people faces long-term unemployment, have no qualifications, and are at risk of poverty or social exclusion. Many of them becoming “not in education, employment, or training (NEETs) with risk of compromising sustainable long-term economic growth. Therefore, the European Union and its member states approved a project in 2015 to implement a renewed framework for European cooperation in the area of youth (2010–2018) (European Commission, 2015).
The Spanish policies reduce the unemployment rate from 26.1% in 2013 to 22.1% in 2014, based on Eurostat data (NDA). However, Spain continued to be the country with the highest unemployment rates among the OECD countries, particularly youth unemployment, which stood at 52.49% in 2015 (OECD, 2022). This recovery in the unemployment rate was accompanied by GDP growth, which registered a 12.7% cumulative rise from late 2013 to late 2017 even though it was in 2016 that it managed to exceed pre-crisis levels (Bank of Spain, 2019).
According to the 2016 Youth in Spain Report (IJE, 2016), the economic crisis heightened youth inactivity and consequently improved education attainment levels. Regarding the nature of employment lost across industries as in 2008, three sectors that concentrated youth employment during prosperous times exhibited the largest losses due to the crisis. These three sectors were construction, followed by financial activities and manufacturing. Activities related to public administration, and professional, scientific, and technical activities also experienced major falls. In fact, after the economic crisis, 2.2 million young jobs were shed, and 1.3 million jobs were concentrated in the first mentioned three sectors. On the other hand, top employers for young people were, in this order, trade, hotel and restaurant services, and manufacturing
Even though employment rates have grown as from the end of the crisis, youth employment, poverty and inequalities are still a challenge (Rodríguez-Modroño, 2019). Hence, the crisis worsened the structural precariousness of the work that produced mostly part-time contracts with reduced purchasing power as a consequence of the salary earned.
The rise in temporary contracts, peaking by the end of 2014, alongside the collapse in annual income from 2008 heightened the inequalities in income distribution among young people (Úbeda, Cabasés, Sabaté, & Strecker, 2020).
Another circumstance to be analysed regarding youth employment is the decision to flee Spain in search of other employment. Given Spain’s precarious labour market and the refusal to be underemployed, young graduates under 29 emigrate to advance their careers (Holleran, 2019; Mendoza, Ortiz, & Oliveras, 2020). Some motivating factors for emigration are age, marital status, education, and job satisfaction in terms of salary and future prospects (Bartolini, Gropas, & Triandafyllidou, 2017).
This study performs a descriptive analysis of employment in 2005 (pre-crisis) and 2015 (post-crisis), breaking down workers by age, to quantify the impact of the 2008 crisis on young workers. The purpose of this study following the quantification of such an impact is to calculate the impact of the fall in youth employment in the productive sectors. This study will also contribute toward identifying the sectors with the top highs and lows in employment, to address the need to adopt economic policies in order to help these sectors as well as provide young people with information to help adapt unemployed persons to new market demands.
2 Literature Review
In 2012, the International Labour Organisation (ILO, 2012) published the document The youth employment crisis: A call for action, calling for immediate, specific, and renewed action to address the youth employment crisis. Subsequently, the ILO published a compilation of contributions from the Youth Employment Program detailing the policies that enable young people to find decent work (O’Higgins, 2017). The impacts of a wide range of interventions are considered, including fiscal, sectorial development policies, minimum wages, and active labour market programs.
Within the EU, Spain and Italy show the highest levels of young people who neither study nor work (NEETs). De Luca, Mazzocchi, Quintano, and Rocca (2020) make a comparison of the “NEETs” between Spain and Italy, highlighting that in Italy there is a greater influence of early school leavers, so they should focus their policies on the educational system. They conclude by highlighting the need to invest more in education and to adopt measures capable of keeping more young people in education for a prolonged period of time.
Avagianou, Kapitsinis, Papageorgiou, Strand, and Gialis (2022) analysed youth unemployment and precariousness, confirming that, in a context of precariousness and youth labour inequality (between 2008 and 2018), the high number of young people in southern Europe who neither study nor work (NEETs) is due to factors such as gender, class, education, and economic growth. They critically analyse the economic, social, and political factors that determine the dynamic relationship between young people and the labour market and discuss the persistently high rate of NEETs in the south of the EU.
Arestis, Ferreiro, and Gómez (2020) address the need for employment protection and its effects on temporary and permanent employment, and state that the reforms implemented in Europe focusing on making labour markets more flexible have not generated greater growth in employment, but a greater labour segmentation accelerating a greater number of temporary contracts as opposed to permanent ones. Therefore, since greater deregulation in the labour market is not correlated with a reduction in the unemployment rate, economic policies focused on increasing aggregate and investment demand should be applied (Liotti & D’Isanto, 2021).
However, some authors (Marques & Hörisch, 2019) claim that the labour policies applied in Spain and supported by the European Youth Guarantee were inadequate as they weakened employment protection and reduced coordination in setting salaries by reducing collective bargaining coverage. Furthermore, the working status did not change considerably for the unemployed population, and professional education was not improved after the crisis. Therefore, the strategy that fuelled work-based training failed to meet expectations.
Therefore, youth entrepreneurship as an option to enhance labour conditions or comprise the labour market is a policy recommended by the European Commission and the Spanish government, but we should also consider the precariousness, debts, and failure, as indicated by a research study that introduces the concepts of “emperdedor,” “emprendeudor,” and “emprecario” (puns in Spanish created using the aforementioned words and “entrepreneur”) (Santamaría López & Carbajo Padilla, 2019). However, Vancea and Utze (2017) assert that youth unemployment and precarious labour conditions are not determining factors for them to become self-employed workers.
Pastore (2015) focused on the youth employment situation in Italy, analysing how the European Youth Guarantee program should be implemented in Italy and proposed investments in education, research, development, and innovation. He concluded that jobs created through structural reforms would be additional, not substitutes to existing jobs.
Even though multiple papers have been published over the past few years about unemployment caused by the economic crisis, this article broadens the analysis of the entire productive structure of the Spanish economy using the input-output (IO) model. We detail below the main articles focused on employment in relation to both the Spanish and international economy, using the IO model.
Bermejo, Febrero, and Avelino (2020) assert that the number of jobs, mainly in the service sector, is fed by pensioners’ rising consumption. Moreover, the influence of tourism-related activities over the other sectors prevails during periods of crisis as that experienced in 2008, heightening its precariousness and seasonality and making labour reforms more noticeable in the tourism market (García-López, Campoy-Muñoz, Cardenete-Flores, & Marchena-Gómez, 2018).
Barba and Iraizoz (2020) employ the IO method at European level in relation to the service sector to trace the evolution of female employment in the European Union from 2008 to 2018, confirming that the changes in production and final demand offer more employment opportunities for the service sector, such as research, education, and health, among other personal services. In contrast, the boost in productivity triggered by technological change reduces female employability. Moreover, Bolea, Duarte, and Sánchez Chóliz (2018) analysed the increase in income and the convergence between European countries during the 2000–2014 period from a technological standpoint and stated that the economic growth of EU countries after the 2008 crisis was conditioned by the knowledge-intensive service sector.
This study is divided into seven sections: after the introduction and review of the latest literature on the subject matter, Section 3 explains the method used and provides the data sources. Section 4 describes and compares the employment structures of each age group analysed, to supplement and facilitate understanding of the results. Section 5 outlines the previous analysis of youth employment status and introduces the data to be modelled. Section 6 discloses the outcomes of the modelling indicating the economic effects on each productive sector of youth joblessness. Section 7 sets out the most important conclusions, to understand the economic impact of the job destruction caused by a crisis such as the 2008 crisis.
3 Methodology
To adjust this analysis to the characteristics of the phenomenon under study and considering the nature of the aggregated statistical information used, an IO model was chosen because of its capacity to explain the pursued objectives. IO models, due to their capacity to describe, explain, and analyse the economy, have become a vital tool for economic analyses. Moreover, the current Spanish accounting systems have developed and become widespread among most economies, providing basic, valuable information on the economic status of a country or region.
Adopting this method (Miller & Blair, 2022), we will analyse the economic impact of job losses for young people during the economic crisis that began in 2008, by performing an IO model employing the input-output tables (IOT) published by the NSI (2018). As the shock is presented as a variation in the number of persons employed, we do not apply the demand-driven model (Leontief model) but rather the supply-driven model (Ghosh model). The latter is used to model changes in primary inputs or primary productive factors; therefore, it is appropriate to model the changes in employment (and sector distribution) inherent in the model made.
In an IOT, we can distinguish the intermediate consumption matrix, the primary factor matrix, and the final demand matrix. Each column of the intermediate consumption matrix shows the intermediate products used by each sector to carry out its productive activity. In turn, the primary factor matrix contains value added taxes and imports by each sector. Thus, the production of each sector is obtained linearly from the intermediate consumption of the other sectors and the primary factors of that sector.
Gross output in sector j(
where
The construction of IOTs with equal sums in rows and columns allows the setting of a model alternative to the demand-driven model, where coefficients are determined horizontally (distribution coefficients) instead of vertically (technical coefficients). In this alternative model, the exogenous variable is the value added rather than the final demand. This supply-side model is obtained from a new matrix, known as a “distribution matrix,” calculated by using the relationships of the IOT’s columns.
To do this, the distribution coefficients
Thus, we can build the following matrix equation
where
Solving the equation for the vector of total outputs
Each coefficient of the distribution matrix shows the proportion of resources, in monetary terms, that each sector of the ith row employs, and that is destined to each of the other sectors or to the final demand.
Thus, the value obtained from adding the rows of the inverse distribution coefficient matrix will show the contribution of each sector so that the primary input increases by a unit, which is why it is known as the supply multiplier.
Similarly, adding the columns of the distribution coefficients indicates the change in output when there is a variation in one unit in the supply (primary input) of each sector of the IOT.
Once the impact of the modifications in the primary inputs (w) on total production (
The Ghosh model is based on the assumption of fixed distribution of output, an assumption that implies that the proportion of output allocated to different consumers is constant (for a more detailed analysis see Guerra and Sancho (2011)). However, despite the criticisms it has received, there is consensus when it comes to justifying its use as an instrument to carry out comparative studies and for the identification of key sectors and intersectoral relations (Lenzen, 2003).
We use the data for 2005 and 2015 because the former, still a period of economic prosperity, may be considered the pre-crisis level, whereas the latter is considered the post-crisis level. To this end, the databases used are the symmetric IOTs for 2005 and 2015, published by the NSI. The Classification of Products by Activity (CPA) gathers 73 and 64 activities or productive sectors, for the 2 years, respectively. To match the productive sectors used with the data on the number of employed persons, both tables were aggregated to 15 productive sectors (Table 1).
Productive sectors from the IOTs
| A | Agriculture, forestry, and fishing |
| B | Mining and quarrying |
| C | Manufacturing |
| DE | Electricity, gas, steam, and air conditioning supply/water supply; sewerage, waste management, and remediation activities |
| F | Construction |
| G | Wholesale and retail trade; repair of motor vehicles and motorcycles |
| HJ | Transportation and storage/information and communication |
| I | Accommodation and food service activities |
| K | Financial and insurance activities |
| LMN | Real estate activities/professional, scientific, and technical activities/administrative and support service activities |
| O | Public administration and defence; compulsory social security |
| P | Education |
| Q | Human health and social work activities |
| RS | Arts, entertainment, and recreation/Other service activities |
| T | Activities of households as employers; undifferentiated goods- and services-producing activities of households for own use |
Source: EUROSTAT: Statistical classification of economic activities in the European Community NACE Rev.2 (adjusted to the CPA).
The disaggregated data on the number of annual jobs are obtained from the number of people employed by age and productive sector. These data are drawn from the Spanish Labour Force Survey (SLFS) (NSI, 2018) prepared by the NSI, which breaks down the number of employed persons by activity for the benchmark period. These data offer different groups for the 2 years analysed; hence, they were homogenised by consolidating productive activities for 2015 with the number of activities for 2005, previously aggregated in 15 activities.
The number of employed persons derived from the SLFS matches the numbers detailed in the IOTs; hence, we broke down the jobs within each activity by age in the IOTs as provided by SLFS (NSI, 2022).
The symmetric IOTs used as the basis for our work were aggregated to 15 activities (Table 1), according to the European Community CPA (CPA, 2005, 2015).
Once the databases were prepared, the modelling made is used to quantify the economic impact of Spain’s 2008–2014 economic crisis on the young workers and its effects on the productive sectors (Table 1). To this end, we simulate that the number of jobs filled by the young population is the same in 2015 as that in 2005. We thus obtain a no-crisis scenario, where youth employment would not be affected by the economic crisis. This simulation transforms this increasing employment in a wage growth in all sectors. The model designed allows us to measure the impact of higher compensation of employees in terms of the increase in production (equation (3)) and employment (equation (4)) across Spain’s economic sectors.
The results obtained in this work depict a hypothetical scenario of Spain’s economy in 2015 in the case that no jobs were lost for young people due to economic crisis. The value added of this study is that it differentiates the impact on the young population and that it quantifies the overall economic cost of this job destruction.
4 Descriptive and Comparative Analysis of Employment Distribution
Before introducing the results obtained from the modelling, we should conduct a descriptive and comparative analysis of the share of Spanish employment broken down by age group in 2005 and 2015. The charts included show the differences in employment in Spain before and after the 2008 crisis broken down by age group and activity. This analysis will facilitate the understanding of the modelling results, and the subsequent interpretation of the economic consequences of falling employment caused by the 2008 crisis.
4.1 Total Employment Distribution
Employment distribution across economic sectors differs in 2005 and 2015. The employment rates per productive sector for 2005 and 2015 are shown in Figure 1, showing the differences between both periods.
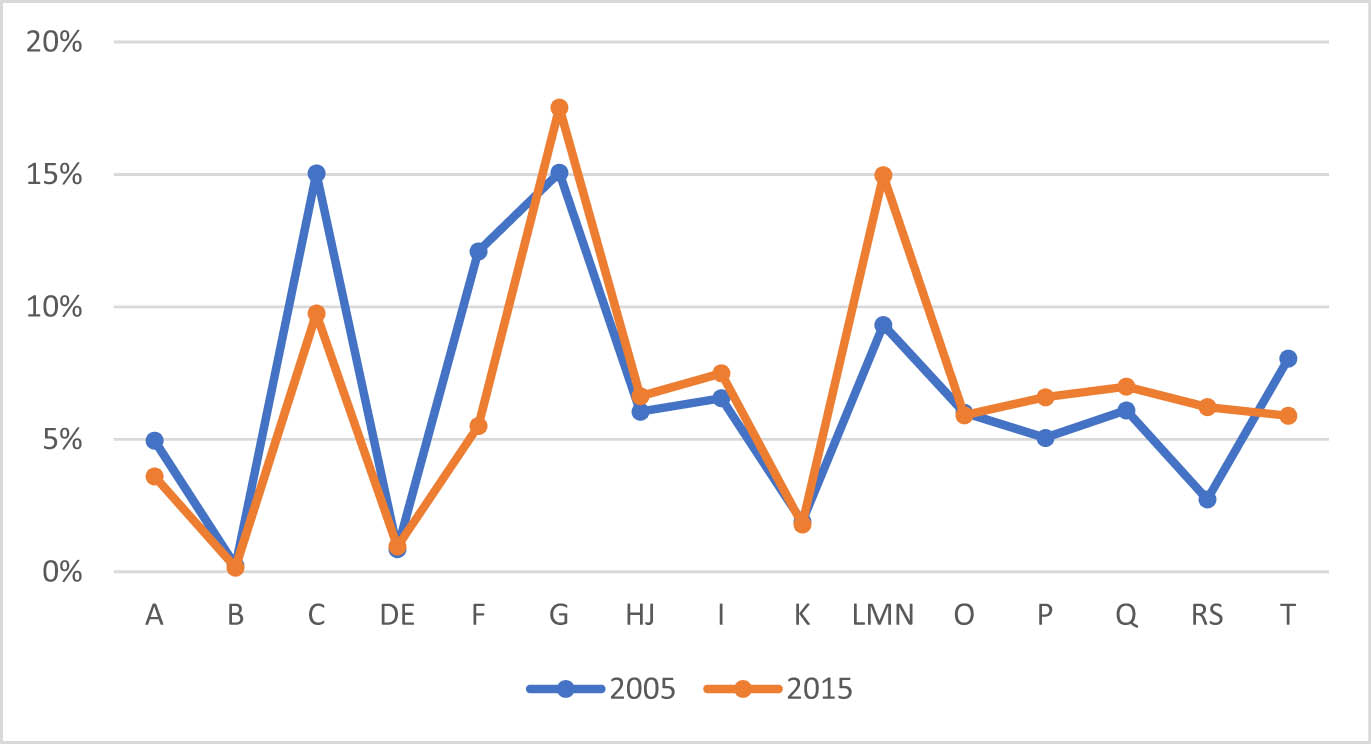
Total employment distribution (percentages). Source: Compiled by author based on the IOTs for 2005 and 2015.
Employment rates differ in both periods per productive sector. Specifically, employment grew by 5.7% in real estate activities; professional, scientific, and technical activities; and administrative and support service activities (LMN), followed by 3.5% employment growth in arts, entertainment, and recreation, and other service activities (RS). Although to a lower extent, employment also increased in wholesale and retail trade and repair of motor vehicles and motorcycles (G) and Education (P) grew by 2.5 and 1.5%, respectively.
The sectors that exhibited the largest reduction in employment were construction (F) and manufacturing (C), down by 6.6 and 5.3%, respectively, from 2005. They were followed by activities of households as employers and undifferentiated goods- and services-producing activities of private households for own use (T) and agriculture, forestry, and fishing (A), decreasing by 2.2 and 1.3%, respectively.
The different changes in employment based on the workers’ age demand an analysis of each age group considered. The employment structures detailed below will identify differences in the distribution of employment among the Spanish population in the different productive sectors (Figure 2).

Employment distribution among age groups (percentages). Source: compiled by author.
4.2 Employment Distribution Among Age Groups
Construction (F) displayed the most pronounced variation for the group aged 16–29: 10.7% going from 14.5 to 3.9%. This is followed by a 7.6% fall in employment in manufacturing (C), from 15.7 to 8.1%. Then, activities of households as employers; undifferentiated goods- and services-producing activities of households for own use (T) fell by 2.4%, from 7.3 to 4.9%.
By contrast, a large increase in employment was experienced in four sectors. The first being employment in arts, entertainment, and recreation, and other service activities (RS), which increased from 3.4 to 8.9%. Then, accommodation and food service activities increased from 8.2 to 13.2%. Finally, wholesale and retail trade and repair of motor vehicles and motorcycles (G); and real estate activities; professional, scientific, and technical activities; and administrative and support service activities (LMN) increased by 22.4 and 13.3%, from 18.5 and 9.6%, respectively.
As regards the 30–49 age group in 2015, the largest fall in employment was in construction (F) with a fall of 5.6% with respect to 2005, followed by manufacturing (C) and activities of households as employers and undifferentiated goods- and services-producing activities of households for own use (T), down by 4.1 and 2.4%, respectively. In other words, employment in sectors F, C, and T stood at 11.7, 14.6, and 7.9%, respectively, in 2005, and sank to 6.1, 10.6, and 5.5% in 2015.
Moreover, employment in real estate activities; professional, scientific, and technical activities; and administrative and support service activities (LMN); wholesale and retail trade; repair of motor vehicles and motorcycles (G); and arts, entertainment, and recreation; and other service activities (RS) increased by 5.4, 3.5, and 3.4%, respectively. That is to say, employment in sectors LMN, G, and RS went up from 10.1, 14.2, and 2.6% in 2005 to 15.5, 17.7, and 6% in 2015, respectively.
In 2015, employment for people aged 50–64 rose in most sectors, and fell only in a few sectors. It mainly slipped in manufacturing (C) and construction (F), from 15.6 and 10.4% in 2005 to 12 and 6.9% in 2015, respectively. In other words, it fell by 3.6 and 3.5%, respectively. To a lesser extent, employment in agriculture, forestry, and fishing (A); and activities of households as employers; undifferentiated goods- and services-producing activities of households for own use (T) went down from 7.4 and 9.1% in 2005 to 4.4 and 7.1%, respectively, accounting for 2.9 and 2.1% falls, respectively.
In terms of the sectors where employment rose, real estate activities; professional, scientific, and technical activities; and administrative and support service activities (LMN) grew by 7.6% with respect to 2005; followed by arts, entertainment, and recreation; and other service activities (RS); and wholesale and retail trade and repair of motor vehicles and motorcycles (G), which went up by 3.1 and 1.8%, respectively. That is to say, they increased from 6.9, 2.2, and 13% to 14.5, 5.3, and 14.8%, respectively.
Finally, some sectors among the group aged over 65 remained stable. In contrast, the structure shown showed that sector agriculture, forestry, and fishing (A) shrank from 20.5% in 2005 to 6.7% in 2015, down by 13.8%. Employment in sectors activities of households as employers; undifferentiated goods- and services-producing activities of households for own use (T), and manufacturing (C) also fell from 12.5 and 8.2% in 2005 to 9.9 and 5.9% in 2015, respectively, representing losses of 2.7 and 2.3%, respectively.
Employment grew the most in Real estate activities; professional, scientific, and technical activities; and administrative and support service activities (LMN), by 8.2%, followed by accommodation and food service activities (I) by 3.2% and education (P) by 2.7%.
After having analysed the changes in employment per productive sector and age group in the benchmark years, the following section tackles the preparation of the data needed to obtain the modelling results.
5 Youth Employment in the Period 2005–2015
This article measures the impact of the economic crisis through its effects on employment measured as changes in compensation of employees; therefore, we need to examine employment and salaries of different age groups per productive sector. Table 2 below shows the share of workers in the labour market per age group during the benchmark years as well as the changes during this period.
Changes in employment per age group during the 2005–2015 period (stated in thousands of jobs)
| Population | 2005 | 2015 | Variation (%) |
|---|---|---|---|
| 16–29 | 5083.9 | 2610.5 | −48.65 |
| 30–49 | 11026.2 | 11284.9 | 2.35 |
| 50–64 | 3856.5 | 5209.0 | 35.07 |
| Over 65 | 149.7 | 168.7 | 12.73 |
| Total | 20116.3 | 19273.2 | −4.19 |
Source: Compiled by author based on the IOTs for 2005 and 2015, and the NSI.
There were 19,273,000 occupied positions in Spain in 2015, as compared to the 20,116,300 jobs filled in 2005, accounting for a 4.19% loss of total employment. The only group affected by the fall in employment were young persons aged 16–29, with a 48.65% loss in jobs. Job positions increased for the remainder groups, especially those aged between 50 and 65, up by 35.07%, whereas people between 30 and 49 recorded a slight rise of 2.35%. There was also a 12.73% expansion in employment for workers over 65, but it is immaterial considering the reduced weight of this population (Table 3).
Variation in employment by age and productive sector during the 2005–2015 period
| Sectors | 16–29 (%) | 30–49 (%) | 50–64 (%) | Over 65 (%) |
|---|---|---|---|---|
| A | −50.1 | −27.2 | −18.7 | −63.1 |
| B | −79.3 | −14.5 | −27.7 | −100.0 |
| C | −73.5 | −26.0 | −23.1 | −19.2 |
| DE | -49.4 | 23.4 | 32.1 | −52.2 |
| F | −86.3 | −46.6 | −33.6 | −4.7 |
| G | −37.9 | 27.7 | 53.4 | 11.0 |
| HJ | −42.8 | 13.2 | 31.6 | 4.5 |
| I | −17.2 | 13.2 | 48.0 | 99.5 |
| K | −70.5 | 10.0 | 9.0 | 121.5 |
| LMN | −28.8 | 57.8 | 184.1 | 171.4 |
| O | −58.5 | −20.2 | 63.0 | 16.0 |
| P | −19.5 | 18.8 | 68.7 | 76.9 |
| Q | −31.3 | 2.2 | 66.3 | 8.5 |
| RS | 36.1 | 135.9 | 220.5 | 99.8 |
| T | −65.5 | −29.1 | 4.2 | −11.4 |
| Total | −48.65 | 2.35 | 35.07 | 12.73 |
Source: Compiled by author.
Bold type indicates highest values.
Youth unemployment amounting to 48.65% during the benchmark years has been caused by the fall in employment in almost all sectors. The most impacted sectors were construction (F), mining and quarrying (B), manufacturing (C), and financial and insurance activities (K). Arts, entertainment, and recreation; and other service activities (RS) was the only sector that recorded a 36.1% expansion, which also demonstrated a marked increase in the remainder age groups.
Employment also thrived in real estate activities; professional, scientific, and technical activities; administrative and support service activities (LMN) in the remaining age groups, with a 57.8% rise for the group aged 30–49, and over 100% for those aged over 49.
Once the jobs lost by young workers are known, this variation is expressed in terms of the remuneration received, obtaining the following table (Table 4) that shows the jobs and wages of the reference years for each productive sector.
Variation in employment and compensation of young employees aged 16–29 per productive sector in the 2005−2015 period (stated in thousands of jobs and millions of euros)
| Sectors | Employment in 2005 | Employment in 2015 | Variation | Compensation in 2005 | Compensation in 2015 | Variation |
|---|---|---|---|---|---|---|
| A | 192.1 | 95.9 | −96.2 | 976.2 | 598.2 | −378.0 |
| B | 9.3 | 1.9 | −7.4 | 263.5 | 68.4 | −195.1 |
| C | 796.3 | 210.7 | −585.5 | 19369.9 | 7168.4 | −12201.5 |
| DE | 42.0 | 21.2 | −20.8 | 1394.0 | 1132.0 | −262.0 |
| F | 739.0 | 101.2 | −637.8 | 16224.7 | 2985.6 | −13239.0 |
| G | 940.9 | 584.2 | −356.7 | 14824.0 | 12456.0 | −2368.0 |
| HJ | 251.7 | 143.9 | −107.7 | 5803.0 | 5333.4 | −469.7 |
| I | 416.7 | 345.1 | −71.6 | 8017.8 | 7721.0 | −296.8 |
| K | 91.7 | 27.0 | −64.6 | 4514.5 | 1531.5 | −2983.1 |
| LMN | 488.3 | 347.9 | −140.4 | 11613.5 | 8548.6 | −3064.9 |
| O | 162.3 | 67.4 | −94.9 | 4813.9 | 2318.9 | −2495.0 |
| P | 169.4 | 136.3 | −33.0 | 5532.1 | 4885.1 | −647.0 |
| Q | 244.2 | 167.9 | −76.3 | 7283.0 | 6111.7 | −1171.2 |
| RS | 170.8 | 232.5 | 61.6 | 3793.5 | 3661.1 | −132.4 |
| T | 369.3 | 127.3 | −242.0 | 2152.3 | 1040.3 | −1112.0 |
| Total | 5083.9 | 2610.5 | −2473.4 | 106575.8 | 65560.2 | −41015.6 |
Source: Compiled by author.
Once the compensation of employees’ variation is obtained, the following section models the impact of this reduction in compensation caused by the loss of employment for people aged between 16 and 29 both on output and employment in the different sectors of the Spanish economy.
6 Modelling Results
Applying a supply-driven model (Ghosh model), this section estimates that youth employment rates remained at the same level in 2015 as in 2005 getting the effects on each productive sector of Spain’s economy.
This boost in employment will increase compensation of employees and, as a result, production and employment in the productive sectors. The difference between actual and simulated production will help us quantify the economic cost of this job loss in the different sectors of Spain’s economy. Similarly, the difference between the actual and simulated number of employees also shows the impact on employment in each productive sector.
The effect of higher compensation of employees among young people aged 16–29 for the benchmark years is negligible since the change in the group’s CPI does not affect the percentages obtained in this age group.
First, we describe the impacts of fall in youth employment on the output of the different productive sectors to detect the most vulnerable groups due to greater production loss. We then outline the effects on employment in each productive sector caused by youth unemployment.
6.1 Impact on Output of Shrinking Employment for Young People Aged 16–29
Below are the modelling results focused on the aftermath of the crisis on the Spanish group aged 16–29. Through the modelling made we managed to quantify the economic impact of falling employment in Spain’s youth after the 2008 economic crisis. This impact was calculated for each productive sector of Spain’s economy classified according to the European Classification of Economic Activities NACE (Table 1) and grouped into 15 productive sectors.
Based on equation (3) in Section 2, Table 5 shows the economic impact on the production of the productive sectors resulting from the difference between the actual output (Output 2015) and simulated output (New Output).
Impact on output of shrinking employment for people aged 16–29 (stated in millions of euros)
| Sectors | Output 2015 | Simulated output | Loss of output | Variation (%) |
|---|---|---|---|---|
| A | 60562.8 | 61510.9 | 948.1 | 1.5 |
| B | 39242.1 | 39512.2 | 270.1 | 0.7 |
| C | 749910.4 | 771892.4 | 21982.0 | 2.8 |
| DE | 108712.5 | 110409.3 | 1696.8 | 1.5 |
| F | 145857.3 | 163861.9 | 18004.6 | 11.0 |
| G | 206035.4 | 210340.7 | 4305.3 | 2.0 |
| HJ | 207126.9 | 209537.1 | 2410.2 | 1.2 |
| I | 113487.3 | 114974.2 | 1486.9 | 1.3 |
| K | 72016.0 | 76010.6 | 3994.6 | 5.3 |
| LMN | 347156.5 | 352866.6 | 5710.1 | 1.6 |
| O | 69779.0 | 72697.6 | 2918.6 | 4.0 |
| P | 58871.0 | 59724.8 | 853.8 | 1.4 |
| Q | 95836.5 | 97871.1 | 2034.6 | 2.1 |
| RS | 57495.3 | 58053.1 | 557.8 | 1.0 |
| T | 9277.0 | 10389.0 | 1112.0 | 10.7 |
| Total | 2341.366.0 | 2409.651.4 | 68285.4 | 2.8 |
Source: Compiled by author.
Bold type indicates highest values.
As shown in Table 5, the economic impact of youth unemployment was negative, pushing up losses to about EUR 68,285 million due to dwindling output across productive sectors with respect to production in a no crisis scenario. This impact represents the economic cost in production across productive sectors and accounts for a 2.8% fall.
Impact on total employment (stated in thousands of persons)
| Sectors | Employment in 2015 | Simulated employment | Jobs lost |
|---|---|---|---|
| A | 652.2 | 662.41 | 10.210 |
| B | 29.9 | 30.11 | 0.206 |
| C | 1871.5 | 1926.36 | 54.859 |
| DE | 184.9 | 187.79 | 2.886 |
| F | 1025.4 | 1151.98 | 126.575 |
| G | 3093.4 | 3158.04 | 64.640 |
| HJ | 1223.8 | 1238.04 | 14.241 |
| I | 1210.0 | 1225.85 | 15.854 |
| K | 332.6 | 351.05 | 18.449 |
| LMN | 2490.6 | 2531.57 | 40.966 |
| O | 1108.9 | 1155.28 | 46.382 |
| P | 1095.7 | 1111.59 | 15.890 |
| Q | 1217.9 | 1243.76 | 25.855 |
| RS | 1025.8 | 1035.75 | 9.952 |
| T | 374.9 | 419.82 | 44.936 |
| TOTAL | 16937.5 | 17429.4 | 491.899 |
Source: Compiled by author.
Bold type indicates highest values.
In absolute terms, manufacturing (C) and construction (F) experienced the largest falls in production, with losses standing at EUR 21,982 million and about EUR 18,004 million, respectively. The remainder sectors, to a lesser extent, also recorded falling production, especially in real estate activities; professional, scientific, and technical activities; and administrative and support service activities (LMN); wholesale and retail trade (G); and financial and insurance activities (K) carrying losses of about EUR 5,710 million; about EUR 4,305 million; and about EUR 3,994 million, respectively.
In relative terms, construction (F) and activities of households as employers (T) experienced the most substantial falls, down by 11% and 10.7%, respectively. These sectors were followed by financial and insurance activities (K), and public administration and defence; compulsory social security (O), with a negative variation of 5.3% and 4%, respectively.
6.2 Impact of Declining Youth Employment on Total Employment
Adopting the same simulation, that is, modelling that no youth jobs were lost during the 2008 crisis and using equation (4) in Section 2, we calculated the impact on total employment caused by job losses for young people. This impact is shown in the following table (Table 6) and is obtained from the difference between actual employment in 2015 and simulated employment from the modelling, disclosing the cost for Spain’s economy in terms of jobs lost in each productive sector.
Because of this loss in youth employment, total employment plummeted across the sectors analysed. Construction (F) was mostly affected, with 126,575 jobs lost.
It was followed by wholesale and retail trade and repair of motor vehicles and motorcycles (G) with a 64,640 fall, and manufacturing (C) with 54,859 jobs shed. Public administration and defence; compulsory social security (O); activities of households as employers (T); and real estate activities; professional, scientific, and technical activities; and administrative and support service activities (LMN) also lost 46,382, 44,936, and 40,966 jobs, respectively.
7 Discussion and Conclusion
In this work, we have discussed the economic cost for societies of youth unemployment during the past crisis, since the macroeconomic estimates of this cost are scarce. This article, in addition to assessing such an economic impact, also estimates the impact of this job destruction on Spain’s total employment.
Therefore, the analysis conducted herein differs from the existing literature, as it employs multisectoral modelling to make a broader estimate of the cost, which is calculated on the basis of the direct consequences of unemployment as well as the indirect effects on production and employment across Spain’s economic sectors.
The results produced in this article reveal that the loss of total employment between the years 2005 and 2015 was 4.19%, due to the loss of employment of young people between 16 and 29 years. This group suffered a loss of employment of 48.65%, while the rest of the age groups were characterised by an increase in jobs, highlighting the age group between 50 and 65 years, with 35.07%. Therefore, young workers were the most affected after the economic crisis.
This article may be considered an ex-ante diagnosis and assessment for the design of labour policies targeted at young people as it identifies the changes in youth employment structure with respect to the pre-crisis structure. By examining the changes in the share of employment per activity before and after the crisis, we may detect the employment challenges faced by young people, which may help design labour policies with suitable instruments specific to the needs of each productive sector.
As a conclusion, we want to stress some results produced in this article. Even though youth unemployment after the 2008 economic crisis lowered production and total employment in most productive sectors, some sectors were especially affected. Construction (F) was one of the hardest-hit sectors as lost production caused by the fall in youth employment amounted to 26.4% and total employment fell by 25.7%, shedding 126,575 jobs. It was followed by manufacturing (C) with a 32.2% fall in production, and 54,859 jobs lost, accounting for a 11.2% decline.
Other sectors such as real estate activities; professional, scientific, and technical activities; and administrative and support service activities (LMN) show a slipping production of 8.3%, down by 40,966 workers. Production in public administration and defence and compulsory social security (O) fell by 4.3%, and 46,382 jobs were lost (9.4%). Finally, production in wholesale and retail trade and repair of motor vehicles and motorcycles (G) fell by 6.3% and lost 64,640 workers (13.1%). Even though activities of households as employers (T) lost 44,936 jobs (9.1%), production rose by 1.6%.
Despite the potential limitations of the model adopted in relation to the underlying assumptions of the IO model – namely, the distribution coefficients are constant, and consequently, the model assumes a fixed structure for each sector of the economy, and there are no supply restrictions – we believe that in order to guide public policies, this article achieves the goals pursued and opens new lines of research.
We are currently facing an unprecedented economic crisis caused by health issues. This type of article helps identify the sectors with the highest and lowest employment falls to reflect on the decisions in order for economic policies that help those sectors to be adopted and to provide young people with guidelines to better adjust their education to new labour market demands. There is therefore an urgent need for the government to implement plans to promote youth employment, based on results of this type of works.
-
Funding information: The authors declare that no funds, grants, or other support were received during the preparation of this manuscript.
-
Author contributions: M.A.M. collected the data, performed the empirical calculations, and devised the article’s conceptualisation; A.C. designed the methodology and validated the results. Both authors prepared the manuscript, read the submitted version, and agreed on the article’s content.
-
Conflict of interest: The authors have no relevant financial or non-financial interests to disclose.
-
Article note: As part of the open assessment, reviews and the original submission are available as supplementary files on our website.
References
Arestis, P., Ferreiro, J., & Gómez, C. (2020). Quality of employment and employment protection. Effects of employment protection on temporary and permanent employment. Structural Change and Economic Dynamics, 53, 180–188. doi: 10.1016/j.strueco.2020.02.008.Search in Google Scholar
Avagianou, A., Kapitsinis, N., Papageorgiou, I., Strand, A. H., & Gialis, S. (2022). Being NEET in youthspaces of the EU South: a post-recession regional perspective. Young, 30(5); 425–454. doi: 11033088221086365.Search in Google Scholar
Bank of Spain. (2019). Family Financial Survey (FFS) 2017: methods, results and changes since 2014. Analitical Articles, Economic Bulletin, 4/2019.Search in Google Scholar
Barba, I., & Iraizoz, B. (2020). Effect of the great crisis on sectoral female employment in Europe: A structural decomposition analysis. Economies, 8(3), 64. doi: 10.3390/economies8030064.Search in Google Scholar
Bartolini, L., Gropas, R., & Triandafyllidou, A. (2017). Drivers of highly skilled mobility from Southern Europe: Escaping the crisis and emancipating oneself. Journal of Ethnic and Migration Studies, 43(4), 652–673. doi: 10.1080/1369183X.2016.1249048.Search in Google Scholar
Bermejo, F., Febrero, E., & Avelino, A. F. T. (2020). Socioeconomic effects of pension spending: evidence from Spain. International Journal of Social Economics, 47(5), 617–599. doi: 10.1108/IJSE-01-2019-0047.Search in Google Scholar
Bolea, L., Duarte, R., & Sánchez Chóliz, J. (2018). From convergence to divergence? Some new insights into the evolution of the European Union. Structural Change and Economic Dynamics, 47, 82–95. doi: 10.1016/j.strueco.2018.07.006.Search in Google Scholar
CPA. (2005, 2015). Classification of products by activity. https://www.ine.es/dyngs/INEbase/es/operacion.htm?c=Estadistica_C&cid=1254736177035&menu=ultiDatos&idp=1254735976614.Search in Google Scholar
Cuenca Morales, J. A., Fernández Vidaurreta, C., & Martínez Turégano, D. (2016). El empleo en la UEM en 2015. Economic Bulletin, Bank of Spain, 5, 57–69. ISSN 0210-3737.Search in Google Scholar
De Luca, G., Mazzocchi, P., Quintano, C., & Rocca, A. (2020). Going behind the high rates of NEETs in Italy and Spain: The role of early school leavers. Social Indicators Research, 151(1), 345–363. doi: 10.1007/s11205-020-02370-3.Search in Google Scholar
European Commision. (2015). 2015 joint report of the council and the commission on the implementation of the renewed framework for European cooperation in the youth field (2010–2018). EUR-Lex – 52015XG1215(01) – EN – EUR-Lex (europa.eu).Search in Google Scholar
Eurostat. (2021). Unemployment by sex and age – annual data. https://ec.europa.eu/eurostat/web/products-datasets/-/UNE_RT_A.Search in Google Scholar
García-López, A. M., Campoy-Muñoz, M. P., Cardenete-Flores, M. A., & Marchena-Gómez, M. J. (2018). The Andalusian tourism sector during the economic crisis and its impact on regional development. Revista de Estudios Andaluces, 36, 72–97. e-ISSN: 2340-2776. doi: 10.12795/rea.2018.i36.04.Search in Google Scholar
Guerra, A.I., & Sancho, F. (2011) Revisiting the original Ghosh model: Can it be made more plausible? Economic System Research, 23, 319–328.10.1080/09535314.2011.566261Search in Google Scholar
Holleran, M. (2019). The ‘lost generation’ of the 2008 crisis: Generational memory and conflict in Spain. Journal of Sociology, 55(3), 463–477. doi: 10.1177/1440783318817907. Search in Google Scholar
IJE. (2016). Youth in Spain Report. http://www.injuve.es/sites/default/files/2017/24/publicaciones/informe-juventud-2016.pdfSearch in Google Scholar
ILO. (2012). International Labour Office. The youth employment crisis: A call for action, Resolution and Conclusions, International Labour Conference, 101st Session, Geneva, 2012 (Geneva).Search in Google Scholar
Lenzen, M. (2003) Environmentally important paths, linkages and key sectors in the Australian economy. Structural Change and Economic Dynamics, 14, 1–34.10.1016/S0954-349X(02)00025-5Search in Google Scholar
Liotti, G., & D’Isanto, F. (2021). Changes in labour market institutions and unemployment in European countries: An empirical analysis on the short- and long-run effects of flexibility measures. In New challenges for the eurozone governance (pp. 227–246). Cham: Springer. doi: 10.1007/978-3-030-62372-2_12.Search in Google Scholar
Marques, P., & Hörisch, F. (2019). Promoting workplace‐based training to fight youth unemployment in three EU countries: Different strategies, different results?. International Journal of Social Welfare, 28(4), 380–393. doi: 10.1111/ijsw.12381.Search in Google Scholar
Mendoza, C., Ortiz, A., & Oliveras, X. (2020). Labour incorporation of young Southern European graduates in Mexico: the impact of the economic crisis. Journal of Youth Studies. 23(8), 959–973. doi: 10.1080/13676261.2019.1645948.Search in Google Scholar
Miller, R. E., & Blair, P. D. (2022) Input-output analysis: Foundations and extensions (3rd ed.). Cambridge: Cambridge University Press. doi: 10.1017/CBO9780511626982.Search in Google Scholar
NSI. (2018). National Statistics Institute. IO tables. https://www.ine.es/CDINEbase/consultar.do?mes=&operacion=Contabilidad+Nacional+Anual+de+Espa%F1a&id_oper=Ir&L=0.Search in Google Scholar
NSI. (2022). National Statistics Institute. Spanish Labour Force Survey (SLFS). https://www.ine.es/dyngs/INEbase/operacion.htm?c=Estadistica_C&cid=1254736176918&menu=resultados&secc=1254736195128&idp=1254735976595.Search in Google Scholar
O’Higgins, N. (2017). Rising to the youth employment challenge. New evidence on key policy issues. Geneve: International Labour Office.Search in Google Scholar
OECD. (2022). Organisation for economic cooperation and development. Unemployment rate by age group15-24-year-olds, % of labour force. https://data.oecd.org/unemp/unemployment-rate-by-age-group.htm#indicator-chart/http://www.oecd.org/.Search in Google Scholar
Pastore, F. (2015). The European Youth Guarantee: Labor market context, conditions and opportunities in Italy. IZA Journal of European Labor Studies, 4(1), 1–22. doi: 10.1186/s40174-015-0033-2.Search in Google Scholar
Rodríguez-Modroño, P. (2019). Youth unemployment, NEETs and structural inequality in Spain. International Journal of Manpower, 40(3), 433–448. doi: 10.1108/IJM-03-2018-0098.Search in Google Scholar
Santamaría López, E., & Carbajo Padilla, D. (2019). Emergenc(i)es of the crisis: anti-heroic figures of youth entrepreneurship in Spain. Política y Sociedad, 56(1), 191–211. doi: 10.5209/poso.60030.Search in Google Scholar
Úbeda, M., Cabasés, M. Á., Sabaté, M., & Strecker, T. (2020). The deterioration of the Spanish Youth Labour Market (1985–2015): An interdisciplinary case study. Young, 2020, 28(5), 544–563. doi: 10.1177/1103308820914838.Search in Google Scholar
Vancea, M., & Utze, M. (June 2017). Does unemployment and precarious employment lead to increasing entrepreneurial intentions among young people? results from a survey-based study in Spain. Central European Business Review, 6(2), 5–17.10.18267/j.cebr.176Search in Google Scholar
© 2022 the author(s), published by De Gruyter
This work is licensed under the Creative Commons Attribution 4.0 International License.
Articles in the same Issue
- Editorial
- Climate Change Implications for the Public Finances and Fiscal Policy: An Agenda for Future Research and Filling the Gaps in Scholarly Work
- Regular Articles
- Ownership Structure, Size, and Banking System Fragility in India: An Application of Survival Analysis
- A Study of Knowledge Spillovers within Chinese Mega-Economic Zones
- Mobility of Top Income Taxpayers in Response to Regional Differences in Personal Taxes: Evidence from Spain
- Why do zombie firms seldom die or resurrect? The effect of government subsidies on the survival duration of China’s zombie firms
- The Impact of Income Inequality on Mortality: A Replication Study of Leigh and Jencks (Journal of Health Economics, 2007)
- Nonlinear and Asymmetric Impact of Oil Prices on Exchange Rates: Evidence from South Asia
- The Portfolio Theory of Inflation and Policy (in)Effectiveness: Exploring it Further and Righting the Wrongs
- Impact of an Economic Crisis on Youth Employment: Evidence from 2008 Financial Crisis in Spain
- Special Issue: New Issues in International Economics
- Financial Literacy and Economic Growth: How Eastern Europe is Doing?
- Does Perceived Corruption Converge? International Evidence
- Current-Account Imbalances, Real Exchange-Rate Misalignments, and Output Gaps
- Highly Skilled International Migration, STEM Workers, and Innovation
- The Cyclicality of Immigrant Wages and Labour Market Flows: Evidence from Spain
- Debt Spillovers in a Monetary Union: A Novel Rationale for Central Bank Independence
- The Effectiveness of Fiscal-Budgetary Measures to Counteract the COVID-19 Crisis. Evidence from EU Countries
- The Golden Fetters in the Mediterranean Periphery. How Spain and Italy Overcame Business Cycles Between 1870 and 1913?
- How Equilibrium Exchange Rate Misalignments Influence on Economic Growth? Evidence for European Countries