Measuring pre-service chemistry teachers’ graph and table interpretation skills: when performance meets confidence
-

 ,
and
,
and

Abstract
This study investigates pre-service chemistry teachers’ ability to interpret data in graphs and tables, justify their responses, and reflect on their performance using a multi-tier diagnostic Graphs and Tables Engagement (GATE) test. A mixed-methods approach involved 55 pre-service teachers from four Czech universities at the start of their studies. The instrument comprised nine tasks across four tiers: content questions, explanation justifications, and associated confidence judgments using a 100 mm visual analogue scale. It showed strong psychometric properties, including high reliability (Cronbach’s alpha = 0.93), satisfactory discrimination indices, and appropriate item difficulty. Students demonstrated moderate data extraction skills (mean Content Score = 0.66) but struggled more with justifications (mean Explanation Score = 0.51), resulting in a Total Score of 0.48. Confidence judgments illuminated cognitive and metacognitive processes: students generally exhibited high confidence in simpler tasks involving direct data retrieval but displayed notable miscalibration in more complex inference-based tasks. Significant differences in confidence between successful and unsuccessful respondents underscored the value of confidence data in distinguishing understanding from guessing. The multi-tier test effectively assessed students’ data interpretation skills but revealed the need for additional qualitative methods – such as eye-tracking, think-aloud protocols, and interviews – to comprehensively understand students’ strategies and guide instructional improvements.
1 Introduction
Learning materials are essential for efficient information transfer and for facilitating student learning. 1 , 2 , 3 In natural sciences, particularly chemistry, materials include both text and non-textual components such as tables, graphs, and chemical representations at macro, sub-microscopic, and symbolic levels. 4 Although these are important components of learning materials, contemporary research suggests that they often do not receive sufficient attention in science instruction, 5 which can affect students’ ability to work effectively with these materials. 6 With the increasing prevalence of information technology and visual representations, the ability to read and interpret data has become a crucial skill. 7 , 8
This research examines students’ engagement with graphs and tables in chemistry learning materials. The study aims to identify how non-textual components influence pre-service chemistry teachers’ understanding of materials at the start of their studies. It also seeks to measure the effects of lower- and upper-secondary education and highlight areas needing attention early in university education.
2 Theoretical background
2.1 Visual representations
To convey scientific information, visual representations such as graphs, tables, diagrams, schematics, and models are commonly employed. Interpreting data using graphs and tables is a fundamental skill when learning science. 7 For scientists, organizing data in graphs and tables is an invaluable method for identifying relationships between variables and understanding the properties and reactivity of materials. 9 These visual tools help reveal patterns that might be difficult to discern in textual descriptions, making them essential for both understanding and communication in science.
The structure of tables is connected to the structure of graphs, as tables serve as a way to display data, creating a relationship between organized tables and their graphical representations. 10 However, students often confuse graphs with symbolic representations of data, which affects their ability to analyse information effectively. 11
Although mathematics education has long emphasized tables and graphs, recent research shows growing attention to these skills in science education. 7 PISA has consistently included graph- and table-based items as core components of scientific literacy frameworks. 12 , 13 This global emphasis is further reflected in national education standards in multiple countries, 14 , 15 where data interpretation and visualisation belong to key learning goals.
Scientific literacy, including graph interpretation skills, is shaped by factors such as data characteristics and content. 7 Despite this, research shows that students across all educational levels struggle with interpreting graphs and often make similar mistakes. 16 , 17 , 18 , 19
Moreover, educators have much to learn about the processes involved in reading, analysing, and interpreting information presented in data graphs and tables. 10 A frequent cognitive error in graph reading occurs when students perceive a graph as a literal picture rather than an abstract representation, leading to confusion between slope and height or intervals, and points. 7 Although the ability to read graphs is crucial, it is not an innate skill that develops automatically. Dreyfus and Eisenberg 20 stressed that reading graphical data is a learned ability that requires explicit instruction. As a result, research on this topic has gained increasing attention not only in the natural sciences but also in other disciplines. 10
Research shown that reading and interpreting graphs are two cognitively distinct processes. Reading typically involves the extraction of explicit features (e.g., value, trends), and is therefore less demanding for students, 21 whereas interpreting data requires drawing inferences, connecting data to underlying principles and evaluating implications, therefore a more cognitively demanding task 22 which is reflected in students’ results. 7 , 23 , 24
The design of learning materials can therefore significantly influence students’ abilities to work with non-textual components. Several studies analysing the visual components of textbooks 25 , 26 , 27 , 28 highlight the unequal representation of different types of representations. In a study by Rusek et al. 26 all lower-secondary chemistry textbooks submitted to the analysis included almost all textbook components, however, the textbooks differed in the amount of attention to particular components. Technically, each textbook includes both a table and a graph. However, the emphasis placed on these elements varies, which signals to teachers how important it is to integrate them into their teaching. 29 , 30 , 31 In addition, Dhakulkar and Nagarjuna 32 found that in a sample of Indian science textbooks, the presence of graphs was relatively limited and, in some cases, even lower than in mathematics textbooks. Other comparative analyses have similarly shown that the frequency and type of graphs differ significantly between mathematics, science, and engineering textbooks, pointing to notable variability across disciplines. 33 Moreover, even when graphs are present, the cognitive demands they place on students are not always clear. Slough and McTigue, 34 for instance, observed that despite a trend toward more visually rich science texts, the integration of visual and textual information – the graphical demands – often remains underexplored. Likewise, Khine and Liu 35 found that in a sample of primary science textbooks from the UAE, graphical content was primarily static and iconic, with relatively little use of data-driven graphs. Importantly, the mere presence of graphs and tables does not guarantee that students are supported in learning how to interpret them.
Currently, the literature on this topic in science education appears heavily skewed, with the vast majority of studies originating from physics education, 36 , 37 , 38 , 39 while representations in chemistry education are predominantly examined from macroscopic, sub-microscopic, and symbolic perspectives, 4 , 40 graphical and tabular representations are often overlooked.
2.2 Student skills diagnostic tests
As mentioned above, reading and using data from graphs and tables belongs to one of central student skills in science education. To test students’ skills in general, researchers have been using various diagnostic tools, including open-ended tasks, multiple-choice tests, and multiple-tier tests such as two-tier, three-tier, and four-tier tests and recently also eye-tracking mostly in combination with other methods such as think aloud. 41 Each method has its own advantages or disadvantages.
Multi-tier tests, due to their capacity to evaluate understanding, skills as well as disclose misconceptions have recently been used by researchers more frequently. 42 In contrast to traditional tests, a two-tier test includes a first tier with a multiple-choice question and a second tier presenting possible justifications for the selected answer. These tests allow for identifying and measuring incorrect answers with correct reasoning and correct answers with flawed reasoning (i.e., false positives and false negatives). However, they do not differentiate between a lack of knowledge and misconceptions, which can lead to an overestimation or underestimation of students’ scientific understanding. 43 , 44 Using a three-tier test allows differentiation between errors and lack of knowledge, 45 incorporating the confidence tier (third tier). 42 , 46 , 47 The Confidence rating factor or confidence judgement refers to diagnostic questions where students are asked to choose an answer and assess their degree of certainty about that answer. 48 Confidence’s evaluation differs across individual studies. The simplest approach are “sure” and “not sure”, or “very confident”, “not confident” and “do not know” options (see e.g., 49 , 50 , 51 , 52 ) followed by reporting confidence on Likert scale: four-point 42 , 53 or six-point 54 , 55 , 56 , 57 or a 10-point scale suggesting percentage. 48 , 54 , 56 , 57
While all misconceptions are a form of error, not all errors stem from misconceptions. Yet, misconceptions are errors that are strongly held and advocated with high confidence. 45 , 55 , 56 A four-tier test is a multiple-tier diagnostic assessment designed to address limitations found in two-tier and three-tier tests. 50 Three-tier tests address some weaknesses of two-tier tests, but they still don’t clearly separate confidence in the answer (first tier) from confidence in the reasoning (second tier). As a result, they may overestimate students’ scores and underestimate their lack of knowledge. 58 In a four-tier test, the first tier consists of a standard multiple-choice question, with distractors specifically targeting misconceptions. The second tier requires students to indicate their confidence in their chosen answer from the first tier. The third tier prompts them to provide reasoning for their initial answer. Finally, the fourth tier asks students to express their confidence in the reasoning they provided in the third tier. 45 , 47 , 55
2.3 Confidence judgement
With a focus on lifelong learning, self-regulated learning 59 plays a crucial role in fostering autonomy and adaptability in learners. It represents a crucial element individuals need to develop not to remain dependent on external evaluation of their progress. Their metacognition, i.e., their awareness of their own knowledge, cognitive processes, mental state as well as the ability to monitor and regulate them is a vital element. 60 As the scope deepens and knowledge expands, experts find it increasingly challenging to precisely define the boundaries of metacognition. 61 In metacognition research, scholars typically examine how individuals monitor their own cognitive processes and the extent to which they can regulate them. 62
The aforementioned multi-tier tests became a useful tool to evaluate students’ metacognition in science education research. 42 , 53 , 58 , 63
With respect to this paper’s focus, confidence in data interpretation is key to working with graphs and tables effectively. When analysing numerical and visual information, individuals must assess their comprehension and make decisions based on patterns, trends, and relationships. Confidence judgments (CJ) allow individuals to evaluate how well they understand a concept. 55 , 56 However, perceived confidence does not always correspond to actual accuracy – both overconfidence and under-confidence can impede effective data interpretation. 42 Overestimating one’s skills may lead to misreading trends or overlooking inconsistencies, while insufficient confidence can discourage deeper analysis and limit the ability to draw meaningful conclusions. 53 , 64
Aligning confidence with actual analytical proficiency enhances data literacy by improving self-evaluation accuracy. Excessive confidence, particularly when based on incorrect assumptions, can result in misinterpretation of data. However, when misunderstandings are corrected through targeted feedback, confidence can drive a more thorough and insightful approach to analysis. 65 On the other hand, moderate confidence, often associated with intellectual humility, encourages a more careful and adaptable approach to working with data. 66 Effective strategies help individuals calibrate their confidence levels to match their actual understanding, refining their analytical skills and decision-making processes. 67 , 68 Therefore, cultivating accurate confidence judgments is essential, among others, for developing strong data interpretation skills.
2.4 The use of multi-tier tests to diagnose student’s engagement with tables and graphs
Research on students’ ability to interpret data remains relatively limited, particularly in studies employing multi-tier test formats. However, several studies have explored how students process and understand data representations, particularly through the use of graph-based assessments. 36 , 37 , 69 These studies provide insights into students’ conceptual understanding, confidence levels, and metacognitive abilities, revealing common misconceptions and differences in field of science.
One of the early applications of a multi-tier test in this area was conducted by Klein et al. 37 who examined representational competence in kinematics using a two-tier test. This assessment included multiple-choice combined with a confidence rating tier, allowing for the identification of representational misconceptions. The findings indicated that students exhibited higher confidence (over 80 %) when answering purely data-interpretation-based items compared to the overall confidence level across all items (mean confidence = 75 %). However, students were less confident when dealing with pictorial representations or a combination of pictorial and algebraic representations. Crucially, the study revealed that students often misjudged their ability to interpret graphs accurately. For instance, in graph-based items, even students who expressed high confidence performed no better than those who guessed, suggesting a disconnect between perceived and actual competence. Conversely, in non-graph-based items, students were more aware of their knowledge limitations and did not overestimate their abilities.
Further analysis of students’ performance and confidence judgements highlighted specific misconceptions in the interpretation of motion graphs. A common difficulty involved associating a motion schema with a corresponding velocity-time graph when velocity changes due to direction shifts. Likewise, students struggled to assign a correct motion schema to a given velocity-time graph. One prevalent misconception was the assumption that the direction of motion corresponds directly to the shape of the graph, leading to errors in interpretation, Additionally, students exhibited misunderstandings related to acceleration, particularly regarding terminal velocity and the influence of air resistance. The gap was observed in their interpretation of curve curvature, indicating fundamental misunderstandings of graphical representation. 36 , 37
Building on the work of Klein et al., 37 a later study by Klein et al. 36 investigated graph comprehension in a broader academic context, comparing the abilities of physics and economics students in interpreting data from graphs. The study focused specifically on slope graphs and the area under a curve, using an instrument that combined a content tier with a confidence judgement tier. The results demonstrated that physics students outperformed economics students in tasks requiring data interpretation from graphs. Interestingly, while both groups exhibited similar overall confidence levels (mean confidence rating: 62 %), physics students demonstrated greater accuracy in evaluating the correctness of their answers.
This study also provided evidence that the type of graph related concept impacts metacognitive accuracy. Both physics and economics students were more precise in assessing their answers when dealing with slope graphs than when working with area-under-the-curve concepts. This suggests that students’ ability to evaluate their own understanding is influenced by the nature of the concept, reinforcing the findings of Klein et al. 37 regarding the difficulties associated with more complex graphical formats.
While the two-tier and confidence-based approaches in the studies by Klein et al. provided insights into students’ misconceptions and confidence misjudgements. Turmanggor et al. 69 expanded on this methodology by introducing a four-tier test to further diagnose conceptual misunderstandings in this area. This test included usual four-tier structure. 45 , 47 , 55 This extended multi-tier approach was specifically designed to detect misconceptions among prospective physics teachers in the domain of waves and wave motion. The results revealed several recurring misconceptions, such as misunderstanding wavelength, failure to differentiate between particle motion and wave motion, incorrect assumptions about external factors affecting wave properties.
Together, these studies demonstrate the utility of multi-tier tests in diagnosing conceptual understanding and metacognitive accuracy in data interpretation. These findings suggest that multi-tier testing can serve as an effective tool for identifying misconceptions in students’ data interpretation abilities not just their knowledge. 42 , 55 , 70
For this reason, this study brings two novel approaches: it is aimed to disclose the neglected field of students’ engagement with graphs and tables delivering chemistry content and employed a more elaborated, multi-tier tasks to measure their skills.
3 Research goals
The primary goal of this study was to investigate the ability of pre-service chemistry teachers to interpret and analyse non-textual components commonly found in chemistry study materials. A key objective was to examine how the presence of tables and graphs influences students’ ability to engage effectively with scientific content.
The study aimed to assess not only the accuracy of students’ responses but also their ability to justify their conclusions and reflect on their confidence in both correct and incorrect answers. To achieve this, a research instrument containing graphs and tables from common chemistry study materials was developed. 21
This study aimed to address the following research questions:
How accurately are students able to solve tasks focused on interpreting data from tables and graphs and justify their answers?
How accurately are students able to assess their own performance and reasoning when solving data interpretation tasks?
4 Methodology
4.1 Research procedure
This study is a part of a larger project focused on students’ ability to engage with learning materials containing non-textual components, whose phases are illustrated in Figure 1. This present study employed a mixed-methods approach that included multi-tier tasks designed to assess students’ data interpretation skills, their ability to justify their responses (RQ 1), and their reflection on their own performance (RQ 2).

Design of the project.
Except for the information about students’ ability to engage with data in graphs and tables, the results will be used to select a sample of successful and unsuccessful students for further investigations into the graphs and tables reading strategies students employ.
4.2 Sample
The study sample consisted of 55 pre-service chemistry teachers from four universities in Czechia, all at the outset of their university studies. These included students from the Faculty of Education, Charles University (N = 20); the Faculty of Education, University of West Bohemia (N = 11); the Faculty of Science, Palacký University (N = 15); and the Faculty of Science, J. E. Purkyně University (N = 9). The test was administered at the beginning of the winter semester of 2024.
4.3 Research tool
This study used a four-tier Graphs and Tables Engagement (GATE) test previously piloted and adjusted by the authors of this study. 21 The GATE test consisted of nine tasks: three focused on interpreting tables and six on interpreting graphs in various forms (see Table 1). Each task consisted of four parts: a content tier, a confidence judgement tier for the answer, an explanation tier, and a confidence judgement tier for the explanation. To assess confidence, a 100 mm visual analogue scale was used. 21 , 71 , 72 An exception to this format were items 2A and 2B, which were presented in a two-tier structure as the response directly required an explanation. 73 The average time required to complete the GATE test was approximately 40 min. The example of one item with all four tiers is shown in Figure 2.
GATE test items description.
| Item | Topic | Data presentation | Students’ performance |
|---|---|---|---|
| 1 | Air pollution | Table | Compare measured values with tabulated limits to classify air quality |
| 2A | Greenhouse effect | Graph | Analyse trends in two graphs to identify data supporting a conclusion |
| 2B | Compare trends in two graphs to identify conflicting data and justify the reasoning | ||
| 3A | Vitamins | Table | Compare tabulated values to determine if vitamins intake meets recommended levels |
| 3B | Analyse concrete tabular data to evaluate health risks from vitamin intake | ||
| 4A | Solubility of salts | Graph | Interpret a solubility graph to identify the substance with the highest solubility |
| 4B | Examine a solubility graph to determine substances soluble at a specific temperature | ||
| 4C | Evaluate changes in solubility from a graph to identify the most temperature-sensitive substance | ||
| 4D | Use solubility data from a graph to predict the appearance of mixed solutions |
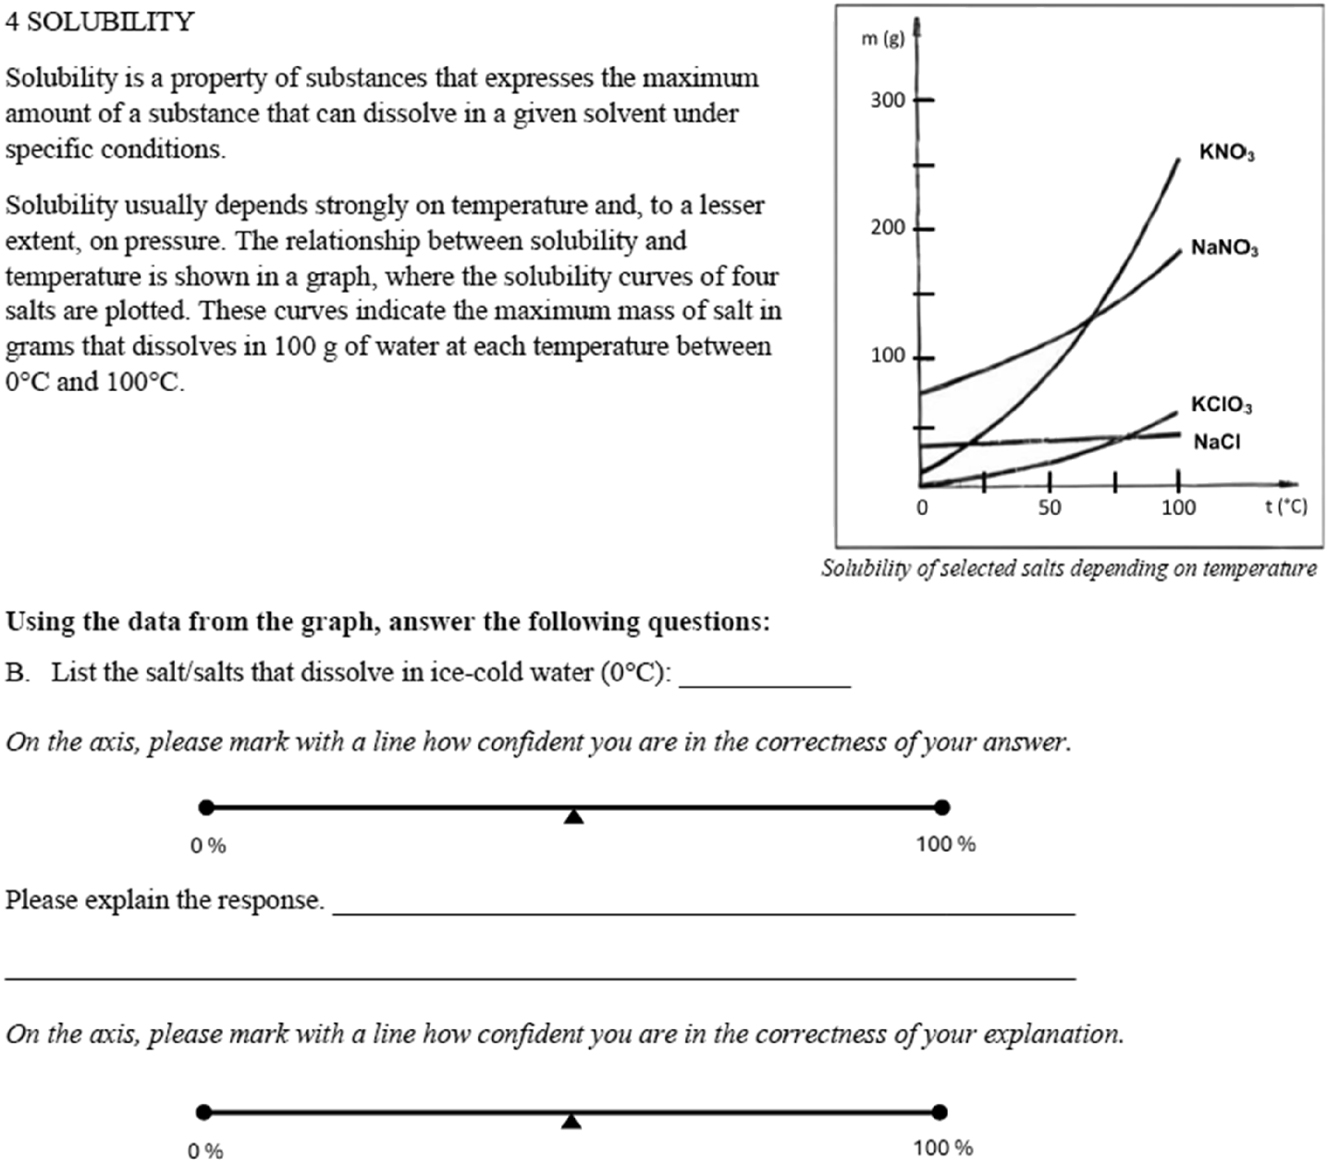
Example of GATE test item (4B) on solubility.
4.4 Data analysis
The closed-ended content tier was evaluated either as correct (1) or incorrect (0). The open-ended explanation tier was evaluated independently by two researchers according to the framework shown below.
Item 1
Question: Determine the overall air quality rating based on pollutant data in the table.
Correct answer: Satisfactory
Model explanation: Determine the air quality index for each pollutant from the table. The worst index value determines the overall rating. NO2 has an index of 3 (satisfactory), worse than the others, so the total is satisfactory.
Correct response code: According to the worst measured value
Incorrect response code: Estimate; Repetition of the question; Average; Average + intermediate value; Average + incorrect interpretation of table data; Average + wrong calculation; Average + rounding; Majority, prevalence, ratio
Item 2A
Question: What evidence supports the conclusion that the rise in global temperature is affected by the increase in CO2 emissions?
Model correct answer with an explanation: The overall trend in both graphs is upward, suggesting a possible relationship between global temperature and CO2 emissions.
Codes: Included in the response evaluation.
Item 2B
Question: Which part of the graph does not support the conclusion that the rise in global temperature is influenced by the increase in CO2 emissions and why?
Model correct answer with an explanation: For example, the period from 1940 to 1960, when temperatures increased rapidly, but CO2 emissions remained stable.
Codes: Included in the response evaluation.
Item 3A
Question: Which vitamins in the tablet are below the Recommended Daily Intake?
Correct answer: Vitamin C and Vitamin K
Model explanation: Compare tablet content with RDI. Vitamin C (65 mg < 80 mg) and Vitamin K (70 μg < 75 μg) are below the recommended amounts, so tablets alone do not meet the RDI for these vitamins.
Correct response code: Compare RDI versus tablet content (identify C and K as below RDI); Cite specific values from table (e.g., 65 < 80; 70 < 75); State that all other vitamins meet or exceed RDI; General statement “RDI is higher than tablet content” (for C and K)
Incorrect response code: Unit-conversion confusion/failed conversion; Incomplete comparison (mentions only one vitamin or gives partial data); Vague/guessing/no justification
Item 3B
Question: Which of the three selected vitamins has an intake from the given foods that is below the RDI?
Correct answer: Vitamin E
Model explanation: Total intake from two oranges + 200 g liver is below 12 mg RDI for Vitamin E, so it is insufficient despite other vitamins being sufficient.
Correct response code: Accurate calculation & comparison for all three vitamins; Correct classification without numbers; Cites specific values and correctly sums; Logical explanation showing correct reasoning process
Incorrect response code: Misclassifies adequacy for any vitamin; Confuses units leading to wrong conclusion; Partial answer not covering all three; No explanation or unrelated reasoning; Only copies data from table without evaluation
Item 4A
Question: Which salt has the highest solubility at room temperature?
Correct answer: NaNO3
Model explanation: At 25 °C, NaNO3 has the highest solubility on the graph (∼100 g per 100 g water). At this temperature, its curve is the highest.
Correct response code: Identifies NaNO3 as having the highest solubility at ∼20–25 °C; Cites approximate correct value from graph; Describes highest curve at relevant temperature; Compares salts and correctly selects NaNO3; Uses correct reasoning from graph shape
Incorrect response code: Names wrong salt; Gives incorrect solubility value; Misreads temperature axis; Provides irrelevant or no explanation; Describes unrelated table data instead of graph
Item 4B
Question: Which salt(s) dissolve in ice-cold water (0 °C)?
Correct answer: NaCl, KNO3, KCl
Model explanation: At 0 °C, these salts have solubility above 0 g/100 g water, so they dissolve in ice-cold water.
Correct response code: Identifies KClO3 as the only salt with zero solubility at 0 °C; States that other salts have non-zero solubility at 0 °C; Refers to graph values above zero for the other salts; Describes curve position relative to zero at 0 °C; Explains difference between KClO3 and other salts in terms of solubility at 0 °C
Incorrect response code: Names the wrong salt; Claims all salts dissolve or all have the same value; Misreads the temperature or mass axis; Gives irrelevant statement about curve shape without reference to 0 °C; Does not identify any salt or provide explanation
Item 4C
Question: Which salt’s solubility is most sensitive to temperature change?
Correct answer: KNO3
Model explanation: Its solubility curve rises most steeply with temperature, showing greatest sensitivity to temperature change.
Correct response code: Identifies the substance (KNO3) with the greatest increase in solubility as temperature rises; Recognises that KNO3’s solubility curve has the steepest slope/largest change across the temperature range
Incorrect response code: Makes only a general statement about solubility increasing with temperature without identifying the correct substance; Misidentifies the substance or misinterprets the graph’s trends
Item 4D (NaCl)
Question: What happens if you add 48 g of NaCl to 100 g water at 40 °C?
Correct answer: Saturated with crystals
Model explanation: At 40 °C, solubility is ∼38 g/100 g water; adding 48 g exceeds solubility, so undissolved solid remains.
Correct response code: Correctly compares given masses with maximum solubility from the graph at 40 °C and concludes that all of the KNO3 will dissolve while some NaCl will remain undissolved; Identifies from the graph that KNO3’s solubility exceeds the given amount, while NaCl’s does not
Incorrect response code: Makes vague or unrelated statements about solubility without using the given quantities; Misinterprets or misreads the graph; Incorrectly concludes that both salts will fully dissolve or that neither will
Item 4D (KNO3)
Question: What happens if you add 53 g of KNO3 to 100 g water at 40 °C?
Correct answer: Clear solution
Model explanation: At 40 °C, solubility is ∼64 g/100 g water; adding 53 g is below the limit, so all dissolves.
In case of inconsistency, consensus by agreement was reached through discussion with the third author. Each response was assessed individually using elements of open coding. The researchers evaluated the correctness of the justification (1/0). Partially correct responses were not considered, as insufficient justifications indicate either a lack of knowledge or the ability to make appropriate connections.
In addition to the overall results obtained using standard statistical methods, item difficulty, the discrimination index, reliability as well as item correlations were calculated.
To evaluate how the GATE test items are effective in distinguishing between strong and weak students, the discrimination index (D) was used. It was calculated using the formula:
interpreted according to Mitran et al. [74] as follows:
D > 0.40 → Excellent discrimination (The item effectively distinguishes between strong and weak students)
0.30 ≤ D ≤ 0.39 → Good discrimination (The item differentiates fairly well)
0.20 ≤ D ≤ 0.29 → Acceptable discrimination (The item is useful but could be improved)
D < 0.20 → Weak discrimination (The item does not effectively differentiate between students)
D < 0.00 → Problematic item (Weaker students performed better than stronger students, suggesting possible issues with the item)
The students’ confidence judgement (CJ) was given on a 100 mm visual analogue scale with on end marked “not at all confident” and the other “completely confident” with correctness of their response either the content or the explanation. Using a ruler, the responses were transcribed to numbers 71 ranging from 0.00 to 10.00.
Explanation Score (ES) – the correctness of students’ explanation of the given response,
Total score (TS) – the product of the two aforementioned scores, where 1 is given to correct content and evaluation and 0 to the rest of the possible combinations,
Mean Confidence (CF) – the sum of all confidence ratings for the given tier(s), divided by the total number of responses,
Mean Confidence for Correct Responses (CFC) – the sum of confidence ratings for all correct answers, divided by the total number of students who provided them calculated separately for C, E and TS,
Mean Confidence for Incorrect Responses (CFW) – the sum of confidence ratings for all incorrect answers, divided by the total number of students who provided them,
Confidence Discrimination Quotient (CDQ) – indication of students’ ability to distinguish between what they know and what they do not know calculated as ((CFC – CFW)/SD) where SD is the standard deviation of all confidence ratings for the given tier. 55
Higher values of CDQ indicate better metacognitive discrimination, meaning a person is good at distinguishing when they are right or wrong based on their confidence. Lower or negative values indicate poor metacognitive discrimination. In such cases an individual might be overconfident in incorrect responses or underconfident in correct ones. 54 , 76 , 77
Reliability of the GATE test was examined using Cronbach’s alpha and Spearman-Brown split-half coefficient. The Shapiro–Wilk test (p < 0.05) indicated that the data were not normally distributed. Therefore, we used Spearman’s correlation to examine relationships between first-tier (CS) and third-tier (ES) scores, and between students’ results and their confidence judgments. To further identify the differences, higher-order statistics was used. Mann-Whitney U test was used to investigate the differences between the successful and unsuccessful task solvers with r to examine the effect-size interpreted according to Cohen. 78
5 Results and discussion
5.1 Psychometric evaluation of the test
The strong psychometric properties of the GATE test observed during the pilot testing 21 were confirmed on a larger sample of students from multiple universities. To specify them, reliability, correlation analysis, discrimination index and item difficulty were evaluated.
5.1.1 Reliability and correlation analysis
The overall Cronbach’s alpha for all observed metrics was 0.93, indicating excellent reliability. When analysed by tiers, the results emphasize the significance of the multi-tier test format:
Content Score (CS): 0.64, indicating moderate reliability,
First-tier Confidence Judgment: 0.94, indicating excellent reliability (high item consistency),
Explanation Score (ES): 0.73, indicating acceptable reliability (low item consistency),
Explanation Confidence Judgment (Confidence in Explanation): 0.91, indicating excellent reliability (high item consistency).
These findings confirm the strong reliability of the GATE test and highlight the importance of including the confidence judgment (CJ) tier. Evaluating the instrument requires consideration of the content, explanation, and confidence tiers together.
The split-half reliability analysis (Spearman-Brown correction coefficient) revealed distinct patterns in the score and confidence consistency across the content tier (CS) and explanation tier (ES). The score reliability coefficients were moderate, with 0.61 (CS), indicating some inconsistency between the two halves of the test, and 0.67 (ES) suggesting a somewhat higher consistency between the two halves.
In contrast, the confidence ratings demonstrate high reliability, with coefficients of 0.89 (CS) and 0.86 (ES), indicating that students’ self-assessments are consistent across test halves.
The lower reliability of test scores compared to confidence ratings suggests that some test items may be inconsistent in difficulty or interpretation, leading to variability in student responses.
The correlation analysis between CS and ES values for the selected items revealed varying degrees of consistency. Strong positive correlations were found for Item 1 (0.65), 3B (0.72), and 4B (0.69), indicating high alignment between the two formats. This suggests these items are reliable and consistent. Moderate correlations were observed for Item 3A (0.58), 4A (0.61), and 4D (0.53), reflecting reasonable consistency but with some variability. The weakest correlation was found for 4C (0.45), suggesting potential differences in clarity, difficulty, or context between the CS and ES versions.
These findings suggest that the GATE test fulfils its intended purpose. However, to optimize its use for assessing graph and table interpretation skills, a minor review of item consistency, difficulty distribution, and question design would be beneficial.
5.1.2 Discrimination index
The discrimination index values for the CS, ES, and TS items reveal how effectively each item differentiates between high-performing and low-performing respondents. Table 2 presents the discrimination index values for the test items, indicating that most items effectively differentiate between low- and high-performing students. Some items might be considered insufficiently discerning between students from a content-based perspective, the total score values suggest otherwise.
The discrimination indexes of GATE test Items.
| Item | Discrimination index CS | Discrimination index ES | Discrimination index TS |
|---|---|---|---|
| 1 | 0.65 | 0.46 | 0.60 |
| 2A | 0.37 | Non applicablea | |
| 2B | 0.61 | Non applicablea | |
| 3A | 0.35 | 0.40 | 0.46 |
| 3B | 0.25 | 0.41 | 0.67 |
| 3A | 0.13 | 0.6 | 0.68 |
| 4B | 0.36 | 0.73 | 0.60 |
| 4C | 0.03 | 0.47 | 0.28 |
| 4D | 0.49 | 0.40 | 0.30 |
-
aDue to their nature, the items 2A and 2B did not contain the explanation tier.
Several items demonstrated strong discrimination across multiple categories. Item 1 exhibited high discrimination in CS (0.65), ES (0.46), and TS (0.60), indicating that it reliably differentiates respondents in all contexts. Similarly, students performed well on Item 2B CS (0.61), making it a strong discriminator within that category. Item 3A also demonstrated moderate to high discrimination, with indices of 0.35 (CS), 0.40 (ES), and 0.46 (TS). While the CS value fell slightly below the ideal threshold, the item’s overall performance remained effective. Item 3B stood out with high TS discrimination (0.67), though its CS value (0.25) indicates room for improvement in that domain.
Conversely, some items showed inconsistent performance across the categories. For example, Item 4A had a low CS index (0.13) but strong ES (0.60) and TS (0.68) values. This suggests that although the item successfully differentiated students based on their reasoning and overall task handling, it was less effective in distinguishing performance at the basic content level. Similarly, Item 4C demonstrated poor discrimination in CS (0.03), while its ES (0.47) and TS (0.28) values were more moderate. These contrasts demonstrate the relevance of analysing student responses across multiple dimensions, as reliance on a single tier could obscure meaningful differences in students’ understanding and reasoning processes.
Moderate performers, such as Item 2A (0.37 in CS) and Item 3A (0.35 in CS), exhibited some discriminatory power which, however, falls below the ideal threshold. Minor adjustments to these items could enhance their effectiveness in differentiating respondents.
Overall, for the GATE test in its current form to be used to test students’ ability to read tables and graphs, the strong performers – such as Items 1, 2B, 3B, 4A (ES and TS), 4B, and 4D – should be retained, as they effectively differentiate respondents across multiple contexts. Moderate items like 2A and 3A (CS) warrant further refinement to enhance their discriminatory power, while the Item 4C week in the CS should be revised or removed.
5.2 Students’ performance analysis (RQ1)
Table 3 summarises student performance across test items based on three measures: Content Score (CS), Explanation Score (ES), and Total Score (TS). CS reflects students’ ability to extract data from graphs and tables, ES evaluates their capacity to justify answers, and TS combines both dimensions.
Students’ performance on the GATE test items.
| Item | Difficulty indexes | ||
|---|---|---|---|
| Content score | Explanation score | Total score | |
| 1 | 0.53 | 0.51 | 0.51 |
| 2A | 0.64 | a | a |
| 2B | 0.51 | a | a |
| 3A | 0.73 | 0.75 | 0.62 |
| 3B | 0.78 | 0.49 | 0.40 |
| 4A | 0.89 | 0.62 | 0.62 |
| 4B | 0.56 | 0.44 | 0.44 |
| 4C | 0.98 | 0.60 | 0.60 |
| 4D | 0.29 | 0.15 | 0.15 |
| Mean | 0.66 | 0.51 | 0.48 |
-
*Due to their nature, the items 2A and 2B did not contain the explanation tier.
On average, students achieved a Content Score (CS) of 0.66, indicating moderate success in retrieving data from graphs and tables. However, their ability to explain their reasoning was notably lower, with a mean Explanation Score (ES) of 0.51, and the combined Total Score (TS) dropped to 0.48. This decline suggests that many students struggled to justify their answers adequately, revealing important gaps in deeper understanding and interpretive skills.
Item-level analysis provides further insight into these patterns. The easiest item was 4C where students were asked to identify the most temperature-sensitive salt in a solubility graph, i.e., the steepest curve (CS = 0.98, ES = 0.60). Although nearly all students selected the correct answer, many explanations lacked key ideas such as curve steepness or axis relationships. This echoes concerns raised by Friel and Bright 79 or Planinic et al. 80 Similarly, items 3A (CS = 0.73, ES = 0.75) and 4A (CS = 0.89, ES = 0.62) involved straightforward comparisons of tabulated or graphical values and were among the highest-performing tasks. These findings align with previous research showing students perform well on basic extraction tasks. 81 , 82 , 83
In contrast, more challenging tasks like Item 4D (CS = 0.29, ES = 0.15) required students to predict the outcome of mixing solutions based on solubility data, i.e., compare numerical values once they understood their meaning. This task revealed major challenges in inference-based interpretation and conceptual reasoning. 84 , 85 , 86 Similarly, Item 3B (CS = 0.78, ES = 0.49) showed a gap between retrieving values and justifying them. Students often misread table columns or failed to synthesise key information. 82 , 83
In Item 3A, ES exceeded CS, indicating that students could verbally justify the correct approach but failed to select the right answer. This highlights the cognitive challenge of turning understanding into correct action. 47 , 87 , 88
This gap between surface-level identification and deeper reasoning was evident across several items, supporting findings from Aydeniz et al., 89 Espinosa et al., 42 and Yang. 90 For instance, Item 4B (CS = 0.56, ES = 0.44) involved determining solubility at a specific temperature. While students often selected correct values, they struggled to justify them using concepts such as saturation or temperature dependence.
Students who gave correct explanations to Items 1 and 4A–C were significantly more likely to select the correct response. This reinforces the link between conceptual understanding and performance. 46 , 86 , 91
Only a few items (3A, 4A, 4C) exceeded the 60 % TS threshold, confirming that students performed best on tasks with clear structure and minimal inference demands.
These findings indicate that multi-tier diagnostic testing is effective in exposing not only content knowledge gaps but also discrepancies in reasoning and self-awareness. While most items fell within the optimal difficulty range (0.3–0.7), Item 4C may be too easy and Item 4D too difficult, warranting revision to improve their discriminatory power.
In summary, students were reasonably competent in basic data retrieval and comparison, but faced clear challenges when tasks required them to explain, infer, or apply information in new contexts. Instruction that strengthens higher-order skills – such as graph reasoning, explanatory depth, and metacognitive self-monitoring – could make students more effective and confident in using tabular and graphical data in chemistry education. 39 , 85 , 86
5.3 The role of confidence in student performance on multi-tier tests (RQ2)
5.3.1 Students’ confidence judgement
To address RQ2, the second and fourth tiers of the GATE test were evaluated in relation to the content and explanation scores (see Table 4). From a metacognitive perspective, the confidence analysis further enriches information about students’ performance. Confidence levels were often misaligned with actual performance, especially on more complex tasks.
Students’ confidence judgements on the GATE test items.
| Success-rate | CF | CFC | CFW | CDQ | Comparison of mean CFC and CFW | |||||||
|---|---|---|---|---|---|---|---|---|---|---|---|---|
| TS | CS | ES | CS | ES | CS | ES | CS | ES | p-Value | Effect s-size (r) | Effect-size interpretation | |
| 1 | 0.51 | 7.03 | 6.72 | 8.08 | 7.86 | 5.86 | 5.53 | 0.90 | 0.86 | <0.001 | −0.468 | Medium to large |
| 2A | 0.64a | 5.87 | – | 6.16 | – | 5.17 | – | 0.42 | – | 0.156 | −0.193 | Small |
| 2B | 0.51a | 6.32 | – | 6.91 | – | 5.60 | – | 0.51 | – | 0.163 | −0.195 | Small |
| 3A | 0.62 | 5.88 | 6.68 | 6.19 | 6.65 | 5.06 | 6.74 | 0.37 | −0.03 | 0.369 | −0.121 | Small |
| 3B | 0.40 | 5.43 | 5.61 | 5.79 | 5.76 | 4.06 | 5.39 | 1.51 | 0.12 | 0.108 | −0.221 | Small |
| 4A | 0.62 | 6.68 | 6.82 | 7.18 | 7.07 | 0.60 | 5.75 | 2.16 | 0.46 | 0.001 | −0.438 | Medium to large |
| 4B | 0.44 | 6.31 | 6.33 | 7.76 | 7.71 | 4.27 | 4.83 | 1.09 | 0.97 | <0.001 | −0.488 | Medium to large |
| 4C | 0.60 | 7.22 | 6.89 | 7.22 | 7.69 | – | 5.44 | – | 0.84 | NA | NA | Only correct solvers’ data |
| 4D | 0.15 | 4.66 | 5.36 | 6.61 | 7.85 | 3.74 | 4.59 | 0.83 | 0.95 | 0.01 | −0.378 | Medium |
| Mean | 0.48 | 6.16 | 6.34 | 6.88 | 7.23 | 4.30 | 5.47 | 0.97 | 0.60 | – | – | – |
-
aDue to their nature, the Items 2A and 2B did not contain the explanation tier, so their CS is used for this purpose. TS, total score; CS, content score; ES, explanation score; CF, mean confidence (values from the confidence judgement scale); CFC, mean confidence value of successful students; CFW, mean confidence value of unsuccessful students; CDQ, confidence discrimination quotient.
Table 4 presents the corresponding factor values for each tier. The results indicate that the mean confidence value (CF) across the test was generally above average (5.00), with a CF of 6,15 for the CS and 6,34 for the ES. Overall, students, in accordance with other research, 55 , 56 displayed relatively high confidence in both their answers and explanations. No clear trend emerged between confidence in giving responses (CS) and in explanations (ES). The difference was not statistically significant (p = 0.35) and showed only a small-to-medium effect size (r = 0.22). This finding is consistent with other studies which found that confidence in answers (CS) and explanations (ES) varied, but there was no trend in statistically significant difference between them overall. 47 , 63
In 11 % of confidence ratings (51 instances), no CJ was reported, mostly for items students did not attempt. If these respondents had rated their confidence for missing or incorrect explanations, overall confidence levels would likely have been lower.
All individual items demonstrated CF values exceeding 5 out of 10 showing students’ overall confidence. The sole exception was Item 4D, where student confidence was slightly below average (CF = 4,66). These results suggest that students were less certain when the task required understanding the graph’s concept and drawing conclusions from the data. 57 , 63 This item also had the lowest Total Score (TS = 0.15), which may explain the reduced confidence. Considering the difficulty index and discrimination score, these lower confidence values are unsurprising.
In two items (Items 1 comparison of measured values with tabulated limits and 4C identification of a curve which meets a certain description), students reported higher confidence for the CS. In case of Item 1 the difference was negligible (p = 0.941, r = 0.007), indicating the students felt equally confident (around 0.7 despite the success rate was slightly above 50 %). However, in case of 4C, students’ confidence was significantly higher, with a medium effect-size, for CS compared to ES (p = <0.001, r = 0.377). Students were noticeably more confident in selecting the correct curve (content tier) than in justifying their choice (explanation tier). This points to a possible gap between recognizing the correct answer and explaining the reasoning behind it.
On the contrary, for four items (Items 3A, 3B, 4A, and 4D), respondents were more confident in their explanations than in their initial answers. These tasks involved comparing vitamin intake data sets, identifying the highest value under specific conditions, and evaluating initial segments of salt solubility curves in a graph (see Table 5).
Wilcoxon’s single-rank test results between students’ confidence on CS and ES.
| Item | z-score | p-Value | Effect size (r) | Interpretation of effect size |
|---|---|---|---|---|
| 3A | −4.314 | <0.001 | −0.440 | Medium |
| 3B | −6.474 | <0.001 | −0.682 | Large |
| 4A | −4.699 | <0.001 | −0.487 | Medium to large |
| 4D | −3.984 | <0.001 | −0.440 | Medium |
Wilcoxon’s Single-rank test results suggest that explanations can reinforce understanding. In some cases, students may rationalize their answers after the fact, increasing confidence even when the initial choice was less certain.
Similar findings were identified in Yang’s 90 study. However, this contrasts with other studies which used multi-tier tests to measure conceptual understanding. Students typically showed higher confidence in the content tier than in the explanation tie. 55 , 57 This is consistent with Yang’s 90 findings that explanations tied to procedural skills are not perceived as more challenging than content responses. 46 , 55 , 57 , 90 In such cases, confidence in explanations may simply reflect confirmation of the initial response, which is often made first and not reconsidered. However, when conceptual understanding is required, the need to justify an uncertain answer can deepen students’ insecurity, especially if they recognize a gap in their understanding. This difference in how explanation tiers are experienced may account for the contrasting confidence patterns observed across studies.
This was confirmed by comparison of confidence in correct (CFC) and incorrect responses (CFW). The statistical analysis showed meaningful differences in four items (see Table 4). Higher confidence, values exceeding 7 were observed for four items in the CS (Items 1, 4A, 4B, and 4C, see Table 3). In the ES, one additional item (Item 4D) reached this threshold. In these cases, over 70 % respondents were confident when correctly identifying values in tables, locating precise points in graphs, interpreting slopes, evaluating initial curve segments, and applying predictive reasoning with graphical data. In contrast, lower confidence levels for some items – despite correct answers – suggest that students found comparing data sets or trends in graphs more challenging or were unsure their answers were accurate and complete. When seeking a specific solution, students tend to be confident in their understanding of the underlying principle used to reach the result. In contrast, when comparing data, they may trust the principle but remain uncertain about whether they are selecting the correct data or applying the comparison correctly. All CFC values were above the midpoint (5) of the confidence scale, indicating that correct answers were unlikely to be due to guessing. 46 , 57 , 90
For incorrect answers (CFW), values were above midpoint for half of the CS items (Items 1, 2A, 2B, 3A) and for five of the seven ES items (all except 4B and 4D). In Items 4B and 4D, an understanding of the concept of solubility was essential. Without this understanding, solving these items would have been highly challenging, which students reflected in their confidence judgments (CJ). However, CFW results show that students remained relatively confident even when giving incorrect answers. 47 , 92 CFW values decreased compared to CFC in all cases except one (ES of Item 3A). In contrast, other studies 55 , 70 reported CFW values below or around the midpoint. This points to the aforementioned challenge of interpreting data compared to demonstrating knowledge. 90
5.3.2 Understanding student calibration when engaging with graphs and tables
This trend also appears in the mean confidence discrimination quotient (CDQ) values, which were consistently above zero (see Table 4). The mean CDQ values were 0.97 (CS) and 0.59 (ES). These results confirm the general expectation that students tend to be more confident when their answers are correct than when they are incorrect. 76
In the CS, students showed high accuracy in recognizing correct responses (CDQ > 1), particularly in Items 3B, 4A, and 4B. These items involved identifying and comparing data sets, locating precise values in a graph, and evaluating initial curve segments based on graph axes. In contrast, a significantly lower ability to distinguish correct answers (CDQ positive but below 0.5) was observed for two items within the Content Tier (Items 2A and 3A). These items also had lower average confidence values (CF < 6), indicating that students struggled to compare trends across two graphs or analyse two data sets in a table.
A similar pattern of lower CDQ values was observed for two items within the Explanation Tier (Items 3B and 4A). These items were characterized by a larger decline in success rates between the CS and ES, with differences of 15 and 16 number of correct responses, respectively (see Table 3). Students successfully solved tasks requiring comparison of two data sets in a table and identification of specific values in a graph but struggled to formulate accurate explanations. This suggests that when students give correct answers and feel confident, they also tend to express confidence in their explanations – even if those explanations are incomplete or brief.
Only one item (Item 3A) in the ES had a negative CDQ (−0.03), indicating slightly higher confidence in incorrect explanations than in correct ones. 46 , 57 This suggests that students had difficulty comparing values between two table columns and judging the credibility of their explanations. In seven cases, respondents provided overly general justifications that lacked sufficient detail, yet they still perceived them as credible.
Comparing confidence levels between correct and incorrect responders revealed that, in all cases, students with higher confidence generally performed better. Eight items revealed statistically significant differences between the two groups, with moderate to large effect sizes, indicating meaningful distinctions. These significant items are presented in Table 4. Consistent with earlier findings, these results show that tasks requiring extraction, comparison, and application of tabular or graphical data in scientific contexts (Items 1, 4A, 4B, 4C, and 4D) effectively distinguished between correct and incorrect responders.
Conversely, the remaining comparisons did not show statistically significant differences between the two groups. All had small or negligible effect sizes, indicating limited differentiation power.
To further examine confidence calibration, we analysed correlations between responses in the content and explanation tiers and the associated confidence judgments. 53 We also compared confidence levels between successful and unsuccessful students. The strongest correlations emerged in Items 1 and 4B. Students who performed well in the Content Score were also more likely to provide accurate explanations and report higher confidence. In Item 1, a strong positive correlation was found between CS and ES (ρ = 0.964, p < 0.001), indicating that the ability to classify air quality by comparing measured values to tabulated data was closely aligned with explanation quality. Solving the task correctly required not only data interpretation but also careful reading of the task assignment and adherence to the given instructions. The approach taken by students was evident in their explanations. Additionally, both CS and ES positively correlated with CJ (ρ = 0.472 and ρ = 0.481, both p < 0.001), suggesting that students were more confident when they understood both the content and the reasoning behind their answers. 46 , 63 Significant differences in confidence were also found between successful and unsuccessful students for CS (p < 0.001, r = 0.468) and ES (p = 0.003, r = 0.403). This suggests that successful students had significantly higher confidence judgments compared to their unsuccessful peers, which is consistent with results of tests evaluating conceptual understanding 55 , 57 albeit with a small to medium effect size.
Similarly, Item 4B revealed consistent, significant relationships among all three variables: CS-ES (ρ = 0.774, p < 0.001), CS-CJ (ρ = 0.493, p < 0.001), and ES-CJ (ρ = 0.427, p = 0.003). Students who correctly identified substances soluble in water at a given temperature – by interpreting curve positions relative to the axis – were more confident and performed well in the explanation tier. They could also clearly describe how to interpret the data. Confidence judgments were significantly higher for successful students than for unsuccessful ones in both CS (p < 0.001, r = 0.488) and ES (p = 0.004, r = 0.422) with small-to-medium effect sizes. This supports the view that students with strong content understanding are more likely to provide accurate explanations and appropriately express higher confidence. 46 , 55
In Item 3A, there was a moderate positive correlation between CS and ES (ρ = 0.392, p = 0.003), suggesting that students who answered correctly were also more likely to provide reasonable explanations when comparing two data sets in a table to determine whether vitamins intake met recommended levels. However, there was no significant correlation between CS and CJ, indicating that confidence did not align with performance for this task, as students may have been uncertain whether they were comparing data correctly. No statistically significant difference was found between the correct and incorrect solvers’ CJ in either CS (p = 0.369) or ES (p = 0.992) which was also reflected in negligible effect size for both cases. This suggests that students may have been miscalibrated (either overestimating or underestimating their understanding). 53 , 55
Item 4A demonstrated a moderate positive correlation between CS and ES (ρ = 0.445, p < 0.001) and between CS and CJ (ρ = 0.442, p < 0.001). Statistically significant difference was found only between students’ CJ for the content tier (p = 0.001, r = 0.438) with a small to moderate effect. In this item, most respondents successfully identified the most soluble substance under specific conditions (CS = 0.89) and were confident in their answers. However, their explanations were less clear, as reflected in lower ES and CJ values. 58 , 63
A similar pattern emerged in Item 4D, where significant correlations were found between CS and ES (ρ = 0.644, p < 0.001), CS and CJ (ρ = 0.382, p = 0.008), and ES and CJ (ρ = 0.360, p = 0.024). Statistically significant difference was found between the successful students’ CJ for both CS (p = 0.001, r = 0.378) and ES (p = 0.027, r = 0.355), although only with a small effect. In this most challenging item (CS = 0.29, ES = 0.15), students who successfully predicted the appearance of solutions based on graphical data were more likely to articulate their explanation and express confidence in their answers. In contrast, unsuccessful students were unsure of how to proceed and resorted to simplistic approaches or trial-and-error strategies, which did not lead to correct answers or explanations. These findings highlight the alignment between content mastery, explanation quality, and confidence, suggesting that students with stronger understanding were slightly more aware of their abilities.
In contrast, Items 2A and 2B showed non-significant correlations between CS and CJ (ρ = 0.195, p = 0.158 and ρ = 0.197, p = 0.166, respectively). The difference between the successful and unsuccessful students’ CJ were statistically insignificant in both cases (p = 0.156, p = 0.163 respectively). This indicates that students’ confidence was not reliably tied to their performance in verifying relationship between two variables based on reflecting potential miscalibration. Students who answered correctly were not necessarily more confident, and those who answered incorrectly did not consistently express lower confidence. 58 When comparing data trends, students often struggled to differentiate correct conclusions from incorrect ones. Incorrect answers typically lacked sufficient detail or referenced the wrong graph sections when describing the relationship between carbon dioxide concentration and average temperature. Nevertheless, students still perceived these responses as adequate.
Item 3B, which involved comparing concrete data sets in a table, exhibited no significant relationships among CS, ES, and CJ, with the highest correlation being ρ = 0.223 (p = 0.1109) between CS and CJ. Although the successful and unsuccessful students’ CJ did not differ significantly in either of the observed scores (p = 0.108, resp. p = 0.718), in case of CS a small effect-size (r = 0.221) was found suggesting a slightly better CJ of students successful in CS. However, this further emphasizes that, for some tasks, performance and confidence judgement were independent. While students were able to apply a comparative approach, they may have misinterpreted the data (e.g., failing to adjust vitamin intake based on exact food and drink doses) yet did not recognize their errors.
In Item 4C, only one student answered the Content Tier incorrectly. As a result, correlations between CS and ES or CS and CJ are not meaningful. The ES-CJ correlation was moderate and significant (ρ = 0.392, p = 0.006). The students successful in ES showed significantly higher CJ (p = 0.007, r = 0.388) then the unsuccessful, although the effect of the difference was small. This result suggests that while content performance did not predict explanation quality, students who provided better explanations were more confident.
Overall, the GATE test results revealed several key trends. First, strong CS often supported better explanations and higher confidence 58 , 63 particularly in Items 1, 4B, and 4D, where all three variables were closely aligned. Second, task complexity appeared to influence calibration, with items like 2A, 2B, and 3B showing weak or non-significant correlations. This suggests that students’ confidence did not consistently reflect their performance, highlighting areas where miscalibration may occur. 50 , 53 , 55 , 58 , 63
From an educational perspective, these findings underscore the importance of promoting reflective practices. Encouraging students to evaluate their understanding after completing tasks can help them develop more accurate self-assessment skills. Moreover, explanation-based assessments can provide richer insights into student understanding, as seen in items where ES correlated with both CS and CJ.
6 Limitations
The sample size of 55 first-year pre-service chemistry teachers may limit the generalizability of the findings. However, the inclusion of students from four universities enhances the study’s relevance to a broader population of future educators. The instrument demonstrated good reliability, supporting its use in selecting students for the follow-up study. Additionally, the smaller sample allowed for a more detailed analysis of responses and explanations, which will be explored in future research.
A key distinction of this study is its use of the four-tier GATE test with open-ended responses, unlike most research relying on multiple-choice formats. This approach emphasized individual reasoning but introduced a potential limitation – some responses may have been deemed insufficient due to unclear articulation rather than a lack of understanding.
Another limitation is the test’s scope. With only nine items, it is not a comprehensive diagnostic tool for data interpretation skills. However, it effectively targets key sub-skills such as reading values, comparing data, and predicting trends. It does not, however, assess graph and table creation, a crucial component of graphical literacy. Expanding the test would provide a more complete assessment but would also increase the time required for administration and evaluation.
Despite these limitations, the GATE test serves as a valuable starting point for assessing foundational data interpretation skills. Its findings can guide further research and pedagogical improvements in training pre-service teachers to work with graphical and tabular data effectively.
7 Conclusions and implications
This study employed the GATE test to examine pre-service chemistry teachers’ ability to interpret data from graphs and tables, justify their reasoning, and monitor their confidence. The instrument showed strong psychometric qualities, including excellent reliability and effective item discrimination, confirming its value as a diagnostic tool for identifying students’ strengths and weaknesses in working with data. Variability in item difficulty and discrimination power highlighted specific areas for refinement. The multi-tier format effectively captured students’ reasoning processes and confidence levels, underlining the need for further research into explanatory skills. The results confirm that even scientifically trained individuals can struggle with graph interpretation, suggesting that pre-service teacher training must explicitly address these challenges to better prepare future educators.
Students performed moderately well in interpreting non-textual components, with a 66 % success rate in the Content Tier. Most were able to extract information from tables and graphs, but applying this information was more difficult – especially in prediction or comparison tasks. Instruction should therefore focus not only on data extraction but also on deeper interpretation and reasoning. Active learning strategies, such as student-generated graphs and tables, 8 can strengthen conceptual connections.
The analysis revealed a notable confidence–performance relationship. While correct answers were generally associated with higher confidence, several cases showed overconfidence in incorrect responses or underconfidence in correct ones. This miscalibration suggests a need for targeted metacognitive training.
7.1 Implications for teacher education and curriculum design
Embed explicit instruction on interpreting and reasoning with data-rich visuals across courses, rather than treating it as an assessment-only skill.
Incorporate multi-tier tasks (answer + explanation + confidence judgment) in assignments and exams to develop explanatory reasoning and metacognitive monitoring.
Train students in confidence calibration by having them predict and then reflect on their accuracy, reducing overconfidence in incorrect answers.
Use scaffolded tasks progressing from simple data retrieval to complex comparative and predictive reasoning to build competence step-by-step.
7.2 Implications for assessment practice
Adopt multi-tier assessments to separate content knowledge from explanation quality and confidence, revealing hidden weaknesses not visible in single-answer formats.
Use GATE results to inform targeted feedback, particularly for students who recall data but cannot justify it.
Analyse performance patterns to revise curricula, focusing on representations (e.g., multi-graph comparisons) that consistently cause difficulty.
7.3 Implications for research and policy
Adapt the GATE model to other STEM disciplines to expand understanding of visual data literacy across contexts.
Encourage policymakers and accreditation bodies to set explicit benchmarks for graph and table interpretation in teacher training standards.
Explore integration of GATE-style assessments with learning analytics tools (e.g., eye-tracking, digital response tracking) to provide adaptive feedback in real time.
-
Research ethics: The study was conducted within the first authors dissertation project approved by the Ethics Committee of Charles University, Faculty of Education (protocol code: UKPedF/590349/2024).
-
Informed consent: Informed consent was obtained from all individuals included in this study.
-
Author contributions: All authors have accepted responsibility for the entire content of this manuscript and approved its submission.
-
Use of Large Language Models, AI and Machine Learning Tools: AI tools were used for proofreading.
-
Conflict of interest: The authors state no conflict of interest.
-
Research funding: This study was supported by the Charles University Grant Agency (grant nr. 608625 Exploring the Impact of Non-Textual Components in Chemistry Learning Materials on Students’ Ability to Work with Them) and by the Charles University’s project Cooperatio.
-
Data availability: The data that support the findings of this study are available on request from the corresponding author, LH.
References
1. Chingos, M. M.; Whitehurst, G. J. Choosing Blindly: Instructional Materials, Teacher Effectiveness, and the Common Core; Washington, D.C., 2012.Search in Google Scholar
2. Lepik, M.; Grevholm, B.; Viholainen, A. Using Textbooks in the Mathematics Classroom – The Teachers’ View. Nord. Stud. Math. Educ. 2015, 20 (3-4), 129–156; https://doi.org/10.7146/nomad.v20i3-4.148695.Search in Google Scholar
3. Ravanis, K. Research Trends and Development Perspectives in Early Childhood Science Education: An Overview. Edu. Sci. 2022, 12 (7), 11. Editorial Material; https://doi.org/10.3390/educsci12070456.Search in Google Scholar
4. Johnstone, A. H. Why is Science Difficult to Learn? Things are Seldom What they Seem. J. Comput. Assisted Learn. 1991, 7 (2), 75–83; https://doi.org/10.1111/j.1365-2729.1991.tb00230.x.Search in Google Scholar
5. Eilam, B.; Gilbert, J. K. The Significance of Visual Representations in the Teaching of Science. In Sc. Teach. Us. Vis. Repr.; Eilam, B.; Gilbert, J. K., Eds.; Springer International Publishing: Cham, 2014; pp 3–28.10.1007/978-3-319-06526-7_1Search in Google Scholar
6. OECD. PISA 2006: Science Competencies for Tomorrow’s World: Volume 1: Analysis. OECD; OECD Publishing: Paris, 2007.10.1787/9789264040014-enSearch in Google Scholar
7. Glazer, N. Challenges with Graph Interpretation: A Review of the Literature. Sci. Educ. 2011, 47 (2), 183–210; https://doi.org/10.1080/03057267.2011.605307.Search in Google Scholar
8. Bowen, G. M.; Roth, W.-M. Why Students May not Learn to Interpret Scientific Inscriptions. Res. Sci. Educ. 2002, 32 (3), 303–327.10.1023/A:1020833231966Search in Google Scholar
9. Burke, M. C. A Mathematician’s Proposal; The Carnegie Foundation for the Advancement of Teaching: Stanford, 2007.Search in Google Scholar
10. Friel, S. N.; Curcio, F. R.; Bright, G. W. Making Sense of Graphs: Critical Factors Influencing Comprehension and Instructional Implications. J. Res. Math. Educ. 2001, 32 (2), 124–158. https://doi.org/10.2307/749671 (acccessed 23 February 2025).JSTOR.Search in Google Scholar
11. Tairab, H. H.; Khalaf Al-Naqbi, A. K. How do Secondary School Science Students Interpret and Construct Scientific Graphs? J. Biol. Educ. 2004, 38 (3), 127–132; https://doi.org/10.1080/00219266.2004.9655920.Search in Google Scholar
12. OECD. PISA 2015 Assessment and Analytical Framework: Science, Reading, Mathematics and Financial Literacy; OECD Publishing: Paris, 2016.Search in Google Scholar
13. OECD. PISA 2022 Assessment and Analytical Framework; OECD Publishing: Paris, 2023.Search in Google Scholar
14. LaDue, N. D.; Libarkin, J. C.; Thomas, S. R. Visual Representations on High School Biology, Chemistry, Earth Science, and Physics Assessments. J. Res. Sci. Teach. 2015, 24 (6), 818–834; https://doi.org/10.1007/s10956-015-9566-4.Search in Google Scholar
15. NGSS. Next Generation Science Standards: For States, by States; The National Academies Press: Washington, D.C., 2013.Search in Google Scholar
16. Bragdon, D.; Pandiscio, E.; Speer, N. University Students’ Graph Interpretation and Comprehension Abilities. Investig. Math. Learn. 2019, 11 (4), 275–290; https://doi.org/10.1080/19477503.2018.1480862.Search in Google Scholar
17. Cebesoy, Ü.; Yeniterzi, B. 7th Grade Students’ Mathematical Difficulties in Force and Motion Unit. Turk. J. Educ. 2016, 5 (1), 18–32; https://doi.org/10.19128/turje.51242.Search in Google Scholar
18. Mzileni, T. Exploring the ICT Integration in Chemistry Practical Work; Faculty of Humanities, University of the Witwatersrand: Johannesburg, 2022.Search in Google Scholar
19. Nasor, A.; Lutfi, A. L.; Prahani, B. K. Science Literacy Profile of Junior High School Students on Context, Competencies, and Knowledge. Int. J. Rec. Educ. Res. 2023, 4 (6), 847–861. https://doi.org/10.46245/ijorer.v4i6.436 (acccessed 23 February 2025).Search in Google Scholar
20. Dreyfus, T.; Eisenberg, T. On Difficulties With Diagrams: Theoretical Issues. In Proceedings of the 14th Annual Conference of the International Group for the Psychology of Mathematics Education; Program Committee of the 14th PME Conference, Mexico: Oaxtepec, Vol. 1, 1990; pp 27–36.Search in Google Scholar
21. Hamerská, L.; Koperová, D.; Rusek, M. Seeing the Bigger Picture: Pilot Study on Graph and Table Interpretation of Pre-Service Chemistry Teachers. Chem.-Didact.-Ecol.-Metrol. 2025; https://doi.org/10.2478/cdem-2025-0002.Search in Google Scholar
22. Anderson, L. W.; Krathwohl, D. R. A Taxonomy for Learning, Teaching, and Assessing: A Revision of Bloom’s Taxonomy of Educational Objectives: Complete Edition; Addison Wesley Longman, Inc.: New York, 2001.Search in Google Scholar
23. Roth, W.-M.; Bowen, G. M. Professionals Read Graphs: A Semiotic Analysis. J. Res. Math. Educ. 2001, 32 (2), 159–194. https://doi.org/10.2307/749672 (acccessed 01 August 2025).JSTOR.Search in Google Scholar
24. Shah, P.; Hoeffner, J. Review of Graph Comprehension Research: Implications for Instruction. Educ. Psy. Rev. 2002, 14 (1), 47–69.10.1023/A:1013180410169Search in Google Scholar
25. Chen, H. J.; She, J. L.; Chou, C. C.; Tsai, Y. M.; Chiu, M. H. Development and Application of a Scoring Rubric for Evaluating Students’ Experimental Skills in Organic Chemistry: An Instructional Guide for Teaching Assistants. J. Chem. Educ. 2013, 90 (10), 1296–1302; https://doi.org/10.1021/ed101111g.Search in Google Scholar
26. Rusek, M.; Vojíř, K.; Šubová, Š. Lower-Secondary School Chemistry Textbooks’ Didactic Equipment. Chem.-Did.-Ecol.-Metrol. 2020, 25 (1–2), 69–77; https://doi.org/10.2478/cdem-2020-0004.Search in Google Scholar
27. Tang, K.-S. Distribution of Visual Representations Across Scientific Genres in Secondary Science Textbooks: Analysing Multimodal Genre Pattern of Verbal-Visual Texts. Res. Sci. Educ. 2023, 53 (2), 357–375; https://doi.org/10.1007/s11165-022-10058-6.Search in Google Scholar
28. Van Rooy, W. S.; Chan, E. Multimodal Representations in Senior Biology Assessments: A Case Study of NSW Australia. Int. J. Sci. Math. Educ. 2017, 15 (7), 1237–1256; https://doi.org/10.1007/s10763-016-9741-y.Search in Google Scholar
29. Bergqvist, A.; Chang Rundgren, S.-N. The Influence of Textbooks on Teachers’ Knowledge of Chemical Bonding Representations Relative to Students’ Difficulties Understanding. Res. Sci. Technol. Educ. 2017, 35 (2), 215–237; https://doi.org/10.1080/02635143.2017.1295934.Search in Google Scholar
30. Vojíř, K.; Rusek, M. Opportunities for Learning: Analysis of Czech Lower-Secondary Chemistry Textbook Tasks. Act. Chim. Slov. 2022, 69 (2), 359; https://doi.org/10.17344/acsi.2021.7245.Search in Google Scholar PubMed
31. Vojíř, K.; Rusek, M. Of Teachers and Textbooks: Lower Secondary Teachers’ Perceived Importance and Use of Chemistry Textbook Components. Chem. Educ. Res. Pract. 2022, 23 (4), 786–798; https://doi.org/10.1039/D2RP00083K.Search in Google Scholar
32. Dhakulkar, A.; Nagarjuna, G. In Analysis of Graphs in School Textbooks; Chunawala, S.; Kharatmal, M., Eds.; MacMillan: Mumbai, Vol. 4, 2011; pp 127–131.Search in Google Scholar
33. Paoletti, T.; Lee, H. Y.; Rahman, Z.; Vishnubhotla, M.; Basu, D. Comparing Graphical Representations in Mathematics, Science, and Engineering Textbooks and Practitioner Journals. Int. J. Math. Educ. Sci. Tec. 2022, 53 (7), 1815–1834; https://doi.org/10.1080/0020739X.2020.1847336.Search in Google Scholar
34. Slough, S. W.; McTigue, E. Development of the Graphical Analysis Protocol (GAP) for Eliciting the Graphical Demands of Science Textbooks. In Critical Analysis of Science Textbooks: Evaluating instructional effectiveness; Khine, M. S., Ed.; Springer Netherlands: Dordrecht, 2013; pp 17–30.10.1007/978-94-007-4168-3_2Search in Google Scholar
35. Khine, M. S.; Liu, Y. Descriptive Analysis of the Graphic Representations of Science Textbooks. Eur. J. STEM Educ. 2017, 2 (3), 6; https://doi.org/10.20897/ejsteme/81285.Search in Google Scholar
36. Klein, P.; Küchemann, S.; Brückner, S.; Zlatkin-Troitschanskaia, O.; Kuhn, J. Student Understanding of Graph Slope and Area Under a Curve: A Replication Study Comparing First-Year Physics and Economics Students. Phys. Rev. Phys. Educ. Res. 2019, 15 (2), 020116; https://doi.org/10.1103/PhysRevPhysEducRes.15.020116.Search in Google Scholar
37. Klein, P.; Müller, A.; Kuhn, J. Assessment of Representational Competence in Kinematics. Phys. Rev. Phys. Educ. Res. 2017, 13 (1), 010132; https://doi.org/10.1103/PhysRevPhysEducRes.13.010132.Search in Google Scholar
38. Küchemann, S.; Malone, S.; Edelsbrunner, P.; Lichtenberger, A.; Stern, E.; Schumacher, R.; Brünken, R.; Vaterlaus, A.; Kuhn, J. Inventory for the Assessment of Representational Competence of Vector Fields. Phys. Rev. Phys. Educ. Res. 2021, 17 (2), 020126; https://doi.org/10.1103/PhysRevPhysEducRes.17.020126.Search in Google Scholar
39. Susac, A.; Planinic, M.; Bubic, A.; Jelicic, K.; Palmovic, M. Effect of Representation Format on Conceptual Question Performance and Eye-Tracking Measures. Phys. Rev. Phys. Educ. Res. 2023, 19 (2), 020114; https://doi.org/10.1103/PhysRevPhysEducRes.19.020114.Search in Google Scholar
40. Cooper, M. M.; Stowe, R. L. Chemistry Education Research—From Personal Empiricism to Evidence, Theory, and Informed Practice. Chem. Rev. 2018, 118 (12), 6053–6087; https://doi.org/10.1021/acs.chemrev.8b00020.Search in Google Scholar PubMed
41. Tóthová, M.; Rusek, M. Eye tracking in Science Education Research: Comprehensive Literature Review. Sci. Educ. 2025; https://doi.org/10.1007/s11191-025-00644-1.Search in Google Scholar
42. Espinosa, A. A.; Koperová, D.; Kuhnová, M.; Rusek, M. Preservice Chemistry Teachers’ Conceptual Understanding and Confidence Judgment: Insights from a Three-Tier Chemistry Concept Inventory. J. Chem. Educ. 2024, 102 (1), 53–65; https://doi.org/10.1021/acs.jchemed.4c01146.Search in Google Scholar
43. Chang, H. P.; Chen, J. Y.; Guo, C. J.; Chen, C. C.; Chang, C. Y.; Lin, S. H.; Su, W. J.; Lain, K. D.; Hsu, S. Y.; Lin, J. L.; Cheng, Y.; Wang, L.; Tseng, Y. Investigating Primary and Secondary Students’ Learning of Physics Concepts in Taiwan. Int. J. Sci. Educ. 2007, 29 (4), 465–482; https://doi.org/10.1080/09500690601073210.Search in Google Scholar
44. Peşman, H.; Eryılmaz, A. Development of a Three-Tier Test TO Assess Misconceptions About Simple Electric Circuits. Educ. Res. J. 2010, 103 (3), 208–222; https://doi.org/10.1080/00220670903383002.Search in Google Scholar
45. Kaltakci-Gurel, D.; Eryilmaz, A.; McDermott, L. C. Development and Application of a Four-Tier Test to Assess Pre-Service Physics Teachers’ Misconceptions About Geometrical Optics. Res. Sci. Technol. Educ. 2017, 35 (2), 238–260; https://doi.org/10.1080/02635143.2017.1310094.Search in Google Scholar
46. Caleon, I.; Subramaniam, R. Development and Application of a Three‐Tier Diagnostic Test to Assess Secondary Students’ Understanding of Waves. Int. J. Sci. Educ. 2010, 32 (7), 939–961; https://doi.org/10.1080/09500690902890130.Search in Google Scholar
47. Yang, D.-C.; Lin, Y.-C. Assessing 10- to 11-Year-Old Children’s Performance and Misconceptions in Number Sense Using a Four-Tier Diagnostic Test. Educ. Res. 2015, 57 (4), 368–388; https://doi.org/10.1080/00131881.2015.1085235.Search in Google Scholar
48. Mathabathe, K. C.; Potgieter, M. Metacognitive Monitoring and Learning Gain in Foundation Chemistry. Chem. Educ. Res. Pract. 2014, 15 (1), 94–104; https://doi.org/10.1039/C3RP00119A.Search in Google Scholar
49. Arslan, H. O.; Cigdemoglu, C.; Moseley, C. A Three-Tier Diagnostic Test to Assess Pre-Service Teachers’ Misconceptions About Global Warming, Greenhouse Effect, Ozone Layer Depletion, and Acid Rain. Int. J. Sci. Educ. 2012, 34 (11), 1667–1686; https://doi.org/10.1080/09500693.2012.680618.Search in Google Scholar
50. Hermita, N.; Suhandi, A.; Syaodih, E.; Samsudin, A.; Johan, H.; Rosa, F.; Setyaningsih, R.; Safitri, D.; Sapriadil Constructing and Implementing a Four Tier Test About Static Electricity to Diagnose Pre-Service Elementary School Teacher’ Misconceptions. J. Phys.: Conf. Ser. 2017, 895, 012167; https://doi.org/10.1088/1742-6596/895/1/012167.Search in Google Scholar
51. Kirbulut, Z. D.; Geban, O. Using Three-Tier Diagnostic Test to Assess Students’ Misconceptions of States of Matter. Eurasia J. Math. Sci Technol. Educ. 2014, 10 (5), 509–521; https://doi.org/10.12973/eurasia.2014.1128a.Search in Google Scholar
52. Milenković, D. i. D.; Hrin, T. N.; Segedinac, M. D.; Horvat, S. a. Development of a Three-Tier Test as a Valid Diagnostic Tool for Identification of Misconceptions Related to Carbohydrates. J. Chem. Educ. 2016, 93 (9), 1514–1520; https://doi.org/10.1021/acs.jchemed.6b00261.Search in Google Scholar
53. Rusek, M.; Tóthová, M.; Chytrý, V.; Říčan, J. Students’ Ability to Work with the Periodic Table: The Use of Three-Tier Tasks. J. Chem. Educ. 2024, 101 (11), 4590–4602; https://doi.org/10.1021/acs.jchemed.4c00485.Search in Google Scholar
54. Liampa, V.; Malandrakis, G. N.; Papadopoulou, P.; Pnevmatikos, D. Development and Evaluation of a Three-Tier Diagnostic Test to Assess Undergraduate Primary Teachers’ Understanding of Ecological Footprint. Res. Sci. Educ. 2019, 49 (3), 711–736; https://doi.org/10.1007/s11165-017-9643-1.Search in Google Scholar
55. Putica, K. B. Development and Validation of a Four-Tier Test for the Assessment of Secondary School Students’ Conceptual Understanding of Amino Acids, Proteins, and Enzymes. Res. Sci. Educ. 2023, 53 (3), 651–668; https://doi.org/10.1007/s11165-022-10075-5.Search in Google Scholar PubMed PubMed Central
56. Putica, K. B. Identification of High-School Students’ Conceptual Challenges Related to Alcohols and Carbonyl Compounds by Means of a Four-Tier Diagnostic Test. J. Chem. Educ. 2024, 101 (4), 1442–1456; https://doi.org/10.1021/acs.jchemed.3c01343.Search in Google Scholar
57. Yan, Y. K.; Subramaniam, R. Using a Multi-Tier Diagnostic Test to Explore the Nature of Students’ Alternative Conceptions on Reaction Kinetics. Chem. Educ. Res. Pract. 2018, 19 (1), 213–226; https://doi.org/10.1039/c7rp00143f.Search in Google Scholar
58. Caleon, I.; Subramaniam, R. Do Students Know What They Know and What They Don’t Know? Using a Four-Tier Diagnostic Test to Assess the Nature of Students’ Alternative Conceptions. Res. Sci. Educ. 2010, 40 (3), 313–337; https://doi.org/10.1007/s11165-009-9122-4.Search in Google Scholar
59. Puustinen, M.; Pulkkinen, L. Models of Self-Regulated Learning: A Review. Scand. J. Educ. Res. 2001, 45 (3), 269–286; https://doi.org/10.1080/00313830120074206.Search in Google Scholar
60. Hacker, D. J. Definitions and Empirical Foundations. In Metacog. Educ. T. Pract.; Dunlosky, J.; Graesser, A. C.; Hacker, D., Eds.; Routledge: New York, 1998; pp 1–23.Search in Google Scholar
61. Efklides, A. Affect, Epistemic Emotions, Metacognition, and Self-Regulated Learning. Teach. Coll. Rec. Voice Scholarship Educ. 2017, 119, 1–22; https://doi.org/10.1177/016146811711901302.Search in Google Scholar
62. Nelson, T. O.; Narens, L. Why Investigate Metacognition; MIT Press: Cambridge, MA, 1994; pp 1–25.10.7551/mitpress/4561.003.0003Search in Google Scholar
63. Wu, M.; Tian, P. Y.; Sun, D. E.; Feng, D.; Luo, M. Evaluating Students’ Conceptual Understanding of Isomers Based on a Four-Tier Diagnostic Tool in Upper Secondary Schools. Int. J. Sci. Math. Educ. 2024, 41, 907. Early Access; https://doi.org/10.1007/s10763-024-10494-y.Search in Google Scholar
64. Efklides, A. Metacognition and Affect: What Can Metacognitive Experiences Tell us About the Learning Process? Educ. Res. Rev. 2006, 1 (1), 3–14; https://doi.org/10.1016/j.edurev.2005.11.001.Search in Google Scholar
65. Butterfield, B.; Metcalfe, J. The Correction of Errors Committed with High Confidence. Metacogn. Learn. 2006, 1 (1), 69–84; https://doi.org/10.1007/s11409-006-6894-z.Search in Google Scholar
66. Driver, J. Modesty and Ignorance. J. Ethics 1999, 109 (4), 827–834; https://doi.org/10.1086/233947.Search in Google Scholar
67. Bol, L.; Hacker, D. J. Calibration Research: Where do we Go from Here? Front. Psychol. 2012, 3, 229. Hypothesis and Theory; https://doi.org/10.3389/fpsyg.2012.00229.Search in Google Scholar PubMed PubMed Central
68. Cordova, J. R.; Sinatra, G. M.; Jones, S. H.; Taasoobshirazi, G.; Lombardi, D. Confidence in Prior Knowledge, Self-Efficacy, Interest and Prior Knowledge: Influences on Conceptual Change. Contemp. Educ. Psychol. 2014, 39 (2), 164–174; https://doi.org/10.1016/j.cedpsych.2014.03.006.Search in Google Scholar
69. Tumanggor, A. M. R.; Supahar; Kuswanto, H.; Ringo, E. S. Using Four-Tier Diagnostic Test Instruments to Detect Physics Teacher Candidates’ Misconceptions: Case of Mechanical Wave Concepts. J. Phys.: Conf. Ser. 2020, 1440 (1), 012059; https://doi.org/10.1088/1742-6596/1440/1/012059.Search in Google Scholar
70. Sreenivasulu, B.; Subramaniam, R. University Students’ Understanding of Chemical Thermodynamics. Int. J. Sci. Educ. 2013, 35 (4), 601–635; https://doi.org/10.1080/09500693.2012.683460.Search in Google Scholar
71. Dinsmore, D. L.; Parkinson, M. M. What are Confidence Judgments Made of? Students’ Explanations for their Confidence Ratings and What That Means for Calibration. Learn. Instr. 2013, 24, 4–14; https://doi.org/10.1016/j.learninstruc.2012.06.001.Search in Google Scholar
72. Finch, E.; Fleming, J.; Brown, K.; Lethlean, J.; Cameron, A.; McPhail, S. M. The Confidence of Speech-Language Pathology Students Regarding Communicating with People with Aphasia. BMC Med. Educ. 2013, 13 (1), 92; https://doi.org/10.1186/1472-6920-13-92.Search in Google Scholar PubMed PubMed Central
73. Frýzková, M.; Palečková, J. Přírodovědné úlohy výzkumu PISA. [Science tasks from the PISA research] ÚIV, 2007.Search in Google Scholar
74. Mitran, K.; Nagarajah, S.; Ponnudurai, G.; Judsonj, P. A. The Levels of Difficulty and Discrimination Indices in Type A Multiple Choice Questions of Pre-Clinical Semester 1 Multidisciplinary Summative Tests. IeJSME 2009, 3 (1), 2–7; https://doi.org/10.56026/imu.3.1.2.Search in Google Scholar
75. Tóthová, M.; Rusek, M. “Do You Just Have to Know That?” Novice and Experts’ Procedure When Solving Science Problem Tasks. Front. Educ. 2022, 7, 1051098; https://doi.org/10.3389/feduc.2022.1051098.Search in Google Scholar
76. Lundeberg, M. A.; Fox, P. W.; Brown, A. C.; Elbedour, S. Cultural Influences on Confidence: Country and Gender. J. Educ. Psychol. 2000, 92 (1), 152–159; https://doi.org/10.1037/0022-0663.92.1.152.Search in Google Scholar
77. Stankov, L.; Crawford, J. D. Self-Confidence and Performance on Tests of Cognitive Abilities. J. Intell. 1997, 25 (2), 93–109.10.1016/S0160-2896(97)90047-7Search in Google Scholar
78. Cohen, J. A Power Primer. Psychol. Bull. 1992, 112 (1), 155; https://doi.org/10.1037//0033-2909.112.1.155.Search in Google Scholar PubMed
79. Friel, S. N.; Bright, G. W. Building a Theory of Graphicacy: How do Students Read Graphs? In Annual Meeting of AERA; ERIC Document Reproduction Service: New York, 1996.Search in Google Scholar
80. Planinic, M.; Milin-Sipus, Z.; Katic, H.; Susac, A.; Ivanjek, L. Comparison of Student Understanding of Line Graph Slope in Physics and Mathematics. Int. J. Sci. Math. Educ. 2012, 10 (6), 1393–1414; https://doi.org/10.1007/s10763-012-9344-1.Search in Google Scholar
81. Gardner, S. M.; Angra, A.; Harsh, J. A. Supporting Student Competencies in Graph Reading, Interpretation, Construction, and Evaluation. CBE Life Sci. Educ. 2024, 23 (1), fe1; https://doi.org/10.1187/cbe.22-10-0207.Search in Google Scholar PubMed PubMed Central
82. Sharma, S. V. High School Students Interpreting Tables and Graphs: Implications for Research. Int. J. Sci. Math. Educ. 2006, 4 (2), 241–268; https://doi.org/10.1007/s10763-005-9005-8.Search in Google Scholar
83. Tiro, M. A.; Aidid, M. K.; Ahmar, A. S. Exploration of Table and Graph Literacy of Statistics Student at Universitas Negeri Makassar. J. Phys.:Conf. Ser. 2018, 1040 (1), 012036; https://doi.org/10.1088/1742-6596/1040/1/012036.Search in Google Scholar
84. Abd Hamid, H.; Idris, N.; Tapsir, R. Students’ Use of Graphs in Understanding the Concepts of Derivative. Southeast Asian Math. Educ. J. 2019, 9 (1), 3–16; https://doi.org/10.46517/seamej.v9i1.69.Search in Google Scholar
85. Ivanjek, L.; Susac, A.; Planinic, M.; Andrasevic, A.; Milin-Sipus, Z. Student Reasoning about Graphs in Different Contexts. Phys. Rev. Phys. Educ. Res. 2016, 12 (1), 010106; https://doi.org/10.1103/PhysRevPhysEducRes.12.010106.Search in Google Scholar
86. Lai, K.; Cabrera, J.; Vitale, J. M.; Madhok, J.; Tinker, R.; Linn, M. C. Measuring Graph Comprehension, Critique, and Construction in Science. J. Res. Sci. Teach. 2016, 25 (4), 665–681; https://doi.org/10.1007/s10956-016-9621-9.Search in Google Scholar
87. Ammase, A.; Siahaan, P.; Fitriani, A. Identification of Junior High School Students’ Misconceptions on Solid Matter and Pressure Liquid Substances with Four Tier Test. In ICMScE, Univ Pendidikan Indonesia, Sch Postgraduate Studies, Bandung, INDONESIA, May 05, 2018, Vol. 1157; Iop Publishing Ltd: Bristol, 2019.10.1088/1742-6596/1157/2/022034Search in Google Scholar
88. Cetin-Dindar, A.; Geban, O. Development of a Three-Tier Test to Assess High School Students’ Understanding of Acids and Bases. In WCES, Bahcesehir Univ, Istanbul, TURKEY; Elsevier Science Bv: Amsterdam, 2011; Vol. 15; pp. 600–604.10.1016/j.sbspro.2011.03.147Search in Google Scholar
89. Aydeniz, M.; Bilican, K.; Kirbulut, Z. D. Exploring Pre-Service Elementary Science Teachers’ Conceptual Understanding of Particulate Nature of Matter Through Three-Tier Diagnostic Test. Int. J. Educ. Math. Sci. Technol. 2017, 5 (3), 221–234; https://doi.org/10.18404/ijemst.296036.Search in Google Scholar
90. Yang, D. C. Investigating the Differences Between Confidence Ratings in the Answer and Reason Tiers in Fourth Graders via Online Four-Tier Test. Stud. Educ. Eval. 2022, 72, 10; https://doi.org/10.1016/j.stueduc.2022.101127.Search in Google Scholar
91. Sianturi, I. A. J.; Ismail, Z.; Yang, D.-C. Examining Fifth Graders’ Conceptual Understanding of Numbers and Operations Using an Online Three-Tier Test. Math. Educ. Res. J. 2024, 36 (2), 399–423; https://doi.org/10.1007/s13394-023-00452-2.Search in Google Scholar
92. Kiray, S. A.; Simsek, S. Determination and Evaluation of the Science Teacher Candidates’ Misconceptions About Density by Using Four-Tier Diagnostic Test. Int. J. Sci. Math. Educ. 2021, 19 (5), 935–955; https://doi.org/10.1007/s10763-020-10087-5.Search in Google Scholar
Supplementary Material
This article contains supplementary material (https://doi.org/10.1515/cti-2025-0022).
© 2025 the author(s), published by De Gruyter, Berlin/Boston
This work is licensed under the Creative Commons Attribution-NonCommercial-NoDerivatives 4.0 International License.
Articles in the same Issue
- Frontmatter
- Editorial
- Editorial overview of the “16 European Conference on Research in Chemical Education” ECRICE 2024 special issue
- Special Issue Papers
- Assessing experimental activities in chemistry instruction: a systematic review of available tools
- Scaffolding self-regulated problem solving: the influence of content-independent metacognitive prompts on students’ general problem-solving skills
- Promotion of self-regulated learning in a digital learning environment with the help of learning transparency
- Can chemistry knowledge influence student behavior? A neuropedagogy-based intervention as good practice to address cognitive and affective learning factors
- Using green and sustainable chemistry practical activities in Hungarian classrooms: barriers and opportunities
- The implementation of practical work in chemistry, along with the principles of green chemistry and sustainable chemistry, in Portugal
- Integrating green chemistry into Austrian secondary education using the context of wood biorefinery
- How green is green chemistry? Exploring the experiences and views of Turkish chemistry teachers on practical activities including green and sustainable chemistry
- High school chemistry teachers’ attitudes toward incorporating environmental education topics into the chemistry curriculum in Israel
- Exploring cognitive load dynamics with an AI-based voice assistant in high school chemistry experiments
- Comparing cognitive load in chemical and mathematical arithmetic tasks using eye-tracking and self-reports
- Measuring pre-service chemistry teachers’ graph and table interpretation skills: when performance meets confidence
- Vapes – a sustainable alternative?! – Promotion of socioscientific decision making through self-regulated learning approaches in sustainability contexts
- Factors influencing exposure to and consumption of scientific content on social media: insights from a collaborative world café discussion with school students