Relationship between fatigue crack threshold Kmax,th and K1SCC
-
Asuri K. Vasudevan
 ,
Daniel Kujawski
,
Daniel Kujawski

Abstract
This article describes the relationship that relates the static threshold parameter of K1SCC (at ∼10−10 m/s) to ΔKth and Kmax,th (at ∼10−10 m/cycle) under fatigue load at high R-ratio like R = 0.85. At these high R-ratios (>0.75), applied Kmax > K1SCC and the fracture path has a larger component of static fracture. 5083 Al alloy is adapted as an example to demonstrate this relationship at room temperature their relationship with and without GB-β anodic precipitates in inert and a 3.5 % NaCl solution environments. We are interested in the mechanical cyclic ΔKth and Kmax,th and quasi-static KISCC driving forces affecting the damage in the presence of a chemical environment due to anodic dissolution of the GB-β precipitates. Detailed discussions involve how these parameters are interrelated.
1 Introduction
Subcritical crack initiation/growth in aqueous chemical environments is a time-dependent process to allow chemical reactions with the crack tip. In general, chemical reaction alone is considered to be not dependent on applied stress to give a crack extension. Chemical reaction decreases the needed applied stress to allow the crack extension to a lower stress level. For a given alloy, the applied tensile stress, concentration of the solution, and the nature of the embrittling chemical species all affect the crack nucleation and growth. All these factors give rise to a specific threshold for the static and the cyclic loading cases. These threshold parameters (K1SCC, ΔKth, Kmax,th) can vary as a function of the embrittling element that affects the crack tip plasticity. Corrosive environment can enhance dislocation nucleation and its mobility to result in either the GB or cleavage crack nucleation by reducing the apparent surface energy. The local crack tip deformation that is affected by phys-adsorption or chemisorption in the chemical environment reduces the resistance to deformation. This can affect the local deformation by building internal stresses and their gradients to form a microcrack at a subcritical growth level (Sadananda and Vasudevan 2011). Thus, the occurrence of environmental fracture is related to limiting the overall plasticity in the alloy and the ability of the material to absorb energy. The alloy microstructural feature that promotes the GB mode of fracture relies on the criterion for the stability of homogeneous deformation and competitive local stresses at the weak link areas of GB. Such a GB failure is energetically in competition with continued plastic flow after the sample has acquired enough strain. The environment just helps to curtail the plastic stress and strain of the alloy, depending on the alloy YS and work hardening rates.
Thus, the fracture of materials is preceded by subcritical crack growth (SCG) (in vacuum or in a chemical environment) originating from a precrack or internal flaws contained in the materials. This is identified with the process of slow crack growth in materials subjected to rising static or cyclic load. This phenomenon deals with a combined interaction of loading, material and environment that determines the overall crack initiation and growth characteristics. In particular, for a given chemical environment, SCG results from a stress-assisted chemical interaction between the material and moisture/gaseous/aqueous environment that is time dependent. Since SCG precedes catastrophic fracture prior to approaching K1c, a delay in failure is often observed in components subjected to a static/cyclic load. SCG in a chemical environment also leads to a time dependence on the strength, the slower the loading rate, the weaker the material, and the damage is affected by applied frequency during the cyclic test. The science of fracture mechanics provides a framework for understanding the effect of SCG on structural materials and for predicting their lifetime. In a plot such as crack velocity (da/dt)−Kappl or (da/dN)−ΔKappl, one can assume subcritical process for the whole curve from the threshold K1SCC/ΔKth to K1c.
It is generally suggested that there is little correlation between SCG threshold under static (K1SCC) to cyclic loads (ΔKth, Kmax,th), even though both are in the region of SCG. This is because the mechanisms that lead to the fracture modes are considered to be very different. This suggestion is only partly correct as the damage is load ratio (R = Kmin/Kmax) dependent. That is, at low R, like R = 0.1 ΔKth or Kmax,th << K1SCC dominated by fatigue and when R = 0.75 Kmax,th = or > K1scc static damage is superimposed on fatigue. This is illustrated in Figure 1a–c for a 4340 alloy in 3.5 % NaCl (Lee et al. 2009). The fracture surface of K1SCC (Figure 1b) is very similar to Kmax,th at R = 0.9 (Figure 1a); but at R = 0.1, there are regions of ductile fracture features (Figure 1c).

Similarities in fracture surfaces between corrosion fatigue threshold (a and c) and stress corrosion threshold (b) for 4340 steel at two load ratios R = 0.1 and 0.9. This suggests that the fatigue cracking mechanisms is a mixture of fatigue superimposed by corrosion.
In general, SCG is considered to be related to a time-dependent phenomena. It can also be related to the stress intensity K as a crack extension phenomenon in the absence of environment, as in vacuum where environmental contribution to crack growth is small in both static/cyclic load applications. In vacuum, the SCG is mostly due to mechanical load that is cycle dependent. In contrast, in a chemical environment, SCG has both mechanical and chemical contributions to applied stress.
This article describes the relationship that relates the static threshold parameter of K1SCC (at ∼10−10 m/s) to ΔKth and Kmax,th (at ∼10−10 m/cycle) under fatigue load at higher R-ratios like R = 0.85. At these high R-ratios (>0.75), applied Kmax > K1SCC and the fracture path has a larger component of static fracture. 5083 alloy is adapted as an example to demonstrate this relationship at room temperature their relationship with and without GB-β anodic precipitates in inert and NaCl environment.
2 Materials and methods
The alloy selected for the discussion is a 5083 (Al–4.5Mg) alloy deformed in inert (vacuum ∼10−6 Pa) and in 1 % NaCl + inhibitor (pH = 4) solution, along S–L direction using a precracked CT sample. This alloy was tested in (1) as received (AR) condition (H131 temper) where there was no GB-β and (2) in heat treated for various times (1–4,000 h) at 175 °C to develop GB-β precipitates during aging. TEM GB microstructures of the 5083 alloy are shown in Figure 2 for the AR condition with no GB-β (Figure 2a) and with GB-β in 175 °C/10 days of heat treatment (Figure 2b).

TEM micrographs showing the microstructural features of (a) 5083-AR condition with no GB-β and (b) 175 °C/10 days with continuous GB-β.
In such heat-treated condition, the mechanical properties of the alloy resulted in a constant YS ∼ 175 MPa and K1c ∼ 23–26 MPa m1/2, in lab air, as in Figure 3. The basic mechanical properties and the microstructural details are discussed in earlier articles (Vasudevan and Sadananda 2015). Figure 3 shows the average YS and K1c being independent of heat treatment time at 175 °C. All the experimental data were collected at room temperature. Fatigue tests were done at a load ratio R = 0.1, 0.85, and at 10 Hz frequency. Threshold stress intensity data were defined at da/dt = 10−10 m/s for the static case and 10−10 m/cycle for the cyclic loading using a CT sample. Static K1SCC was measured using a 58.4 mm wide wedge opening load sample. Fracture surfaces were examined in a scanning electron microscope. Experimental details are given in a report.

YS and K1c variation with heat treatment at 175 °C for 5083 alloy.
Definition of the regions for the static and cyclic conditions is illustrated in Figure 4. As an example, Figure 4 shows the experimental results of crack growth in a 7075-T651 alloy in applied static (Figure 4a) and cyclic loading (Figure 4b) conditions under vacuum and 1 % NaCl chemical environments. The figure shows that there is a threshold under static and in cyclic loading. These thresholds in NaCl have both mechanical and chemical contributions that need to be decoupled. This is done by comparing the 1 % NaCl results to that in vacuum (∼10−6 Pa) where environmental contribution to threshold is minimum. In vacuum, the main contribution is due to mechanical loading.

Partitioning individual mechanical and chemical contribution at near threshold stress intensities.
We then define the chemical contribution to K at the near threshold region as:
5083 alloy was chosen as an example for the current study because it showed constant mechanical properties (YS and K1c) with heat treatment in lab air. The GB-β microstructure (in size) coarsened with heat treatment time from a discontinuous form at low heat treatment times to continuous after about 10 days. This allowed us to isolate the role of matrix versus GB contributions. This was achieved by comparing the AR-condition where GB-β precipitates were negligible to the continuously formed GB-β in the sensitized treatment at 175 °C/240 h. This is evidenced by the results in mass loss and TEM observations that show 5083 with GB-β results in mostly anodic dissolution (AD).
Figure 5 shows (semi-log plot) the variation of mass loss with heat treatment time for the AR temper (Goswami and Holtz 2011; Goswami et al. 2010). Mass loss increased with time, linearly suggesting the rate of dissolution increased with changes in GB-β morphology.

Mass loss variation with aging time at 175 °C.
The common ASTM G-67 (Birbilis et al. 2013) method is used to characterize the degree of sensitization of 5083 alloys in a nitric acid (for 24 h) as mass loss test. The basis of the test is that the mass loss is associated with grains that fall out after the grain boundary β phase has dissolved away by the acid. When the material is fully sensitized, the grain boundaries are fully covered with continuous layer of β; thus, the grains are more likely to fall out after acid immersion. When the degree of sensitization is low, and the β is discontinuous, and the grains would be less likely to fall out. Thus, one would expect the mass loss to increase substantially when the grain boundary microstructure changes from discontinuous to continuous, as shown in Figure 4. In fact, Figure 5 indicates no evidence of any abrupt transition in the mass loss behavior corresponding to any transition in microstructure implied from TEM studies. Such mass loss experiment in 1 % NaCl solution also showed similar trend in behavior for 5083 (ASTM G67-04 2004; Takemoto and Okamoto 1984).
Figure 4 shows the TEM of fully sensitized micrograph (10 h aging) showing continuous GB-β. When the TEM foil of this structure was exposed to NaCl solution for 5 min (Figure 3c), the GB-β completely dissolved. Such experimental observations suggest that 5083 alloy sensitized and exposed to NaCl solution undergoes AD (Goswami et al. 2010; Goswami and Holtz 2011; Holtz et al. 2011).
3 Basic fracture properties
Figure 6 gives the summary of fatigue crack threshold behavior at various R-ratios in vacuum and in NaCl solutions, plotted in terms of ΔK−Kmax version. Since the vacuum was ∼10−6 Pa, the ΔKth was not independent for both H131 temper and in sensitized (∼10 days) treatments. At this vacuum level, there is enough moisture and oxygen present to give some environmental effect to ΔKth (Osaki 1974). The average intrinsic value, in vacuum, can be selected as ΔK*th ∼ 2.5 MPa m1/2 for both conditions. In the NaCl environment, both H131 and sensitized tempers show an L-shaped ΔK−Kmax behavior. The intrinsic ΔK*th ∼ 1.05 MPa m1/2 and K*max,th = 1.8 MPa m1/2. Both parameters are significantly reduced compared to the vacuum results. Kmax portion of the L-shaped curve do not show any shift in magnitude as K*max,th < K1SCC, K1SCC ∼ 2.1 MPa m1/2 for GB-β and is not affected.

Correlation between ΔKth and Kmax,th.
Figure 7 describes the overall behavior in static and cyclic load thresholds with increase in heat treatment time. It is noted that GB-β grows in size and area% with time. For reference, the average K1c ∼ 26 MPa m1/2 is shown. Here at R = 0.1, ΔKth is nearly independent of heat treatment time. This is due to the small COD opening that limits the access of NaCl solution to the crack tip and prevents reaction for all the heat treatment times. In contrast, at R = 0.85 where the COD opening is large allows easy access of NaCl solution to allow crack tip reaction, decreases ΔKth with heat treatment time.

Effect of sensitization time on K1c, ΔKth, and K1SCC.
For comparison, K1SCC decreases markedly with heat treatment time is shown. The intrinsic thresholds ΔK*th ∼ 1.6 MPa m1/2 at R = 0.1 and at R = 0.85 ΔK*th ∼ 0.45 MPa m1/2. Both these thresholds are below the static threshold K1SCC such that there is a large contribution to fracture from the static load.
Figure 8a and b shows the variation of ΔKth & Kmax,th with K1SCC at R = 0.1 and at 0.85. At R = 0.1, the COD being very small access of NaCl to the crack tip is curtailed and fatigue threshold values are below K1SCC; hence, the K1SCC role on the fatigue threshold is small. However, at R-0.85, since NaCl access to the crack tip is easily accessible, and K1SCC contribution is large. For each R-ratio, the individual ΔKth and Kmax components are plotted with respect to K1SCC to delineate their contributions.

Fatigue and static threshold fatigue threshold variation with Af%. (a, b) Relating fatigue crack thresholds (ΔKth and Kmax,th) to static stress corrosion threshold (K1SCC) at R = 0.1 and at 0.85 a linear scale.
4 Pao, Holtz, and Goswami interpretation
Figure 9 shows a schematic diagram of ΔKth−Kmax,th plot for 5083-AR alloy in 1 % NaCl at R = 0.85. At this R, one can draw a trajectory line corresponding to R = 0.85, based on a two-parameter approach as shown in the schematic in Figure 9.
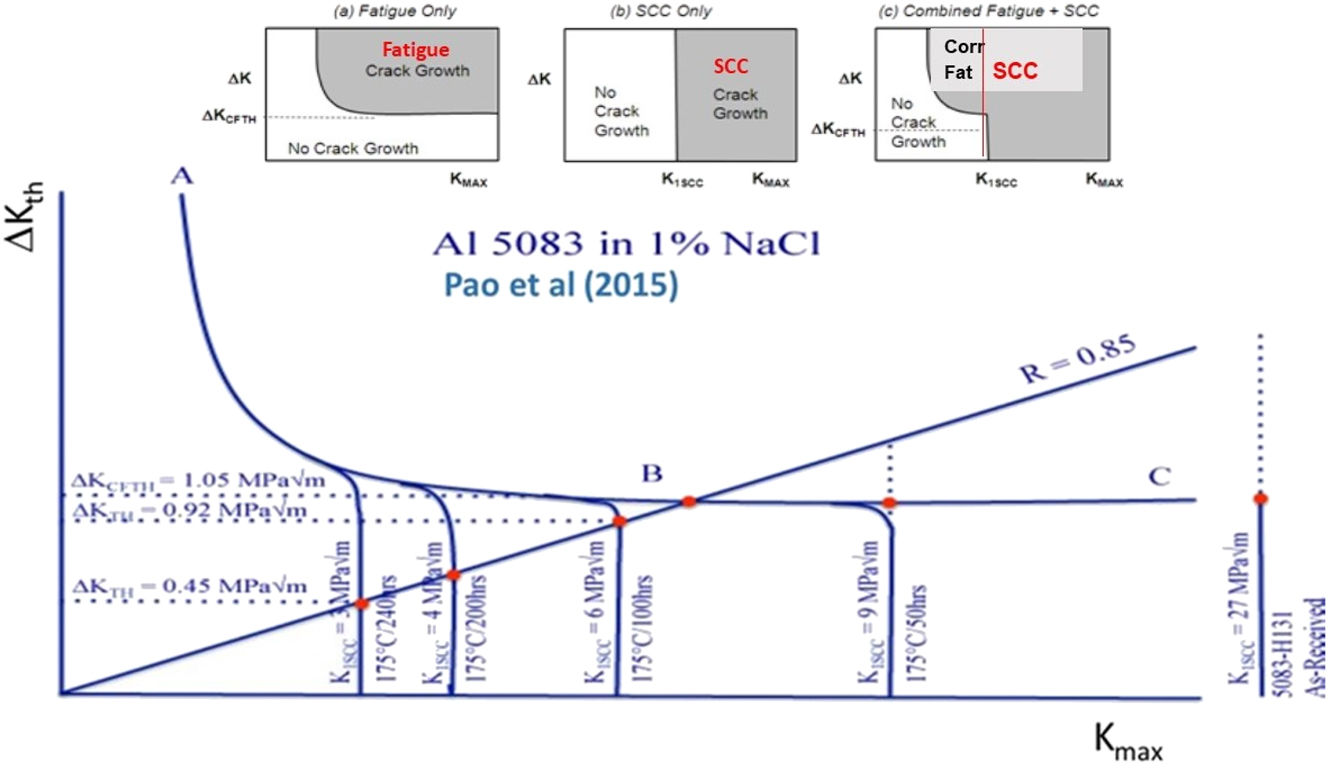
Superposition of CF and SCC.
In the as-received condition H131 in 1 % NaCl, the K1SCC = 27 MPa√m line that intersects the R = 0.85-line way above the curve “ABC,” and thus, SCC does not contribute to the crack growth since the cyclic Kmax,th < K1SCC. When 5083 is partially sensitized at 175 °C/50 h, K1SCC drops to about 9 MPa√m, then the vertical K1SCC line begins to intersect the R = 0.85 line above the “ABC” curve. This suggests that SCC can contribute to the crack growth when the cyclic Kmax > 9 MPa√m. However, at near corrosion fatigue threshold ΔKCFTH, the Kmax < K1SCC = 9 MPa√m and, hence, does not contribute to crack growth, and the crack grows by a CF mechanism. As the sensitization time increases, like in the case of 175 °C/100 h, the K1SCC drops to 6 MPa√m line and intersects the R = 0.85 line below the “ABC” curve. This indicates that, above the “ABC” curve, both CF and SCC are operating. But below the “ABC” curve, though it is in the region where no corrosion fatigue cracking should take place, during corrosion fatigue when, Kmax > K1SCC and, thus, cracks will grow because of SCC. The measured ΔKth = 0.92 MPa√m is, therefore, an apparent threshold results solely from the SCC contribution. In the fully sensitized condition (175 °C/240 h), the K1SCC ≈ 3 MPa√m line intersects the R = 0.85 line and gives the apparent ΔKTH = (1−R) × K1SCC = 0.45. This predicted value agrees well with the measurements and is well below the critical cyclic-only threshold, ΔKCFTH ≈ 1.05 MPa√m. Here, the apparent ΔK threshold resulting from the SCC contribution is much less than the cyclic fatigue-only threshold ΔKCFTH. Thus, the above description demonstrates that the relation between high stress-ratio CF Kmax,th and K1SCC can be quantitatively established
In the present case, vacuum does not contribute much to ΔKth with R because of lack of environment at the crack tip. ΔKth in vacuum is much higher than in the 1 % NaCl result and is characterized by a cyclic-only fatigue threshold, which is termed as ΔKCFTH, and stress corrosion cracking, which is characterized by a fatigue threshold for Kmax, that is, K1SCC. Physically, this means that a crack does not grow when two conditions are not met simultaneously: Kmax < K1SCC, and the ΔKth < ΔKCFTH. In the present case, for R = 0.85, with K1SCC ≈ 2.1 MPa√m for GB-β, the apparent ΔKth = (1−R)K1SCC = 0.32, which agrees with the measurements, and is well below ΔKCFTH ≈ 1.05 MPa√m. Thus, the measured ΔKth values shown in Figure 9 are apparent thresholds resulting from an additional contribution from SCC, which is much lower than the cyclic fatigue-only threshold ΔKCFTH. In the unsensitized condition of H131 temper with no GB-β, the K1SCC is too high to play a role at the threshold, except when Kmax is very high, over 20 MPa√m.
The variation of the measured apparent threshold ΔKth with aging time can be understood “phenomenologically” by the inserts at the top of Figure 9, in which three schematic representations of threshold behavior based on the superposition ideas are shown. One can represent the fatigue threshold behavior by plotting a “map” in terms of ΔK versus Kmax space since Kmax = ΔK/(1−R). For cyclic fatigue only, these plots are generally L-shaped curves, as indicated in the insert, such that combinations of ΔK and Kmax above and to the right of the curve produce crack growth, and combinations of ΔK and Kmax below and left of the curve do produce nonpropagating crack. The 2nd figure shows a map for SCC only, where crack growth occurs for Kmax > K1SCC and there is no crack growth when Kmax < K1SCC. If the SCC results are superimposed on the CF map, and assuming no interactions, the combined threshold map of 3rd figure results. At low enough Kmax, cyclic fatigue ΔK dominates, SCC plays no role, and the threshold follows the CF only curve. At high enough Kmax, SCC dominates, and the threshold curve resembles the SCC only curve, intersecting Kmax = K1SCC when ΔK = 0. In other words, if Kmax > K1SCC, the crack will grow regardless of what ΔK is; but if Kmax is somewhat less than K1SCC, the cyclic process will dominate. For the intermediate levels of sensitization, between fully sensitized (continuous β) and unsensitized (discontinuous β), we assume that the K1SCC varies continuously with aging time (as in Figure 3).
Figure 9 depicts that there could be a series of ΔK versus Kmax maps suggesting what happens when K1SCC drops with increase in aging time. The intersections of those curves with the line R = 0.85 gives the corresponding apparent corrosion-fatigue threshold produced by the superposition of a cyclic ΔK damage-only process with the Kmax-only SCC process. This graphical representation described above explains at least qualitatively the observed behavior of corrosion-fatigue thresholds with aging in the H131 temper condition.
5 Extended interpretation
The above interpretation by Pao et al. (2013) is logical and applies for the corrosion fatigue of 5083 alloy in the H131 temper, which has no GB-β. The discussion also applies for the highly sensitized material, where K1SCC is about 2.2 MPa√m. The diagram suggests that ΔKTH should be about the order of (1−R) = 1–0.85 = 0.15 = 15 % of K1SCC and is in fact the measured intrinsic threshold ΔK*th for highly sensitized material is around 0.45 MPa√m.
One can extend this description to completely sensitized 5083 condition, Figure 10, using the superimposed static threshold K1SCC data to interpret the reduction in intrinsic corrosion fatigue threshold ΔKCFTH. The reduction of the intrinsic cyclic fatigue ΔKCFTH (relabeled as ΔK*CFth) due to the dissolution of the β-formation during various heat treatment times.

ΔKth−Kmax,th threshold plot with limited data points. Above the RED data is fatigue crack growth region. Below the BLUE data is the region of nonpropagating cracks.
This reduction stops at the intrinsic β-threshold ΔK*GBth at 0.45 MPa√m, Figure 10. Intrinsic K*max,th is not affected by the GB-β since the K*max,th < K1SCC. This interpretation is extended to include in the ΔK−Kmax curve for the case where the alloy was fully sensitized to give continuous GB-β, in comparison to the condition where there is no GB-β. This is shown in Figure 10. Thus, the ΔK*CFth is reduced by the fatigue loading to a lower level approaching the intrinsic β-threshold ΔK*GBth. Thus, the region between the two thresholds ΔK*CFth and ΔK*GBth is where the damage is a combination of fatigue and GB-corrosion. Above ΔK*CFth limit is represented by corrosion fatigue region in NaCl environment and below ΔK*GBth indicates the region for nonpropagating cracks. SEM micrographs for the two extreme cases show flat surfaces with little differences, probably due to small differences in the molecular weight between Mg and AL, the dissolution of β spreads Mg on the GB-plane in the sensitized condition. Small dispersoids of the type Al6Mn can be seen. In H131 case, it is possible that slip dissolution can occur to give flat-like fracture surface features. 5083-solid solution alloy (Osaki 1974; Takemoto and Okamoto 1984) show pitting and transgranular slip dissolution cracks, which is similar to the present 5083-AR.
6 Basic equations relating Kmax and ΔK to overpotential ηAD
The following discussion is a summary of Hall’s analysis (Hall 2011) on the topic of mechano-electrochemical driving force for stress corrosion crack initiation and growth. We have modified and extended his model to apply to fatigue crack initiation under aqueous solutions assuming “AD” mechanism along the high angle grain boundary or along slip bands.
West (1973, 1980 and Hall (2011) have analyzed the electrochemical driving force affecting the mechanical driving force for a given alloy assuming “AD” and for “hydrogen-assisted cracking (HAC).” Their model was developed only for the case of static loading. We present their analysis based on AD mechanism for an active path such as grain boundary or slip band.
For plane-stress fracture, toughness for a material in an inert environment can be written as:
K21c/E = 2γp – plastic work of fracture or mechanical energy.
West (1980) and Hall (2011) have given an expression for a crack driving force GAD for the case of “active path AD” process as:
GAD = (1 + k)δCOD (ZF/2Ω)ηAD; where k = correction factor, δCOD = COD or GB/slip plane width, Z = valance, Ω = atomic volume, F = Faraday constant, and ηAD = anodic overpotential = electrochemical driving force. This equation is developed for the static loading case. Similar equation for cyclic loading is missing.
(ZF/2Ω)ηAD = electrochemical energy for a given alloy-environment system.
GAD,STATIC = (K21c − K21scc)/E = K2CHEM/E as the chemical energy for static loading. It is noted that while K1c is mostly mechanical effect and K1SCC has both mechanical and chemical components.
Combining Equations (4) and (2), we can write:
K2CHEM/E = (K21c−K21scc)/E = GCHEM,static = (1 + k)δCOD,static (ZF/2Ω)ηAD,STATIC for static load; we can plot (K21c/E) versus (K2CHEM,STATIC/E) for static load. k = constant that varies with alloy system. For a low YS Al-alloy, k ∼ 3,000 (West 1980); δCOD,static = GB-width ∼2 nm; Z(Al) = 3, F = 96.5 kJ/mol V; Ω = 10 × 10−6 m3/mol. The equation suggest that GCHEM varies linearly with anodic overpotential ηAD.
We can calculate:
Such a relationship has not been proposed for cyclic damage. We can modify Equation (5) for high load ratio R > 0.75 for Kmax,th as Kmax approaches K1c. For the current case at R = 0.85, Equation (5) can be written for Kmax: GCHEM, cyclic = [K2max,vac−K2max,NaCl]/E = (1 + k)δCOD,cyclic·(ZF/2Ω)ηAD,cyclic, similar expression for ΔGchem,cyclic. And ηAD,cyclic can also be calculated. This GCHEM is the chemical contribution to mechanical force G. In the following sections Eqs. (4), (5) and (6) are used to calculate overpotential to show relationship to static and cyclic parameters.
6.1 Relationship of GCHEM and ηAD to Af% of GB-β
Figure 11a shows the variation of K1SCC, Kmax,th, and ΔKth with area fraction Af of GB-β. It can be seen that below Af < 0.04 K1SCC is about 4 times larger than Kmax,th while ΔKth shows a very small dependence on Af. There are three regions that indicate the changes in behavior: region-I at Af < 0.04 at low Af of β there is a plateau for all three driving forces; region-II at Af = 0.04–0.06 large drop in K1SCC and smaller drop on Kmax,th and negligible drop in ΔKth; region-III saturation plateau at Af > 0,06 where β is continuous. Figure 12 shows the sequence of fracture surface morphology from when Af of β is zero to when it is continuous. Fracture is ductile with dimples (region-I) to mixed fracture of dimples + flat (region-II) surface due to partial β-dissolution to finally GB-fracture (region-III).

Comparison of thresholds and chemical energy variations. (a) Static and cyclic thresholds varying with Af of β, (b) static and cyclic thresholds varying with Af of β.

Sequence of fracture surfaces under static load for 5083 aged at 175 °C SCC test in 1 % NaCl.
Figure 11b shows the K1SCC, Kmax, and ΔKth data from Figure 11a converted to G. Both plots are on a linear scale. In general, GCHEM = Ginert − GNaCl is the chemical contribution to the mechanical driving force. Static and cyclic GCHEM gradually increases at the low end of Af and increases to saturate at high GB-β where it is continuous. Figure 11b is the mirror image of Figure 11a. Static GCHEM saturates around 8 kJ/m2. In contrast, plotting the data on the same scale, corrosion fatigue thresholds Kmax,th and ΔKth are lower than the static GCHEM. In fact, ΔKth is insignificant variation with Af compared to Kmax,th, which saturates around 4 kJ/m2, half the value compared to the static with Af is much weaker. The plot shows that there is a crossover point in Af ∼ 0.05. When Af < 0.05 where β-spacing is large, GCHEM for static load is below that for cyclic load. Takemoto and Okamoto (1984) observed, in this region, slip line dissolution and pitting in their 1 % NaCl. In this region, chemical contribution is increased under cyclic load compared to the static load, probably due to many slip lines undergoing slip line dissolution under static load. Under cyclic load, it is possible that dissolution process can occur at both Pmin and Pmax loads, adding an additional crack extension. In between the β the empty space, the crack extends by a tearing process with applied load. On the other hand, when Af > 0.05 where β is continuous, dissolution rate is effective compared to the static load. In this region, both the static and cyclic load reaches a saturation separated by a half the magnitude under cyclic. In comparison, the contribution of β to cyclic ΔK is negligible where dissolution and crack extension can be in nanometer scale.
6.2 Relationship of ηAD to Af% of GB-β
Figure 13a is a graph showing a nonlinear relation between the calculated anodic overpotential ηAD and the GB-β phase. The trend is very similar to that shown in Figure 11. Again, ηAD saturates when the Af > 0.05 where the GB-β is in continuous form. As before, the cyclic ηAD pertaining to Kmax,th mimics the static while the ΔKth part is insignificant. The cyclic ηAD corresponding to Kmax,th was half that for the static part. It was noted that Equations (5) and (6) indicate that GCHEM variation is linear with ηAD and hence was not plotted. In both Figures 11 and 12, the lower part is related to the fatigue contribution and upper part to the GB-β contribution to GCHEM and ηAD, respectively.

Calculated overpotential under static and cyclic loading. (a) ηAD variation with Af of β, similar to GCHEM, (b) static ηAD variation with cyclic.
Figure 13b shows a linear dependence of cyclic ηAD with the static ηAD.
7 Possible explanations
In the 5083-AR (H131) alloy, since there is no GB-β formed, the alloy exhibits general pitting and slip line dissolution behavior (Osaki 1974; Takemoto and Okamoto 1984) when exposed to NaCl solution, under static loads, giving a static threshold of K1SCC = 27 MPa m1/2. This gives a transgranular crack path across the grains. Plasticity at the crack tip controls the crack extension and K1SCC (AR) is independent of sensitization time. Under cyclic loads, at R = 0.1 and at 0.85, the thresholds Kmax,th and ΔKth are constant.
In 5083-SENS alloy, β-precipitates grow with time, increasing the Af coverage of the high angle GB’s. β-dissolution rate is faster than H-diffusion rate and can override the HAC since the spacing between β-precipitates is about 100–500 nm, at lower sensitization time less than 100 h. At long heat treatment times, these β-precipitates become continuous on the high angle GB’s. We can now analyze the situation under static and cyclic loading for 5083-AR (with no GB-β) and for sensitized condition at 175 °C/240 h (continuous GB-β). Such a result suggests that HAC ahead of the 5083-crack tip can be of secondary importance. These highly reactive β-precipitates can be dissolving and the space between them can just tear mechanically (Osaki 1974; Takemoto and Okamoto 1984) to give crack extension with little help from HAC. In the static mode, at K1SCC threshold, since the crack extension rate is slow, β-dissolution and crack extension can occur at the same time.
8 Crack tip mechanisms
Simple illustrations of crack tip deformation for the static and cyclic load cases are shown in the following figures along with a few fracture surfaces.
To describe the β-dissolution mechanism under static and cyclic load conditions, we combined the data in Figures 3 and 5 in Figure 14a. Here, the thresholds K1SCC (static) and Kmax,th (cyclic) show varying with mass loss. Initially, the thresholds are constant up to 35 mg/cm2 where the β is discontinuous growing. When mass loss > 35 mg/cm2, both thresholds decrease significantly till Kmax,th → K1SCC. In this region, β is continuous. The magnitude reduction of Kmax,th is smaller compared to K1SCC. In Figure 14b, it is shown that K1SCC (static) decrease drastically with corrosion rate (m/s), minimum value is assumed to be the corrosion rate of pure β. The result shows that corrosion rate is higher than the diffusion rates of H in both lattice and GB, indicating β dissolution dominates to extend the GB-crack under stress. The plateau region in Figure 14a is due to slip line dissolution and mechanical tear between largely spaced β. The decreasing slope is due to variation in the rate of dissolution and access of solution to the crack tip as the applied is lowered. Figure 14c shows the applied static stress affecting the time to failure with and without GB-β at an imposed potential of E = −700 mV. The downward shift in time due to GB-β is about half compared to the microstructure with no β in statically loaded case. It also shows that the dissolution is affected by applied stress either by crack tip blunting or by decreasing the dissolution rate. We now discuss the possible mechanism under static and cyclic load in the presence of NaCl solution for the 5083-AR and sensitized treatments.

Observed relationships in terms of (a) variation of K1SCC and Kmax,th with mass loss of β-precipitates aged at 175 °C; (b) inverse relation between K1SCC with corrosion rate for 5083. For reference, diffusion rate of H in Al lattice and GB is also shown. Also indicated the dissolution rate of pure β-precipitates; (c) time to failure variation with applied stress for 5083 alloy for conditions with β and without β.
8.1 Static threshold K1SCC
Under the static loading condition, the applied stress is continuous; at the very early stage of sensitization time, 5083 alloy has no GB-β, and the alloy exhibits pitting and slip line dissolution, common to many solid solution AL-alloys. The exposed crack tip to the NaCl solution allows the fracture path to be transgranular accompanied with pitting. Ductile fracture is affected by the Fe, Cr, Mn dispersoid resulting in dimples. This was described by Osaki (1974) andTakemoto and Okamoto (1984) for 5083-AR and sensitized alloy.
Figure 15 illustrates the mechanism of crack extension at threshold stresses for static loading when the GB-β is discontinuous during the early stages of sensitization time and at the longer times when β grows to be continuous. In the presence of NaCl solution, the chemical reaction with 5083 crack surface results in a viscous oxide layer of about a micron thick and H evolution (Vasudevan et al. 2022; Vasudevan and Kujawski 2022).

Schematic illustration of crack tip reaction with GB-β when (a) β is discontinuous and (b) continuous.
The viscous layer has both continuously varying density and viscosity. The rate of this variation varies with occluded geometry at the crack wake affects transport of the chemical species like H+ to the crack tip. Due to this transport, cyclic fatigue loading will promote a mixing layer. Such viscous layer thicknesses have not been measured so far. Thickness of 1–2 μm is only an estimate made from the dry oxide thickness. The detailed description of chemical reaction at a crack tip for 5083 alloy with NaCl solution is given in our earlier article (Vasudevan and Sadananda 2015). Summary of Figure 15 is given below. The two fracture surface micrographs (inserts in Figure 15) shows the ductile transgranular feature mixed with small flat areas of β-dissolution for the 10 h aging that has low Af of β and flat intergranular fracture at 240 h where the GB-β is continuous.
GB-ppt (β) is anodic with respect to matrix and dissolves in NaCl solution (under no applied stress) generating H+;
Dissolution rate of β > H-diffusion rate; crack can be extended if the energy for Gslip < Ggb cracking;
When β is spaced apart at low Af, slip dissolution and pitting occurs with a lesser rate of β-dissolution and mechanical tear helps extend the crack in between the β-ppts giving transgranular crack;
When β is continuous at high Af > 0.6, dissolution takes over suppressing both slip and pitting process.
8.2 Cyclic load thresholds Kmax,th and ΔKth
Figure 16a–c describes the crack tip reaction at Pmax and Pmin loads for these cases where (a) no GB-β, (b) discontinuous β, and (c) continuous β under cyclic loading. Figures show that NaCl reaction with 5083 surface yields in a layer of viscous oxide and emits vacancies and dislocations at Pmax. Upon unloading, the negative dislocations collapse into the crack tip, possibly with vacancies created at Pmax, giving a nanometer crack extension. At Pmax, these slip planes are affected by NaCl to give slip dissolution along with some pitting (Osaki 1974; Takemoto and Okamoto 1984).

Schematic illustration of crack extension at Pmax and Pmin for the cases: (a) no GB-β, (b) with discontinuous β, and (c) continuous β, in NaCl. The sketch applies to R = 0.1 as well as to R = 0.85. At R = 0.1, the COD << compared to that at R = 0.85.
At R = 0.1 (Figure 8a), with small COD, the fracture surfaces for AR-condition with no GB-β (high K1SCC) and for sensitized condition with continuous β (low K1SCC) the fracture surfaces do not show much difference (Figure 17a and b).

Comparison of fracture surface morphology of (a) Al 5083-AR (as-received) and (b) Al 5083-SENS (sensitized at 175 °C/240 h) fatigued at R = 0.1 in 1 % NaCl solution in the near threshold region (∆K = 2 MPa√m for both specimens).
Here, K1SCC > Kmax,th and ΔKth. AR-condition slip line dissolution shows flat fracture and for fully sensitized case β dissolution gives GB-fracture.
In both cases, surfaces are flat and could not differentiate. In addition, due to small differences in the atomic weight of Mg and Al, one could observe discernable differences.
At high R = 0.85, where the COD is large, the sequence of crack extension at near threshold is illustrated in Figure 16a–c. For all these conditions in 1 % NaCl, the crack is extending through the viscous oxide formed. In the AR-condition, with no GB-β formed, crack is growing along slip plane dissolved at Pmax and the fracture surface is flat. At Pmin, there is no crack extension. When β is discontinuous, crack extends at Pmax by dissolving the β at the crack tip and slip dissolution. At Pmin, there could be additional β dissolution during the collapse of the negative dislocations that adds a few nanoscale crack extensions. This combined crack extension may result in reducing the overall Kmax,th to half the magnitude of K1SCC (Figure 11a). During cyclic loading, NaCl in the crack wake volume is undergoing a pumping action that can produce a mixing reaction to increase the chemical effect compared to the continuous loading during K1SCC. When the β is continuous at high Af, a portion of the β at the crack tip is dissolved with crack extension simultaneously at Pmax but at Pmin crack is extended by small amount of β-dissolution. At the next cycle, at Pmax, the small β-dissolved adds to the crack extension at Pmax. Similar to Figure 15, the fracture surfaces could not be distinguished, Figure 18a and b.

Comparison of fracture surface morphology of (a) Al 5083-AR (as-received) and (b) Al 5083-SENS (sensitized at 175 °C/240 h) fatigued at R = 0.85 in 1 % NaCl solution in the near threshold region (∆K = 1.1 MPa√m for Al 5083-AR and ∆K = 0.5 MPa√m for Al 5083-SENS).
9 Comments on HAC in AL-5083 alloys
For many decades, researchers have been trying to implicate HAC mechanism in Al-alloys. Two reviews on this topic are worth noting (Gangloff 2003; Li et al. 2020). Experimentally several methods of measurements have been used to study HAC in Al-alloys. These are permeability, cathodic charging, and internal friction. The following is a brief description of these methods with respect to 5083 alloy.
Internal friction data do not show strong H-peaks (Leger and Piercy 1981) in chemically H-charged 7075-T6, Al-0.42/0.68 at% Cu, and Al-0.16/0.54 at% Mg alloys. The binding energy of H to Cu and Mg was calculated to be weak and is about 0.05 eV. On the other hand, Gest and Troiano (1974) suggested that interstitial hydrogen in solid solution was responsible for HAC in 7075 alloy and used internal friction and lattice parameter measurements to support this hypothesis. Gest and Troiano (1974) also show that K1SCC region in a 7075-T651 alloy is not affected by cathodic (−1800 mV) or anodic (−600 mV) or OCP applied potentials in 3.5 % NaCl, but the plateau velocity is changed by an order of magnitude. Such experiments have not been repeated under static or cyclic loading. Their experiment suggests that HAC is not an issue in the K1SCC region. Jones and Danielson (2003) have raised such questions about H-induced fracture in 5083 alloy.
Lattice H-diffusion rates are low in these alloys: 5083 it is DH = 1.5 × 10⁻¹³ m2/s (Scully et al. 2000). H-diffusion rates along GBs can be higher or lower depending on the type of GB and its trapping efficiency (Pedersen and Jonsson 2009) than in the lattice. In addition, when a fully sensitized 5083 alloy (240 h aging) showing continuous GB-β was exposed to NaCl solution for 5 min (Figure 3c), the GB-β completely dissolved. Such experimental observations suggest that 5083 alloy sensitized and exposed to NaCl solution undergoes AD (Goswami and Holtz 2011).
Several investigators chemically charged Al-alloys to introduce nascent H into the Al-alloys (Holroyd and Scamans 2016; Holroyd et al. 2017). Their idea is to substantiate that these Al-alloys fail in normal chemical solution due to nascent H+ created during reaction and that chemically charged H gives support for their explanation. Such experiments have several issues during H-charging: (1) depth of H penetration is less than 0.1 mm when the Al-sample thickness are about 3–10 mm (many cases), that is, H+ is in the near surface region; (2) possible to form microcrack defects (Rozenak 2005; Rozenak et al. 2005) during charging in pure Al; (3) during charging Al(OH) oxide layer is formed that reduces the diffusible H into the subsurface region (Buckley and Birnbaum 2002); (4) vacancy formation (Rozenak 2005) leading to H-vacancy complexes (Buckley and Birnbaum 2002); (5) H-traps at inclusions/precipitates in the matrix and at GB particles (Buckley and Birnbaum 2002); (6) formation of Al-hydride complex (Balasubramaniam et al. 1991); and (7) corrosion pit formation during H-charging. Most of these H-charging experiments are done on high purity thin Al and on Al-base alloys. H-flux into Al is affected by surface conditions like oxides that take a millisecond to form a monolayer that can prevent H-dissociation at the surface. Such experiments suggest that results from H-charging method are not straight forward to interpret or relate H-damage as the main effect on brittle cracking in Al-alloys in an aqueous solution. In a CT-sample, it becomes more complex as the side surfaces have to be masked prior to H-charging to allow H to enter only through the crack tip. It is also difficult to relate to the H-charging experiments to the condition of service environment in moist air or aqueous 3.5 % NaCl solution.
Despite these issues listed above, the nascent H+ formed, directly on the surface of Al (during cathodic charging as an initial step), can diffuse interstitially into the Al lattice as well as interact with vacancies to form stable H–V clusters before it can emerge out as bubbles based on their rate of production from the surface as a later step. In other words, any chemical process that creates nascent H+ can diffuse into bulk Al lattice to some degree. The charged H+ is in the subsurface of Al, up to about 10 nm, and can only escape when it becomes molecular hydrogen. The fugacity argument is not intrinsic to the problem but is considered only as a secondary step, since it is applicable to molecular H. This description can be extended to the case where H+ is generated during chemical reaction of NaCl solution with Al-surface. One can note that H solubility and diffusion into Al at 20 °C is very low and is a necessary criterion for uptake into the metal. But it is the applied stress that leads to fracture at a lower stress. That is, the material resistance is reduced. Dissolution of a phase can be measured experimentally. It is difficult/impossible to measure H location between two Al-atoms by any current methods available to infer a reduction in binding energy; it can only be interpreted speculatively.
This above description of damage deviates from the earlier interpretations (Crane and Gangloff 2016; Holroyd and Scamans 2016; Holroyd et al. 2017) in 5083 alloy, emphasizing that β-dissolution, is the primary cause of failure.
10 Implication
The trend in the 5083 results present in the present work is not unique to this alloy. It is also observed in other alloys. As an example, Figure 19 shows the average trend for many steel alloys showing the sigmoidal variation of cyclic threshold Kmax,th at R = 0.9 with K1SCC in 3.5 % NaCl solution (Lee et al. 2009). Few alloys are not affected by the NaCl solution showing a slope = 1, while in the sigmoidal variation, at low K1SCC < 70 MPa m1/2Kmax,th is constant then increases as the slope = 0.25 and saturates at high K1SCC ∼ 120 MPa m1/2. In this group of steels, the cracking cyclic damage mechanism seems to be similarly affected by the static mode, probably HAC. The trend indicates that increasing K1SCC can be beneficial to fatigue damage.

Cyclic threshold Kmax variation with static threshold K1SCC for several steel alloys in 3.5 % NaCl, showing similarity in behavior to 5083 alloy shown in Figure 11b.
We have attempted to relate the mechanical contribution of the threshold parameters (K1SCC, ΔKth, Kmax,th) to a chemical driving force ηAD. Here, we calculate ηAD as there are no experimental measurements of ηAD at the crack tip. We know that there is not a critical ηAD below which there is not crack extension. We also know that there are critical thresholds K1SCC, ΔKth, Kmax,th below which there is no crack growth. This implies that mechanical resistant properties are measured to understand the role of crack tip chemistry. This is why we suggest, in a chemical environment, the measured thresholds (static or cyclic) can be defined as a “mechanical equivalent of a chemical driving force.”
Given such observations, Naroozi et al. (2005) formulated a fatigue crack growth expression based on the local crack tip stress–strain history and the SWT damage parameter to give a crack growth expression:
where C = constant and p = slope from strain-controlled fatigue expt. For 5083 alloy, p = 0.102. The total mechanical driving force is given by:
For constant amplitude analysis, we used the vacuum data as the reference to define:
Using these relations, we can relate the results of total driving force Δκ with K1SCC (Figure 20a) and with cyclic ηAD. This is shown in Figures 20a and 20b.

Relating the parameters of UNIGROW model to (a) K1SCC and (b) ηAD.
Figure 20a shows a linear variation of normalized K1SCC with modulus E on a log-log plot, suggesting at the R = 0.85 static mode is related to the cyclic damage. Similarly, Figure 20b indicates that the cyclic damage driving force Δκ can be related to ηAD. The plateau in Figure 20b is where the chemical force ηAD is saturated when β become continuous. These two plots suggest a method to include chemical contribution to the mechanical damage prediction.
11 Key points
GB-β precipitates do not affect K1c, as well as YS, but they strongly affect threshold parameters ΔKth, Kmax,th, and K1SCC due to dissolution of β in NaCl solution; the dissolution rate increases as the Af of GB-β increase;
Fatigue threshold Kmax,th is reduced with respect to K1SCC: this is probably due to more access of NaCl to the crack tip at Pmax than at Pmin. Hence, ΔKth is least affected as the access of NaCl is the least at the unloading point of a fatigue cycle;
There is a critical Af of β ∼ 0.05 above which complete GB-dissolution occurs where β morphology is continuous. This is reflected in Figure 13. This is mostly due to GB-β dissolution with a minor effect from HAC. Rate of β-dissolution increases with Af;
ΔKth and Kmax,th varies weakly with Af of β at R = 0.1; while at R = 0.85, Kmax,th varies nonlinearly with Af and ΔKth varied weakly with Af;
In contrast, K1SCC inversely varied with Af of β; ductile TG fracture at very low Af, mixed TG + IG fracture at mid Af and complete GB fracture at high Af;
Differences in the dissolution kinetics (corrosion rates) and H-diffusion rates and interface strength in β affect the threshold K;
Calculated anodic overpotential directly correlates with fracture properties in static and cyclic loading;
The magnitude of cyclic threshold was about half that of static threshold and complemented with the anodic overpotential; cyclic loading reduced the mechanical and chemical driving force in fatigue due to (1) reduction in dislocation emission and (2) dissolution of GB-β at both Pmin and Pmax;
Overall mechanism is GB-β dissolution supplemented by mechanical tear in the gap between β at low Af and continuous dissolution at higher Af of β, with limited role of HAC.
Quantifying GB precipitate size and spacing, along with overpotential data, is important to quantify the threshold behavior under static and cyclic loading;
The analysis suggests a possibility of incorporating a chemical factor into a life prediction model like UNIGROW;
Supplementing with good matching fracture surface analysis and crack path is needed to complete the analysis.
-
Research etics: Not applicable.
-
Author contributions: A.K. Vasudevan: conceptualization and writing the original draft, D. Kujawski: review and editing, R.L. Latanision: chemistry analysis and editing. All the authors have accepted responsibility for the entire content of this manuscript and approved its submission.
-
Competing interests: The authors declare no conflicts of interest regarding this article.
-
Research funding: None declared.
-
Data availability: The raw data can be obtained on request from the corresponding author.
References
ASTM G67-04 (2004). Standard test method for determining the susceptibility to intergranular corrosion of 5XXX series aluminum alloys by mass loss after exposure to nitric acid (NAMLT Test). ASTM International, West Conshohocken, PA.Search in Google Scholar
Balasubramaniam, R., Duquette, D.J., and Rajan, K. (1991). On stress corrosion cracking in aluminum-lithium alloys. Acta Metall. Mater. 39: 2597–2605, https://doi.org/10.1016/0956-7151(91)90075-c.Search in Google Scholar
Birbilis, N., Lim, M.L.C., Gupta, A.K., Davies, C.H.J., Lynch, S.P., Kelly, R.G., and Scully, J.R. (2013). Quantification of sensitization in AA5083-H131 via imaging Ga-embrittled fracture surfaces. Corrosion 69: 396–402, https://doi.org/10.5006/0804.Search in Google Scholar
Buckley, C.E. and Birnbaum, H.K. (2002). Characterization of the charging techniques used to introduce hydrogen in aluminum. J. Alloys Compd. 330: 649–653, https://doi.org/10.1016/s0925-8388(01)01496-7.Search in Google Scholar
Crane, C.B. and Gangloff, R.P. (2016). Stress corrosion cracking in Al-Mg alloy 5083 sensitized at low temperature. Corros. Sci. 72: 221–241.10.5006/1766Search in Google Scholar
Gangloff, R.P. (2003) Hydrogen assisted cracking of high strength alloys. In: Milne, I., Ritchie, R.O., and Karihaloo, B. (Eds.). Comprehensive structural integrity, Vol. 6. Elsevier, Science, New York, NY, pp. 31–101.10.1016/B0-08-043749-4/06134-6Search in Google Scholar
Gest, R.J. and Troiano, R. (1974). Stress corrosion and H embrittlement in an Al-alloy. Corrosion 30: 275.10.5006/0010-9312-30.8.274Search in Google Scholar
Goswami, R. and Holtz, R.L. (2011). Transmission electron microscopy investigations of grain boundary beta phase precipitation in Al-5083 aged at 373K (1000C). Metall. Trans. A 44A: 1279–1289.10.1007/s11661-012-1166-9Search in Google Scholar
Goswami, R., Spanos, G., Pao, P.S., and Holtz, R.L. (2010). Precipitation behavior of the β phase in Al-5083. Mater. Sci. Eng. A A527: 1089–1095.10.1016/j.msea.2009.10.007Search in Google Scholar
Hall, M.M.Jr. (2011). Environmental crack driving force. Metall. Mater. Trans. A 44: 1200–1208, https://doi.org/10.1007/s11661-012-1439-3.Search in Google Scholar
Holroyd, N.J.H. and Scamans, G.M. (2016). Sensitization, intergranular corrosion and environmentally induced cracking in AL-Mg alloys. Corrosion 72: 136–143.10.5006/1927Search in Google Scholar
Holroyd, N.J.H., Burnett, T.L., Seifi, M., and Lewandowski, J.J. (2017). Improved understanding of environment-induced cracking (EIC) of sensitized 5XXX series aluminum alloys. Mater. Sci. Eng. A A682: 613–621.10.1016/j.msea.2016.11.088Search in Google Scholar
Holtz, R.L., Pao, P.S., Bayles, R.A., Longazel, T.M., and Goswami, R (2011). Corrosion fatigue behavior of aluminum alloy 5083=H131 sensitized at 175 °C. Metall. Mater. Trans. 43: 2839–2849.10.1007/s11661-011-0866-xSearch in Google Scholar
Jones, R.H. and Danielson, M.J. (2003). Role of hydrogen in stress corrosion cracking of low strength Al-Mg alloys. Paper presented at the CORROSION 2003, San Diego, California, Paper Number: NACE-03513. Corrosion 1–12.10.5006/C2003-03513Search in Google Scholar
Lee, E.U., Taylore, R., Lei, C., and Sanders, H.C. (2009). Aircraft steels. Technical Report # NAWCADPAX/TR-2009/12, 19 Feb 2009.10.21236/ADA494348Search in Google Scholar
Leger, M. and Piercy, G.R. (1981). Internal friction in hydrogen charged aluminum alloys. Phil. Mag. A 43: 377–385, https://doi.org/10.1080/01418618108239416.Search in Google Scholar
Li, X.F., Ma, X.F., Zhang, J., Akiyama, E., Wang, Y.F., and Song, X.L. (2020). Review of hydrogen embrittlement in metals: hydrogen diffusion, hydrogen characterization, hydrogen embrittlement mechanism and prevention. Acta Metall. Sin. 33: 759–773, https://doi.org/10.1007/s40195-020-01039-7.Search in Google Scholar
Naroozi, A.H., Glinka, G., and Lambert, S. (2005). A two parameter driving force for fatigue crack growth analysis. Int. J. Fatig. 27: 1277–1296, https://doi.org/10.1016/j.ijfatigue.2005.07.002.Search in Google Scholar
Osaki, S. (1974). Stress corrosion cracking of Al-5Mg (5083) Alloy. Tech Report, Yamaguchi Univ., pp. 347-358.Search in Google Scholar
Pao, P.S., Holtz, R.L., Goswami, R., and Bayles, R.A. (2013). Effect of sensitization on corrosion-fatigue cracking in 5083 alloy. NRL Report/MR/6355–14-9581.Search in Google Scholar
Pedersen, A. and Jonsson, H. (2009). Simulation of hydrogen diffusion at grain boundaries in Al. Acta Mater. 57: 4036–4045, https://doi.org/10.1016/j.actamat.2009.04.057.Search in Google Scholar
Rozenak, P. (2005). Defects producing formation of micro-cracks in aluminum during electrochemical charging with hydrogen. J. Alloys Compd. 400: 106–111, https://doi.org/10.1016/j.jallcom.2005.03.045.Search in Google Scholar
Rozenak, P., Sirios, E., Ladna, B., Birnbaum, H.K., and Spooner, S. (2005). Characterization of hydrogen defects forming during chemical charging in the aluminum. J. Alloys Compd. 387: 201–210, https://doi.org/10.1016/j.jallcom.2004.06.041.Search in Google Scholar
Sadananda, K. and Vasudevan, A.K. (2011). Review of environmentally assisted cracking. Metall. Mater. Trans. 42A: 279–303, https://doi.org/10.1007/s11661-010-0472-3.Search in Google Scholar
Scully, J.R., Young, G.A., and Smith, S.W. (2000). Hydrogen solubility, diffusion and trapping in high purity aluminum and selected aluminum base alloys. Mater. Sci. Forum 331–337: 1583–1600, https://doi.org/10.4028/www.scientific.net/msf.331-337.1583.Search in Google Scholar
Takemoto, T. and Okamoto, I. (1984). Stress corrosion cracking and anodic dissolution behavior of 5083 aluminum alloy. Trans. JWRI 13: 114–1221.Search in Google Scholar
Vasudevan, A.K. and Kujawski, D. (2022). Implications of ΔK-R ratio in vacuum. Fatigue Fract. Eng. Mater. Struct.: 1–12, https://doi.org/10.1111/ffe.13696.Search in Google Scholar
Vasudevan, A.K. and Sadananda, K. (2015). Grain boundary anodic phases affecting environmental damage. Corros. Rev. 33: 403–415, https://doi.org/10.1515/corrrev-2015-0035.Search in Google Scholar
Vasudevan, A.K., Ricker, R.E., Miller, A.C., and Kujawski, D. (2022). Fatigue crack tip corrosion processes and oxide induce closure. Mater. Sci. Eng. A A861: 144383.10.1016/j.msea.2022.144383Search in Google Scholar
West, J.M. (1973). A general model for stress-corrosion crack propagation. Met. Sci. J. 7: 169–172, https://doi.org/10.1179/030634573790445703.Search in Google Scholar
West, J.M. (1980). Chemical potential and surface energy in stress-corrosion cracking. Met. Sci. 14: 534–540, https://doi.org/10.1179/030634580790426067.Search in Google Scholar
© 2024 Walter de Gruyter GmbH, Berlin/Boston
Articles in the same Issue
- Frontmatter
- Editor’s Note
- Welcoming a new Co-Editor-in-Chief
- Editorial
- 6th International conference on environmentally-assisted cracking (Reston, Washington, DC, USA, July 16–21, 2023)
- General Topics
- Crack initiation during environment-induced cracking of metals: current status
- Concept of “chemical notch” to study stress-corrosion
- On the role of surface stress in environment-assisted fracture
- Environmentally-Assisted Cracking of Stainless Steel and Aluminum Alloys
- Quantification of SCC mechanisms in austenitic alloys under PWR primary water conditions
- Evaluation of chloride stress corrosion cracking susceptibility of stainless steels
- The impact of loading rate on chloride induced stress corrosion cracking of 304L stainless steel
- In-situ studies on environmental degradation in Al 7075 in saltwater environment under tensile loading
- Environmentally-Assisted Cracking – Quasi-Static/Cyclic Loading Interface
- On relating quasi-static load threshold K1scc to K1c
- Relationship between fatigue crack threshold Kmax,th and K1SCC
- Modelling
- Modeling hydrogen diffusion in precipitation hardened nickel-based alloy 718 by microstructural modeling
- A computational framework for probabilistic modeling of galvanic corrosion for automotive applications
- Using a reverse life plot for estimating fatigue endurance/limit