Investigating the influence of hydrogen on stress corrosion cracking of 2205 duplex stainless steel in sulfuric acid by electrochemical impedance spectroscopy
-
Chuanbo Zheng
 and
Guo Yi
and
Guo Yi

Abstract
As a nondestructive and sensitive method, electrochemical impedance spectroscopy (EIS) can be used to investigate the passivation and breakdown of passive films on steel. In this study, EIS, combined with slow strain rate test and scanning electron microscopy, was employed to study the stress corrosion cracking (SCC) behavior of 2205 duplex stainless steel in 0.5 m sulfuric acid solution under hydrogen-charging conditions. Results showed that the corrosion resistance of passive film on the hydrogen-charged specimen was lower than that for the specimen with no hydrogen charge. Hydrogen-induced cracking was evident after the specimens had been charged for 24 h. The phase shift in EIS, calculated from frequencies between 0.1 and 10 Hz, could be used to monitor the SCC process.
1 Introduction
Stress corrosion cracking (SCC) is produced when three conditions occur simultaneously; these conditions are critical environment, susceptible alloy, and stress. The 2205 duplex stainless steels (DSS), with a dual-phase microstructure consisting of ferrite (α) and austenite (γ), are widely used in petroleum and natural gas industries and chemical tankers (Guo et al., 2011; Igual et al., 2006; Muthupandi et al., 2003; Tan et al., 2009; Zakroczymski & Owczarek, 2002) because of their high strength, good toughness, resistance to chloride pitting, and excellent corrosion resistance. However, hydrogen can be generated during corrosion process in seawater (Elhoud et al., 2010; Javidi & Bahalaou Horeh, 2014; Shahriari et al., 2013). Combined with the impact stress of waves and artificial protection measures, such as cathodic protection, 2205 DSS can easily suffer from SCC, causing significant service failures during its working lifetime. Therefore, the SCC of 2205 DSS has been extensively investigated in different solutions. The SCC mechanism of steel has been widely investigated by various methods. Anodic dissolution (Javidi & Bahalaou Horeh, 2014; Shahriari et al., 2013), hydrogen embrittlement (HE) (Elhoud et al., 2010; Javidi & Bahalaou Horeh, 2014; Woollin & Murphy, 2001), and the combination of anodic dissolution and HE (Qiao et al., 2009; Tavares et al., 2013) have all been used to explain the developing process of SCC. For DSS, the main mechanism of SCC is not clear and further research into the mechanism of SCC in DSS is required (Liu et al., 2009; Zheng, 2011; Zheng et al., 2011).
Electrochemical impedance spectroscopy (EIS) as a nondestructive and sensitive measurement has been used to investigate the mechanisms of electrochemical reactions and rates of corrosion (Ebrahimi et al., 2012; Moradi et al., 2014; Sánchez-Tovar et al., 2015). During SCC, EIS has been employed to understand the passivation and breakdown of the film (Lv et al., 2016; Mehdipour et al., 2014). Researchers studied the properties of passive films at different applied anode potentials for 2205 DSS. EIS measurements were also used to analyze the crack initiation and propagation (Lou & Singh, 2011). Lou and Singh (2011) found that the phase angle in the Bode format decreases during an active crack growth in carbon steel. Bosch (2005) developed a crack model that distinguishes electrode surfaces with or without cracks. It was shown that the phase shift (phasestressed–phasenonstressed) between two samples with and without cracks could be related to the SCC process. The author measured the phase at a particular frequency during the tests and finally found that the phase shift could be related to the SCC process.
In this study, the SCC of 2205 DSS in sulfuric acid (H2SO4) solution was studied using slow strain rate tests (SSRTs) after the samples were subjected to cathodic charging for 24 h. The phase shift of impedance developed by Bosch was also used to aid the analysis of the SCC mechanism of 2205 DSS.
2 Materials and methods
The specimens were 2205 DSS and their chemical composition is given in Table 1.
Chemical composites of 2205 DSS.
| C | P | S | Cr | Ni | N | Mo | Mn | Si | Fe |
|---|---|---|---|---|---|---|---|---|---|
| 0.014 | 0.023 | 0.001 | 22.39 | 5.68 | 0.17 | 3.13 | 1.38 | 0.39 | Balance |
The specimens were annealed at 1050°C for 30 min followed by quenching in water to make the ferrite (α) and the austenite (γ) equal to each other. The microstructure of 2205 DSS is shown in Figure 1. The best general properties were obtained with approximately equal amounts of austenitic and ferritic phases and the absence of precipitated phases (Guo et al., 2011).

Microstructure of DSS 2005.
2.1 SSRTs
SCC susceptibility was evaluated based on SSRTs. The SSRT experimental specimen is shown in Figure 2.

Size of the SSRT sample.
Each specimen was polished along the tensile direction to 1200-grit emery paper, degreased in acetone, and washed by distilled water. After that, all specimens were coated with silicone rubber to provide an identical, exposed surface area. Before the SSRT test, all specimens were divided into two groups. The first group of specimen was strained directly in the air, and the second group of specimen was precharged with a charging current density of −5 mA/cm2 in 0.5 m H2SO4 for 24 h. For hydrogen charging, a three-electrode cell was used: the 2205 DSS electrode as working electrode (WE), a platinum grid as counter-electrode (CE), and a saturated calomel electrode (SCE) as reference electrode (RE). SSRT tests were carried out after cathodic charging. The latter group of specimens was completely immersed in aqueous 0.5 m H2SO4 during the whole test. All tests were carried out at a constant strain rate of 2×10⁻⁷ s−1. Before test, aging treatment was carried out to reduce the residual stresses.
2.2 EIS tests
For the EIS test, all specimens were divided into three groups: (1) no pre-charging and no stress, (2) pre-charging for 24 h but no stress, and (3) hydrogen charging for 24 h and then take SSRT tests. All specimens were performed in 0.5 m H2SO4 made with distilled water at 20°C. The exposed coating area was 3.9 cm2. For the first two groups, EIS tests were performed every 2 h until the passive film of the DSS remained stable. For the third group, EIS tests were performed regularly from the beginning up to the failure of the specimens every 2 h by Gamry Reference-600 electrochemical workstation. A platinum grid acts as CE and SCE acts as RE, as shown in Figure 3.

Experimental set-up.
A sinusoidal potential wave with an amplitude of 10 mV in a frequency range of 10 MHz–100 kHz was applied to the samples.
2.3 Fracture morphologies tests after SSRT
All specimens were examined using JSM-6480 scanning electron microscope (SEM) and optical microscope after the SSRT tests. The purpose was to distinguish the difference of fracture type between hydrogen charged and non-hydrogen charged.
2.4 Hydrogen permeation test
Hydrogen permeation experiments were conducted at 20°C by D-S double cells. The steel was cut to a thickness of 1.0 mm using a wire-cut technique and then ground to a final thickness of 0.5 mm. The surfaces of both sides of the steel were polished to 1 μm then washed with isopropyl alcohol and rinsed by distilled water followed by air-drying. The RE (Hg/HgO) was positioned 8 mm away from the WE using a Lugin capillary tube, whereas the CE was 80 mm away from the WE. The experimental set-up was given in a previous paper (Zheng et al., 2016). The cathodic cell (charging side) was filled of 0.4 m hydrochloric acid and the anodic cell (oxidizing side) was filled of 0.2 m NaOH. The potential for passivation was 0.2 V (vs. Hg/HgO) and the cathodic charging current density was 5 mA/cm2. Until the passive current density was less than 1.5 μA/cm2, a corrosion solution (0.4 m hydrochloric acid with and without molybdate) was added into the charging side, and the charging current of −5 mA was used simultaneously.
3 Results and discussion
3.1 SSRTs
The results of SSRTs in H2SO4 solution are shown in Figure 4. It can be seen that there is a little difference in the ultimate tensile strength at the two conditions. However, the elongation was reduced in H2SO4 solution compared to air. To investigate SCC susceptibility, reduction in area loss factor (FR) and elongation loss factor (FE) were calculated as follows (Liu et al., 2008):

Stress-strain curves of 2205 DSS.
where RE and EE are reduction in area and elongation in H2SO4 solution, respectively, and R0 and E0 are reduction in area and elongation in air, respectively. The results are presented in Table 2. FR and FE are the ductility loss factors, and RE and EE of the steel in H2SO4 solution are lower than R0 and E0, which suggests that SCC occurs in H2SO4 solution. According to some researchers (Guo et al., 2011; Lv et al., 2016; Moradi et al., 2014), SCC resistance of the alloy 2205 DSS mainly depends on the residual stresses present in the material. Before test, aging treatment was carried out to reduce the residual stresses. Therefore, SCC in this paper is mainly because some of the hydrogen atoms absorbed by the metal surface during hydrogen charging permeate into the metal, resulting in HE (Chu et al., 2003).
Loss factor of 2205 DSS.
| R0 (%) | RE (%) | FR (%) | E0 (%) | EE (%) | FE (%) |
|---|---|---|---|---|---|
| 82.92 | 70.41 | 15.09 | 52.48 | 40.24 | 23.32 |
3.2 EIS tests
Figure 5 shows the Nyquist curves of the unstressed 2205 DSS with no hydrogen charging for 50 h. All Nyquist curves present a similar appearance. The semicircle of Nyquist curves is smallest at 0 h. The diameter of Nyquist curves increases with increasing immersion time in H2SO4 solution until the immersion time reaches 8 h. The initial increase in the diameter of Nyquist curves is caused by the passivity ability and kinetics of film growth of the DSS surface. After 8 h, the diameter of Nyquist curves remains the same. This phenomenon shows that the density of the passive film reaches a maximum. It appears that film formation during immersion maintains the high polarization resistance for hydrogen-free DSS.

Nyquist curves of 2205 DSS under unstressed and non-hydrogen-charging condition.
Figure 6 shows the Nyquist curves of the unstressed 2205 DSS under hydrogen-charging conditions for 160 h. Nyquist curves of the hydrogen-charged DSS show a similar trend with hydrogen-free DSS up to 8 h. However, when the immersion time increases beyond 8 h, the diameter of Nyquist curves has consistent growth until the immersion time reaches 98 h. Compared to the hydrogen-free DSS, the absolute value of the impedance of hydrogen-charged DSS is obviously lower. The reason for the above phenomenon is primarily that hydrogen charging causes the deterioration and instability of the passive film on the DSS surface. Thus, it would require more time to repair itself after hydrogen charging. To prove the passivation film instability after hydrogen charging, Raman spectroscopy was carried out in air for 24 h and charging for 24 h. The results are shown in Figure 7.

Nyquist curves of 2205 DSS under unstressed and hydrogen-charging condition.

Raman of 2205 DSS.
According to Yu et al. (1997), passivation film exhibited Raman shifts of 300, 480, and 700 cm−1. The intensity of Raman shifts decreased after charging for 24 h under −5 mA/cm2 in 0.5 m H2SO4. This indicated that hydrogen charging causes deterioration and instability of the passive film on the DSS surface.
Electrochemical impedance parameters of 2205 DSS under unstressed and non-hydrogen-charging condition.
| Time (h) | Rsol (Ω cm2) | C1F (cm2) | n | R1 (Ω cm2) |
|---|---|---|---|---|
| 0 | 0.3835 | 5.006×10⁻⁴ | 0.92 | 3.582×10⁴ |
| 2 | 0.3834 | 4.257×10⁻⁴ | 0.92 | 9.631×10⁴ |
| 4 | 0.3979 | 4.061×10⁻⁴ | 0.93 | 1.269×10⁵ |
| 6 | 0.3394 | 3.935×10⁻⁴ | 0.93 | 1.441×10⁵ |
| 8 | 0.3646 | 3.838×10⁻⁴ | 0.93 | 1.619×10⁵ |
| 10 | 0.3543 | 3.815×10⁻⁴ | 0.93 | 1.525×10⁵ |
| 20 | 0.3512 | 3.696×10⁻⁴ | 0.93 | 1.436×10⁵ |
| 30 | 0.4650 | 3.391×10⁻⁴ | 0.93 | 1.526×10⁵ |
| 40 | 0.3124 | 3.401×10⁻⁴ | 0.93 | 1.231×10⁵ |
| 50 | 0.3944 | 3.360×10⁻⁴ | 0.93 | 1.229×10⁵ |
Figure 8 shows the Nyquist curves of 2205 DSS under stressed and hydrogen-charging conditions from the beginning of the stretch to the fracture of DSS. The diameter of Nyquist curves increases with increasing immersion time until the DSS specimen breaks down. It shows a superficially similar trend with unstressed DSS. This is due to the passivation of the DSS surface by H2SO4 solution. However, cleavage fracture and secondary cracks on the fracture surface of the hydrogen-charged specimens are observed after the failure of DSS. This means that it not only reflects a passivation process.

Nyquist curves of 2205 DSS under stressed and hydrogen-charging condition.
The comparison of Nyquist curves of specimens with and without stress measured at different times is shown in Figure 9A to D. At 2 h of the stretch, the diameter of Nyquist curves of the stressed specimen is larger than that without stress. This phenomenon shows the difference of surface states of two specimens at original time. However, the difference between the two diameters becomes unclear with increasing immersion time. When the immersion time reaches 10 h, the diameters of the two Nyquist curves are almost equal, as shown in Figure 9C. After that, the increasing speed of the diameter of the unstressed specimen is larger than that with stress. Figure 9D shows the Nyquist curves of the two conditions at 40 h. It can be clearly seen that the diameter of the unstressed specimen is distinctly larger than that of the specimen with stress. The experimental results show that the stress more or less inhibits the passivation of the surface. This is mainly because the addition of stress causes the initiation of the cracks on the specimen surface. However, the increasing trend of the impedance of the stressed specimen during SSRTs provides evidence that film passivation is the dominant factor. Although the cracks appeared during SSRTs, they would also soon be passivated.

Nyquist curves of specimens with and without stress at different times: (A) 2 h, (B) 8 h, (C) 10 h, and (D) 40 h.
The impedance data for 2205 DSS with no stress and no hydrogen-charging conditions agreed with the equivalent circuit shown in Figure 10. The circuit consists of the following: Rsol is the solution resistance, R1 is the passive layer resistance, and CPE1 is the capacitance equivalent of the constant phase element, which consists of the capacity of the passive layer formed (C1) and the phenomenological coefficient (n). The n value of a CPE indicates its meaning: n=1 (capacitance), n=0.5 (Warburg impedance), n=0 (resistance), and n=−1 (inductance) (Nam, et al., 2009).

Equivalent circuit for 2205 DSS under unstressed and non-hydrogen-charging condition.
Table 3 shows the impedance data for 2205 DSS with no stress and no hydrogen-charging conditions. At this condition, n is consistently maintained at 0.93, which is the result of the deviation from the ideal dielectric behavior, arising due to the heterogeneity of the surface both laterally and within the depth of the oxide film. Rsol changes from 0.35 to 0.47 Ω cm2, indicating no obvious change of solution during immersion time. In the first 8 h of immersion time, the decrease of C1 and increase of R1 show that the passive layer of DSS in solution becomes increasingly more stable. After 8 h, R1 remains stable, reflecting the fact that the passive layer becomes stable.
The circuit model of 2205 DSS under unstressed and hydrogen-charging conditions is proposed and presented in Figure 11. In the model, Rsol is the solution resistance and CPE1 is the capacitance equivalent of the constant phase element, which consists of the capacity of the passive layer formed (C1) and phenomenological coefficient (n). R1 is the passive layer resistance, Cdl is the double charge layer capacitance between the DSS surface and H2SO4 solution, and Rdl represents charge-transfer resistance.

Equivalent circuit for 2205 DSS under unstressed and hydrogen-charging condition.
Table 4 shows the electrochemical impedance parameters obtained from the fitting of the EIS diagram. Rsol changes from 0.34 to 0.64 Ω cm2, indicating no obvious change of solution during immersion time. The value of n is consistently maintained at 0.9. The closer to 1 the numerical value of n is, the greater is the property of the passive layer (Lavigne et al., 2014). The change of C1 with time indicates that the passive layer is formed and its thickness increases. The value of R1 increases with increasing immersion time first and then remains stable after the immersion time reaches 98 h. This reveals a process where the passive layer, which is deteriorated and broken down by cathodic hydrogen charge, forms during immersion time. The value of Cdl decreases, indicating that the area of metal exposed in the solution becomes smaller; this is due to the formation of the passive layer. The change in trend of Rdl is opposite of that of Cdl, which results from larger electrical resistance with increasing immersion time.
Electrochemical impedance parameters of 2205 DSS under unstressed and hydrogen-charging condition.
| Time (h) | Rsol (Ω cm2) | C1F (cm2) | n | R1 (Ω cm2) | CdlF (cm2) | Rdl (Ω cm2) |
|---|---|---|---|---|---|---|
| 0 | 0.3474 | 7.1×10⁻⁴ | 0.89 | 897.3 | 2.94×10⁻² | 308 |
| 2 | 0.4706 | 5.9×10⁻⁴ | 0.89 | 1237 | 1.29×10⁻² | 641 |
| 4 | 0.4272 | 5.29×10⁻⁴ | 0.9 | 1468 | 1.05×10⁻² | 565 |
| 6 | 0.4295 | 5.01×10⁻⁴ | 0.9 | 1745 | 9.13×10⁻³ | 649 |
| 8 | 0.4309 | 4.86×10⁻⁴ | 0.9 | 1991 | 6.86 ×10⁻³ | 763 |
| 10 | 0.4358 | 4.62×10⁻⁴ | 0.9 | 2669 | 4.02×10⁻³ | 1285 |
| 20 | 0.6325 | 4.49×10⁻⁴ | 0.9 | 3386 | 2.74×10⁻³ | 2213 |
| 30 | 0.5771 | 4.35×10⁻⁴ | 0.9 | 3995 | 1.94×10⁻³ | 3629 |
| 40 | 0.5981 | 4.28×10⁻⁴ | 0.9 | 4377 | 1.53×10⁻³ | 5414 |
| 50 | 0.5166 | 4.2×10⁻⁴ | 0.9 | 4595 | 1.35×10⁻³ | 6826 |
| 66 | 0.5236 | 4.13×10⁻⁴ | 0.9 | 4896 | 1.21×10⁻³ | 9032 |
| 98 | 0.6262 | 4.13×10⁻⁴ | 0.9 | 5540 | 1.03×10⁻³ | 15,510 |
| 160 | 0.6301 | 4.03×10⁻⁴ | 0.9 | 5380 | 1.16×10⁻³ | 15,620 |
The maximum value of R1′ (passive layer resistance under unstressed and hydrogen-charging conditions) is 1.619×10⁵ Ω cm2 at 8 h. At the same time, the maximum value of R1 (passive layer resistance under unstressed and hydrogen-charging conditions) is 5540 Ω cm2 at 98 h, which is much smaller than R1′. This means that the property of the passive layer, which is passivated in H2SO4 solution, after hydrogen charge is far poorer than without hydrogen charging, and it also requires a much longer time for the passive layer to become stable.
The circuit model of 2205 DSS under stressed and hydrogen-charging conditions for the first 6 h is the same as the unstressed and hydrogen-charged one, as shown in Figure 11. Therefore, the behaviors of 2205 DSS under two different conditions are the same for the first 6 h during passivation of the DSS surface. The electrochemical impedance parameters obtained from the fitting of the EIS diagram are shown in Table 5. Compared to R1 and R1′, it can be seen that the increasing rate of R1 remains large and stable from 0 to 6 h, whereas the increasing rate of R1′ from 2 to 6 h is less than R1. This is due to the inhibition of the passivation of 2205 DSS by stress. The passive film formed in unstressed and hydrogen-charging conditions is easier. After 6 h, the circuit model in Figure 11 is no longer suitable for the stressed and hydrogen-charging conditions, and other circuit models are also not suitable for this condition. The reason for this is that cracks are generated after 6 h. The cracking process generates high instability, and the spectrum obtained from a long time measurement is averaged (Lou & Singh, 2011). Thus, data fitting using an equivalent circuit is not suitable for SCC studies. The transmission line model (TLM), as shown in Figure 12, was used to describe the whole SCC process during SSRTs (Liu et al., 2008; Lou & Singh, 2011; Nam et al., 2009). All the systems studied have a similar characteristic – the phase angle decreases at a certain point in time. This means that a single crack propagation process occurs in these systems. However, the phenomenon is not found in this system; the diameter of Nyquist curve and phase angle continued to increase during measuring time. In other words, when the crack is generated, it is not a single propagation process. Thus, the TLM is not suitable for this system. To evaluate the initiation and propagation of cracks, the phase shift (phasestressed–phasenonstressed) between two conditions is used (Bosch, 2005).
Electrochemical impedance parameters of 2205 DSS under stressed and hydrogen-charging condition.
| Time (h) | Rsol (Ω cm2) | C1′F (cm2) | n | R1′ (Ω cm2) | Cdl′F (cm2) | Rdl′ (Ω cm2) |
|---|---|---|---|---|---|---|
| 0 | 0.5877 | 8.1×10⁻⁴ | 0.93 | 991 | 1.61×10⁻³ | 541 |
| 2 | 0.6094 | 7.2×10⁻⁴ | 0.92 | 1801 | 9.36×10⁻³ | 921 |
| 4 | 0.6119 | 6.8×10⁻⁴ | 0.92 | 1935 | 9.26 ×10⁻³ | 777 |
| 6 | 0.6153 | 6.5×10⁻⁴ | 0.92 | 2037 | 6.06 ×10⁻³ | 801 |

TLM.
Generally, the analyzed range of frequencies in EIS should reflect the dynamics of the electrochemical process. The response from a higher-frequency perturbation, such as 100 and 1000 Hz, represents a faster electrochemical process, which is closer to a non-Faradaic progress (Bosch et al., 2001; Lou & Singh, 2011). Therefore, data clearly show that a frequency that is lower than 10 Hz reflects the electrochemical behavior during SSRT. It should also be noted that the slower-frequency analysis, such as 0.01 Hz, can generate higher instability during the dynamic cracking process. Therefore, the phase angle from a frequency between 0.1 and 10 Hz better represents the cracking behavior.
The phase differences are calculated for different frequencies from 0.1 to 10 Hz. Figure 13 shows the evolution of phase shift during SSRTs. A clear difference between the phases of the tests with and without stress can be noticed from about 5 h at 10 Hz. At 1 and 0.1 Hz, the difference is clearer and also starts from about 5 h. Thus, it shows that for the application of EIS to the monitoring of SCC under these circumstances a frequency between 10 and 0.1 Hz is the correct choice. It also shows that the phase shift at 1 and 0.1 Hz is much larger than those at 10 Hz. Thus, 1 and 0.1 Hz responses are more pronounced than the 10 Hz response. When it reaches 6 h, the phase shifts start to increase, suggesting the formation of SCC. At 24 h, the phase shift at 1 Hz reaches the largest value and then it starts to decrease until the DSS fractures. A similar phenomenon is observed at 0.1 Hz, where it also has both a rising trend at the beginning of the SSRT and a downward trend in the process of SSRT, meaning the development of the crack is not continued. Because of the passivation ability of DSS in H2SO4, when the crack forms during SSRTs, it may be passivated quickly. As a result of the stress on DSS, the passive layer at the crack will be broken, but it will soon be repassivated again. This is the reason why phase shifts at 0.1 and 1 Hz do not increase continuously.

Evolution of phase shift during SSRT.
3.3 Hydrogen permeation tests
Figure 14 shows the hydrogen permeation current curves of 2205 DSS with charging current density of −5 mA/cm2 in 0.5 m H2SO4 for 24 h. With the time increasing, the current density increases gradually, indicating that hydrogen has permeated from the charging side to the oxidizing side (Zheng et al., 2016). The permeated hydrogen amount was calculated by integral. About 7.05 mmol H atoms permeated through the specimen, meaning 7.05 mmol H atoms permeated into the SSRT specimen during the 24 h charging time. Because the specimen was solution treated to reduce the residual stresses, SCC in this paper is mainly because the hydrogen atoms absorbed by the metal surface during hydrogen charging permeate into the metal resulting in HE (Chu et al., 2003).

Hydrogen permeation curve of 2205 DSS under charging current density of −5 mA/cm2 in 0.5 m H2SO4 for 24 h.
3.4 Fracture morphologies after SSRT
SEM photomicrographs of the hydrogen-free specimen after failure in air and the specimen after failure in 0.5 m H2SO4 with hydrogen charging are shown in Figure 15. It can be seen that the fracture morphology is significantly different between the two specimens. The fracture surface obtained in air shows that severe necking is distributed around the fracture (Figure 15A), indicating a typical ductile fracture in the surface. This phenomenon is not observed in the other specimens. Instead of severe necking, there are many steps around the fracture of the hydrogen-charged specimen in 0.5 m H2SO4 (Figure 15C). From the macrophotographs, necking is small for hydrogen-charged specimens, and fracture characters are found in hydrogen charging. The elongation for the hydrogen charged and uncharged are 20.4% and 13.8%, respectively. These indicate that, after hydrogen charging, SCC susceptibility increases.
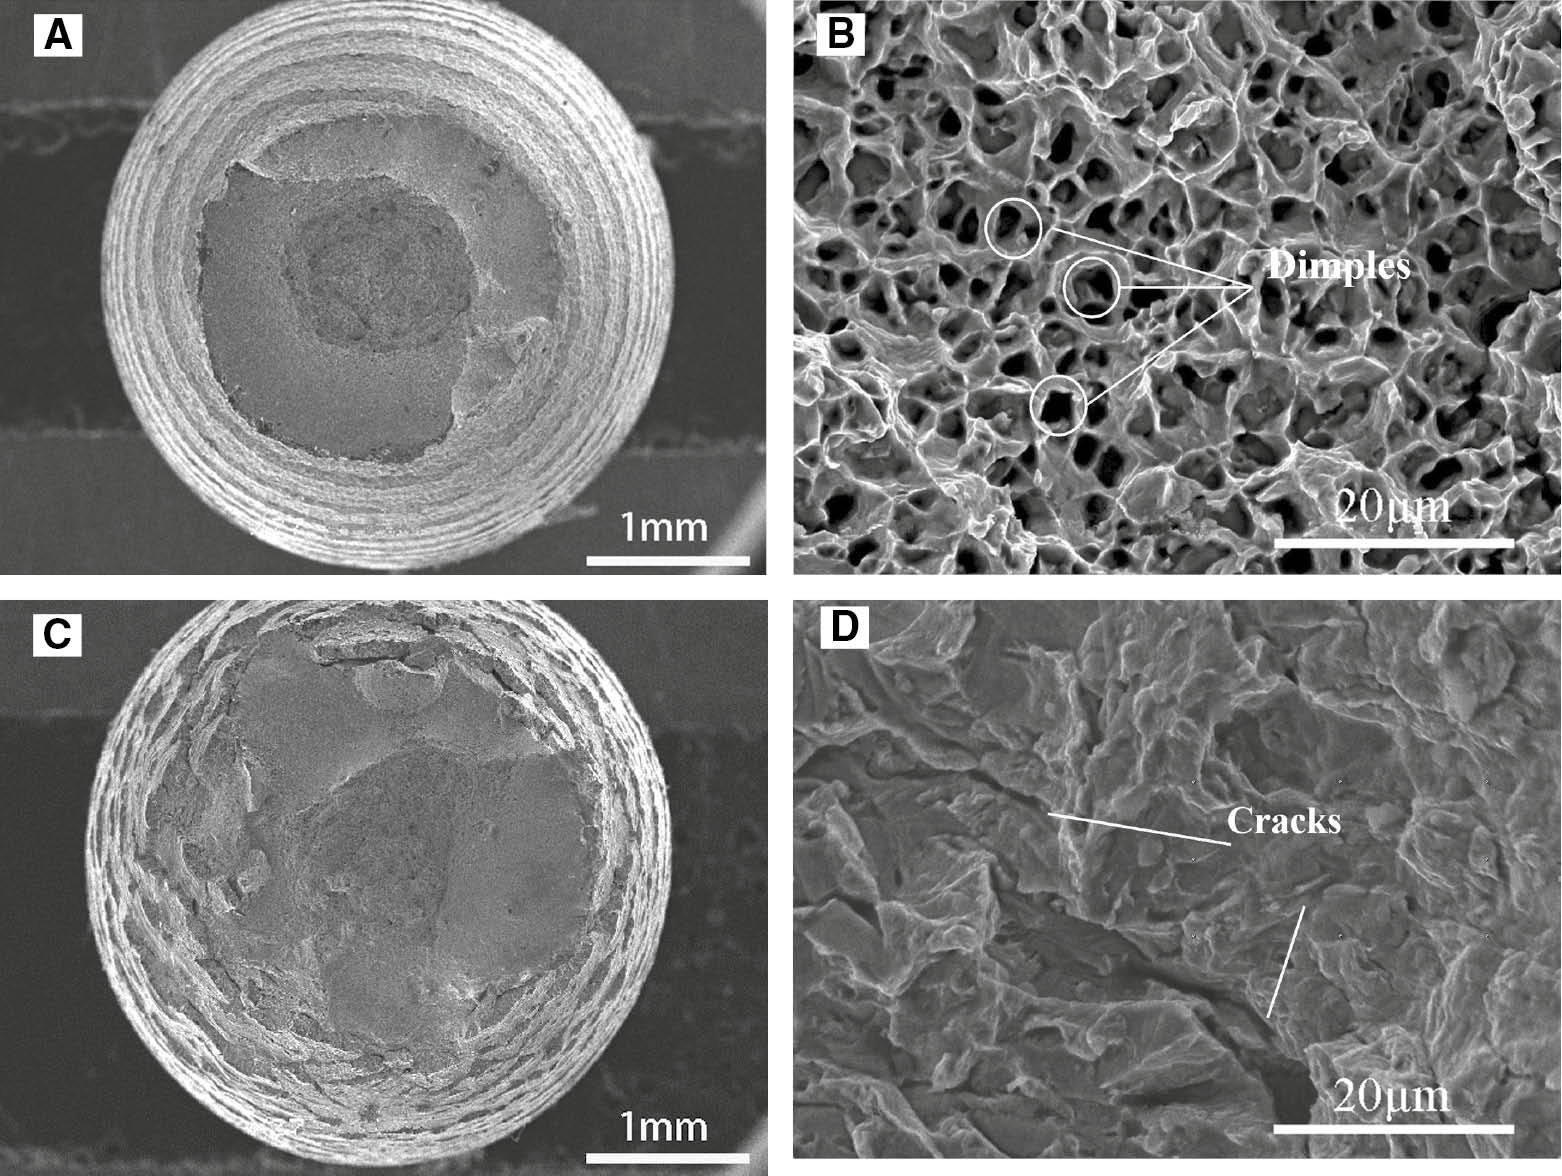
SEM photomicrographs of the hydrogen-free specimen after failure in air and the specimen after failure in 0.5 m H2SO4 with hydrogen charge. (A, B) No-hydrogen charged in air; (C, D) hydrogen charged in 0.5 m H2SO4.
A closer view of the photomicrographs is given in Figure 15B to D. Some typical dimples resulting from ductile fracture can be seen on the fracture surface of the specimen in air and no crack is observed. On the contrary, the cleavage fracture and secondary cracks on the fracture surface of hydrogen-charged specimens in 0.5 m H2SO4 are observed, indicating a brittle fracture.
Figure 16A and B shows the secondary cracks in the failed specimen with hydrogen charging. Cracks propagate from the surface of the specimen to the internal structure. Zigzag microcracking is shown in Figure 16B, which is a characteristic of cracks by HE of DSS (Lou & Singh, 2011; Zucchi et al., 2006). The transgranular cracking morphology is also shown. Both phenomena show evidence that when the secondary cracks run up against ductile austenite they will be arrested by austenite or change direction.

Secondary cracks in the failed specimen with hydrogen charge. (A, B) Cross section of fracture after hydrogen charged in 0.5 m H2SO4.
A schematic figure of the repassivation mechanism is shown in Figure 17. At first, the passive films are formed somewhere on the DSS surface. After that, the stress made the passive film and the steel substrate break down. As soon as the passive film and the steel substrate were broken down, repassivation was initiated due to H2SO4 solution. Thus, although the stress during SSRT ruptures the passive film and steel substrate, the rate of repassivation is higher than the rate of breakdown of the passive film and steel substrate.

Schematic figure of repassivation mechanism.
4 Conclusions
The SCC behavior of 2205 DSS in 0.5 m H2SO4 under hydrogen-charging conditions was studied by EIS combined with SSRT and SEM. The results obtained are listed below:
Compared to 2205 DSS samples in H2SO4 solution, hydrogen-charged 2205 DSS samples are more susceptible to SCC. The ductility of the latter is also significantly reduced.
Hydrogen charging degrades the passive film on 2205 DSS in H2SO4 solution, which also reduces the corrosion resistance of the samples.
The phase shift in EIS is closely related to the breakdown and repassivation of the passive film on 2205 DSS. This situation suggests that EIS testing could be applied to detect SCC in hydrogen-charged samples.
Acknowledgments
This paper was supported by the Natural Science Foundation of Jiangsu Province, China (no. BK20141292), the Natural Science Foundation of China (no. 51051055), and the International Cooperation Project of the Natural Science Foundation of China (no. 51310105001).
References
Bosch RW. Electrochemical impedance spectroscopy for the detection of stress corrosion cracks in aqueous corrosion systems at ambient and high temperature. Corros Sci 2005; 47: 125–143.10.1016/j.corsci.2004.05.018Search in Google Scholar
Bosch RW, Moons F, Zheng JH, Bogaerts WF. Application of electrochemical impedance spectroscopy for monitoring stress corrosion cracking. Corrosion 2001; 57: 532–539.10.5006/1.3290379Search in Google Scholar
Chu WY, Gao KW, Qiao LJ, Zhang Y. An investigation of corrosion-induced stress during SCC. J Univ Sci Technol Beijing 2003; 10: 1–7.Search in Google Scholar
Ebrahimi N, Momeni M, Kosari A, Zakeri M, Moayed MH. A comparative study of critical pitting temperature of stainless steels by electrochemical impedance spectroscopy, potentiodynamic and potentiostatic techniques. Corros Sci 2012; 59: 96–102.10.1016/j.corsci.2012.02.026Search in Google Scholar
Elhoud AM, Renton NC, Deans WF. Hydrogen embrittlement of super duplex stainless steel in acid solution. Int J Hydrogen Energ 2010; 35: 6455–6464.10.1016/j.ijhydene.2010.03.056Search in Google Scholar
Guo LQ, Li M, Shi XL, Yan Y, Li XY, Qiao LJ. Effect of annealing temperature on the corrosion behavior of duplex stainless steel studied by in situ techniques. Corros Sci 2011; 53: 3733–3741.10.1016/j.corsci.2011.07.019Search in Google Scholar
Igual MA, Garcia AJ, Guinon JL, Perez HV. The effect of chromate in the corrosion behaviour of duplex stainless steel in LiBr solutions. Corros Sci 2006; 48: 4127–4151.10.1016/j.corsci.2006.03.009Search in Google Scholar
Javidi M, Bahalaou Horeh S. Investigating the mechanism of stress corrosion cracking in near-neutral and high pH environment for API 5L X52 steel. Corros Sci 2014; 80: 213–220.10.1016/j.corsci.2013.11.031Search in Google Scholar
Lavigne O, Shoji T, Takeda Y. EIS pitting temperature determination of A182 nickel based alloy in simulated BWR environment containing dilute seawater. Nucl Eng Des 2014; 273: 435–439.10.1016/j.nucengdes.2014.01.031Search in Google Scholar
Liu ZY, Li XG, Du CW, Zhai GL, Cheng YF. Stress corrosion cracking behavior of X70 pipe steel in an acidic soil environment. Corros Sci 2008; 50: 2251–2257.10.1016/j.corsci.2008.05.011Search in Google Scholar
Liu ZY, Dong CF, Li XG, Zhi Q, Cheng YF. Stress corrosion cracking of 2205 duplex stainless steel in H2S-CO2 environment. J Mater Sci 2009; 44: 4228–4234.10.1007/s10853-009-3520-xSearch in Google Scholar
Lou XY, Singh PM. Phase angle analysis for stress corrosion cracking of carbon steel in fuel-grade ethanol: experiments and simulation. Electrochim Acta 2011; 56: 1835–1847.10.1016/j.electacta.2010.07.024Search in Google Scholar
Lv JL, Liang TX, Wang C, Guo T. Influence of sensitization on passive films in AISI 2205 duplex stainless steel. J Alloy Compd 2016; 658: 657–662.10.1016/j.jallcom.2015.10.246Search in Google Scholar
Mehdipour M, Naderi R, Markhali BP. Electrochemical study of effect of the concentration of azole derivatives on corrosion behavior of stainless steel in H2SO4. Prog Org Coat 2014; 77: 1761–1767.10.1016/j.porgcoat.2014.05.023Search in Google Scholar
Moradi M, Song ZL, Yang LJ, Jiang JJ, He J. Effect of marine Pseudoalteromonas sp. on the microstructure and corrosion behaviour of 2205 duplex stainless steel. Corros Sci 2014; 84: 103–112.10.1016/j.corsci.2014.03.018Search in Google Scholar
Muthupandi V, Bala SP, Seshadri SK. Effect of weld metal chemistry and heat input on the structure and properties of duplex stainless steel welds. J Mater Sci 2003; 358: 9–16.10.1016/S0921-5093(03)00077-7Search in Google Scholar
Nam ND, Lee SH, Kim JG, Yi JW, Lee KR. Effect of stress on the passivation of Si-DLC coating as stent materials in simulated body environment. Diamond Relat Mater 2009; 18: 1145–1151.10.1016/j.diamond.2009.02.032Search in Google Scholar
Qiao LJ, Xiao JM, Chu WY. Concentration distribution of hydrogen at crack tip of austenitic stainless steel after stress corrosion and hydrogen charging. J Chin Soc Corros Protect 2009; 9: 235–239.Search in Google Scholar
Sánchez-Tovar R, Leiva-García R, García-Antón J. Characterization of thermal oxide films formed on a duplex stainless steel by means of confocal-Raman microscopy and electrochemical techniques. Thin Solid Films 2015; 576: 1–10.10.1016/j.tsf.2014.12.024Search in Google Scholar
Shahriari A, Shahrabi T, Oskuie AA. A study on stress corrosion cracking of X70 pipeline steel in carbonate solution by EIS. J Mater Eng Perform 2013; 22: 1459–1470.10.1007/s11665-012-0418-6Search in Google Scholar
Tan H, Jiang YM, Deng B, Sun T, Xu JL, Li J. Effect of annealing temperature on the pitting corrosion resistance of super duplex stainless steel UNS S32750. Mater Charact 2009; 60: 1049–1054.10.1016/j.matchar.2009.04.009Search in Google Scholar
Tavares SSM, Silva VG, Pardal JM. Investigation of stress corrosion cracks in a UNS S32750 super duplex stainless steel. Eng Fail Anal 2013; 35: 88–94.10.1016/j.engfailanal.2012.12.013Search in Google Scholar
Woollin P, Murphy W. Hydrogen embrittlement stress corrosion cracking of super duplex stainless steel. Corrosion 2001. Paper 01018.10.5006/C2001-01018Search in Google Scholar
Yu JK, Cao CN, Lin HC. Detecting susceptibility to intergranular corrosion of sensitized stainless steel by PECLI and RRS. Corros Sci Protect Technol 1997; 9: 153–156.Search in Google Scholar
Zakroczymski T, Owczarek E. Electrochemical investigation of hydrogen absorption in a duplex stainless steel. Acta Mater 2002; 50: 2701–2713.10.1016/S1359-6454(02)00105-2Search in Google Scholar
Zheng C. Temperature effect on hydrogen permeation of X56 steel. Mater Perform 2011; 4: 72–76.10.5006/MP2011_50_4-72Search in Google Scholar
Zheng CB, Jiang HK, Huang YL. Hydrogen permeation behaviour of X56 steel in simulated atmospheric environment under loading. Corros Eng Sci Technol 2011; 46: 365–367.10.1179/147842209X12559428167689Search in Google Scholar
Zheng CB, Cai L, Tang ZJ. The inhibition effect of the molybdate on hydrogen permeation of 2205 duplex stainless steel. Surf Coat Technol 2016; 287: 153–159.10.1016/j.surfcoat.2015.12.077Search in Google Scholar
Zucchi F, Grassi V, Monticelli C, Trabanelli G. Hydrogen embrittlement of duplex stainless steel under cathodic protection in acidic artificial sea water in the presence of sulphide ions. Corros Sci 2006; 48: 522–530.10.1016/j.corsci.2005.01.004Search in Google Scholar
©2017 Walter de Gruyter GmbH, Berlin/Boston
Articles in the same Issue
- Frontmatter
- In this issue
- Obituary
- Roger Washburne Staehle (February 4, 1934– January 16, 2017)
- Original articles
- Microstructural analysis and corrosion behavior of Fe, B, and Fe-B-modified Cu-Zn-Al shape memory alloys
- Characterisation of localised corrosion behaviour of Ti-Ta-Mo alloy for the nuclear industry
- Investigating the influence of hydrogen on stress corrosion cracking of 2205 duplex stainless steel in sulfuric acid by electrochemical impedance spectroscopy
- Corrosion analysis of copper T2 exposed to polluted atmospheres and study on prediction model
- Influence of the electric double-layer capacitance at the rate of corrosion at the phase interface
- Corrosion rate determination of vessel walls agitated by double impeller and gas sparging
- Retraction
- Retraction of: Nanoporous copper: fabrication techniques and advanced electrochemical applications