Effect of cathodic polarisation on the corrosion behaviour of 316L stainless steel under static and dynamic conditions
-
Farzin Arjmand obtained his PhD degree in Science in 2013 from Ghent University (Belgium) under Prof. Adriaens supervision. His PhD thesis, focused on the development and application of microelectrochemical techniques for investigation of the corrosion performance of metals and alloys. After graduation he joined the School of Mechanical Engineering of Shanghai Jiao Tong University in China and currently he holds a postdoctoral research position in the field of corrosion of iron and nickel based alloys at high-temperature water.
 and
and
Annemie Adriaens graduated with a PhD in Analytical Chemistry in 1993 from the University of Antwerp (Belgium), where she was involved in the optimization of new technologies for inorganic micro and trace analysis. In 2001 she became professor in Analytical Chemistry at Ghent University (Belgium) where she leads the research group “Electrochemistry and Surface Analysis”. Research involves, amongst other projects, the use of electrochemical techniques for monitoring and treatment of corroded metallic objects. The experiments are performed using spectroelectrochemistry, allowing the simultaneous treatment/monitoring and analysis of the metal surface.

Abstract
The role of cathodic polarisation on the corrosion of 316L stainless steel was investigated under static and dynamic conditions. The results reveal that the applied flow regime during the cathodic polarisation process has a direct effect on the corrosion behaviour of steel. The cathodic polarisation of steel under static conditions increases the oxygen reduction rate and shifts the corrosion potential towards nobler potentials. Under dynamic conditions, depending on the regime of the applied fluid flow during cathodic and anodic polarisation, the oxygen reduction rate can increase, causing the corrosion potential of the cathodically polarised steel to shift towards more positive direction. On the contrary, the oxygen reduction rate can decrease and the corrosion potential of the cathodically polarised steel shifts towards more negative potentials.
1 Introduction
Studies regarding flow-accelerated corrosion, also known as flow-induced corrosion, and its hydrodynamic properties performed up to now can generally be divided into two major groups. One group has focused on the effects of fluid flow on the electrochemical responses obtained from corrosion processes (Deyab, 2009; Dong, Xiao, Li, & Cheng, 2010; Jafarzadeh, Shahrabi, Hadavi, & Hosseini, 2007; Jafarzadeh, Shahrabi, & Oskouei, 2009; Leiva-García, Muñoz-Portero, García-Antón, & Sánchez-Tovar, 2012; Liu & Cheng, 2009; Lu, Luo, Guo, & Mao, 2011; Montañés, Sánchez-Tovar, García-Antón, & Pérez-Herranz, 2012; Musa et al., 2009; Nesic, Solvi, & Enerhaug, 1995; Niu & Cheng, 2008; Rauf & Mahdi, 2012; Wang & Bierwagen, 2009; Wharton & Wood, 2004; Wood, Hutton, & Schiffrin, 1990; Zheng, Che, & Liu, 2008). Another group has investigated the mechanical properties of a corrosive environment under single-phase and multiphase flow conditions, different mechanisms and regimes of fluid flow, and their effects on the corrosion of metals and alloys in media containing solid particles. Data obtained through electrochemical measurements partly support the ideas of the latter group (Ahmed, Bello, Nakla, & Al Sarkhi, 2012; Barik, Wharton, Wood, Tan, & Stokes, 2005; Hu, Barker, Neville, & Gnanavelu, 2011; Kain, Roychowdhury, Ahmedabadi, & Barua, 2011; Kim, Park, & Hwang, 2010; Malka, Nesic, & Gulino, 2007; Nanjo et al., 1995; Pietralik, 2012; Shehata, Nosier, & Sedahmed, 2002; Subramanian et al., 2012; Villarreal, Laverde, & Fuentes, 2006; Wang et al., 2011; Wu, Jing, Zheng, Yao, & Ke, 2004; Yuan, Pandey, & Bickel, 2008; Zhu et al., 2012).
In principle, corrosion under fluid flow is a combination of electrochemical and mechanical phenomena, the combined synergistic effect of which, in the case of certain metals such as aluminium, is responsible for up to 50% of the total mass loss (Guo, Lu, & Luo, 2005). Although it has been reported that fluid flow, especially at high velocities, can remove formed microgalvanic cells, known as corrosion sites from the surface, and therefore decrease the corrosion rate, there is no doubt that the increase of the flow velocity below this critical rate increases the corrosion rate (Gehring & Peterson, 1981).
From a mechanical point of view, flow-accelerated corrosion usually has three consecutive steps (Pietralik, 2012): (1) the formation of metallic ions at the metal surface by the electrochemical oxidation of metal atoms, (2) the diffusional mass transfer of metallic ions formed in the oxide layer-electrolyte interface, and (3) the mass transfer of the formed metallic ions from the oxide-electrolyte interface into the bulk electrolyte. Figure 1 shows these layers and the diffusion region (Zheng et al., 2008). In the hydrodynamic layer between the bulk electrolyte and the oxide layer, reactants such as chloride ions move towards the metal oxide layer and formed corrosion products towards the bulk solution. Increasing the mass transfer coefficient and decreasing the diffusion layer can therefore increase the corrosion rate (García, Tamarit, & García-Antón, 2011).

Diffusion layer at the working electrode surface.
In the case of stainless steel, fluid flow and its velocity are significant parameters, which always need to be considered especially in pitting corrosion. It has been proven that austenitic steels, such as 316, are in lower risk of pitting corrosion at high flow velocities. Velocities >1.5 m/s have been suggested in the literature to avoid pit formation (LaQue, 1975; Fontana, 1987). These high velocities deactivate the pits at the initial stages of their formation.
In sodium chloride (NaCl) solutions, the breakdown of the oxide film, which may cause pitting corrosion in stainless steel, occurs through chloride attack. Aggressive chloride ions directly attack the weak points of the steel (Berke, Escalante, Nmai, & Whiting, 1996). These attacks may form pits over the surface. Literature data have shown that corrosion is a result of the competition between different aggressive ions, such as chlorides and oxygen, which contribute to the destruction and repair of the protective oxide layer, respectively (Gehring & Peterson, 1981). Chloride ions attack the protective oxide film and cause its breakdown, whereas oxygen simultaneously repairs the formed defects (Jafarzadeh et al., 2007). Therefore, pitting occurs when the rate of destruction of the oxide layer exceeds the rate of repair.
In addition, during the corrosion process of steel, the reduction process, such as the oxygen and hydrogen reduction on the metal-electrolyte interface, is a well-known phenomenon (Pickering & Frankenthal, 1972). In a near-neutral pH solution, such as NaCl, the reduction of hydrogen and water generates hydrogen atoms and molecules. Part of the hydrogen atoms can be absorbed by the steel surface. Due to the weak acidic pH of NaCl solution, the majority of the hydrogen atoms that are absorbed by the steel are produced by the water reduction process (Kim, Fregonese, Mazille, Feron, & Santarini, 2006; Pickering & Frankenthal, 1972; Qiao, Chu, & Hsiao, 1988; Qiao, Luo, & Mao, 1998).
The generated hydrogen atoms that penetrate the metal break down the local oxide film and form micropits/microcracks and metal particles. These pits act as preferential sites during the anodic dissolution of the metal (Lee & Pyun, 2000). Therefore, this process can increase the corrosion rate and the passive current density of iron-based alloys (Nishimura, Habazaki, Kawashima, Asami, & Hashimoto, 1991), promote anodic dissolution (Hasegava & Osawa, 1983), decrease the stability of the passive layer (Yang, Qiao, Chiovelli, & Luo, 1998), and increase the pitting susceptibility (Yashiro, Pound, Kumagai, & Tanno, 1998).
When cathodic polarisation is applied on a metal/alloy surface, the hydrogen evolution process occurs with greater intensity. This can be done by applying a static potential more negative than the equilibrium potential of H2/H+ and H2O/H2 redox couples (Lee & Pyun, 2000).
A group of researchers (Rodriguez, Tichelaar, Koper, & Yanson, 2011) recently reported the cathodic polarisation process (cathodic corrosion) as a simple technique for producing metal nanoparticles.
This study investigates the effect of prior cathodic polarisation on the electrochemical corrosion of 316L stainless steel under static condition and under two different flow conditions. The main goal is to examine the effect of hydrogen penetration into the surface of steel on its electrochemical corrosion response and to determine any differences in this process between static and dynamic media with different flow regimes containing NaCl.
2 Materials and methods
2.1 Specimens, chemicals, and surface preparation
A 0.1 m NaCl solution was prepared using analytical grade NaCl powder (Sigma-Aldrich, Fluka, St. Louis, MO, USA).
All experiments in this work were performed on 316L stainless steel coupons with the following chemical composition (in wt%): C 0.024, Si 0.46, Mn 1.22, P 0.038, S 0.0048, Ni 9.69, Cr 16.45, Mo 1.95, Cu 0.35, and Al 0.020. All coupons are 12.5 mm in diameter and 2 mm thick. They were ground with 600-grit silicon carbide paper (Buehler, Düsseldorf, Germany) and then polished with a polishing cloth (MicroCloth, Buehler, Düsseldorf, Germany) using 1.0 μm and then 0.5 μm alumina particles. Finally, the samples were washed with distilled water and acetone and rinsed ultrasonically in ethanol for 5 min. To apply similar experimental conditions on the samples, all measurements were performed within 1 h of polishing.
2.2 Cell design and electrochemical measurements
In this study, we constructed two different dynamic condition systems. One contains a rotating disc electrode (RDE) and the other one is a homemade flow cell setup. The RDE setup (CTV101-Radiometer Copenhagen, France), with a maximum of 5000 rotations/min (rpm), was immersed in a fiberglass cell with 100 ml electrolyte, and for every measurement, a proper rotation rate was applied through the digital speed controller. The homemade flow cell (Figure 2) had an almost 1 l electrolyte container and was equipped with a water pump (ProFlow u 500, 6 W, max. 440 l/h, D-67141, Neuhofen, Germany). In this setup, the electrodes were immersed in a fiberglass cell with an inner diameter of 3.5 cm and the electrolyte was pumped through a plastic tube with an inner diameter of 6 mm. This way, a maximum flow rate of 8.6 cm3/s was applied over the sample.

Schematic diagram of the homemade flow cell.
WE, working electrode (steel coupon); RE, reference electrode (Ag/AgCl/KCl sat.); CE, counter electrode (graphite rod).
Both static and dynamic setups used a graphite rod with a diameter of 2 mm as a counter electrode and a saturated Ag/AgCl/KCl reference electrode attached to an Autolab Eco Chemie potentiostat (PGSTAT 10, Utrecht, The Netherlands). All measurements were performed in a 0.1 m NaCl solution.
To apply cathodic polarisation to the samples, a potentiostatic polarisation was carried out at three different potentials (-1.3, -1.5, and -1.7 V), each time for a duration of 600 s. In this work, after each potentiostatic polarisation measurement, the generated hydrogen gas bubbles were removed from the surface of the steel electrode by gently stirring the solution after the measurement under static conditions. Under dynamic conditions, because the produced fluid flow removed the gas bubbles from the surface during the cathodic polarisation process, the removal of hydrogen gas bubbles after potentiostatic polarisation was not necessary.
The test specimens were immersed into the NaCl solution for approximately 16 h until a stable value of open circuit potential (OCP) was attained. After this step, the potentiodynamic polarisation curves of the samples were recorded versus the reference electrode with and without cathodic polarisation with a scan rate of 1 mV/s. In addition, electrochemical impedance spectroscopy measurements of the steel samples were carried out in the frequency range of 10 kHz to 0.01 Hz, with an amplitude of 10 mV at a stable OCP. Nyquist plots were recorded with and without cathodic polarisation of each sample at different cathodic potentials and under static and flow conditions.
2.3 Scanning electron microscopy (SEM) and atomic force microscopy (AFM)
The surface topography of the samples was examined by AFM with and without cathodic polarisation by three different cathodic potentials under static and flow conditions. For this, we used a Dimension Edge microscope (Bruker, Billerica, MA, USA) with an antimony-doped silicon tip in a tapping mode. The values of the roughness parameters (in this work, Ra and Rq) were provided by the software of the instrument.
SEM energy-dispersive X-ray spectroscopy (EDS) analyses were performed by a JSM-7600F SEM (JEOL, Tokyo, Japan) and an X-MAXN-50 EDS detector (Oxford Instruments, Abingdon, Oxfordshire, UK).
3 Results and discussion
3.1 Flow motion and produced flow regime
It is known that the rotation of the electrode produces a fluid flow in a vertical direction from the solution towards the electrode surface (Baune, Breunig-Lyriti, & Plath, 2002; Real-Ramirez, Tello, Reyes, & Trejo, 2010). The fluid flow constructed by the flow cell, however, has a different regime. Here, the electrolyte is pumped in a straight direction over the surface and exits from the cell through the outlet tube. However, we know that the electrolyte stream produced by the flow cell makes a complex vortex flow regime when it reaches the immersed electrode, which acts here as a semiwall inside the cell.
In this work, these two different flow regimes were applied on the steel samples at various velocities, and the corrosion behaviour of the steel with and without cathodic polarisation at three different cathodic potentials was investigated.
3.2 Potentiodynamic polarisation under static and flow conditions
Figure 3 shows the potentiodynamic polarisation curves of freshly polished 316L stainless steel coupons in a 0.1 m NaCl solution under static and flow conditions. These graphs were obtained using the homemade flow cell and RDE. The applied flow rates were 1.3, 5.5, and 8.6 cm3/s for the flow cell and 50 up to 3000 rpm for the RDE. These curves show that the potentiodynamic polarisation of steel in the presence of a fluid flow results in higher cathodic current densities, in which cathodic current densities increase with increasing flow rate for both flow regimes. This can be attributed to the higher rate of the cathodic reduction reactions, especially that of the dissolved oxygen in the flow system (Kim et al., 2006). In Figure 3A (flow cell), the corrosion potential (Ecorr) of steel changes from -0.39 to -0.21 V when a flow velocity of 1.3 cm3/s is applied, increasing to -0.13 V for a flow rate of 8.6 cm3/s. However, the anodic current densities obtained for different flow velocities show no significant difference.
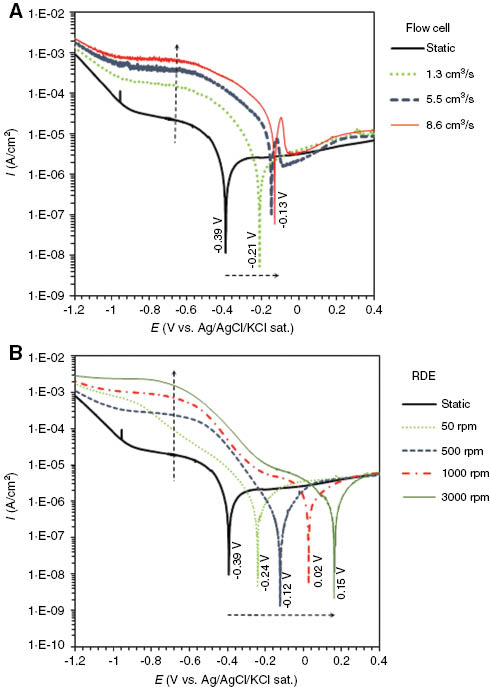
Potentiodynamic polarisation curves of steel without cathodic polarisation under static and flow conditions obtained using (A) the flow cell and (B) an RDE.
Similar results were obtained using the RDE (Figure 3B). Here, the Ecorr of steel shifts to -0.24 V under 50 rpm rotation rate, and parallel to the increase of the rotation rate, this potential increases. Finally, when applying a high rotation rate of 3000 rpm, the Ecorr appears to be 0.15 V.
Based on these measurements and considering the anodic and cathodic reactions that occurred on the steel surface during the anodic dissolution, the observed current and potential shifts can be explained as follows.
During the corrosion of steel in solutions, such as NaCl, the oxidation of iron and the reduction of oxygen are the main anodic and cathodic electrochemical reactions, respectively.
The anodic dissolution of iron is known as a pure charge transfer-controlled process (Bockris & Drazic, 1962). However, the oxygen reduction reaction has been described in the literature as a mixed charge transfer and mass transfer-controlled process (Caceres, Vargas, & Herrera, 2007; Davydov et al., 2005; Miyata & Asakura, 2002). In the presence of a fluid flow, the mass transport-limited cathodic reduction of dissolved oxygen is dominant. Therefore, under flow conditions, the mass transfer of oxygen from the electrolyte to the metal surface, and therefore the cathodic current density, increases. In our opinion, the hydroxyl ions produced during the oxygen reduction reaction increase the pH of an electrolyte. This supports the surface passivation process and shifts the corrosion potential towards nobler potentials.
3.3 Effect of the flow velocity on the pit nucleation
According to our measurements on stainless steel, the maximum flow velocity at which pits can form was found at approximately 1.3 cm3/s using the flow cell described in Figure 2. Figure 4 shows the optical micrographs of four steel coupons after potentiodynamic polarisation in 0.1 m NaCl with a scan rate of 1 mV/s under static conditions (a) and under a fluid flow (b–d) constructed by the homemade flow cell. Figure 4A clearly shows pits that cover the entire surface; after the polarisation of the sample under a 1.3 cm3/s velocity, the number of pits was reduced, and under higher velocities (5.5 and 8.6 cm3/s), no pitting was observed.
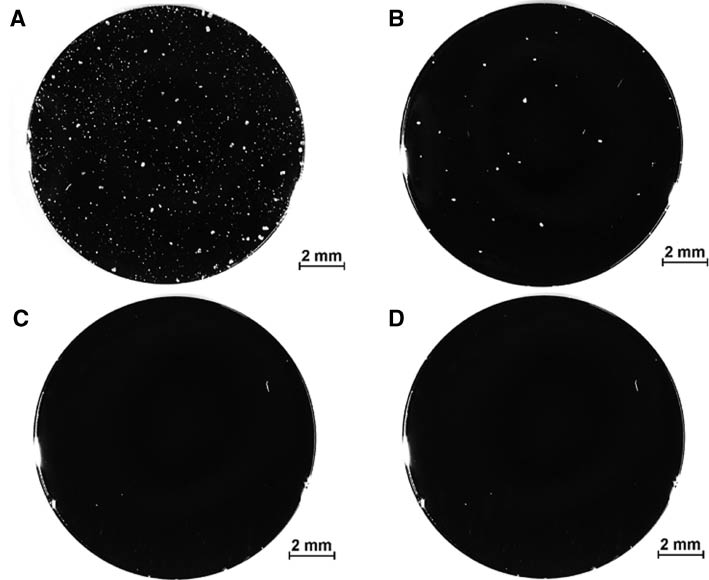
Optical micrographs of pits observed on the steel coupons after potentiodynamic polarisation in a 0.1 m NaCl solution under different flow velocities produced by the flow cell: (A) static, (B) 1.3 cm3/s, (C) 5.5 cm3/s, and (D) 8.6 cm3/s (scan rate of 1 mV/s).
Similar experiments were performed using an RDE to indicate the maximum rotation speed where pitting occurs on the steel surface. The results show that, with rotation rates below 500 rpm, pitting is easily detected after potentiodynamic polarisation. However, higher rotation rates prevent pitting over the steel surface.
3.4 Effect of the flow velocity on the cathodically polarised steel
Figure 5A shows the potentiodynamic polarisation curves of steel with and without cathodic polarisation of the samples at three different cathodic potentials under static conditions.

Potentiodynamic polarisation curves of steel with and without 600 s cathodic polarisation by three different cathodic potentials: (A) static, (B) fluid flow applied by the RDE (500 rpm), and (C) 8.6 cm3/s fluid flow applied by the flow cell.
In this figure, the cathodic parts of the potentiodynamic polarisation curves after cathodic polarisation of the samples exhibit a greater current density than the potentiodynamic polarisation curve of the sample without cathodic polarisation, which can be attributed to the higher rate of the cathodic reactions on the electrode-electrolyte interface. The corrosion potential (Ecorr) of the nonpolarised sample is approximately -0.39 V, which increases to -0.09 V after polarisation at -1.3 V for 600 s. By increasing the cathodic polarisation potential to -1.5 V, the Ecorr shifts to -0.05 V, and finally, after polarisation at -1.7 V for 600 s, the Ecorr reaches 0.01 V. Unlike in Figure 3, the cathodically polarised samples show higher anodic current densities than the nonpolarised samples, increasing corrosion current densities for all cathodically polarised samples.
The potentiodynamic graphs in Figure 5A show that more oxygen gets reduced on the cathodically polarised steel. Therefore, it can be concluded that the rate of the oxygen reduction reaction increases at cathodically polarised surfaces under static conditions and raises the cathodic current density during potentiodynamic polarisation.
Furthermore, when the potential reaches to the anodic part of the potentiodynamic polarisation curves, the hydrogen-containing micropits are assumed to act as preferential sites for chloride ions and increase the anodic current density and favour pitting.
Figure 5B shows the potentiodynamic polarisation curves of the same series of the experiments measured under the RDE generating flow conditions with a rotation rate of 500 rpm. This figure reveals that the cathodic polarisation of steel under the flow regime of the RDE increases the cathodic current density produced by the reduction of oxygen during the potentiodynamic polarisation of steel. Similar to Figure 5A, here also on the cathodically polarised surface, the rate of the oxygen reduction reaction increases and results in higher cathodic current density in the measured potentiodynamic polarisation curves. Moreover, the anodic current density of steel increases, and the pitting potential, which is known to be independent of flow (Harb & Alkire, 1989), shifts towards less noble potentials after the application of greater cathodic potentials. We obtained similar results with only higher current densities when higher rotation rates (up to 5000 rpm) were applied.
Figure 5C shows the potentiodynamic polarisation curves of steel with and without 600 s cathodic polarisation by three cathodic potentials under flow conditions constructed by the flow cell with a flow velocity of 8.6 cm3/s. Unlike the static conditions and the curves obtained under the flow regime of the RDE, here after the application of cathodic polarisation, the cathodic current densities decrease. In addition, the Ecorr of the steel shifts towards less noble potentials. Under a flow of 8.6 cm3/s, the Ecorr is found to be -0.13 V, which decreases to -0.31, -0.38, and -0.46 V after cathodically polarising the steel samples with cathodic potentials of -1.3, -1.5, and -1.7 V for 600 s, respectively. When considering anodic current densities, on the contrary, similarly in all polarisation curves represented in Figure 5A–C, the cathodically polarised samples show higher anodic current densities and less noble pitting potentials.
The potentiodynamic polarisation curves of Figure 5C reveal that, under the flow regime of the flow cell, the rate of the oxygen reduction reaction decreases with the application of a larger cathodic potential during the cathodic polarisation process. This is attributed to the decrease of the mass transfer rate of the dissolved oxygen, leading to the reduction of the cathodic current density.
Figure 6 shows the variation of the Ecorr of the cathodically polarised steel versus the applied cathodic potentials under both static and flow conditions with two flow regimes. Each Ecorr value represents an average of at least three measurements. When a greater cathodic potential is applied during cathodic polarisation under flow conditions constructed by the flow cell (8.6 cm3/s), the Ecorr decreases. However, under static conditions and also under the flow regime of the RDE, the Ecorr increases with increasing the applied cathodic potential.

Variations of the Ecorr of steel versus the applied cathodic potential under static conditions and two different flow regimes produced by the flow cell and the RDE.
Figure 7 depicts the hydrogen reduction process on the steel surface during cathodic polarisation and its effect on the cathodic current density produced under static condition and two different flow conditions (RDE and flow cell) for three different cathodic potentials. The dotted arrows show the cathodic current reduction after the accumulation of hydrogen gas bubbles on the steel surface under static conditions. In the case of 320 and 500 s cathodic polarisation at a potential of -1.7 V under static conditions, a rapid increase in the cathodic current density is detected, which is attributed to the exit of hydrogen bubbles. The formed gas bubbles during cathodic polarisation decrease the active surface area and therefore reduce the cathodic current density under static conditions. According to our observations during the measurements, under static conditions, small gas bubbles appear from the beginning of the polarisation process. These small bubbles become larger and cover a larger area of the surface and decrease the current density. Further increase in the size of the bubbles on the surface exits the hydrogen bubble and once again increases the cathodic current density. However, under both flow conditions, the chronoamperograms exhibit almost constant values during 600 s polarisation.

Chronoamperograms of steel for three different cathodic potentials (-1.3, -1.5, and -1.7 V) under static conditions and two different flow regimes produced by the flow cell and the RDE.
3.5 Surface morphology of the cathodically polarised steel
Figure 8 shows the AFM images of the steel surface with and without cathodic polarisation for 600 s at three different cathodic potentials under both static and flow conditions constructed by the flow cell. The cathodic corrosion of the surface forms metal/alloy particles that are transferred into the electrolyte. After 600 s polarisation of the surface in a static mode, the surface roughness increases as the cathodic potentials become larger. This observation intensifies under flow conditions, with the maximum surface roughness reaching 44.5, 56.9, and 69.9 nm after 600 s cathodic polarisation at -1.3, -1.5, and -1.7 V, respectively.

AFM images of steel (A) without cathodic polarisation, (B) with 600 s cathodic polarisation by -1.3 V under static conditions, (C) with 600 s cathodic polarisation by -1.5 V under static conditions, (D) with 600 s cathodic polarisation by -1.7 V under static conditions, (E) with 600 s cathodic polarisation by -1.3 V under a flow velocity of 8.6 cm3/s, (F) with 600 s cathodic polarisation by -1.5 V under a flow velocity of 8.6 cm3/s, and (G) with 600 s cathodic polarisation by -1.7 V under a flow velocity of 8.6 cm3/s.
The flow conditions were produced by the flow cell.
Figure 9 shows the correlation between the roughness parameters (Ra and Rq) of the steel and the cathodic potentials applied under both static and flow conditions. Here, Ra and Rq are the arithmetic mean and root mean square, respectively, of the deviations in height from the profile mean value as follows:

Roughness parameters (Ra and Rq) of the steel surface versus the applied cathodic potential with 600 s cathodic polarisation in a 0.1 m NaCl solution.
where Yi is a function that describes the surface profile analysed in terms of height (Y) and position (i) of the sample over the evaluation length (n).
Both Ra and Rq parameters increase with the cathodic potential; however, they increase with the slope after the samples are cathodically polarised under a fluid flow that has the greater cathodic polarisation effect on the surface topography of steel under flow conditions.
It is worth noting that sharpening of the surface grooves, and therefore increasing the surface roughness of the cathodically polarised steel, increases the true surface area. Consequently, as the surface roughness increases both the cathodic and anodic current densities of the potentiodynamic polarisation curves at Figure 5 increase, the Epit values shift towards more negative potentials, and in general, the corrosion resistance of the steel decreases. Moreover, because rougher surfaces have lower electron work function than smooth surfaces (Li & Li, 2006; Ozawa, Kaykham, & Hiraishi, 1999), in rougher surfaces, it is easier for electrons to transfer from the steel surface. This causes the rougher surfaces to be electrochemically more active. Therefore, in this work, as the surface roughness of steel increases by the cathodic polarisation process, its electron work function decreases and the surface becomes more active. Thus, the contribution of electron work function of the steel surface needs to be considered as another significant factor in the electrochemical behaviour of the steel especially after the cathodic polarisation process.
Figure 10 presents the SEM images of the steel samples after 600 s cathodic polarisation under static conditions and flow conditions constructed by the RDE with a rotation rate of 500 rpm. These images clearly show the formed corrosion products on the steel surface. It is assumed that part of the formed corrosion products is transferred into the solution during cathodic polarisation. In Figure 10C, the characterisation of the observed particles was performed by EDS in two different locations of the produced corrosion products. The quantitative EDS results of this analysis for each location are shown in Table 1. The EDS results of the dark part of the corrosion products (location 1) reveal that iron, carbon, chromium, and nickel form the major part of the corrosion products at this area. Similar to location 1, the EDS analysis performed on the white part of the corrosion products (location 2) also shows the major part of the elements to be iron. In this part, after iron, oxygen and aluminium show the highest percentage of the elements, respectively; this is expected to be in the form of Al2O3. From Figure 10 and Table 1, it is needed to consider that, although aluminium is an alloying element in the stainless steel samples used in this work, part of the alumina observed on the surface of the cathodically polarised steel are alumina particles, which remained inside the pores of the steel surface after polishing the samples.
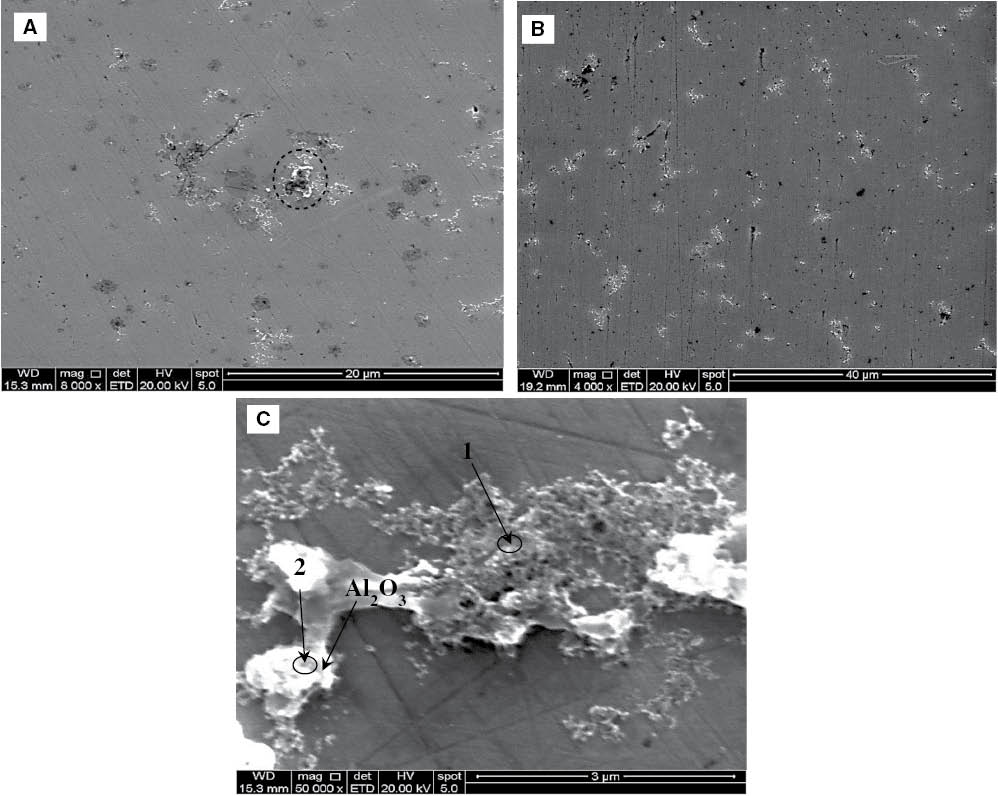
SEM images of steel samples (A) with 600 s cathodic polarisation at -1.7 V under static conditions and (B) with 600 s cathodic polarisation at -1.7 V under flow conditions constructed by the RDE (500 rpm) and (C) a focused view of image (A).
Quantitative EDS analyses of the corrosion products formed on steel with 600 s cathodic polarisation at -1.7 V under static conditions. Two different locations (1 and 2) were analysed as indicated in Figure 10C.
| Element | (a) Location 1 |
(b) Location 2 |
||||
|---|---|---|---|---|---|---|
| Weight (%) | Atomic (%) | Net intensity | Weight (%) | Atomic (%) | Net intensity | |
| CK | 14.44 | 39.22 | 231.05 | 6.59 | 16.34 | 86.95 |
| OK | 5.1 | 10.4 | 263.46 | 16.66 | 31.01 | 1022.62 |
| AlK | 0.43 | 0.52 | 47.84 | 15.08 | 16.64 | 1979.81 |
| SiK | 0.45 | 0.53 | 67.44 | 0.62 | 0.66 | 91.63 |
| MoL | 1.35 | 0.46 | 119.82 | 1.27 | 0.4 | 112.86 |
| SK | 0 | 0 | 0.03 | – | – | – |
| CaK | 0.51 | 0.42 | 73.81 | 0.29 | 0.22 | 42.86 |
| CrK | 12.4 | 7.78 | 1400.3 | 9.87 | 5.65 | 1098.27 |
| FeK | 55.61 | 32.48 | 3664.91 | 41.31 | 22.03 | 2831.3 |
| NiK | 7.05 | 3.92 | 327.58 | 5.36 | 2.72 | 263.83 |
In these analyses, other elements such as silicon and molybdenum were also detected but significantly lower in percentages.
3.6 Electrochemical impedance spectroscopy
The corrosion resistance of steel with and without cathodic polarisation under static and dynamic conditions produced by the flow cell was investigated by electrochemical impedance spectroscopy. The Nyquist plots in Figure 11A show lower imaginary impedance values after cathodic polarisation at -1.5 and -1.7 V, whereas the Nyquist plots of the nonpolarised sample and the cathodically polarised sample at a potential of -1.3 V almost overlap. Under flow conditions, however, the effect of cathodic polarisation is clearer. At a lower velocity (Figure 11B), the Nyquist plots of the cathodically polarised steel at -1.3 and -1.5 V overlap. As expected, the smallest diameter of the impedance graph is observed for the cathodically polarised steel after the application of -1.7 V cathodic potential. At a flow velocity of 8.6 cm3/s (Figure 11C) the diameter of the cathodically polarised plots decreases more significantly, where the maximum imaginary impedance of the polarised steel after applying a cathodic potential of -1.3 V is approximately 8 kΩ cm2, which decreases to approximately 3 kΩ cm2 after the steel is polarised at -1.5 and -1.7 V. Moreover, the Nyquist plots for both the static and flow modes show that the corrosion resistance of steel decreases with increasing cathodic polarisation potential. The results are more profound for high flow velocities. Similar results were observed when the RDE was used to produce the flow conditions (results not shown).

Nyquist plots of steel with and without 600 s cathodic polarisation for three different cathodic potentials (-1.3, -1.5, and -1.7 V) under (A) static, (B) low flow velocity (1.3 cm3/s), and (C) high flow velocity (8.6 cm3/s) conditions.
The flow conditions were produced by the flow cell.
According to the measured potentiodynamic polarisation curves (Figure 5), the Nyquist plots (Figure 11), and the AFM images (Figure 8), it can be concluded that, as the hydrogen entry on the surface occurs with greater intensity with the application of a greater cathodic potential, the cathodic corrosion process changes the morphology of the oxide film and increases the true surface area of the steel with higher intensity. Greater amount of the absorbed hydrogen into the oxide film decreases the stability of the passive layer and increases the corrosion current density and therefore decreases the corrosion resistance of the steel.
These results are in good agreement with the impedance data reported by some other authors (Cheng & Niu, 2007; Kliskic, Radosevic, Gudic, & Smith, 1998; Lee & Pyun, 2000; Li & Cheng, 2007), where the application of the cathodic polarisation process with greater intensity decreases the diameter of the impedance graphs.
4 Conclusion
This study investigated the effect of hydrogen evolution and its penetration into the surface of 316L stainless steel through the cathodic polarisation process on its electrochemical corrosion behaviour under static and flow conditions with two different flow regimes in the presence of chloride ions.
Completely opposite effects on the rates of oxygen reduction were found under static and flow conditions produced by the flow cell with vortex flow regime, whereas the dynamic conditions constructed by the RDE showed similar results with the static ones, but with a higher current density. Under static conditions, cathodic polarisation accelerates the mixed charge transfer-mass transfer oxygen reduction process. This increases the cathodic current density of the cathodically polarised steel, increases the pH at the metal-electrolyte interface, improves the passivity, and shifts the corrosion potential towards nobler directions. Under flow conditions, we observed that, depending on the flow regime applied on the steel surface during the potentiostatic and potentiodynamic polarisation processes, the oxygen reduction rate may decrease or increase. The flow regime produced by the RDE enhances the rate of the oxygen reduction reaction. This increases the cathodic current density and the corrosion potential. Unlike the RDE, the application of the fluid flow with a vortex flow regime constructed by the flow cell during the potentiostatic and potentiodynamic polarisations reduces the rate of oxygen reduction reaction over the steel surface, decreases the cathodic current density of the potentiodynamic polarisation curves, and shifts the corrosion potential of steel towards less noble potentials. Due to the hydrogen penetration into the surface in all investigated cases, the application of cathodic polarisation results in larger anodic current density and more negative Epit. However, we believe that further attention must be paid on the pH changes during the cathodic polarisation process and its effect on the passivation of the surface especially under static conditions.
About the authors

Farzin Arjmand obtained his PhD degree in Science in 2013 from Ghent University (Belgium) under Prof. Adriaens supervision. His PhD thesis, focused on the development and application of microelectrochemical techniques for investigation of the corrosion performance of metals and alloys. After graduation he joined the School of Mechanical Engineering of Shanghai Jiao Tong University in China and currently he holds a postdoctoral research position in the field of corrosion of iron and nickel based alloys at high-temperature water.

Annemie Adriaens graduated with a PhD in Analytical Chemistry in 1993 from the University of Antwerp (Belgium), where she was involved in the optimization of new technologies for inorganic micro and trace analysis. In 2001 she became professor in Analytical Chemistry at Ghent University (Belgium) where she leads the research group “Electrochemistry and Surface Analysis”. Research involves, amongst other projects, the use of electrochemical techniques for monitoring and treatment of corroded metallic objects. The experiments are performed using spectroelectrochemistry, allowing the simultaneous treatment/monitoring and analysis of the metal surface.
Acknowledgments
UGent (BOF) is acknowledged for funding this work. The authors would like to thank C. De Tavernier and W. Devulder for their help with the AFM images. Gratitude also goes to K. Verbeken for the SEM-EDS measurements.
References
Ahmed WH, Bello MM, Nakla ME, Al Sarkhi A. Flow and mass transfer downstream of an orifice under flow accelerated corrosion conditions. Nucl Eng Des 2012; 252: 52–67.10.1016/j.nucengdes.2012.06.033Search in Google Scholar
Barik RC, Wharton JA, Wood RJK, Tan KS, Stokes KR. Erosion and erosion-corrosion performance of cast and thermally sprayed nickel-aluminium bronze. Wear 2005; 259: 230–242.10.1016/j.wear.2005.02.033Search in Google Scholar
Baune M, Breunig-Lyriti V, Plath PJ. Galvanostatic potential oscillations in a system with electrochemically induced hydrodynamic pattern formation: two different phenomena. Int J Bifurcation Chaos 2002; 12: 2835–2845.10.1142/S0218127402006242Search in Google Scholar
Berke NS, Escalante E, Nmai CK, Whiting D. Techniques to assess the corrosion activity of steel reinforced concrete structures, Baltimore: American Society for Testing and Materials (ASTM), 1996.10.1520/STP1276-EBSearch in Google Scholar
Bockris JOM, Drazic D. The kinetics of deposition and dissolution of iron: effect of alloying impurities. Electrochim Acta 1962; 7: 293–313.10.1016/0013-4686(62)87007-8Search in Google Scholar
Caceres L, Vargas T, Herrera L. Determination of electrochemical parameters and corrosion rate for carbon steel in un-buffered sodium chloride solutions using a superposition model. Corros Sci 2007; 49: 3168–3184.10.1016/j.corsci.2007.03.003Search in Google Scholar
Cheng YF, Niu L. Mechanism for hydrogen evolution reaction on pipeline steel in near-neutral pH solution. Electrochem Commun 2007; 9: 558–562.10.1016/j.elecom.2006.10.035Search in Google Scholar
Davydov A, Rybalka KV, Belketaeva LA, Engelhardt GR, Jayaweera P, MacDonald DD. The kinetics of hydrogen evolution and oxygen reduction on Alloy 22. Corros Sci 2005; 47: 195–215.10.1016/j.corsci.2004.05.005Search in Google Scholar
Deyab MA. The influence of different variables on the electrochemical behavior of mild steel in circulating cooling water containing aggressive anionic species. J Solid State Electrochem 2009; 13: 1737–1742.10.1007/s10008-009-0848-8Search in Google Scholar
Dong CF, Xiao K, Li XG, Cheng YF. Erosion accelerated corrosion of a carbon steel-stainless steel galvanic couple in a chloride solution. Wear 2010; 270: 39–45.10.1016/j.wear.2010.09.004Search in Google Scholar
Fontana MG. Corrosion engineering, 3rd ed., Singapore: McGraw-Hill, 1987.Search in Google Scholar
García DMG, Tamarit EB, García-Antón J. Effects of the area of a duplex stainless steel exposed to corrosion on the cathodic and anodic reactions in a LiBr solution under static and dynamic conditions. Int J Electrochem Sci 2011; 6: 1237–1249.10.1016/S1452-3981(23)15070-XSearch in Google Scholar
Gehring GA, Peterson MH. Corrosion of 5456-H117 aluminum in high velocity sea water. Corrosion 1981; 37: 232–242.10.5006/1.3577276Search in Google Scholar
Guo HX, Lu BT, Luo JL. Interaction of mechanical and electrochemical factors in erosion-corrosion of carbon steel. Electrochim Acta 2005; 51: 315–323.10.1016/j.electacta.2005.04.032Search in Google Scholar
Harb JN, Alkire RC. The effect of fluid flow on growth of single corrosion pits. Corros Sci 1989; 29: 31–43.10.1016/0010-938X(89)90078-4Search in Google Scholar
Hasegava M, Osawa M. Anomalous corrosion of hydrogen-containing ferritic steels in aqueous acid solution. Corrosion 1983; 39: 115–119.10.5006/1.3580826Search in Google Scholar
Hu X, Barker R, Neville A, Gnanavelu A. Case study on erosion-corrosion degradation of pipework located on an offshore oil and gas facility. Wear 2011; 271: 1295–1301.10.1016/j.wear.2011.01.036Search in Google Scholar
Jafarzadeh K, Shahrabi T, Hadavi SMM, Hosseini MG. Role of chloride ion and dissolved oxygen in electrochemical corrosion of AA5083-H321 aluminum-magnesium alloy in NaCl solutions under flow conditions. J Mater Sci Technol 2007; 23: 623–628.Search in Google Scholar
Jafarzadeh K, Shahrabi T, Oskouei AA. Novel approach using EIS to study flow accelerated pitting corrosion of AA5083-H321 aluminum-magnesium alloy in NaCl solution. J Solid State Electrochem 2009; 39: 1725–1731.10.1007/s10800-009-9867-5Search in Google Scholar
Kain V, Roychowdhury S, Ahmedabadi P, Barua DK. Flow accelerated corrosion: experience from examination of components from nuclear power plants. Eng Fail Anal 2011; 18: 2028–2041.10.1016/j.engfailanal.2011.06.007Search in Google Scholar
Kim YP, Fregonese M, Mazille H, Feron D, Santarini G. Study of oxygen reduction on stainless steel surfaces and its contribution to acoustic emission recorded during corrosion processes. Corros Sci 2006; 48: 3945–3959.10.1016/j.corsci.2006.03.006Search in Google Scholar
Kim KH, Park SH, Hwang KM. Verification of the interrelation between local wall thinning and velocity components observed in the deflected turbulent flow inside orifice of carbon steel piping. Microsyst Technol 2010; 16: 1945–1950.10.1007/s00542-010-1119-4Search in Google Scholar
Kliskic M, Radosevic J, Gudic S, Smith M. Cathodic polarization of Al-Sn alloy in sodium chloride solution. Electrochim Acta 1998; 43: 3241–3255.10.1016/S0013-4686(98)00001-2Search in Google Scholar
LaQue FL. Marine corrosion, New York: Wiley, 1975.Search in Google Scholar
Lee WJ, Pyun SI. Role of prior cathodic polarization in the pitting corrosion of pure aluminium in acidic chloride solution. Mater Sci Eng A 2000; 279: 130–137.10.1016/S0921-5093(99)00638-3Search in Google Scholar
Leiva-García R, Muñoz-Portero MJ, García-Antón J, Sánchez-Tovar R. Effects of hydrodynamic conditions and LiBr concentration on the corrosion of copper in LiBr absorption machines. Int J Electrochem Sci 2012; 7: 1332–1347.10.1016/S1452-3981(23)13417-1Search in Google Scholar
Li MC, Cheng YF. Mechanistic investigation of hydrogen-enhanced anodic dissolution of X-70 pipe steel and its implication on near-neutral pH SCC of pipelines. Electrochim Acta 2007; 52: 8111–8117.10.1016/j.electacta.2007.07.015Search in Google Scholar
Li W, Li DY. Influence of surface morphology on corrosion and electronic behaviour. Acta Mater 2006; 54: 445–452.10.1016/j.actamat.2005.09.017Search in Google Scholar
Liu Y, Cheng YF. Cathodic reaction kinetics and its implication on flow-assisted corrosion of aluminium alloy in aqueous ethylene glycol solution. J Appl Electrochem 2009; 39: 1267–1272.10.1007/s10800-009-9794-5Search in Google Scholar
Lu BT, Luo JL, Guo HX, Mao LC. Erosion-enhanced corrosion of carbon steel at passive state. Corros Sci 2011; 53: 432–440.10.1016/j.corsci.2010.09.054Search in Google Scholar
Malka R, Nesic S, Gulino DA. Erosion-corrosion and synergistic effects in disturbed liquid-particle flow. Wear 2007; 262: 791–799.10.1016/j.wear.2006.08.029Search in Google Scholar
Miyata Y, Asakura S. Oxygen reduction reaction a trust free iron surface in neutral unbuffered chloride solutions. Corros Sci 2002; 44: 589–602.10.1016/S0010-938X(01)00078-6Search in Google Scholar
Montañés MT, Sánchez-Tovar R, García-Antón J, Pérez-Herranz V. Effects of flow variations on the galvanic corrosion of the copper/AISI 304 stainless steel pair in lithium bromide using a zero-resistance ammeter. Int J Electrochem Sci 2012; 7: 747–759.10.1016/S1452-3981(23)13373-6Search in Google Scholar
Musa AY, Kadhum AAH, Mohamad A, Daud A, Takriff M, Kamarudin SK, Muhamad N. Stability of layer forming for corrosion inhibitor on mild steel surface under hydrodynamic conditions. Int J Electrochem Sci 2009; 4: 707–716.10.1016/S1452-3981(23)15176-5Search in Google Scholar
Nanjo H, Kurata Y, Sanada N, Miyauchi K, Ohshima R, Koike K. Erosion-corrosion damage of aluminum alloy in a high-speed, high-temperature, two-phase flow. Wear 1995; 186: 573–578.10.1016/0043-1648(95)07146-6Search in Google Scholar
Nesic S, Solvi GT, Enerhaug J. Comparison of the rotating cylinder and pipe flow tests for flow-sensitive carbon dioxide corrosion. Corrosion 1995; 51:773–787.10.5006/1.3293555Search in Google Scholar
Nishimura R, Habazaki H, Kawashima A, Asami K, Hashimoto K. The effect of hydrogen on the passivity of iron-based and nickel-based amorphous alloys. Mater Sci Eng A 1991; 25: 1074–1077.10.1016/0921-5093(91)90928-GSearch in Google Scholar
Niu L, Cheng YF. Synergistic effects of fluid flow and sand particles on erosion-corrosion of aluminum in ethylene glycol-water solutions. Wear 2008; 265: 367–374.10.1016/j.wear.2007.11.007Search in Google Scholar
Ozawa R, Kaykham K, Hiraishi A. Field emission from flat metal surfaces covered with Ba atoms. Appl Surf Sci 1999; 146: 162–168.10.1016/S0169-4332(99)00032-XSearch in Google Scholar
Pickering HW, Frankenthal RP. On the mechanism of localized corrosion of iron and stainless steel: I. Electrochemical studies. J Electrochem Soc 1972; 119: 1297–1304.10.1149/1.2403983Search in Google Scholar
Pietralik JM. The role of flow in flow-accelerated corrosion under nuclear power plant conditions. E-J Adv Maint 2012; 4: 63–78.Search in Google Scholar
Qiao LJ, Chu WY, Hsiao CM. The concentration of hydrogen at crack tip of austenitic stainless steel after stress corrosion and polarization. Scr Metall 1988; 22: 627–630.10.1016/S0036-9748(88)80172-8Search in Google Scholar
Qiao LJ, Luo JL, Mao X. Hydrogen evolution and enrichment around stress corrosion crack tips of pipeline steels in dilute bicarbonate solution. Corrosion 1998; 54: 115–120.10.5006/1.3284834Search in Google Scholar
Rauf A, Mahdi E. Studying and comparing the erosion-enhanced pitting corrosion of X52 and X100 steels. Int J Electrochem Sci 2012; 7: 5692–5707.10.1016/S1452-3981(23)19652-0Search in Google Scholar
Real-Ramirez CA, Tello RM, Reyes LFH, Trejo JIG. Hydrodynamic characterization of an electrochemical cell with rotating disc electrode: a three-dimensional biphasic model. Int J Chem React Eng 2010; 8: 1–48.10.2202/1542-6580.2245Search in Google Scholar
Rodriguez P, Tichelaar FD, Koper MTM, Yanson AI. Cathodic corrosion as a facile and effective method to prepare clean metal alloy nanoparticles. J Am Chem Soc 2011; 133: 17626–17629.10.1021/ja208264eSearch in Google Scholar PubMed
Shehata AS, Nosier SA, Sedahmed GH. The role of mass transfer in the flow-induced corrosion of equipments employing decaying swirl flow. Chem Eng Proc 2002; 41: 659–666.10.1016/S0255-2701(01)00182-9Search in Google Scholar
Subramanian H, Madasamy P, Kumawat H, Thomas RG, Krishnamohan TV, Velmurugan S, Narasimhan SV. Thin layer activation for probing flow accelerated corrosion of carbon steel. Corros Sci 2012; 54: 45–51.10.1016/j.corsci.2011.08.044Search in Google Scholar
Villarreal J, Laverde D, Fuentes C. Carbon-steel corrosion in multiphase slug flow and CO2. Corros Sci 2006; 48: 2363–2379.10.1016/j.corsci.2005.09.003Search in Google Scholar
Wang Y, Bierwagen GP. A new acceleration factor for the testing of corrosion protective coating: flow-induced coating degradation. J Coating Technol Res 2009; 6: 429–436.10.1007/s11998-008-9161-1Search in Google Scholar
Wang Y, Zheng YG, Ke W, Sun WH, Hou WL, Cheng XC, Wang JQ. Slurry erosion-corrosion behaviour of high-velocity oxy-fuel (HVOF) sprayed Fe-based amorphous metallic coatings for marine pump in sand-containing NaCl solutions. Corros Sci 2011; 53: 3177–3185.10.1016/j.corsci.2011.05.062Search in Google Scholar
Wharton JA, Wood RJK. Influence of flow conditions on the corrosion of AISI 304L stainless steel. Wear 2004; 256: 525–536.10.1016/S0043-1648(03)00562-3Search in Google Scholar
Wood RJK, Hutton SP, Schiffrin DJ. Mass transfer effects of non-cavitating seawater on the corrosion of Cu and 70Cu-30Ni. Corros Sci 1990; 30: 1177–1201.10.1016/0010-938X(90)90198-ESearch in Google Scholar
Wu X, Jing H, Zheng Y, Yao Z, Ke W. Erosion-corrosion of various oil-refining materials in naphthenic acid. Wear 2004; 256: 133–144.10.1016/S0043-1648(03)00370-3Search in Google Scholar
Yang Q, Qiao LJ, Chiovelli S, Luo JL. Effects of hydrogen on pitting susceptibility of type 310 stainless steel. Corrosion 1998; 54: 628–633.10.5006/1.3287639Search in Google Scholar
Yashiro H, Pound B, Kumagai N, Tanno K. The effect of permeated hydrogen on the pitting of type 304 stainless steel. Corros Sci 1998; 40: 781–791.10.1016/S0010-938X(97)00178-9Search in Google Scholar
Yuan XX, Pandey MD, Bickel GA. A probabilistic model of wall thinning in CANDU feeders due to flow-accelerated corrosion. Nucl Eng Des 2008; 238: 16–24.10.1016/j.nucengdes.2007.06.004Search in Google Scholar
Zheng D, Che D, Liu Y. Experimental investigation on gas-liquid two-phase slug flow enhanced carbon dioxide corrosion in vertical upward pipeline. Corros Sci 2008; 50: 3005–3020.10.1016/j.corsci.2008.08.006Search in Google Scholar
Zhu H, Lin Y, Zeng D, Zhou Y, Xie J, Wu Y. Numerical analysis of flow erosion on drill pipe in gas drilling. Eng Fail Anal 2012; 22: 83–91.10.1016/j.engfailanal.2012.01.007Search in Google Scholar
©2015 by De Gruyter
Articles in the same Issue
- Frontmatter
- In this issue
- Review
- Nanoporous copper from dual-phase alloy families and its technology application in lithium ion batteries
- Original articles
- Study on the interference corrosion of cathodic protection system
- Effect of cathodic polarisation on the corrosion behaviour of 316L stainless steel under static and dynamic conditions
- Rust exfoliation on carbon steels in chloride-rich atmospheres