Serial measurements of neuron specific enolase, glial fibrillary acidic protein and neurofilament light for mortality prediction in patients with severe acute brain injury in the ICU
-
Wolmet E. Haksteen

 ,
Lynn Boonkamp
,
Lynn Boonkamp

Abstract
Objectives
Prognostication in patients with severe acute brain injury (SABI) in the Intensive Care Unit (ICU) is complex, often requiring early decisions on life-sustaining therapy. Serum biomarkers such as neurofilament light (NFL), glial fibrillary acidic protein (GFAP) and neuron specific enolase (NSE) may aid in predicting outcomes. This study investigated the association between biomarker concentrations and hospital mortality in ICU patients with SABI.
Methods
In this prospective multi-center study, 103 adult ICU patients with SABI were enrolled within 24 h of injury. Serum concentrations (NFL, GFAP, NSE) were measured at 24 h, 72 h, 7 days, and 14 days post-injury. Biomarker concentrations between hospital survivors and non-survivors were compared using a linear mixed-effects model and ROC curves.
Results
GFAP concentrations peaked on day 1, while NSE and NFL concentrations peaked on day 14. Higher concentrations were observed in non-survivors for all biomarkers on day 3, a 1,4 fold increase for NSE (p=0.034) and approximately 2-fold increase for GFAP (p=0.041) and NFL (p=0.018). Distinct temporal patterns were observed for all biomarkers, although biomarker trajectories did not significantly differ between survivors and non-survivors. Prognostic accuracy was moderate when biomarkers were combined with established mortality predictors (AUC 0.749) on day 3.
Conclusions
NSE, GFAP and NFL show distinct temporal trajectories in SABI patients. Concentrations were higher in non-survivors during the early phase of admission. While individual biomarkers showed limited prognostic accuracy, in combination with other predictors mortality prediction improved. Serum biomarkers may still be valuable in a multimodal prognostication framework for SABI patients.
Introduction
Prognostication in patients with severe acute brain injury (SABI) admitted to the Intensive Care Unit (ICU) can be challenging. In some cases, decisions regarding the continuation or withdrawal of life sustaining therapy are made at an early stage of hospitalization [1]. There are several pitfalls in this process [2]. An optimistic prediction of outcome may lead to prolonged hospitalization and potentially survival with severe disability, possibly against the patient’s wishes. A pessimistic prediction may lead to withdrawal of life-sustaining therapy, possibly denying the patient a chance for good recovery [3], 4]. A fast and reliable tool to predict long-term neurological outcome after sustaining SABI is needed. Such a tool likely consists of a combination of several diagnostic tests, leading to a multimodal approach, similar to the guidelines used for prognostication in patients who remain in coma after cardiac arrest [5]. Unfortunately, such guidelines have not yet been fully developed for ICU patients with SABI due to other causes, e.g. traumatic brain injury (TBI), subarachnoid hemorrhage (SAH) or stroke. Prognostication in patients after cardiac arrest primarily focuses on reliable prediction of a poor outcome. For other types of SABI in the ICU, it should be considered to shift the focus on identifying patients with a chance of a good outcome as this could help prevent erroneous withdrawal of life-sustaining therapy.
Biomarkers released into the blood upon cellular injury of the brain could be a valuable addition to a multimodal diagnostic approach as they have shown promising results in assessing brain injury [6]. Several serum biomarkers have been investigated. The BIO-AX-TBI study reported neurofilament light (NFL) concentrations approximately 10 times higher in patients with moderate-severe TBI compared to trauma patients without TBI in the first few days. Furthermore, NFL concentrations were associated with functional outcome at 12 months [7]. Richter et al. studied the incremental value of biomarkers determined at admission in TBI patients when added to the established prognostic models IMPACT (International Mission for Prognosis and Analysis of Clinical Trials in TBI) and CRASH (Corticosteroid Randomization after Significant Head Injury) [8]. They found that several biomarkers added predictive value to the models: glial fibrillary acidic protein (GFAP), NFL, S100β and ubiquitin c-terminal hydrolase L1 (UCH-L1). The timing of biomarker assessment plays a critical role in their utility, as each biomarker follows a distinct temporal trajectory. Neuron specific enolase (NSE) typically peaks between 48 and 72 h and is currently recommended by international guidelines to identify patients with a poor outcome after cardiac arrest [9]. In TBI, the highest serum concentrations of GFAP can be detected during the first days, whereas NFL concentrations typically demonstrate a slow increase over time, peaking at 1–2 weeks after TBI [10], 11].
Current biomarker research focuses mostly on specific causes of brain injury, such as TBI, cardiac arrest, or sepsis-associated encephalopathy, but these studies often also include patients with mild or moderate brain injury. Patients with SABI admitted to the ICU represent a distinct subgroup where more accurate prognostic tools could be especially valuable to guide clinical decision-making. Although the underlying etiologies may vary, the severity of brain injury unites these patients. Biomarkers could potentially improve prognostic models in this critically ill population [12], [13], [14].
In this study we aimed to investigate the association between serum biomarker concentrations over time and hospital mortality in patients admitted to the ICU with SABI of various etiologies.
Materials and methods
Design
This was a multi-center, prospective cohort study conducted at the Amsterdam University Medical Centers, Radboud University Medical Center and Haaglanden Medical Center between January 3, 2023 and March 10th, 2025. The study was approved by the Medical Ethical Committee of the Amsterdam University Medical Centers on December 5, 2022 (reference number 2022.0661 – NL82013.018.22) and the Biobank Committee. Deferred consent was obtained from the legal representatives within 72 h after inclusion and where possible from the patients themselves after regaining consciousness.
Study population
All adult patients (≥18 years old) admitted to the ICU with SABI defined as: subarachnoid or intracerebral hemorrhage, intracranial infection, TBI, or acute ischemic stroke were included. Patients had to be included within 24 h after sustaining brain injury and the Glasgow Coma Scale (GCS) score should not have exceeded 8 prior to inclusion. Patients diagnosed with a neurodegenerative disease (i.e. amyotrophic lateral sclerosis) or a life-expectancy ≤6 months due to another disease, were excluded. Patients moribund at ICU admission were excluded as well.
Patient characteristics
The electronic patient records were used to collect data. Documented demographic and baseline characteristics include: age, sex, admission diagnosis, GCS at admission and ICU discharge, pupillary reactivity at admission, highest Sequential Organ Failure Assessment (SOFA) score, length of hospital and ICU stay, modified Ranking Scale (mRS) at hospital discharge, mortality at hospital discharge and discharge destination [15], 16]. The mRS was dichotomized into ‘Favorable’ (mRS score ≤2) and ‘Unfavorable’ (mRS score ≥3). Furthermore, legal representatives were asked about the baseline health and functioning of the patient prior to hospital admission to determine the Clinical Frailty Scale (CFS) score. In line with previous studies the CFS score was dichotomized into ‘Frail’ (CFS score ≥5) and ‘Nonfrail’ (CFS score ≤4) [17].
Biomarker sampling and processing
Blood samples were collected using gel-separator tubes (STG-5) for serum at 24 h, 72 h, 7 days and 14 days after sustained brain injury. After centrifugation during 10 min at 1,800×g at room temperature within 2 h from sampling, the serum was aliquoted (4 × 0.5 mL) and stored at the local biobank facilities at −80 °C. Single Molecule Array (SIMOA HD-X, Quanterix, Billerica, USA) was used to determine biomarker concentrations of GFAP and NFL using the Neurology 4-Plex-E kit (Quanterix) and in a second batch using a Neurology 2-Plex B Advantage PLUS kit. Bridging samples (n=15) were used to ensure consistent results between these batches. Shortly before measurements, samples were thawed at room temperature and centrifuged at 10,000×g for 10 min. Subsequently, they were diluted by a factor of 20 to ensure reliable results and when required, additional dilution up to a 200-fold was performed. The dilution process was executed to anticipate on concentrations higher than the upper limit of quantification. NSE concentrations were assessed with electrohemiluminescence immunoassay (ECLIA, Cobas® pro). The hemolysis index is set at 23 in our laboratory, indicating samples with a free hemoglobin concentration >23 mg/dL were excluded from analysis.
Statistical analysis
Continuous data with nonparametric distribution are presented as medians and interquartile ranges (IQR) and continuous data with parametric distribution as means and standard deviations. Categorical variables are presented using frequencies and percentages. To compare between groups the Mann-Whitney U test was used. Biomarker concentrations at each timepoint between hospital survivors and non-survivors were displayed with boxplots. Trajectories of serum biomarker concentrations were visualized over time using second-degree polynomial regression and assessed using a mixed-effects model with hospital mortality and a second degree-polynomial term for time as fixed effects and random participant effects. Mixed-effects models were also used to assess temporal differences across the three main admission diagnoses (TBI, SAH and ICH) and to compare trajectories between survivors and non-survivors within the TBI and SAH subgroups. Additionally, logistic regression models at day 1 and 3 were applied to calculate receiver operating characteristics (ROC) curves with corresponding area under the curve (AUC) values for each biomarker, all biomarkers combined and the biomarkers combined with known predictors of mortality (age, pupillary reactivity at admission, GCS score at admission) to evaluate prognostic utility [18], 19]. All statistical analysis were performed using R (version 4.2.3). Statistical significance was determined at p<0.05.
Results
A total of 103 patients with SABI were included between January 3, 2023 and March 10, 2025 (Supplementary Figure S1). Patient characteristics are presented in Table 1. TBI was diagnosed in 48 patients (46.6 %) and SAH in 29 patients (28.2 %). Patients had a severely impaired consciousness at hospital admission, the median GCS score was 5 (IQR 3–7). In 37 patients (35.9 %) pupillary reactivity was absent in either one or both pupils.
Patient demographic and outcome characteristics.
| n (103) | |
|---|---|
| Age, years | 60 (46–69) |
| Sex, female | 15 (38.5 %) |
| Glasgow Coma Scale at admission | 5 (3–7) |
| Reactive pupils at admissions | |
| Both | 61 (59.2 %) |
| One | 17 (16.5 %) |
| None | 20 (19.4 %) |
| Unknown | 5 (4.9 %) |
| Admission diagnosis | |
| Traumatic brain injury | 48 (46.6 %) |
| Subarachnoid hemorrhage | 29 (28.2 %) |
| Intracranial hemorrhage | 16 (15.5 %) |
| Ischemic stroke | 6 (5.8 %) |
| Meningo-encephalitis | 4 (3.9 %) |
| Clinical frailty scale score | |
| Frail | 4 (3.9 %) |
| Nonfrail | 96 (93.1 %) |
| Unknown | 3 (2.9 %) |
| Highest SOFA score | 10 (8–11) |
| ICU length of stay, days | 10 (10) |
| Hospital length of stay, days | 25 (2) |
| Mortality during hospital admission | 51 (49.5 %) |
| Modified ranking scale at hospital discharge | |
| Favorable | 6 (5.8 %) |
| Unfavorable | 93 (90.2 %) |
| Unknown | 4 (3.9 %) |
-
Values are presented as count (percentages) or median (interquartile range). ‘Frail’ is defined as a CFS, score ≥5, ‘Nonfrail’ is defined as a CFS, score ≤4. ‘Favorable’is defined as a mRS, score ≤2, ‘Unfavorable’ is defined as a CFS, score ≥3. ICU, intensive care unit; SOFA, sequential organ failure assessment.
At hospital discharge 52 patients (50.5 %) were alive, of which 8 were discharged to their homes, 43 to rehabilitation facilities and one to a nursing home. Of the 51 deceased patients, 34 patients died following withdrawal of life-sustaining therapy.
Blood sample availability and serum biomarker concentrations are depicted in Table 2. Collection of samples at all four timepoints for each patient was impossible as patients died, were transferred to other hospitals or discharged before the moment of sampling (n=106 timepoints). Additionally, some timepoints were missing due to logistical issues or inability to draw blood (n=33). Other samples were excluded because they were hemolytic (n=9) which hindered the measurement of NSE, or exceeded the upper limit of detection for GFAP and NFL (n=2). The number of available samples for survivors and non-survivors at each time point are presented in Table 2.
Serum biomarker concentrations.
| Sample availability | |||||
|---|---|---|---|---|---|
| n, all (s/ns) | All | Survivors (s) (n=52) | Non-survivors (ns) (n=51) | p-Value | |
| Serum NSE, ng/mL | |||||
|
|
|||||
| Day 1 | 100 (51/49) | 17 (13–28) | 17 (13–33) | 17 (4–27) | 0.804 |
| Day 3 | 85 (46/39) | 13 (9–18) | 12 (9–15) | 16 (9–32) | 0.023 |
| Day 7 | 49 (34/15) | 15 (12–19) | 15 (13–20) | 13 (10–17) | 0.313 |
| Day 14 | 30 (26/4) | 18 (12–26) | 19 (13–26) | 11 (9–17) | 0.200 |
|
|
|||||
| Serum GFAP, pg/mL | |||||
|
|
|||||
| Day 1 | 102 (52/50) | 29,516 (9,974–53,533) | 27,319 (10,013–41,943) | 30,651 (9,971–110,979) | 0.407 |
| Day 3 | 87 (47/40) | 15,994 (5,916–42,668) | 15,142 (4,685–25,281) | 32,888 (7,013–63,287) | 0.041 |
| Day 7 | 51 (35/16) | 1,250 (514–2,845) | 1,250 (513–1,861) | 1,709 (552–4,170) | 0.503 |
| Day 14 | 31 (26/5) | 722 (296–1,167) | 726 (608–1,204) | 287 (287–892) | 0.283 |
|
|
|||||
| Serum NFL, pg/mL | |||||
|
|
|||||
| Day 1 | 102 (52/50) | 79 (39–145) | 72 (36–141) | 101 (41–182) | 0.379 |
| Day 3 | 87 (47/40) | 145 (82–249) | 123 (73–178) | 202 (98–381) | 0.018 |
| Day 7 | 51 (35/16) | 558 (298–861) | 702 (338–1,037) | 490 (291–607) | 0.239 |
| Day 14 | 31 (26/5) | 1,384 (654–1,974) | 1,534 (726–2,182) | 883 (508–890) | 0.076 |
-
Values are presented as count or median (interquartile range). The ‘n’ in the second column represents the number of samples available at each time point. Statistically significant p-values are displayed in bold. GFAP, glial fibrillary acidic protein; NFL, neurofilament light; NSE, neuron specific enolase.
The highest median serum concentration of GFAP was found on day 1, 29,516 pg/mL (IQR 9,974–53,533 pg/mL). Serum NSE and NFL peaked on day 14, respectively 18 ng/mL (IQR 12–26 ng/mL) and 1,384 pg/mL (IQR 654–1,974 pg/mL). Serum concentrations of each biomarker at each timepoint between hospital survivors and non-survivors are visualized in boxplots (Figure 1). A statistically significant difference between survivors and non-survivors was found for all biomarkers on day 3, NSE (p=0.023), GFAP (p=0.041) and NFL (p=0.018).
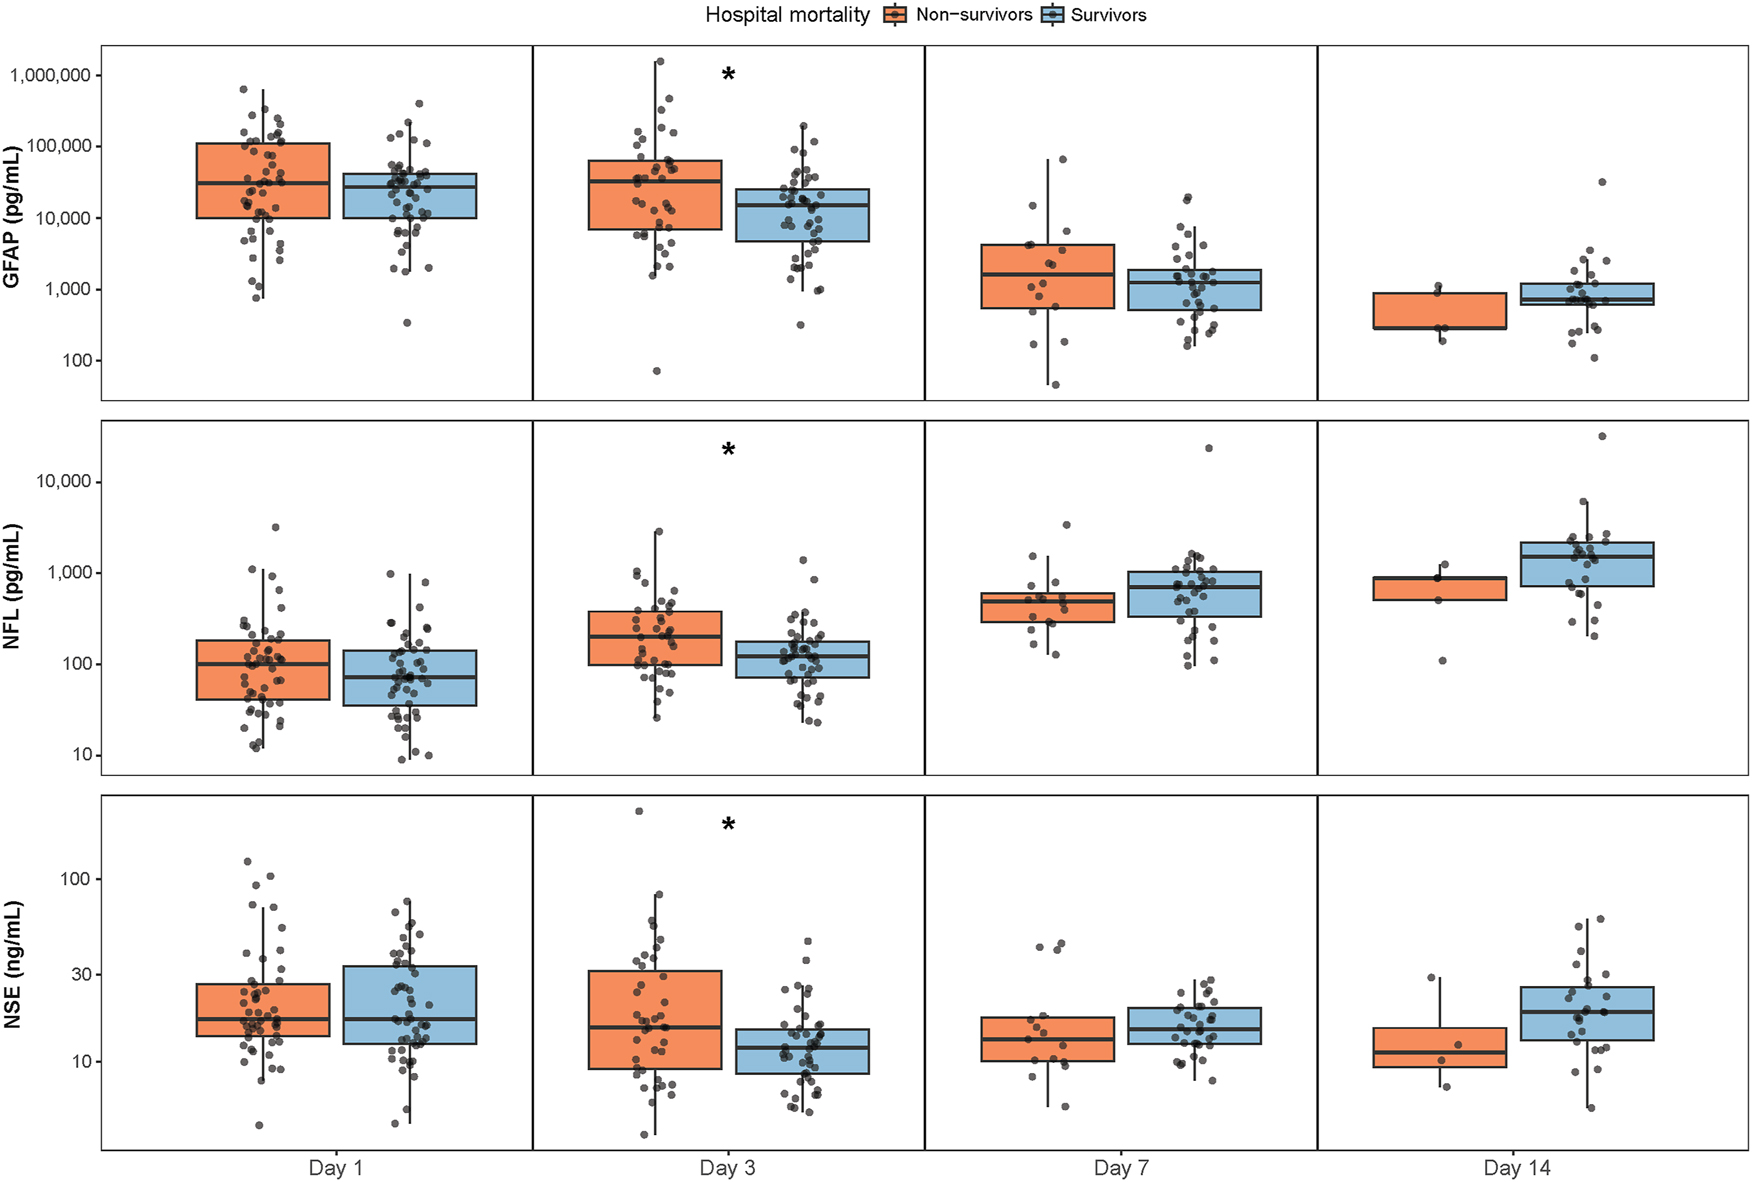
Serum concentrations of NSE, GFAP and NFL at each timepoint between survivors and non-survivors at hospital discharge. The y-axis are log-transformed (log10). Boxplots show the median and interquartile range. *Signifies a statistically significant difference between groups. GFAP=glial fibrillary acidic protein, NFL=neurofilament light, NSE=neuron specific enolase.
The serum biomarker trajectories over time stratified by survival are displayed in a lineplot (Figure 2), lines represent a second-degree polynomial regression with 95 % confidence intervals. Table 3 summarizes the findings of the mixed effects model assessing the association between biomarker concentrations over time and hospital mortality. Across all three biomarkers, time was a significant predictor of concentration, with each biomarker exhibiting distinct temporal patterns, NSE (β2=2.142, p≤0.0001), GFAP (β2=6.500, p≤0.0001) and NFL (β2=4.003, p≤0.0001), However, none of the biomarkers showed a statistically significant interaction between time and hospital mortality, indicating that the temporal trajectory of biomarker concentrations did not differ between survivors and non-survivors. Additionally, biomarker concentrations over time between the three most common admission diagnosis were analyzed (Supplementary Table S2 and Figure S3). The trajectory of NSE levels was significantly different for patients with SAH (β2=−2.744, p=0.0035) and intracranial hemorrhage (β2=1.700, p=0.012) compared to the reference group of patients with TBI. For GFAP levels only the trajectory of patients with intracranial hemorrhage differed from patients with TBI (β2=−8.448, p=0.006). Lastly, the serum biomarker trajectories over time stratified by survival were analyzed for the two main admission diagnoses, TBI and SAH. In TBI patients, temporal trajectories between survivors and non-survivors were not significantly different (Supplementary Table S4 and Figure S5). In SAH patients, a significant interaction between time and hospital mortality was observed for NFL (β2=−1.738, p=0.038), indicating temporal trajectories of this biomarker differ between survivors and non-survivors (Supplementary Table S6 and Figure S7). However, this finding should be interpreted with caution due to the small sample size in this subgroup (n=29).

Serum biomarkers concentrations over time stratified by hospital survival. Lines represent a second-degree polynomial regression with 95 % confidence intervals. The y-axis are log-transformed. GFAP=glial fibrillary acidic protein, NFL=neurofilament light, NSE=neuron specific enolase.
Results of mixed-effects models that analyze the association between time and hospital mortality on biomarker concentrations.
| NSE | GFAP | NFL | |
|---|---|---|---|
| Intercept | |||
| β | 2.756 | 8.828 | 5.198 |
| p-value | <0.0001 | <0.0001 | <0.0001 |
| Time | |||
| β | −0.198 | −19.898 | 16.894 |
| β2 | 2.142 | 6.500 | −4.003 |
| p-value | 0.0002 | <0.0001 | <0.0001 |
| Hospital mortality | |||
| β | 0.205 | 0.588 | 0.198 |
| p-value | 0.085 | 0.051 | 0.142 |
| Time x hospital mortality | |||
| β | 0.563 | 2.752 | −4.462 |
| β2 | −0.754 | −2.427 | −1.083 |
| p-value | 0.603 | 0.224 | 0.063 |
-
Independent variables containing a time element have two estimates: first linear (β) and quadratic (β2). x represents the interaction between the variables. p values are derived using ANOVA. In variables with both a linear and quadratic estimate the p-value of the quadratic estimate is shown. GFAP, glial fibrillary acidic protein; NFL, neurofilament light; NSE, neuron specific enolase.
The prognostic utility of individual biomarkers, all biomarkers combined and all biomarkers combined with factors known to be associated with hospital mortality (age, pupillary reactivity and GCS at admission) were used to predict hospital mortality on day 1 and 3 using ROC curves (Figure 3). On day 1, the AUC of the individual biomarkers ranged from 0.463 to 0.526, indicating poor performance [20]. The model including all biomarkers and other known predictors of mortality performed better (AUC 0.674). On day 3, prognostic accuracy increased for all individual biomarkers (AUC 0.619 to 0.652) and when all biomarkers and the other predictors were combined the highest predictive value (AUC 0.749) was reached indicating moderate performance.

The prognostic utility (area under the receiver operating characteristics curve) of serum NSE, GFAP and NFL, all biomarkers combined and all biomarkers combined with other known predictors of hospital mortality (age, pupillary reactivity at admission and GCS total score at admission) in distinguishing survivors and non-survivors of severe acute brain injury at day 1 and 3. AUC=area under the curve, GCS score=Glasgow Coma Scale Score, GFAP=glial fibrillary acidic protein, NFL=neurofilament light, NSE=neuron specific enolase.
Discussion
In this prospective multicenter cohort study of critically ill patients with SABI, the highest serum biomarker concentrations were found on day 1 for GFAP, and on day 14 for NSE and NFL. A substantial decrease over time was found for serum GFAP concentrations and a substantial increase over time for serum NFL. The results further showed that all biomarker levels are significantly elevated in hospital non-survivors compared to survivors at day three, but the longitudinal slopes did not differ between groups. The prognostic utility of the individual biomarkers per timepoint (day 1 and 3) was poor, but when the biomarkers were combined with other known predictors of mortality a moderate performance was found on day 3.
Although our study population represents a rather heterogenous group of patients with SABI, the general trend of higher serum biomarker concentrations in patients with poor outcome aligns with findings from studies in patients with stroke, intracerebral hemorrhage, SAH or TBI [21], [22], [23], [24]. In patients with stroke, early assessment of both NFL and GFAP in the first 3 days after admission appear to be valuable biomarkers for prediction of poor outcome, especially when combined with the National Institutes of Health Stroke Scale (NIHSS) [25], 26]. A recent study in SAH and intracerebral hemorrhage patients by Gyldenholm et al. found elevated serum GFAP concentrations at admission were predictive for 30-day mortality and poor outcome defined as a mRS score ≥4 [27]. In the current study, we included patients with severely diminished consciousness and no recovery of consciousness within the first 24 h of admission. Due to the severity of brain injury at inclusion we found relatively high serum concentrations of all biomarkers in our study population. This affects our study results and hampers comparison of our results to many other studies on mild and moderate brain injury patients, but increases the relevance for clinical practice in the ICU [6], 28].
In patients with anoxic brain injury after cardiac arrest, high serum NSE concentrations are considered a robust predictor of poor outcome [29], 30]. Interestingly, we found serum NSE concentrations to be highest on day 14 in the overall population and day 1 in the non-survivors, whereas in patients with anoxic brain injury after cardiac arrest this biomarker typically peaks between 48 and 72 h [5]. This difference in timing likely reflects the different pathophysiological mechanisms involved in our study population, which included patients with SABI from various causes. Unlike post-anoxic brain injury, where the entire brain in affected, conditions such as cerebral hemorrhage involve more localized brain damage. This may influence the extent and the timing of NSE release into the blood [10]. Similarly, studies have shown that serum NFL concentrations measured 24 h post-cardiac arrest are strongly associated with poor outcome, while in other study populations of patients with SABI, NFL tends to perform better as a prognostication tool at later timepoints e.g. after 7 days [11], [31], [32], [33]. Thus, the dynamic patterns of both NSE and NFL release differ depending on the underlying cause of brain injury, emphasizing the need to consider disease-specific factors when interpreting biomarker trends. This is also demonstrated by the subgroup analysis conducted in the current study with SAH patients, where different temporal trajectories between survivors and non-survivors could be observed for NFL concentrations. However, it should be noted that this finding is based on an extremely small sample size and should be validated in a larger cohort.
Another interesting development in the field of blood-based biomarkers is the use of inflammatory biomarkers for outcome prediction. Although the biomarkers used in the current study are markers of structural brain injury, cell damage is typically followed by an inflammatory response with infiltration of immune cells and release of cytokines into the affected area. In recent literature, the potential of interleukin 6 (IL-6), IL-8, IL-15 and tumor necrosis factor α has been highlighted for monitoring disease progression and neuroprognostication in patients with severe TBI [34], [35], [36], [37], [38]. Yue et al. demonstrated that IL-15 concentrations could discriminate between patients with a favorable (Glasgow Outcome Scale Extended (GOSE) score ≥5) and an unfavorable outcome (GOSE ≤4) at 3 months follow-up with an AUC of 0.74 [38]. Moreover, Samanta et al. was able to identify two clusters of inflammatory phenotypes [39]. Patients assigned to the early-inflammation phenotype could be identified with IL-6, IL-15 and monocyte chemoattractant protein 1 and were more likely to have an unfavorable GOSE score at 6 months. These findings suggest future research should aim to develop and validate a biomarker panel of both structural and inflammatory markers for neuroprognostication.
In our cohort, higher concentrations of NSE and NFL were found for survivors compared to non-survivors on day 7 and 14, with a similar trend observed for GFAP on day 14. Although these differences were not statistically significant, it is an interesting finding. A possible explanation could be that the patients who ultimately did not survive, but were still alive at these timepoints, may have died due to complications following brain injury, rather than the severity of brain injury itself. In the overall cohort of non-survivors, one third died due to clinical deterioration which often encompassed a severe infection (e.g. pneumonia or meningitis). Among the non-survivors who were still alive at day 7, half eventually died from clinical deterioration and this proportion increased to 60 % for the non-survivors who were still alive at day 14. Additionally, a larger proportion of non-survivors at day 7 and 14 were scored as ‘Frail’ at admission compared to the overall cohort of non-survivors. These findings may partly explain the observed biomarker patterns.
While serum biomarkers may offer valuable insights into the pathophysiology of SABI and could potentially improve neuroprognostication, their utility as standalone predictors remains limited. A multimodal approach including modalities such as magnetic resonance imaging (MRI) and electroencephalography (EEG) with reactivity testing should be considered. Amiri et al. [40] used MRI and EEG in a combined prediction model to predict consciousness levels at study enrolment and ICU discharge, they found maximum AUCs of 0.78 (95 % CI 0.71–0.86) and 0.83 (95 % CI 0.75–0.89) respectively. Egbebike et al. [41] studied cognitive-motor dissociation (CMD), detected by EEG in clinically unresponsive patients with acute brain injury. The presence of CMD was an independent predictor of a shorter time to good recovery and that patients with CMD discharged home or to a rehabilitation setting consistently had better neurological outcome scores measures with the GOSE score compared to patient without CMD. Given these results, we would suggest the development of a comprehensive neuroprognostication model combining clinical parameters, serum biomarkers (both structural and inflammatory), MRI, EEG and disease specific scores (e.g. the IMPACT and CRASH for TBI patients and the SAFIRE for SAH patients), which may improve outcome prediction in SABI patients in the ICU [42], 43]. Identification of patients with a chance of recovery should be the main focus of such a prognostication model, as this could prevent unjust WLST [4].
Strengths and limitations
A strength of our study is the multicenter design including patients in two academic hospitals and a large non-academic hospital, thereby improving the external validity and generalizability of the results. The longitudinal design of blood sampling over a period of two weeks represents another strength of this study, enabling the analysis of temporal dynamics of the biomarkers and potentially guiding the determination of an optimal sampling timepoint in future studies. Although incorporating an additional early sampling timepoint could have improved our ability to capture biomarker dynamics in even greater detail, this was not feasible due to restrictions imposed by the medical Ethical Committee. Our study population included patients with SABI of various etiologies reflecting the real-world heterogeneity of SABI patients in the ICU. Nonetheless, in a larger cohort more extensive subgroup analyses should be considered to account for potential differences between these patients. Another potential limitation of this study is the risk of confounding as some biomarker concentrations could not be determined due to hemolysis and values exceeding the upper limit of detection.
Conclusions
In this prospective cohort of ICU patients with SABI serum concentrations of NSE, GFAP and NFL showed distinct temporal patterns, but the biomarker concentrations over time did not differ between survivors and non-survivors. Biomarker concentrations were higher in non-survivors during the early phase of admission, with the strongest discriminative performance observed on day 3. While individual biomarkers showed limited prognostic accuracy, in combination with known predictors of mortality prognostic accuracy improved to moderate performance. Future research should focus on implementing serum biomarkers in multimodal prognostication approaches to further improve care for neurocritical care patients.
Acknowledgments
We would like thank all (research) nurses, physicians, medical students and other professionals whose contributions ensured the successful completion of this study.
-
Research ethics: The study was approved by the Medical Ethical Committee of the Amsterdam University Medical Centers on December 5, 2022 (reference number 2022.0661 – NL82013.018.22) and Biobank Committee. The study was conducted in accordance with the Declaration of Helsinki.
-
Informed consent: Deferred consent was obtained from the legal representatives within 72 h after inclusion and where possible from the patients themselves after regaining consciousness.
-
Author contributions: All authors have accepted responsibility for the entire content of this manuscript and approved its submission. Conceptualization: WEH, CET, JH. Investigation: WEH, SA, PV, CH, LB, LV. Data curation: LB, WEH. Formal analysis: WEH, DCV. Writing – original draft: WEH, CET, JH. Visualization: WEH. Writing – review & editing: WEH, LB, LV, DCV, SA, PV, CH, CET, JH. Supervision: CET, JH.
-
Use of Large Language Models, AI and Machine Learning Tools: None declared.
-
Conflict of interest: The authors state no conflict of interest.
-
Research funding: This study was funded by the Stichting Remmert Adriaan Laan Fonds. The funding was used for the biomarker analysis of the first 40 patients.
-
Data availability: The datasets used during the current study are not publicly available due to data sharing regulations and applicable privacy laws, but may be obtained from the corresponding author upon reasonable request.
References
1. van Veen, E, van der Jagt, M, Citerio, G, Stocchetti, N, Gommers, D, Burdorf, A, et al.. Occurrence and timing of withdrawal of life-sustaining measures in traumatic brain injury patients: a CENTER-TBI study. Intensive Care Med 2021;47:1115–29. https://doi.org/10.1007/s00134-021-06484-1.Search in Google Scholar PubMed PubMed Central
2. Turgeon, AF, Dorrance, K, Archambault, P, Lauzier, F, Lamontagne, F, Zarychanski, R, et al.. Factors influencing decisions by critical care physicians to withdraw life-sustaining treatments in critically ill adult patients with severe traumatic brain injury. CMAJ (Can Med Assoc J) 2019;191:E652–3. https://doi.org/10.1503/cmaj.190154.Search in Google Scholar PubMed PubMed Central
3. Fischer, D, Edlow, BL, Giacino, JT, Greer, DM. Neuroprognostication: a conceptual framework. Nat Rev Neurol 2022;419:419–27. https://doi.org/10.1038/s41582-022-00644-7.Search in Google Scholar PubMed PubMed Central
4. Sanders, WR, Barber, JK, Temkin, NR, Foreman, B, Giacino, JT, Williamson, T, et al.. Recovery potential in patients who died after withdrawal of life-sustaining treatment: a TRACK-TBI propensity score analysis. J Neurotrauma 2024;41:2336–48. https://doi.org/10.1089/neu.2024.0014.Search in Google Scholar PubMed PubMed Central
5. Nolan, JP, Sandroni, C, Bottiger, BW, Cariou, A, Cronberg, T, Friberg, H, et al.. European resuscitation council and European society of intensive care medicine guidelines 2021: post-resuscitation care. Resuscitation 2021;161:220–69. https://doi.org/10.1016/j.resuscitation.2021.02.012.Search in Google Scholar PubMed
6. Castano-Leon, AM, Sanchez Carabias, C, Hilario, A, Ramos, A, Navarro-Main, B, Paredes, I, et al.. Serum assessment of traumatic axonal injury: the correlation of GFAP, t-Tau, UCH-L1, and NfL levels with diffusion tensor imaging metrics and its prognosis utility. J Neurosurg 2023;138:454–64. https://doi.org/10.3171/2022.5.jns22638.Search in Google Scholar
7. Graham, NSN, Zimmerman, KA, Moro, F, Heslegrave, A, Maillard, SA, Bernini, A, et al.. Axonal marker neurofilament light predicts long-term outcomes and progressive neurodegeneration after traumatic brain injury. Sci Transl Med 2021;13:eabg9922. https://doi.org/10.1126/scitranslmed.abg9922.Search in Google Scholar PubMed
8. Richter, S, Czeiter, E, Amrein, K, Mikolic, A, Verheyden, J, Wang, K, et al.. Prognostic value of serum biomarkers in patients with moderate-severe traumatic brain injury, differentiated by marshall computer tomography classification. J Neurotrauma 2023;40:2297–310. https://doi.org/10.1089/neu.2023.0029.Search in Google Scholar PubMed
9. Moseby-Knappe, M, Cronberg, T. Blood biomarkers of brain injury after cardiac arrest – a dynamic field. Resuscitation 2020;156:273–6. https://doi.org/10.1016/j.resuscitation.2020.09.004.Search in Google Scholar PubMed
10. Kawata, K, Liu, CY, Merkel, SF, Ramirez, SH, Tierney, RT, Langford, D. Blood biomarkers for brain injury: what are we measuring? Neurosci Biobehav Rev 2016;68:460–73. https://doi.org/10.1016/j.neubiorev.2016.05.009.Search in Google Scholar PubMed PubMed Central
11. Tuure, J, Mohammadian, M, Tenovuo, O, Blennow, K, Hossain, I, Hutchinson, P, et al.. Late blood levels of neurofilament light correlate with outcome in patients with traumatic brain injury. J Neurotrauma 2024;41:359–68. https://doi.org/10.1089/neu.2023.0207.Search in Google Scholar PubMed PubMed Central
12. Anderson, TN, Hwang, J, Munar, M, Papa, L, Hinson, HE, Vaughan, A, et al.. Blood-based biomarkers for prediction of intracranial hemorrhage and outcome in patients with moderate or severe traumatic brain injury. J Trauma Acute Care Surg 2020;89:80–6. https://doi.org/10.1097/ta.0000000000002706.Search in Google Scholar PubMed PubMed Central
13. Helmrich, I, Czeiter, E, Amrein, K, Buki, A, Lingsma, HF, Menon, DK, et al.. Incremental prognostic value of acute serum biomarkers for functional outcome after traumatic brain injury (CENTER-TBI): an observational cohort study. Lancet Neurol 2022;21:792–802. https://doi.org/10.1016/s1474-4422(22)00218-6.Search in Google Scholar PubMed
14. Bircak-Kuchtova, B, Chung, HY, Wickel, J, Ehler, J, Geis, C. Neurofilament light chains to assess sepsis-associated encephalopathy: are we on the track toward clinical implementation? Crit Care 2023;27:214. https://doi.org/10.1186/s13054-023-04497-4.Search in Google Scholar PubMed PubMed Central
15. Vincent, JL, Moreno, R, Takala, J, Willatts, S, De Mendonca, A, Bruining, H, et al.. The SOFA (Sepsis-related organ failure assessment) score to describe organ dysfunction/failure. on behalf of the working group on sepsis-related problems of the European society of intensive care medicine. Intensive Care Med 1996;22:707–10. https://doi.org/10.1007/bf01709751.Search in Google Scholar
16. Banks, JL, Marotta, CA. Outcomes validity and reliability of the modified rankin scale: implications for stroke clinical trials: a literature review and synthesis. Stroke 2007;38:1091–6. https://doi.org/10.1161/01.str.0000258355.23810.c6.Search in Google Scholar
17. Falk, EH, Guethnadottir, G, Alfredsson, J, Cederholm, T, Ekerstad, N, Religa, D, et al.. The association between the clinical frailty scale and adverse health outcomes in older adults in acute clinical settings – a systematic review of the literature. Clin Interv Aging 2023;18:249–61. https://doi.org/10.2147/CIA.S388160.Search in Google Scholar PubMed PubMed Central
18. Steyerberg, EW, Mushkudiani, N, Perel, P, Butcher, I, Lu, J, McHugh, GS, et al.. Predicting outcome after traumatic brain injury: development and international validation of prognostic scores based on admission characteristics. PLoS Med 2008;5:e165; discussion e. https://doi.org/10.1371/journal.pmed.0050165.Search in Google Scholar PubMed PubMed Central
19. Perel, P, Arango, M, Clayton, T, Edwards, P, Komolafe, E, Pocock, S, et al.. Predicting outcome after traumatic brain injury: practical prognostic models based on large cohort of international patients. BMJ Br Med J (Clin Res Ed) 2008;336:425–9. https://doi.org/10.1136/bmj.39461.643438.25.Search in Google Scholar PubMed PubMed Central
20. de Hond, AAH, Steyerberg, EW, van Calster, B. Interpreting area under the receiver operating characteristic curve. Lancet Digit Health 2022;4:e853–5. https://doi.org/10.1016/s2589-7500(22)00188-1.Search in Google Scholar
21. Robertson, CS, Martinez, FS, McQuillan, LE, Williamson, J, Lamb, DG, Wang, KKW, et al.. Serial measurements of serum glial fibrillary acidic protein in moderate-severe traumatic brain injury: potential utility in providing insights into secondary insults and long-term outcome. J Neurotrauma 2023;41:73–90. https://doi.org/10.1089/neu.2023.0111.Search in Google Scholar PubMed
22. Chen, CH, Chu, HJ, Hwang, YT, Lin, YH, Lee, CW, Tang, SC, et al.. Plasma neurofilament light chain level predicts outcomes in stroke patients receiving endovascular thrombectomy. J Neuroinflammation 2021;18:195. https://doi.org/10.1186/s12974-021-02254-4.Search in Google Scholar PubMed PubMed Central
23. Schiff, L, Hadker, N, Weiser, S, Rausch, C. A literature review of the feasibility of glial fibrillary acidic protein as a biomarker for stroke and traumatic brain injury. Mol Diagn Ther 2012;16:79–92. https://doi.org/10.1007/bf03256432.Search in Google Scholar
24. Auricchio, AM, Baroni, S, Rezai Jahromi, B, Valz Gris, A, Sturiale, CL, Ceccarelli, GM, et al.. Predicting role of GFAP and UCH-L1 biomarkers in spontaneous subarachnoid hemorrhage: a preliminary study to evaluate in the short-term their correlation with severity of bleeding and prognosis. J Clin Neurosci 2024;126:119–27. https://doi.org/10.1016/j.jocn.2024.06.003.Search in Google Scholar PubMed
25. Pujol-Calderon, F, Zetterberg, H, Portelius, E, Lowhagen Henden, P, Rentzos, A, Karlsson, JE, et al.. Prediction of outcome after endovascular embolectomy in anterior circulation stroke using biomarkers. Transl Stroke Res 2022;13:65–76. https://doi.org/10.1007/s12975-021-00905-5.Search in Google Scholar PubMed PubMed Central
26. Amalia, L. Glial fibrillary acidic protein (GFAP): neuroinflammation biomarker in acute ischemic stroke. J Inflamm Res 2021;14:7501–6. https://doi.org/10.2147/jir.s342097.Search in Google Scholar
27. Gyldenholm, T, Hvas, CL, Hvas, AM, Hviid, CVB. Serum glial fibrillary acidic protein (GFAP) predicts outcome after intracerebral and subarachnoid hemorrhage. Neurol Sci 2022;43:6011–9. https://doi.org/10.1007/s10072-022-06274-7.Search in Google Scholar PubMed
28. Whitehouse, DP, Monteiro, M, Czeiter, E, Vyvere, TV, Valerio, F, Ye, Z, et al.. Relationship of admission blood proteomic biomarkers levels to lesion type and lesion burden in traumatic brain injury: a CENTER-TBI study. EBioMedicine 2022;75:103777. https://doi.org/10.1016/j.ebiom.2021.103777.Search in Google Scholar PubMed PubMed Central
29. Stammet, P, Collignon, O, Hassager, C, Wise, MP, Hovdenes, J, Aneman, A, et al.. Neuron-specific enolase as a predictor of death or poor neurological outcome after out-of-hospital cardiac arrest and targeted temperature management at 33 degrees C and 36 degrees C. J Am Coll Cardiol 2015;65:2104–14. https://doi.org/10.1016/j.jacc.2015.03.538.Search in Google Scholar PubMed
30. Streitberger, KJ, Leithner, C, Wattenberg, M, Tonner, PH, Hasslacher, J, Joannidis, M, et al.. Neuron-specific enolase predicts poor outcome after cardiac arrest and targeted temperature management: a multicenter study on 1,053 patients. Crit Care Med 2017;45:1145–51. https://doi.org/10.1097/ccm.0000000000002335.Search in Google Scholar PubMed
31. Moseby-Knappe, M, Mattsson, N, Nielsen, N, Zetterberg, H, Blennow, K, Dankiewicz, J, et al.. Serum neurofilament light chain for prognosis of outcome after cardiac arrest. JAMA Neurol 2019;76:64–71. https://doi.org/10.1001/jamaneurol.2018.3223.Search in Google Scholar PubMed PubMed Central
32. Tiedt, S, Duering, M, Barro, C, Kaya, AG, Boeck, J, Bode, FJ, et al.. Serum neurofilament light: a biomarker of neuroaxonal injury after ischemic stroke. Neurology 2018;91:e1338–47. https://doi.org/10.1212/wnl.0000000000006282.Search in Google Scholar PubMed
33. Pekny, M, Wilhelmsson, U, Stokowska, A, Tatlisumak, T, Jood, K, Pekna, M. Neurofilament light chain (NfL) in Blood-A biomarker predicting unfavourable outcome in the acute phase and improvement in the late phase after stroke. Cells 2021;10. https://doi.org/10.3390/cells10061537.Search in Google Scholar PubMed PubMed Central
34. Butkova, TV, Malsagova, KA, Nakhod, VI, Petrovskiy, DV, Izotov, AA, Balakin, EI, et al.. Candidate molecular biomarkers of traumatic brain injury: a systematic review. Biomolecules 2024;14. https://doi.org/10.3390/biom14101283.Search in Google Scholar PubMed PubMed Central
35. Orr, TJ, Lesha, E, Kramer, AH, Cecia, A, Dugan, JE, Schwartz, B, et al.. Traumatic brain injury: a comprehensive review of biomechanics and molecular pathophysiology. World Neurosurg 2024;185:74–88. https://doi.org/10.1016/j.wneu.2024.01.084.Search in Google Scholar PubMed
36. Rodney, T, Osier, N, Gill, J. Pro- and anti-inflammatory biomarkers and traumatic brain injury outcomes: a review. Cytokine 2018;110:248–56. https://doi.org/10.1016/j.cyto.2018.01.012.Search in Google Scholar PubMed
37. Edalatfar, M, Piri, SM, Mehrabinejad, MM, Mousavi, MS, Meknatkhah, S, Fattahi, MR, et al.. Biofluid biomarkers in traumatic brain injury: a systematic scoping review. Neurocritical Care 2021;35:559–72. https://doi.org/10.1007/s12028-020-01173-1.Search in Google Scholar PubMed
38. Yue, JK, Kobeissy, FH, Jain, S, Sun, X, Phelps, RRL, Korley, FK, et al.. Neuroinflammatory biomarkers for traumatic brain injury diagnosis and prognosis: a TRACK-TBI pilot study. Neurotrauma Rep 2023;4:171–83. https://doi.org/10.1089/neur.2022.0060.Search in Google Scholar PubMed PubMed Central
39. Samanta, RJ, Chiollaz, AC, Needham, E, Yue, JK, Helmy, A, Zanier, ER, et al.. Parsimonious immune-response endotypes and global outcome in patients with traumatic brain injury. EBioMedicine 2024;108:105310. https://doi.org/10.1016/j.ebiom.2024.105310.Search in Google Scholar PubMed PubMed Central
40. Amiri, M, Fisher, PM, Raimondo, F, Sidaros, A, Hribljan, MC, Othman, MH, et al.. Multimodal prediction of residual consciousness in the intensive care unit: the CONNECT-ME study. Brain 2022;146:50–64. https://doi.org/10.1093/brain/awac335.Search in Google Scholar PubMed PubMed Central
41. Egbebike, J, Shen, Q, Doyle, K, Der-Nigoghossian, CA, Panicker, L, Gonzales, IJ, et al.. Cognitive-motor dissociation and time to functional recovery in patients with acute brain injury in the USA: a prospective observational cohort study. Lancet Neurol 2022;21:704–13. https://doi.org/10.1016/s1474-4422(22)00212-5.Search in Google Scholar
42. van Donkelaar, CE, Bakker, NA, Birks, J, Veeger, N, Metzemaekers, JDM, Molyneux, AJ, et al.. Prediction of outcome after aneurysmal subarachnoid hemorrhage. Stroke 2019;50:837–44. https://doi.org/10.1161/strokeaha.118.023902.Search in Google Scholar
43. Rostami, E, Gustafsson, D, Hanell, A, Howells, T, Lenell, S, Lewen, A, et al.. Prognosis in moderate-severe traumatic brain injury in a Swedish cohort and external validation of the IMPACT models. Acta Neurochir (Wien) 2022;164:615–24. https://doi.org/10.1007/s00701-021-05040-6.Search in Google Scholar PubMed PubMed Central
Supplementary Material
This article contains supplementary material (https://doi.org/10.1515/cclm-2025-1315).
© 2025 the author(s), published by De Gruyter, Berlin/Boston
This work is licensed under the Creative Commons Attribution 4.0 International License.