Acoustophoresis-based blood sampling and plasma separation for potentially minimizing sampling-related blood loss
-
Amal Nath
 ,
Sara Marie Larsson
,
Andreas Lenshof
,
Sara Marie Larsson
,
Andreas Lenshof


Abstract
Objectives
Frequent blood sampling in vulnerable patient groups, such as prematurely born infants, can lead to significant blood loss and increased transfusion needs. Current pre-analytical technology requires comparably large blood volumes and leads to discarding of cells. This study investigates a device prototype enabling in-line sampling where cell-reduced plasma for clinical chemistry analyses is generated through acoustophoresis.
Methods
Blood samples were collected from healthy adult donors in lithium-heparin tubes without gel. Plasma separated via acoustophoresis was compared with centrifuged plasma (2000 g × 10 min) for cell counts (n=14), cell-free hemoglobin (n=21), and 12 routine clinical chemistry analyte tests (n=21). Wilcoxon signed-rank tests and Bland Altman analysis were used for statistical comparison.
Results
Both acoustophoresis (AF) and centrifugation (CEN) generated cell-reduced plasma with<0.01 % of cells remaining after separation. However, compared to CEN plasma, more cells (median count per μL 642 vs. 205, p<0.01) and platelets (median count per μL 20,477 vs. 1,537, p<0.0001) remained in AF plasma. Cell-free hemoglobin (fHb) in AF plasma samples (range 0.0–0.2 g/L) was lower (p<0.01) than in CEN plasma samples (range 0.1–0.3 g/L). Statistically significant relative mean differences in test results ranging from 0.84 % (95 % CI 0.48–1.19) for sodium to 10.50 % (95 % CI 5.02–15.99) for AST were found.
Conclusions
This proof-of-concept study demonstrates that acoustophoresis has the potential to produce sufficiently cell-free plasma for several commonly performed clinical chemistry analyses. Further studies should assess pathological samples, platelet activation, and improve the design for more efficient removal of platelets.
Introduction
Many clinically utilized analytes require the separation of plasma from cells prior to analysis. Currently, blood sampling systems predominantly rely on centrifugation of vacuum tubes, a technique first introduced in the 1940s [1]. Despite significant advancements in this method over the years, several fundamental limitations persist. These include the need to discard patient cells and the requirement for relatively large blood sample volumes.
In critically ill patients, the significant blood loss associated with current sampling methods poses a major challenge [2]. In adults, frequently performed diagnostic blood tests have been estimated to correspond to a mean daily volume of about 40–80 mL blood [3]. Other estimations relate sampling-related blood loss to one transfused unit of whole blood every 8 days [4], [5], [6]. Today, there is strong evidence supporting improved patient outcomes by minimizing sampling-related blood loss [7].
Preterm infants requiring intensive care are even more vulnerable to significant sampling-related blood loss than adult patients, as their total blood volume is often extremely limited, sometimes amounting to only 50–60 mL [8]. Extremely preterm infants have one of the highest transfusion rates within the hospital settings [9]. The sampling-related blood loss in infants pose a significant risk of developing severe morbidities, such as e.g. bronchopulmonary dysplasia and retinopathy of prematurity [8], 10], 11]. Further, frequent manual sampling procedures could increase the risk of infection [12].
Development of alternative blood sampling techniques is thus urgently needed. The use of blood return systems has demonstrated potential benefits [13], allowing the returning of cells to the patient along with the fluid used to flush the system (clearing volume). An additional step in this direction, proposed herein, would be inline blood sampling and plasma separation based on acoustophoresis. In this approach, plasmapheresis is accomplished through the movement of cells using ultrasound-based forces. Acoustophoresis has been previously demonstrated to be a gentle processing technique, preserving cell integrity and function [14]. So far, the use of this technique has been reported in research settings with microfluidic devices [15] and in 2024 for the first time in a US Food and Drug Administration-approved clinical blood diagnostic instrumentation where a flow cell design based on acoustophoresis enabled optical hemolysis detection [16]. To the best of our knowledge, a direct comparison between acoustophoresis-derived blood plasma and clinically centrifuged plasma for common clinical chemistry analyses, has not yet been demonstrated.
In this experimental proof-of concept study, we present the development of a compact closed-loop in-line acoustophoresis-based plasma separation device that could offer a potential future in clinical settings requiring frequent blood sampling. The aim of the present study is to compare the quality of plasma obtained using acoustophoresis with plasma obtained from conventional centrifugation; for cell count, degree of hemolysis and results from a set of commonly ordered clinical chemistry tests.
Materials and methods
Study design
This was a cross-disciplinary experimental comparative proof-of-concept study performed at Lund University, Sweden between January and December 2024. Blood was collected from anonymized healthy volunteers who provided signed informed consent at the Biomedical Centre, Lund University, Lund, Sweden according to a protocol approved by the Swedish ethical review authority (Ref. No. 2020–05818). The volunteers comprised a group of 21 healthy donors (males=3, females=18), with a median age of 44 years (range 26–54 years).
The study compared plasma separated by acoustophoresis (AF) with plasma obtained through conventional centrifugation (CEN) through three distinct sets of analyses. The first focused on cell count, evaluating the number of residual cells in plasma samples (n=14). The second investigated red blood cell integrity by studying the degree of hemolysis (n=21). The third examined results from 12 routine clinical chemistry tests (n=21).
Design of the blood separation device
The blood separation device comprised an acoustophoresis chip and three micro-peristaltic pumps. The standard glass-based acoustophoresis chip [17] consisted of a channel with two separation stages (Figure 1A). The chip measured approximately 90 mm in length, 5 mm in width, and 2 mm in depth, with transducers positioned at the sides of the acoustophoresis chip. The transducers driven by amplified sinusoidal voltage signals created a standing wave acoustic field within the microchannel. Micro-peristaltic pumps (Takasago Fluidic Systems, Nagoya, Japan) were attached at the outlets to draw whole blood directly from the collection tube into the device. As the blood sample flowed through the channel, acoustic forces concentrated the blood cells along the center of the channel, enabling efficient cell separation. The concentration and separation of blood cells were achieved across two sequential stages (Figure 1B). In the first stage, a significant portion of cells was removed from the plasma, reducing the cell concentration in the sample that proceeded to the second stage. Here, the remaining cells were further removed, allowing the collection of purified blood plasma at the outlet. In all experimental runs, the device was primed with normal saline prior to introducing blood samples. The operating parameters were optimized to sample the blood into the device at a flow rate of 115 μL/min, generating blood plasma at a rate of 23 μL/min.

Experimental setup. (A) Schematic of the two-stage acoustofluidic device illustrating the sample flow path. Micro-peristaltic pumps are attached to the outlets through flow pulsation dampeners which are required to stabilize the flow. (B) Expanded views of the outlets of the two separation stages show the focusing and removal of cells, resulting in the collection of purified blood plasma at the side outlet of stage two.
Specimen collection and handling
Blood was collected by experienced phlebotomists in lithium heparin blood collection tubes (BD Vacutainer, Plymouth, UK) without gel. For plasma preparation by acoustophoresis, blood was continuously drawn into the device, generating plasma that was collected in low-binding Protein Lo-Bind tubes (Eppendorf, Hamburg, Germany). The entire procedure, including blood collection and plasma separation, was completed within 1 h of blood draw. For plasma preparation by centrifugation, blood was processed according to a standard clinical protocol, centrifuged at 2000×g for 10 min at room temperature, and approximately 200 µL of plasma was transferred to Protein Lo-Bind tubes. Both acoustophoresis-generated (AF) plasma and centrifugation-prepared (CEN) plasma were frozen at −80 °C after separation before being shipped to the laboratory on dry ice for analysis.
Comparing separated plasma samples
Cell count comparisons
Whole blood, along with separated AF plasma and CEN plasma samples, was analyzed for red blood cells (RBCs), white blood cells (WBCs), and platelets (PLTs) using a FACS Canto II flow cytometer (BD Biosciences, San Jose, CA). Plasma samples were diluted 60 × and whole blood 100,00 × times using phosphate-buffered saline to reach an event detection rate <1,000 events per second. For staining, samples were incubated for 20 min with phycoerythrin conjugated to anti-CD45 for gating white blood cells and allophycocyanin conjugated to anti-CD61 for platelets. Fluorescence intensity thresholds were determined using a control sample to accurately detect leukocytes and platelets. Flow cytometry events were collected over a 1-min period at a medium flow rate of 60 μL/min.
Cell integrity by investigation of hemolysis
The extent of hemolysis in plasma induced by the two separation techniques was evaluated by a photometrical measurement of cell-free hemoglobin (fHb) using HemoCue® Plasma/Low Hb System (HemoCue AB, Ängelholm, Sweden). Although the manufacturer guarantees linear range only between 0.3 g/L and 30 g/L, linearity has been shown at lower concentrations [18].
Clinical chemistry tests
AF plasma and CEN plasma samples were analyzed using the Cobas 8000 analytical platform (Roche Diagnostics, Basel, Switzerland) to assess a panel of 12 commonly ordered biochemical parameters listed in Table 1. Additionally, semi-quantitative indices of hemolysis (H), icterus (I), and lipemia/turbidity (L) were measured to identify potential pre-analytical interferences affecting assay accuracy and reliability.
Parameters analysed in AF and CEN plasma samples using Cobas 8,000 platform.
| Category | Analytes |
|---|---|
| Enzymes | Alanine aminotransferase (ALT), alkaline phosphatase (ALP), aspartate aminotransferase (AST) |
| Proteins | Albumin, C-reactive protein (CRP) |
| Electrolytes | Calcium, phosphate, potassium, sodium |
| Renal and hepatic markers | Total bilirubin, creatinine, urea |
| Indices | Hemolysis (H), icterus (I), lipemia/turbidity (L) |
Median cell (RBC + WBC) and platelet count from flow cytometry analysis and removal efficiency of the two methods are presented. The removal efficiency was calculated from cell and platelet count.
| Sample (n=14) | Median count per μL | Removal efficiency, % | ||
|---|---|---|---|---|
| Cells | Platelets | Cells | Platelets | |
| Whole blood before separation | 4.74 × 10⁶ (4.18 × 10⁶–5.64 × 10⁶) | 213,583 (152,083–253,292) | – | – |
| CEN plasma | 205 (146–378) | 1,537 (966–2,374) | 99.99 (99.992–99.997) | 99.28 (98.681–99.539) |
| AF plasma | 642 (400–1,084) | 20,477 (14,723–29,052) | 99.99 (99.985–99.993) | 90.41 (85.170–94.548) |
Calculations and statistical analysis
Cell count and fHb values in AF plasma and CEN plasma were summarized as median (interquartile range), with graphical representations. Wilcoxon signed-rank test was used to assess differences in cell count and fHb values, with level of significance p<0.05. The efficiency of the separation method in removing cells or platelets from whole blood was calculated as – Removal efficiency (%) = 100 × (1 − median plasma cell or platelet count/median whole blood cell or platelet count). The bias in results from clinical chemistry tests was obtained from Bland-Altman plots where the difference in results, i.e. AF plasma result – CEN plasma result, was plotted against the mean. The differences in test results were considered to be statistically significant if 0 was outside the 95 % confidence intervals (CI) for the bias. The mean relative difference in results were compared to acceptance limits for proficiency testing from the Clinical Laboratory Improvement Amendments (CLIA) [19]. Biological variation (BV) parameters – between-subject BV (CVG) and intra-individual BV (CVI) – obtained from the European Federation of Laboratory Medicine Biological Variation Database [20], 21] were also presented for comparison. Analytical imprecision (CVA) was estimated as laboratory between-day imprecision using a commercial internal control material from SERO AS, Billingstad, Norway. All statistical analyses were performed using the R software (R Development Core Team, R Foundation for Statistical Computing, Vienna, Austria).
Results
Cell count comparisons
Cell count in AF plasma and CEN plasma are shown in boxplots in Figure 2. Median (interquartile range) RBC count in AF plasma was higher compared to CEN plasma, 632 (380–1,066) per μL vs. 186 (133–372) per μL (p<0.01). Differences were also observed in platelet count- 20,477 (14,723–29 052) per μL in AF plasma compared to 1,537 (966–2,374) per μL in CEN plasma (p<0.0001). In contrast, differences in WBC count in AF plasma and CEN plasma 17 (12–25) per μL vs. 10 (6–18) per μL were not statistically significant (p=0.11).
Removal efficiency is presented in Table 2. From whole blood, acoustophoresis removed 99.99 % of blood cells, achieving a removal efficiency similar to centrifugation. Platelet removal efficiency was lower with acoustophoresis (90.41 %) compared to centrifugation (99.28 %).
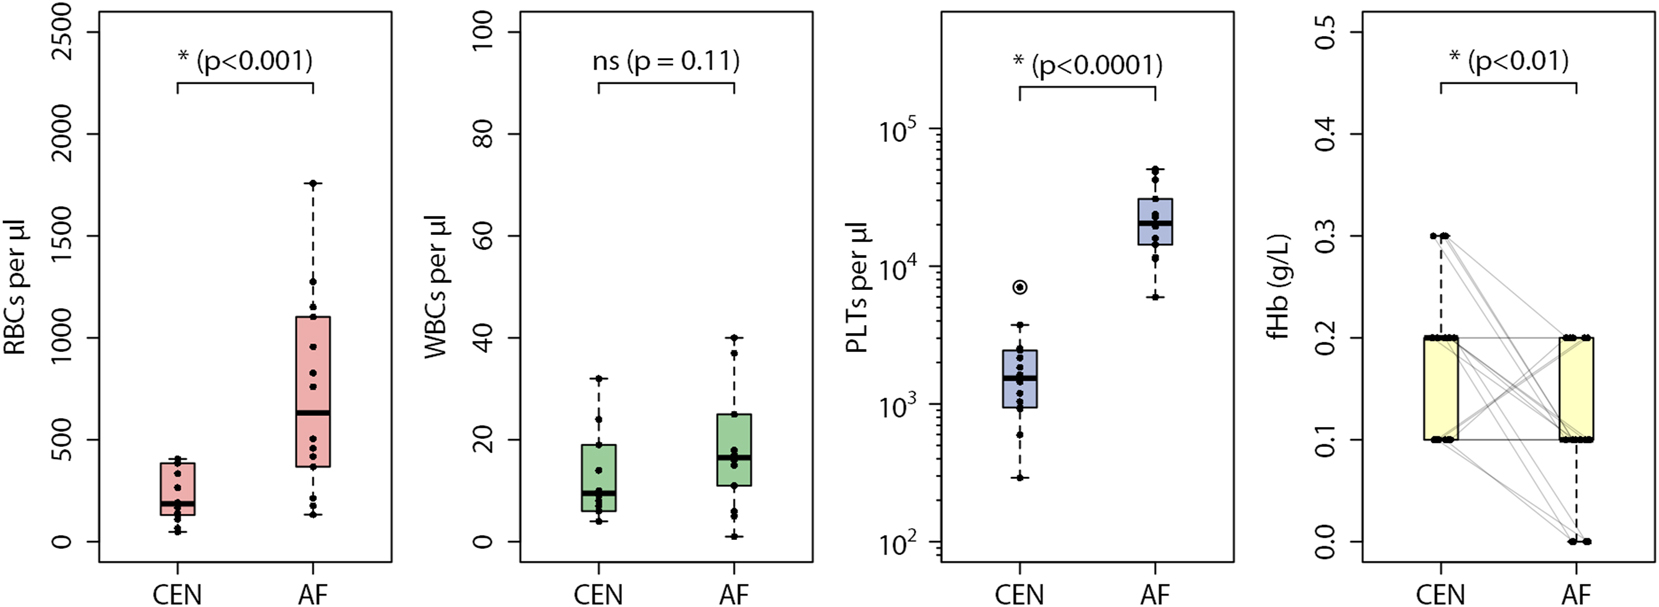
Summary statistics of measured red blood cells (RBCs), white blood cells (WBCs), platelets (PLTs) and cell-free hemoglobin levels (fHb) in centrifuged plasma (CEN) and acoustophoresis plasma (AF) is presented. Box plots show the median and interquartile range (IQR), with whiskers extending to 1.5 times the IQR. p-Values are indicated above the brackets, and outliers beyond the upper bound (third quartile +1.5 × IQR) are marked with circles. Faint lines connect the fHb values of sample pairs for comparison.
Hemolysis
Cell-free hemoglobin (fHb) concentrations in CEN plasma ranged from 0.1 g/L to 0.3 g/L. In comparison, fHb in AF plasma ranged from 0.0 g/L to 0.2 g/L. Figure 2 presents the fHb data distribution as boxplots. In 12 out of 21 sample pairs, fHb in AF plasma was lower than fHb in CEN plasma. While fHb in 6 out of 21 sample pairs were the same, three sample pairs (3 out of 21) had higher fHb in AF plasma. The differences in measured fHb were seen to be statistically significant (p<0.01).
Clinical chemistry tests
Differences in test results are presented in Bland-Altman plots in Figure 3. A negative bias in hemolysis index (H) was observed. Differences in icterus index (I) were small with zero difference in 17 out of 21 sample pairs. A positive bias was observed for lipemia index (L). As shown in Table 3, statistically significant differences were observed for albumin, ALP, AST, total bilirubin, calcium, and sodium. All analytes except albumin met the CLIA criteria.
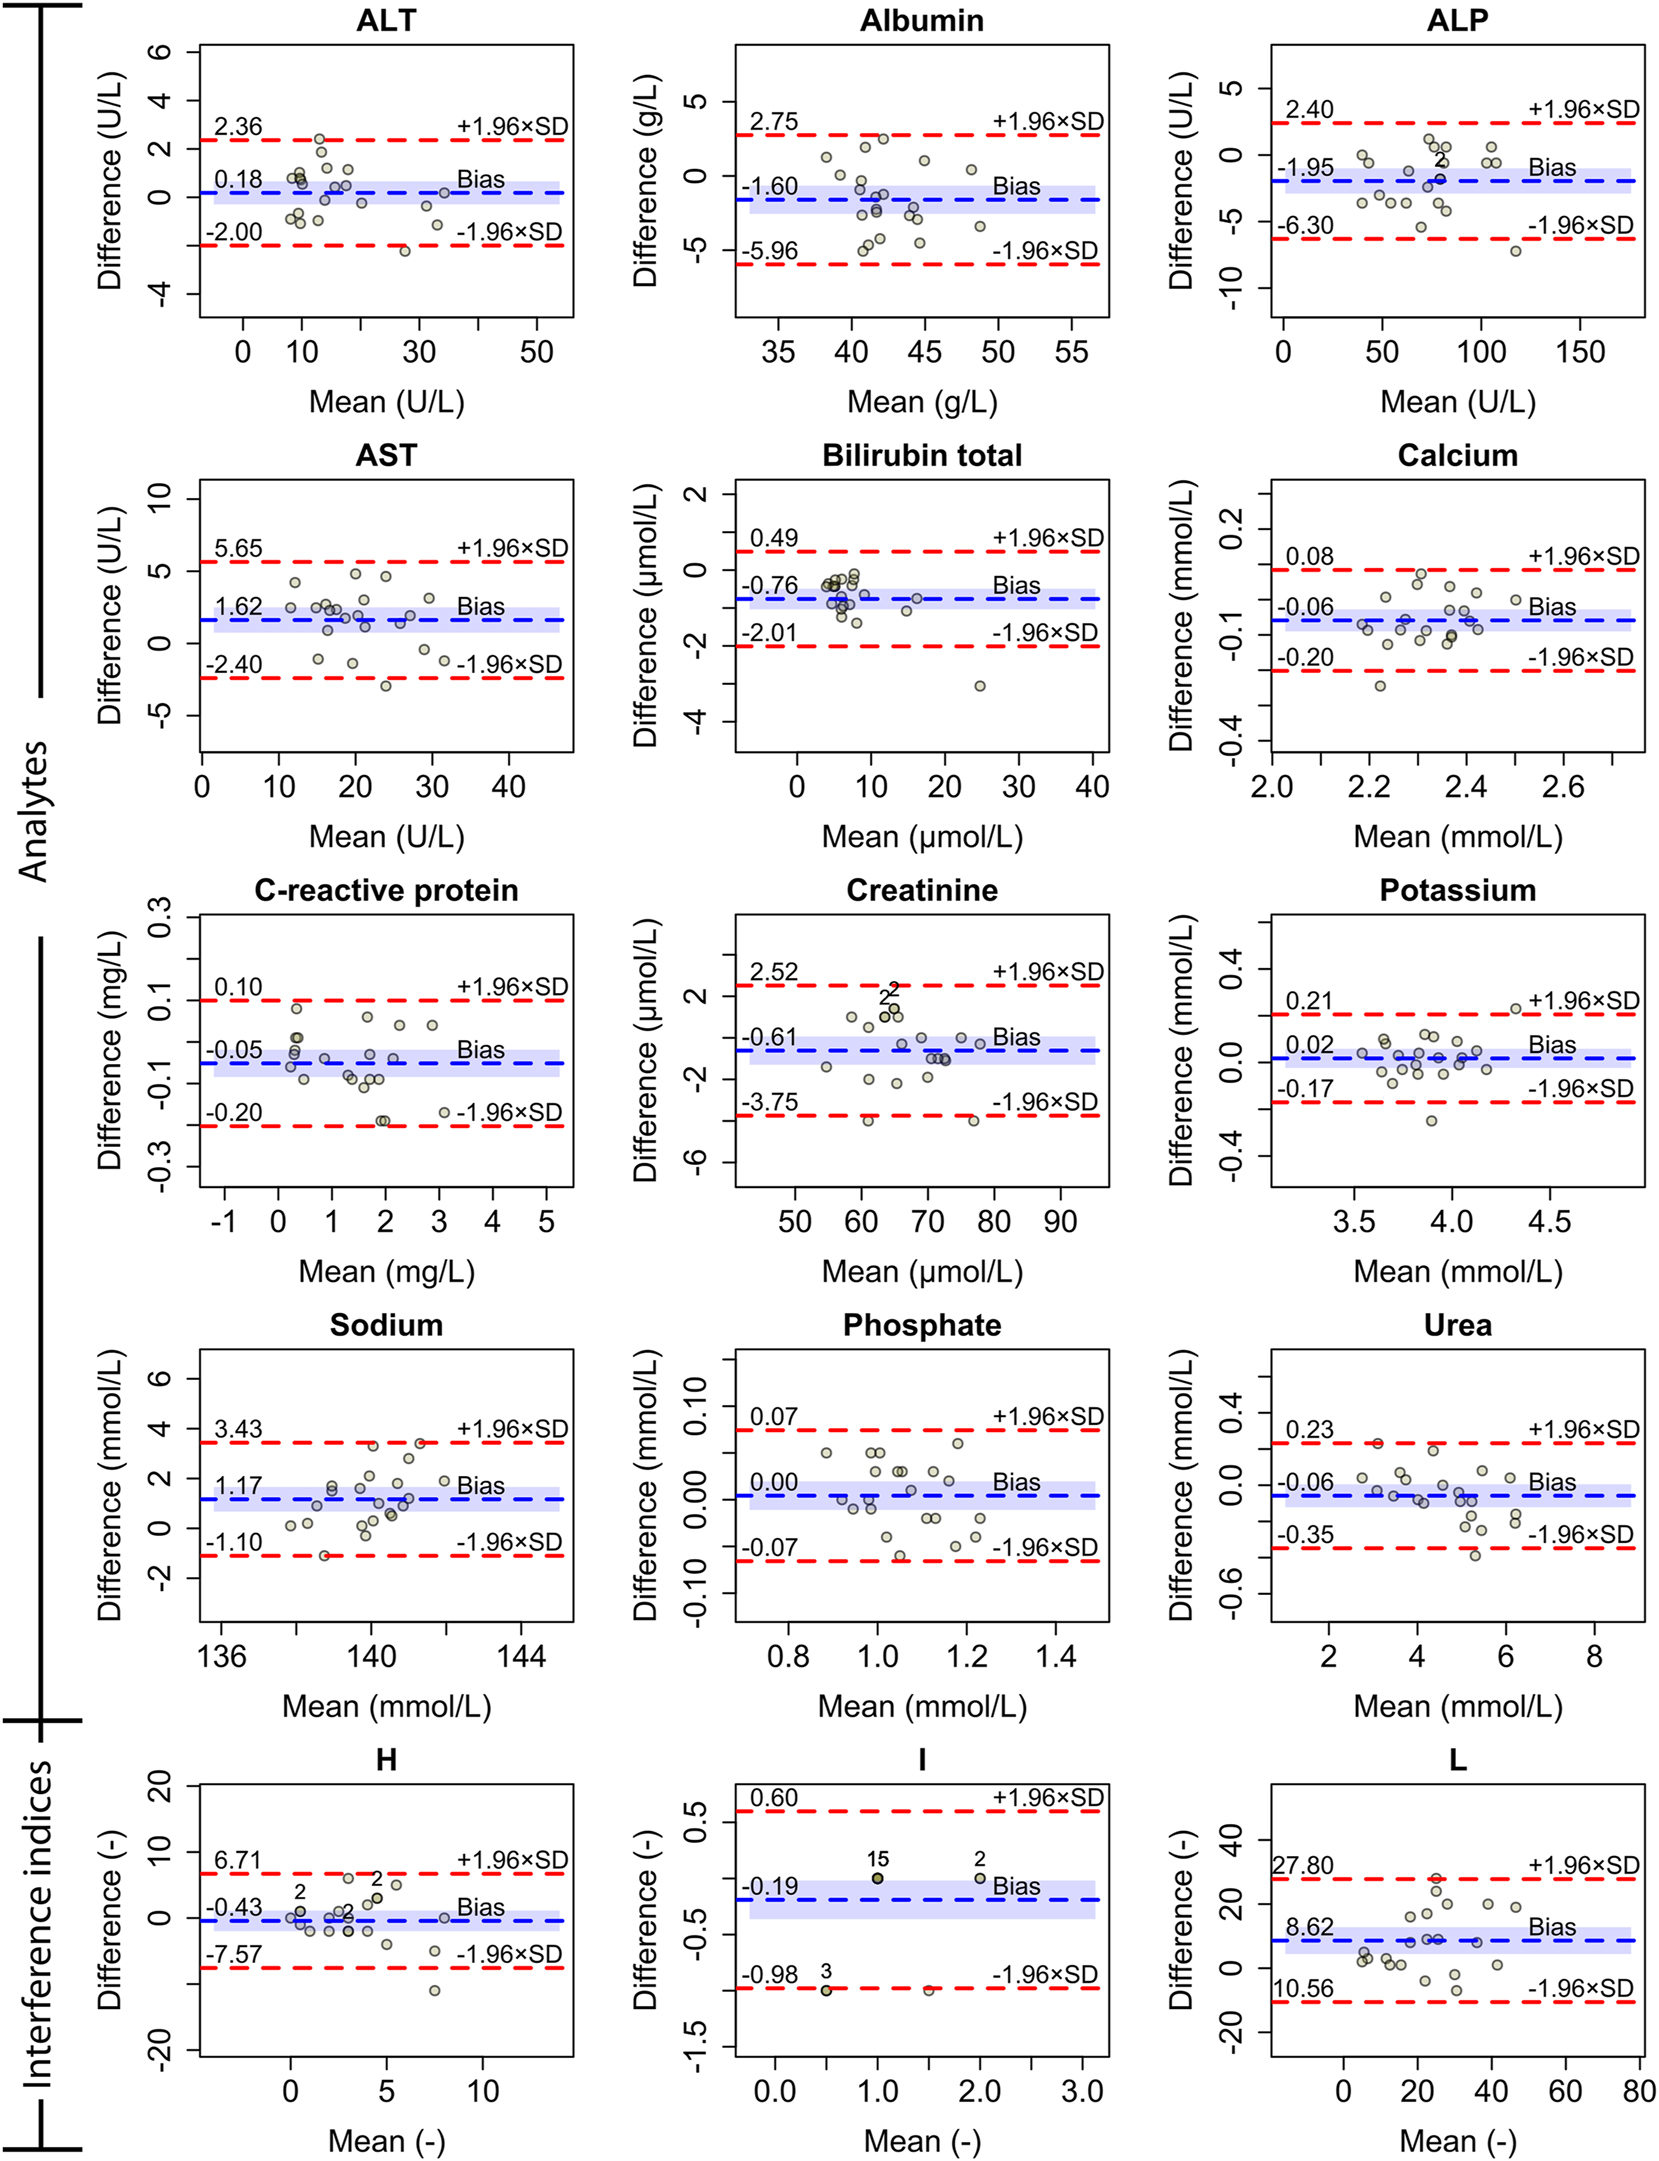
Bland-Altman plots showing absolute differences in results for measured analytes and interference indices for hemolysis, icterus and lipemia. Dashed blue represents mean absolute difference (bias) and dashed red lines represent ±1.96 standard deviation (SD). The shaded blue area corresponds to the 95 % confidence interval for the bias. If the calculated mean and difference are identical for multiple sample pairs, the number of such pairs is labeled above the point.
Mean absolute and percentage difference in the results with 95 % confidence intervals (CI), analytical imprecision (CVA), within-group BV (CVG), intra-individual BV (CVI) and Clinical Laboratory Improvement Amendments (CLIA) criteria are presented for comparison.
| Analyte | Mean absolute difference (95 % CI) | Mean percentage difference (95 % CI) | Statistically significant? | CVA, % | CVG, % | CVI, % | CLIA 2024 criteria | Within CLIA? |
|---|---|---|---|---|---|---|---|---|
| ALT, U/L | 0.18 (−0.29, 0.66) | 2.4 (−1.2, 6.0) | No | 1.9 | 35.2 | 11.4 | ±15 % or ±6 U/L | Yes |
| Albumin, g/L | −1.60 (−2.55, −0.65) | −3.5 (−5.7, −1.4) | Yes | 3.5 | 4.1 | 2.5 | ±8 % | No |
| ALP, U/L | −1.95 (−2.90, −1.00) | −2.8 (−4.1, −1.5) | Yes | 2.8 | 21.0 | 6.0 | ±20 % | Yes |
| AST, U/L | 1.62 (0.75, 2.50) | 10.5 (5.0, 16.0) | Yes | 2.7 | 19.4 | 8.6 | ±15 % or ±6 U/L | Yes |
| Bilirubin total, μmol/L | −0.76 (−1.03, −0.49) | −9.4 (−11.5, −7.3) | Yes | 2.8 | 24.6 | 20.2 | ±20 % or ±0.4 mg/dL | Yes |
| Calcium, mmol/L | −0.06 (−0.09, −0.03) | −2.5 (−3.8, −1.2) | Yes | 1.2 | 2.7 | 1.8 | ±1.0 mg/dL (±0.25 mmol/L) | Yes |
| Creatinine, μmol/L | −0.61 (−1.30, 0.07) | −0.9 (−1.9, 0.2) | No | 2.1 | 16.2 | 4.4 | ±10 % or ±0.2 mg/dL | Yes |
| C-reactive protein, mg/L | −0.05 (−0.08, −0.02) | −3.7 (−7.8, 0.4) | No | 2.0 | 77.4 | 58.9 | ±30 % or ±1 mg/L | Yes |
| Sodium, mmol/L | 1.17 (0.67, 1.66) | 0.8 (0.5, 1.2) | Yes | 0.6 | 0.7 | 0.5 | ±4 mmol/L | Yes |
| Potassium, mmol/L | 0.02 (−0.02, 0.06) | 0.5 (−0.6, 1.5) | No | 0.7 | 5.3 | 3.9 | ±0.3 mmol/L | Yes |
| Phosphate, mmol/L | 0.00 (−0.01, 0.02) | 0.6 (−0.9, 2.0) | No | 1.4 | 10.7 | 7.7 | ±10 % or ±0.3 mg/dL | Yes |
| Urea, mmol/L | −0.06 (−0.12, 0.01) | −0.8 (−2.2, 0.5) | No | 2.4 | 20.6 | 13.3 | ±10 % | Yes |
Discussion
In this study, we evaluated the performance of a plasma separation device based on acoustophoresis, designed for future blood-saving applications in clinical settings. This proof-of-concept study shows the potential of the technique as assessed through comparisons with centrifugation for cell removal efficiency, hemolysis and a panel of routine clinical chemistry tests.
tAs indicated by lower cell-free hemoglobin values measured in AF plasma, acoustophoresis was gentler to blood cells compared to centrifugation. Hemolysis remains a leading cause of specimen rejection and repeat sampling in clinical laboratories [22]. The reduced risk of analytical interference from hemolysis could enhance the accuracy of analyte measurements, particularly those susceptible to spectrophotometric interference, such as AST and ALT. Additionally, it may improve the diagnostic reliability of analytes that may be biased due to the release of intracellular components, such as potassium, following cell lysis. This advantage may be particularly beneficial in neonatal intensive care, where neonatal red blood cells are well known to be prone to lysis [23]. Moreover, the gentle nature of acoustophoresis, which preserves cell integrity, supports the potential for reinfusion of separated cells back into the patient – a significant benefit in low-volume clinical scenarios.
The acoustophoresis separation procedure achieved high cell removal efficiency, removing more than 99.99 % of RBCs and WBCs from whole blood, comparable to that of centrifugation. Efficient removal of these cells is essential as cell lysis can release enzymes and electrolytes that affect the concentrations of key analytes. Although acoustophoresis performed well in removing larger cells, it was less effective in removing platelets compared to centrifugation. Platelets, due to their smaller size, exhibit lower acoustic mobility – a known limitation of acoustophoresis, as the acoustic force scales with particle volume [23]. Consequently, a fraction of platelets remained in the separated plasma. This incomplete removal may influence analyte measurements, as activated platelets may potentially affect results.
Statistically significant differences were found for six out of 12 analytes – albumin, ALP, AST, total bilirubin, calcium, and sodium. However, measurement of all analytes except albumin met the CLIA criteria. The adhesion of albumin to the glass surface of the device could have contributed to the observed negative bias in albumin levels. As calcium is partially bound to albumin in plasma, a reduction in albumin levels may also explain the lower measured calcium concentrations in AF plasma. Since the device was primed with normal saline prior to plasma separation, this could have contributed to the observed positive bias in sodium levels. A small volume of residual saline from the tubing could have inadvertently mixed with the collected plasma, leading to a higher sodium concentration. The positive bias in lipemia index (L) indicates that lipemic particles were less efficiently removed by acoustophoresis, which, like cells and platelets, can also interfere with clinical chemistry analyses. Thus, while acoustophoresis provides high-quality plasma with minimal hemolysis and efficient removal of larger cells, design modifications may be needed to achieve more efficient removal of the relatively smaller-sized platelets and lipemic particles.
A major limitation in this experimental proof-of-concept study is the inclusion of blood from healthy donors alone. Blood from critically ill patients may differ in important aspects from that of healthy donors and investigations are required to assess the differences in separation performance. It should also be noted that given the use of non-parametric tests and the relatively small sample size, the power of this study to detect statistical differences was inherently limited.
In summary, we studied the feasibility of acoustophoresis-based blood sampling and plasma separation which requires substantially lower volumes than standard blood collection tubes. In blood from healthy adults, we found that plasma separated by acoustophoresis gave results comparable to that of centrifugation for a set of common chemistry analytes. Acoustophoresis was seen to separate cells as efficiently as centrifugation while inducing a lower degree of hemolysis during separation. Improvements in device design for better removal of platelets and lipemic particles and investigation of separation performance with blood samples from critically ill patients and neonates will be conducted in future studies.
Funding source: Vetenskapsrådet
Award Identifier / Grant number: 2019-00795
Funding source: Mats Paulssons Stiftelse
Acknowledgments
Axel Tojo and Martin Bengtsson are acknowledged for their contributions to device manufacturing.
-
Research ethics: The study was conducted in accordance with the Helsinki declaration.
-
Informed consent: Blood was collected from anonymized healthy volunteers who provided signed informed consent at the Biomedical Center, Lund University (Lund, Sweden) according to a protocol approved by the Swedish ethical review authority (Ref. No. 2020–05818).
-
Author contributions: AN, ML, AL, LN, MG, DL and TL were involved in the study concept and design. AN and ML were involved in acquisition of data, analysis and interpretation of data. AN, AL, WQ, TB and TL were involved in the design and development of the microfluidic platform. AN and ML drafted the initial manuscript. DL and TL obtained funding. All authors have accepted responsibility for the entire content of this manuscript and approved its submission.
-
Use of Large Language Models, AI and Machine Learning Tools: None declared.
-
Conflict of interest: TL is a founder and shareholder of AcouSort AB that develops acoustophoresis-based technology.
-
Research funding: This work was supported by Mats Paulsson Foundation and Swedish Research Council grant no.: 2019-00795.
-
Data availability: Raw data is available on request from the corresponding author.
References
1. Ames, AC, Bamford, E. An appraisal of the “Vacutainer” system for blood collection. Ann Clin Biochem Int J Lab Med 1975;12:151–5. https://doi.org/10.1177/000456327501200136.Search in Google Scholar PubMed
2. Pennestrì, F, Tomaiuolo, R, Banfi, G, Dolci, A. Blood over-testing: impact, ethical issues and mitigating actions. Clin Chem Lab Med 2024;62:1283–7. https://doi.org/10.1515/cclm-2023-1227.Search in Google Scholar PubMed
3. Lasocki, S, Pène, F, Ait-Oufella, H, Aubron, C, Ausset, S, Buffet, P, et al.. Management and prevention of anemia (acute bleeding excluded) in adult critical care patients. Ann Intensive Care 2020;10:97. https://doi.org/10.1186/s13613-020-00711-6.Search in Google Scholar PubMed PubMed Central
4. Bodley, T, Levi, O, Chan, M, Friedrich, JO, Hicks, LK. Reducing unnecessary diagnostic phlebotomy in intensive care: a prospective quality improvement intervention. BMJ Qual Saf 2023;32:485–94. https://doi.org/10.1136/bmjqs-2022-015358.Search in Google Scholar PubMed
5. Jackson Chornenki, NL, James, TE, Barty, R, Liu, Y, Rochwerg, B, Heddle, NM, et al.. Blood loss from laboratory testing, anemia, and red blood cell transfusion in the intensive care unit: a retrospective study. Transfusion 2020;60:256–61. https://doi.org/10.1111/trf.15649.Search in Google Scholar PubMed
6. Raasveld, SJ, de Bruin, S, Reuland, MC, van den Oord, C, Schenk, J, Aubron, C, et al.. Red blood cell transfusion in the intensive care unit. JAMA 2023;330:1852. https://doi.org/10.1001/jama.2023.20737.Search in Google Scholar PubMed PubMed Central
7. Siegal, DM, Manning, N, Jackson Chornenki, NL, Hillis, CM, Heddle, NM. Devices to reduce the volume of blood taken for laboratory testing in ICU patients: a systematic review. J Intensive Care Med 2020;35:1074–9. https://doi.org/10.1177/0885066618810374.Search in Google Scholar PubMed
8. Lopriore, E. The total volume of blood in an extremely preterm neonate is about the size of a double espresso. Acta Paediatr Int J Paediatr 2023;112:2458–9. https://doi.org/10.1111/apa.16994.Search in Google Scholar PubMed
9. Saito‐Benz, M, Flanagan, P, Berry, MJ. Management of anaemia in pre‐term infants. Br J Haematol 2020;188:354–66. https://doi.org/10.1111/bjh.16233.Search in Google Scholar PubMed
10. Hellström, W, Forssell, L, Morsing, E, Sävman, K, Ley, D. Neonatal clinical blood sampling led to major blood loss and was associated with bronchopulmonary dysplasia. Acta Paediatr Int J Paediatr 2020;109:679–87. https://doi.org/10.1111/apa.15003.Search in Google Scholar PubMed PubMed Central
11. Hellström, W, Martinsson, T, Morsing, E, Gränse, L, Ley, D, Hellström, A. Low fraction of fetal haemoglobin is associated with retinopathy of prematurity in the very preterm infant. Br J Ophthalmol 2022;106:970–4. https://doi.org/10.1136/bjophthalmol-2020-318293.Search in Google Scholar PubMed PubMed Central
12. Meites, S. Skin-puncture and blood-collecting technique for infants: update and problems. Clin Chem 1988;34:1890–4. https://doi.org/10.1093/clinchem/34.9.1885.Search in Google Scholar
13. Raurell-Torredà, M, Arias-Rivera, S, Rodríguez-Delgado, ME, Campos-Asensio, C, Fernández-Castillo, R-J. Effectiveness of closed blood sampling systems in intensive care patients: a scoping review. Enfermería Intensiva 2024;35:133–45. https://doi.org/10.1016/j.enfie.2023.05.001.Search in Google Scholar PubMed
14. Burguillos, MA, Magnusson, C, Nordin, M, Lenshof, A, Augustsson, P, Hansson, MJ, et al.. Microchannel acoustophoresis does not impact survival or function of Microglia, leukocytes or tumor cells. PLoS One 2013;8:1–11. https://doi.org/10.1371/journal.pone.0064233.Search in Google Scholar PubMed PubMed Central
15. Gerlt, M, Baasch, T, Nath, A, Qiu, W, Lenshof, A, Laurell, T. Acoustofluidic blood component sample preparation and processing in medical applications. In: Tokeshi M, editor. Applications of microfluidic systems in biology and medicine. Bioanalysis. Singapore: Springer; 2024, vol 13:1–55 pp.10.1007/978-981-97-6540-9_1Search in Google Scholar
16. Balasubramanian, S, McDowell, EJ, Laryea, ET, Blankenstein, G, Pamidi, PVA, Winkler, AM, et al.. Novel In-Line hemolysis detection on a blood gas analyzer and impact on whole blood potassium results. Clin Chem 2024;70:1485–93. https://doi.org/10.1093/clinchem/hvae135.Search in Google Scholar PubMed
17. Evander, M, Lenshof, A, Laurell, T, Nilsson, J. Acoustophoresis in wet-etched glass chips. Anal Chem 2008;80:5178–85. https://doi.org/10.1021/ac800572n.Search in Google Scholar PubMed
18. Morris, LD, Pont, A, Lewis, SM. Use of a new HemoCue system for measuring haemoglobin at low concentrations. Clin Lab Haematol 2001;23:91–6. https://doi.org/10.1046/j.1365-2257.2001.00363.x.Search in Google Scholar PubMed
19. The Health Human Services Department atCfMMS. Clinical laboratory improvement amendments of 1988 (CLIA) fees; histocompatibility, personnel, and alternative sanctions for certificate of waiver laboratories; 2024. [cited 2025-04-09]. Available from: https://www.ecfr.gov/current/title-42/chapter-IV/subchapter-G/part-493.Search in Google Scholar
20. Aarsand, AK, Díaz-Garzón, J, Fernandez-Calle, P, Guerra, E, Locatelli, M, Bartlett, WA, et al.. The EuBIVAS: within- and between-subject biological variation data for electrolytes, lipids, urea, uric acid, total protein, total bilirubin, direct bilirubin, and glucose. Clin Chem 2018;64:1380–93. https://doi.org/10.1373/clinchem.2018.288415.Search in Google Scholar PubMed
21. Aarsand, AK, Fernandez-Calle, P, Webster, C, Coskun, A, Gonzales-Lao, E, Diaz-Garzon, J, et al.. The EFLM biological variation database. https://biologicalvariation.eu/[Accessed 09 04 2025].Search in Google Scholar
22. Lippi, G, Blanckaert, N, Bonini, P, Green, S, Kitchen, S, Palicka, V, et al.. Haemolysis: an overview of the leading cause of unsuitable specimens in clinical laboratories. Clin Chem Lab Med 2008;46:764–72. https://doi.org/10.1515/cclm.2008.170.Search in Google Scholar PubMed
23. Lenshof, A, Magnusson, C, Laurell, T. Acoustofluidics 8: applications of acoustophoresis in continuous flow microsystems. Lab Chip 2012;12:1210. https://doi.org/10.1039/c2lc21256k.Search in Google Scholar PubMed
© 2025 the author(s), published by De Gruyter, Berlin/Boston
This work is licensed under the Creative Commons Attribution 4.0 International License.
Articles in the same Issue
- Frontmatter
- Editorial
- Advancing diagnostic stewardship through claims-based utilization analysis: toward a system-wide vision of diagnostic excellence
- Review
- Biomarkers in body fluids and their detection techniques for human intestinal permeability assessment
- Mini Review
- Challenges of using natriuretic peptides to screen for the risk of developing heart failure in patients with diabetes: a report from the International Federation of Clinical Chemistry and Laboratory Medicine (IFCC) Committee on Clinical Applications of Cardiac Bio-Markers (C-CB)
- Opinion Papers
- Reference intervals in value-based laboratory medicine: a shift from single-point measurements to metabolic variation-based models
- Overview of laboratory diagnostics for immediate management of patients presenting to the emergency department with acute bleeding
- What Matters Most: an Age-Friendly approach to pathology and laboratory medicine
- No fault or negligence after an adverse analytical finding due to a contaminated supplement: mission impossible. Two examples involving trimetazidine
- General Clinical Chemistry and Laboratory Medicine
- Utilization analysis of laboratory tests using health insurance claims data: advancing nationwide diagnostic stewardship monitoring systems
- Evaluating large language models as clinical laboratory test recommenders in primary and emergency care: a crucial step in clinical decision making
- A novel corrective model based on red blood cells indices and haemolysis index enables accurate unhaemolysed potassium determination in haemolysed samples – Hemokalc project
- Validation of (self-collected) capillary blood using a topper collection system as alternative for venous sampling for 15 common clinical chemistry analytes
- Acoustophoresis-based blood sampling and plasma separation for potentially minimizing sampling-related blood loss
- Clinical validation of a liquid chromatography single quadrupole mass spectrometry (LC-MS) method using Waters Kairos™ Amino Acid Kit reagents
- Robustness of steroidomics-based machine learning for diagnosis of primary aldosteronism: a laboratory medicine perspective
- Investigation of the possible cause of over-estimation of human aldosterone in plasma, using a unique, non-synthetic human aldosterone-free matrix
- Performance of afternoon (16:00 h) serum cortisol for the diagnosis of Cushing’s syndrome
- MAGLUMI® Tacrolimus (CLIA) assay: analytical performances and comparison with LC-MS/MS and ARCHITECT Tacrolimus (CMIA) assay
- Assessment of 2023 ACR/EULAR antiphospholipid syndrome classification criteria in a Spanish cohort
- Comprehensive evaluation of antiphospholipid antibody testing methodologies in APS diagnosis: performance comparisons across assay systems and clinical subtypes
- Candidate Reference Measurement Procedures and Materials
- Exploring commutable materials for serum folate measurement: challenges in cross-method harmonization
- Reference Values and Biological Variations
- Reference ranges for ionized calcium in plasma in Danish children aged 0 days to 3 years using laboratory registry data
- A step forward in pediatric hemophagocytic lymphohistiocytosis and autoimmune disease: pediatric reference interval for serum soluble IL-2 receptor and soluble CD163
- Cancer Diagnostics
- Cellular expression of PD-1, PD-L1 and CTLA-4 in patients with JAK2V617F mutated myeloproliferative disorders
- Diabetes
- Serum N-glycans as independent predictors of the incidence of type 2 diabetes: a prospective investigation in the AEGIS cohort
- Infectious Diseases
- An assessment of molecular diagnosis of tuberculosis and multi-drug resistant tuberculosis testing and quality assessment: findings of an international survey
- Letters to the Editor
- Targeting low-value laboratory care
- Is time a significant factor in the release of potassium from lithium heparin plasma and serum?
- External quality assessment in resource-constrained laboratories: a survey of practices and perceptions in Nepal
- Is successfulness of platelet clump disaggregation by vortexing influenced by platelet measurement methods?
- Oligoclonal banding analysis: assessing plasma use and time interval requirements for paired CSF and blood