An isotope dilution-liquid chromatography-tandem mass spectrometry (ID-LC-MS/MS)-based candidate reference measurement procedure for the quantification of carbamazepine in human serum and plasma
-
Tobias Schierscher
 ,
Christian Geletneky
,
Christian Geletneky


Abstract
Objectives
An isotope dilution liquid chromatography-tandem mass spectrometry (ID-LC-MS/MS)-based candidate reference measurement procedure (RMP) was developed and validated to accurately measure serum and plasma concentrations of carbamazepine.
Methods
Quantitative nuclear magnetic resonance (qNMR) spectroscopy was used to determine the absolute content of the reference material, ensuring its traceability to SI units. The separation of carbamazepine from potential interferences, whether known or unknown, was achieved using a C18 column. A protein precipitation protocol followed by a high dilution step was established for sample preparation. Assay validation and determination of measurement uncertainty were performed in accordance with the guidelines of the Clinical and Laboratory Standards Institute, the International Conference on Harmonization (ICH), and the Guide to the Expression of Uncertainty in Measurement (GUM). In order to demonstrate equivalence to the already existing RMP a method comparison study was performed.
Results
The RMP was proven to be highly selective and specific with no evidence of a matrix effect, allowing for quantification of carbamazepine within the range of 0.800–18.0 μg/mL. Intermediate precision and repeatability (n=60 measurements) was found to be <1.6 % and <1.3 % over all concentration levels and independent from the matrix. The relative mean bias ranged from −0.1 to 0.6 % for native serum and from −0.3 to −0.1 % for Li-heparin plasma levels. The measurement uncertainties for single measurements and target value assignment were found to be <1.8 % and <1.3 %, respectively. Method comparison showed a good agreement between the Joint Committee of Traceability in Laboratory Medicine (JCTLM) listed RMP and the candidate RMP resulting in a Passing–Bablok regression equation with a slope of 1.01 and an intercept of −0.01. The bias in the patient cohort was found to be 0.9 %.
Conclusions
We present a novel LC-MS/MS-based candidate RMP for carbamazepine in human serum and plasma which provides a traceable and reliable platform for the standardization of routine assays and evaluation of clinically relevant samples.
Introduction
Carbamazepine (C15H12N2O, molecular weight=236.3 Da, conversion factor to molar unit [µmol/mL]=4.2) is an iminostilbene derivate that is used as an anticonvulsive drug as well as to treat mania. Like other iminostilbene derivatives, carbamazepine protects from neuralgia, partial epilepsy, generalized tonic-clonic seizures, and simple and complex partial seizures by inhibiting the sodium channel [1]. It was first marketed as Tegretol® in 1963 and has since been widely used as an anticonvulsive. The generally accepted therapeutic range to treat epilepsy is between 4.00 and 12.0 μg/mL [2]. Values exceeding 20.0 μg/mL are linked to side effects such as double vision, dizziness, tiredness, and ataxia [3]. However, Schneider H. showed that inter-individually gross side effects already occurred at lower levels (11.6 ± 4.3 μg/mL) and that the limit between tolerance and side effects is narrow and highly dependent on the individual [4]. According to the consensus guidance on neuropsycopharmacology therapeutic drug monitoring (TDM) carbamazepine is considered a category 1 drug, with a strong TDM recommendation [2]. Hence, TDM should be applied always to achieve the best possible therapeutic result and to avoid the aforementioned problematic side effects.
Carbamazepine induces its own metabolism by the cytochrome P450 system and is oxidized to carbamazepine-10,11-epoxide, which is further converted to 10,11-dihydro-10,11-dihydroxycarbamazepine [5]. While carbamazepine-10,11-epoxide shows similar therapeutic effects as carbamazepine, 10,11-dihydro-10,11-dihydroxycarbamazepine does not have any clinical significance. Carbamazepine-10,11-epoxide occurs in concentrations of about 20 to 25 % of the parent drug [6] but may increase significantly (up to 50 %) when carbamazepine is administered with other antiepileptic drugs [7]. The half-life of carbamazepine is reduced by primidone and phenobarbital, since they induce the enzymatic metabolism of carbamazepine (the half-life time decreases from a range of 18–65 h to a range of 10–20 h). Consequently, the concentration of carbamazepine-10,11-epoxide increases [8]. On the other hand, drugs like valproic acid or lamotrigine inhibit the epoxide hydrolase leading to an accumulation of carbamazepine-10,11-epoxide [8], [9], [10], [11]. All these effects add to the problematic dosing of carbamazepine and warrants the therapy guidance via TDM. In addition, since carbamazepine-10,11-epoxide triggers similar side effects as its parent drug, the sole TDM of carbamazepine is not a reliable indicator of clinical toxicity [12] and therefore the ratio of the metabolite and the parent drug represents a great challenge in the optimal medication of carbamazepine [13, 14].
Currently, most of the laboratories are using immunoassay-based methods to measure carbamazepine. Some of them are specifically measuring carbamazepine itself without its bioactive epoxide metabolite, some do show unclear cross reactivities to this metabolite [15]. In addition, immunoassays are described to be affected by cross-reactivity to other metabolites, endogenous compounds, or drugs leading to false positive or negative results [13, 14]. Therefore, methods using analytical separation techniques such as liquid or gas chromatography are preferable as they are able to separate the two substances and analyze them simultaneously. There are several methods published up to date that use chromatographic separation techniques [16], [17], [18], [19], [20], [21], [22]. Although, these methods improve specificity and selectivity, they lack metrological traceability to the highest order. Moreover, some of these methods do not consider metabolites such as 10,11-dihydro-10,11-dihydroxycarbamazepine and 10,11-dihydro-10-hydroxycarbamazepine [18, 20, 21] which may interfere with measurements due to thermal fragmentation at high temperatures in the ion source [23].
Methods that are free of systematic errors (measurement bias) and are traceable to a higher reference material are urgently needed to help harmonize and standardize routine assays. Therefore, reference measurement procedures (RMPs) play an important role in reducing inter-laboratory and intra-assay variability by having these characteristics. The total error (measurement uncertainty) of RMPs must be well below the allowable measurement uncertainty of routine methods. The suggested goal of RMPs is to contribute less than one-third of the routine error in order to have a sufficient error propagation reserve as outlined by Braga and Panteghini [24].
Currently, there is one high purity material from the Health Sciences Authority (HSA) Singapore (HRM-1016A) and one LC-MS/MS based RMP published by Taibon et al. (C14RMP5) listed in the JCTLM database [25, 26]. Since the primary reference material was not available at the time of this project, the reference material used in this study was characterized by qNMR spectroscopy. qNMR has emerged as a potent technique for the determination of mass fraction (g/g) of analytes owing to the ease of workflow, absolute linearity of the detector to the amount of the analyte, non-destructive nature and the easy availability of higher order qNMR internal standards which are directly traceable to the kilogram (kg) via NIST Benzoic acid 350b or NIST PS1 (primary qNMR standard) [27], [28], [29]. These commercially available qNMR internal standards are available from SigmaAldrich (TraceCert Standards) and from Wako (TraceSure standards). Therefore, the quantitative information from NMR not only ensures the identity of the molecule but also unparalleled traceability; thus, it is gaining by leaps and bounds over traditional quantification techniques for primary reference standards, such as the combined approach involving LC/GC-MS, Karl-Fischer, elemental analysis and IR, etc. Metrological institutes like NIST, NMIA, NMIJ, BIPM and pharmacopoeial monographs from USP are adapting to qNMR spectroscopy for the characterization of primary reference standards. Additionally, as per the latest IUPAC technical report, qNMR methodology can be utilized to produce primary reference materials [30].
The JCTLM listed RMP is a multi-analyte method allowing the measurement of carbamazepine and its metabolites carbamazepine-10,11-epoxide and 10-hydroxy-10,11-dihydrocarbamazepine. The measurement uncertainty (k=1) for the target value assignment of carbamazepine, which was carried out based on multiple measurements, was <3.7 %, which is comparable to the acceptable imprecision for carbamazepine using the mid-dosing interval pharmacokinetic approach by Fraser (4.1 %) [26, 31]. Using the Glick and Burnett approaches, the maximum allowable imprecision is 6.7 and 5.6 %, respectively [31]. However, considering the before mentioned approach by Braga and Panteghini the maximum acceptable measurement uncertainty for an RMP should be between 1.4 and 2.3 %.
Herein, we outline a modernized single analyte candidate RMP for carbamazepine which is equivalent to the already listed RMP but additionally meets the higher requirements on measurement uncertainty as described above. Details of the candidate RMP are described in three supplementary documents, focusing on the technical implementation of the test procedure, qNMR-based characterization of the reference material, and the calculation of measurement uncertainty.
Materials and methods
A detailed description on the test procedure methodology can be found in the Supplemental Material 1.
Chemicals and reagents
LC-MS grade methanol (CAS 67-56-1) and formic acid were (CAS 64-18-6) purchased from Biosolve (Valkenswaard, The Netherlands). CD3OD (CAS 811-98-3, ACS reagent, ≥99.95 %), ammonium acetate (CAS 631-61-8, LC/MS grade), carbamazepine (CAS 298-46-4, Art. No. PHR1067, Lot No. LRAC1961) and tecnazene (CAS 117-18-0, Art. No. 40384, Lot No. BCBW6288) were purchased from Sigma Aldrich (Taufkirchen, Germany). Isopropanol (HPLC grade) was bought from Riedel-de Haën (Seelze, Germany). The internal standard (ISTD) [2H8]-carbamazepine (CAS 1538624-35-9, Art. No. TRCC175844-1mg, Lot No. 24-MVI-44-1, Purity 96 %) was purchased from Brunschwig AG (Basel, Switzerland) and 10,11-dihydro-10,11-dihydroxycarbamazepine (CAS 58955-93-4, Art. No. D449040, Lot No. 1-NWW-177-2) was bought from TRC Canada (North York, Canada). Carbamazepine-10,11-epoxide (CAS 36507-30-9, Art. No. MM0076.01, Lot Nr. W988078) was bought from LGC Mikromol (Teddington, UK). 10,11-dihydro-10-hydroxycarbamazepine (CAS 29331-92-8, Art. No. 18467, Lot No. 0489614) was purchased from Cayman (Ann Arbor, Michigan US). 5 mm NMR tubes were obtained from Eurisotop GmbH (Hadfield, United Kingdom). Native human serum (Art. No. S1-Liter) was obtained from Merck (Darmstadt, Germany), TDM-free human serum (multi-individual pooled; surrogate matrix, ID No. 12095432001) from Roche Diagnostics GmbH (Mannheim, Germany). Native plasma matrix (Li-heparin, K2-EDTA and K3-EDTA) was obtained from anonymized, leftover patient samples and pools were prepared in accordance with the Declaration of Helsinki. Water was purified using a Millipore Milli Q 3 UV system from Merck (Darmstadt, Germany).
General requirements for laboratory equipment
Equipment was certified and calibrated by ISO-accredited calibration laboratories. The minimum sample weight for the microbalance used (XPR2, Mettler Toledo, Columbus, OH, USA) was determined according to the United States Pharmacopeial Convention (USP) guidelines (USP Chapters 41 and 1251). Direct displacement pipettes were used to measure organic solvents and serum. Volumetric glassware (Class A volumetric flasks) that fulfilled the criteria of ISO 1042 and USP were used to prepare stock and spike solutions.
qNMR for determination of the purity of the standard materials
qNMR experiments were performed on a Jeol 600 MHz NMR (Jeol Ltd, Tokyo, Japan) equipped with a Helium-cryoprobe head. For carbamazepine, single-pulse-1H{13C}NMR was utilized for the quantitation (olefinic protons; δ=6.96 ppm; 2H; tecnazene as qNMR internal standard; CD3OD as solvent) with an inter-scan delay of 70 s (Supplemental Figure 1). These protons were selected as the quantifiable resonance for carbamazepine because they are clearly separated, by δ=1 ppm, from the Dibenz[b,f]azepine which is commonly utilized for the synthesis of carbamazepine [32], therefore, even the hypothetical presence of Dibenz[b,f]azepine does not interfere with our qNMR methodology. Six individual experiments involving six individual weightings of analyte and internal standard were performed for the quantification of the absolute content of carbamazepine.
Further details about NMR acquisition and processing parameters are available in the Supplemental Material 2.
Preparation of calibrators and quality control samples
Two independent calibrator stock solutions were prepared by weighing 25 mg of carbamazepine in tin boats on a microbalance (XPR2, Mettler Toledo, Columbus, Ohio, USA) and dissolving in 5 mL DMSO using volumetric flasks. The concentrations of the stock solutions were calculated considering the purity of the reference material determined by qNMR (99.6 ± 0.2 %) and the amount weighed in, resulting in stock solutions with concentrations of 5.00 mg/mL. These stock solutions were further diluted with DMSO to prepare working solutions, which were used together with the stock solutions to prepare eight calibrator spike solutions. Final matrix-based calibrators, uniformly distributed from 0.800 to 18.0 μg/mL (3.39 to 76.2 μmol/L), were then prepared by a volumetric 1+99 dilution (v/v) of the calibrator spike solutions in human serum matrix.
Four levels of matrix-based quality control (QC) levels were prepared in the same manner as described for the calibrator levels using a third independent stock solution. The concentrations for the control levels were set at four critical control points: above the lower limit of quantitation, below and within the therapeutic reference range and at the laboratory alert level. The final concentrations of the QC levels were 1.20, 3.60, 8.00 and 16.0 μg/mL.
ISTD stock solution
For the preparation of the [2H8]-carbamazepine ISTD stock solution, 1 mg was dissolved by volumetric addition of DMSO to obtain an ISTD stock solution with a concentration of 1,000 μg/mL. The ISTD stock solution was stored at −20 °C until further use. An ISTD working solution was freshly prepared by a two-fold dilution of the ISTD stock solution prior each sample preparation. Therefore, 168 µL of DMSO was mixed with 32 µL of [2H8]-carbamazepine ISTD stock solution, followed by the addition of 7,800 µL Milli-Q water to obtain a final concentration of 4.00 μg/mL.
Sample preparation
Native human serum, TDM-free serum (surrogate serum), and plasma (Li-heparin, K2-EDTA, and K3-EDTA) were used as sample matrix. 100 µL of the ISTD working solution was pipetted into a 2 mL tube (Eppendorf Safe-Lock Tubes). This was followed by the addition of 50 µL of the sample specimen (native sample/calibrator/QC) was added. For protein precipitation, 1,000 µL 75 % methanol (v/v) was added. After centrifugation, a 50 µL aliquot of the supernatant was diluted 1+19 (v/v) with Milli-Q-water. This diluted solution was then further diluted with Milli-Q water in a second dilution step (1+39 [v/v]).
Liquid chromatography mass spectrometry
Chromatographic separation was performed on an Agilent 1290 Infinity II LC system (Santa Clara, CA, USA) equipped with a binary pump, a vacuum degasser, an autosampler at 7 °C, and a column compartment kept at 40 °C.
Carbamazepine and its main metabolite carbamazepine-10,11-epoxide as well as secondary metabolites (10,11-dihydro-10-hydroxycarbamazepine and 10,11-dihydro-10,11-dihydroxycarbamazepine) were separated using an Agilent Zorbax Eclipse XDB-C18 column (100 × 3 mm, 3.5 µm, Santa Clara, CA, USA). The mobile phases were composed of 2 mM ammonium acetate in Milli-Q water with 0.1 % formic acid (A) and methanol/2 mM ammonium acetate in Milli-Q-water 95+5 (v/v) with 0.1 % formic acid (B). The measurements were performed using a gradient with a total run time of 9 min at a flow rate of 0.6 mL/min. Contamination of the mass spectrometer was reduced using a divert valve, switching the eluent flow until 0.5 min and from 6.0 min to the waste.
Carbamazepine was detected in multiple reaction monitoring (MRM) mode using either an AB Sciex Triple Quad 6500+ (for method comparison study) or a Q-Trap 6500+ mass spectrometer (for validation experiments) (Framingham, Massachusetts, USA) with a Turbo V ion source operating in positive electrospray ionization mode (ESI + mode). For both systems the same settings were used. An ion spray voltage of 5,000 V and a temperature of 400 °C were applied. Nitrogen was used as curtain gas, collision gas, ion gas source 1, and ion gas source 2 and was set at 45, 11, 50, and 60 psi, respectively. For all analytes the collision cell entrance potential was set at 10 V and the collision cell exit potential at 15 V. A second specific mass transition (qualifier) was monitored to exclude interfering substances in native matrix samples by comparing the quantifier/qualifier ratios of neat System Suitability Test (SST) and native matrix samples. The ratios should not differ by more than 20 %. Table 1 provides an overview of the single reaction monitoring (SRM) transitions and MS settings.
MS/MS parameters of carbamazepine and its ISTD.
| Analyte | Precursor ion, m/z | Product ion, m/z | Dwell time, ms | DP, V | CE, V | |
|---|---|---|---|---|---|---|
| Carbamazepine | Quantifier | 237.1 | 194.1 | 20 | 86 | 31 |
| Qualifier | 165.1 | 20 | 86 | 65 | ||
| [2H8]-carbamazepine | Quantifier | 245.1 | 202.1 | 20 | 86 | 31 |
| Qualifier | 172.1 | 20 | 86 | 65 |
-
DP, declustering potential; CE, collision energy; ISTD, internal standard; V, volts.
System suitability test
Prior to each analysis, an SST was performed to check the sensitivity of the system, chromatographic performance, and potential carry-over. Data may only be collected if the SST has been passed. Therefore, a SST stock solution (1,000 mg/mL carbamazepine in DMSO) was freshly diluted with mobile phase A to get two samples (SST sample 1 and 2) with concentrations corresponding to the processed calibrator level 1 and 8. To pass the SST, signal-to-noise of the quantifier transition had to be ≥10 for SST sample 1. The retention time of both SST samples had to be within 3.9 ± 0.5 min. Moreover, the carry-over effect was examined by injecting SST sample 2 followed by the injection of two solvent blanks. The analyte peak area observed in the blank after the SST sample 2 injection had to be ≤20 % of the analyte peak area of the calibrator 1 level.
Calibration, structure of analytical series and data processing
The final calibration function was generated by measuring the calibration levels in increasing concentration at the beginning and the end of the analytical series. Carbamazepine was calibrated using a linear regression model (y=ax + b) by plotting the analyte and ISTD area ratios (y) against the analyte concentration (x). Data processing was performed using Analyst® software (version 1.6.3 or higher) with the IntelliQuant algorithm. Carbamazepine and [2H8]-carbamazepine peaks showed a retention time of 3.9 min and were integrated within a 30 s window. Peak integration included a smoothing factor of 7 and a peak and splitting factor of 5. The noise percentage was set to 80 % with a base sub-window of 0.8 min.
Method validation
Assay validation and determination of measurement uncertainty were performed based to existing validation guidelines such as Clinical & Laboratory Standards Institute’s C62A Liquid Chromatography-Mass Spectrometry Methods [33], the ICH guidance document Harmonised Tripartite Guideline Validation of Analytical Procedures: Text and Methodology Q2 (R1) [34] and the GUM [35]. Further details are published in Taibon et al. [36].
Selectivity
Baseline separation of the analyte and the metabolites was evaluated by spiking carbamazepine, carbamazepine-10,11-epoxide (m/z 253.1 to 180.1), 10,11-dihydro-10-hydroxycarbamazepine (m/z 255.0 to 194.1), and 10,11-dihydro-10,11-dihydroxycarbamazepine (m/z 271.1 to 180.1) into analyte-free human serum, surrogate serum, and Li-heparin plasma to a concentration of each 4.00 μg/mL. Moreover, analyte free matrices were checked for possible interferences at the expected retention time of the analyte.
To evaluate possible amounts of residual unlabeled analyte within the deuterated ISTD analyte-free matrices were spiked with ISTD. The amount of unlabeled analyte in the ISTD must not exceed 20 % of the amount of the lower limit of the measuring interval (LLMI), which corresponds to the lowest calibrator level.
Matrix effects and specificity
In a qualitative post-column infusion setting a 10 ng/mL neat solution of carbamazepine was infused into the HPLC column effluent with a flow rate of 7 μL/min. Then, processed matrix samples (native human serum, surrogate serum, and native plasma [Li-heparin, K2-EDTA, and K3-EDTA]) were injected. Any decrease or increase at the expected retention time would indicate a matrix component mediated effect on the ionization.
In a quantitative matrix effect (ME) experiment, calibration curves in different sample matrices (neat solution [Milli-Q-water], native human serum, surrogate serum, and native Li-heparin plasma) were compared in terms of slopes and coefficients of determination (n=6, sample preparations) [37]. To exclude MEs the confidence intervals (CI) of the slopes must overlap and the coefficients of determination must be ≥0.99. Calibrator samples in surrogate matrix, native serum and plasma were additionally evaluated as controls by applying the neat calibrator levels as standards. Recoveries were reported as the percentage recovery of the measured concentration relative to the nominal concentration.
Furthermore, a comparison of the absolute areas of the analyte and ISTD was performed [38]. The analyte and ISTD solutions were spiked after protein precipitation into neat solution, native human serum, surrogate serum, and native Li-heparin plasma for three levels (3.60, 8.00, and 16.0 μg/mL) over the working range. All samples were prepared in five replicates. The peak areas of the analyte and ISTD of the matrix samples were compared to the neat samples. The presence of ion enhancement (values >100 %) or suppression (values <100 %) was evaluated and the percentage deviation was expected to be within the range of 100 ± 10 %.
Linearity
The linearity of the method was determined for an extended calibration range of ±20 % at the lower and upper end of the measuring range in native human serum. Therefore, two additional calibrator levels were prepared (0.640 and 21.6 μg/mL). The coefficients of determination and the residuals were determined for each calibration line (n=6, sample preparations) and had to be ≥0.99 and randomly distributed.
In addition, the recovery and linear relationship of serially diluted samples were used to demonstrate the linearity. Therefore, calibrator level 1 was mixed with calibrator level 8 to obtain nine additional samples as follows: 9+1 (v/v), 8+2 (v/v), 7+3 (v/v), 6+4 (v/v), 5+5 (v/v), 4+6 (v/v), 3+7 (v/v), 2+8 (v/v), and 1+9 (v/v). Measurement results must show a linear dependency with a coefficient of determination of ≥0.99. Recovery was reported as the percentage of recovery of the measured concentration relative to the nominal concentration of the sample pools.
Lower limit of the measuring interval and limit of detection
Native human serum samples spiked at the lower limit of the measuring interval were prepared. The LLMI corresponded to the lowest calibrator level (0.800 μg/mL). Samples were prepared in five replicates and the recovery, bias, and precision were determined and required to fall within the ranges defined in the accuracy and precision experiment.
For the estimation of the limit of detection (LOD), the approach of Armbruster et al. was used and the limit of blank was calculated using 10 independent matrix blank samples as follows: LOB=meanblank + 1.645(SDblank). The LOD was then estimated using 10 replicates of calibrator level 1, which was used as the low concentration sample: LOD=LOB + 1.645(SDlow concentration sample) [39].
Precision and accuracy
A five-day validation experiment previously described in Taibon et al. [36], was performed to evaluate precision and accuracy of the developed methods. Total variability of the method including between-injection variability, between-preparation variability, between-calibration variability and between-day variability was estimated performing an ANOVA-based variance component analysis.
In brief, four spiked native serum and native Li-heparin plasma samples covering the measuring range (1.20, 3.60, 8.00 and 16.0 μg/mL) as well as two native patient serum samples were prepared over five days in triplicate for part A and B and injected twice (n=12 measurements per day and n=60 measurements per 5 days). For each part an independent calibration curve was generated and used for quantitative analysis. Since the measurements had to be carried out under varying conditions one operator was responsible for sample preparation for parts A and B, respectively. In addition, two different column batches were used. Data evaluation was done using Biowarp, an internal statistic program based on the VCA Roche Open-Source software package in R [40].
Accuracy was assessed using four spiked human serum and plasma samples (1.20, 3.60, 8.00 and 16.0 μg/mL). Moreover, dilution integrity was performed using two spiked serum samples at the concentration levels of 20.0 and 24.0 μg/mL (dilution 1 and 2). All samples were prepared in triplicates for each part A and part B (n=6, sample preparations) on one day. Accuracy was determined as the percentage of recovery of the measured concentration relative to the spiked concentration.
Sample stability
The stability of processed native serum samples was investigated at 7 °C. Therefore, samples were re-measured after 7 days of storage and were compared to freshly prepared spiked serum samples. Stability of frozen native serum calibrators and QC material stored at −20 °C was investigated after 35 days. Recoveries were calculated by comparing the measured value with freshly prepared serum samples. As acceptance criteria the Total Error (TE) was used and set to a TE of ±5 %. Stability can be guaranteed for a measurement interval of 2 to 28 days (x) for x−1 day, and for a measurement interval of >4 weeks (y) for y−1 week.
Equivalence of results between the JCTLM listed RMP and the candidate RMP
To show equivalence to the already existing RMP from Taibon et al. [26], a method comparison study with a total of 126 samples was performed at site 1 (Dr. Risch Ostschweiz AG, Buchs, Switzerland) and site 2 (Roche Diagnostics GmbH, Penzberg, Germany). Therefore, the JCTLM listed method was set up at site 1 and the newly developed RMP was transferred to site 2. Both laboratories generated their own calibration curves based on their respective protocols using carbamazepine characterized by qNMR as the reference material.
In addition, a 3 day precision experiment was performed at site 2 using the same system setup with following modifications: an ultra-microbalance XP6U/M (Mettler Toledo) and aluminum weighing boats were used for the preparation of stock solutions.
Uncertainty of measurements
Measurement uncertainty was determined according to the GUM [35] and Taibon et al. [36]. For the estimation of combined measurement uncertainty following uncertainty estimates were included: uncertainty of the qNMR target assignment of reference material, calibration material preparation, and LC-MS/MS method. A detailed description is provided in Supplemental Material 3.
Results
Traceability to SI units
Traceability to the SI unit of mass (kilogram), the most important parameter for a reference measurement method, has been established by the utilization of tecnazene as a qNMR internal standard. Tecnazene is a TraceCert CRM qNMR internal standard produced by SigmaAldrich which is directly traceable to the NIST PS1 (primary qNMR standard developed by NIST) as per the certificate of analysis attached with specific batch numbers. Furthermore, traceability to the SI unit of amount of substance (mole) is also included owing to NIST PS1, clearly mentioned by NIST in their publication about NIST PS1 [29]. Since Planckʼs constant is now the main parameter for defining kilogram and Avogadro’s constant for mole, qNMR methodology is best suited to fulfill both the traceability chains. Additionally, as per the latest IUPAC technical report qNMR has been stated as a potential primary reference measurement procedure ideally suited for the characterization of primary reference materials [30]. As per our aforementioned qNMR methodology, six individual experiments (Supplemental Figure 2) involving six individual weightings, yield a final target absolute content value of 99.6 ± 0.2 % (k=1; Supplemental Table 1 and Figure 2). The expanded uncertainty, k=2, can be obtained by multiplying the above mentioned uncertainty with a coverage factor of 2.
Selectivity
Baseline separation of carbamazepine (eluting at 3.8 min) and its enzymatically mono- and dioxidated metabolites carbamazepine-10,11-epoxide, 10,11-dihydro-10-hydroxycarbamazepine, and 10,11-dihydro-10,11-dihydroxycarbamazepine was achieved on a reversed phase column (Agilent Zorbax Eclipse XDB-C18) showing resolutions greater than 10.0 in all matrices tested (see Figure 1). Moreover, the chromatogram of different matrices (pools of analyte-free native human serum, surrogate serum, and human Li-heparin plasma) showed no signals at the expected retention time of carbamazepine. The tested ISTD did not contain any unlabeled analyte and is therefore suitable for the intended use (see Figure 2).

LC-MS/MS read outs of a native human serum sample containing 4.00 μg/mL of each carbamazepine (peak 1), carb ama zepine-10,11-epoxide (peak 2), 10,11-dihydro-10-hydroxycarbamazepine (peak 3), and 10,11-dihydro-10,11-dihydroxycarbamazepine (peak 4). SRM ion traces of (A) carbamazepine (peak 1); peak 5 demonstrates the in-source dehydration of 10,11-dihydro-10-hydroxycarbamazepine to carbamazepine. (B) Carbamazepine-10,11-epoxide (peak 2); peak 6 shows in-source dehydration of 10,11-dihydro-10,11-Dihydroxycarbamazepine to oxcarbazepine. (C) 10,11-Dihydro-10-hydroxycarbamazepine. (D) 10,11-Dihydro-10,11-dihydroxycarbamazepine.
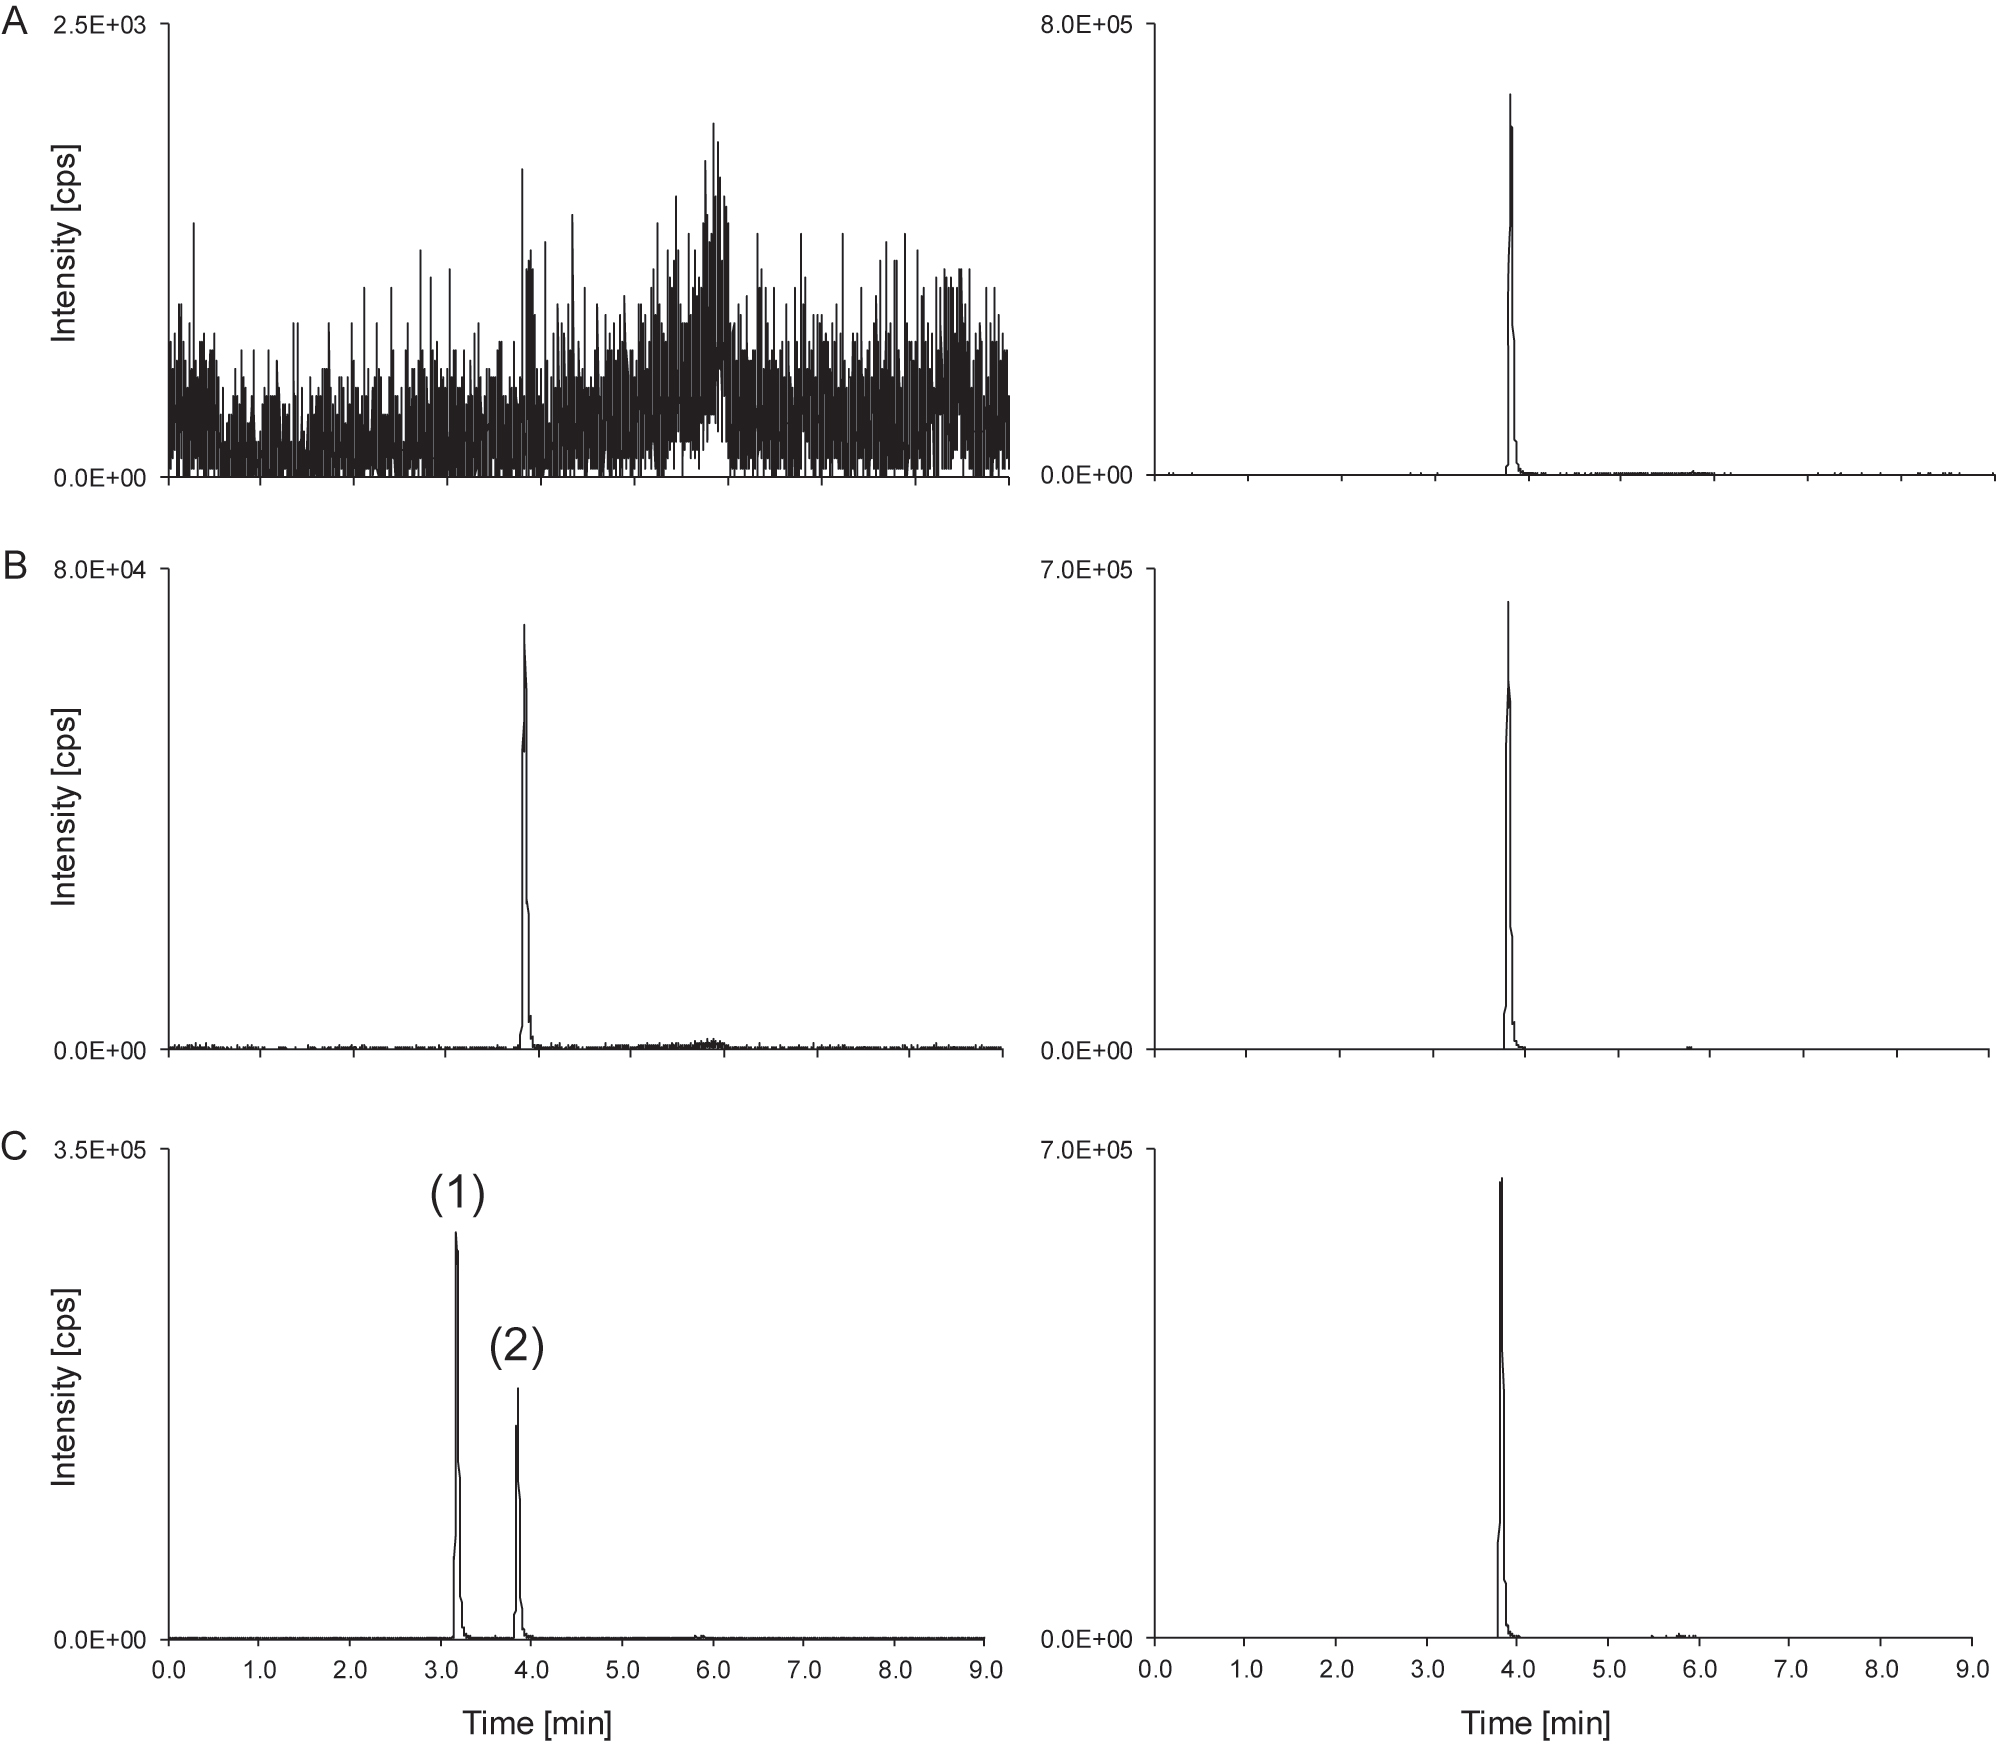
Carbamazepine LC-MS/MS derived analytical readouts. (A) Chromatogram of a matrix blank showing the analyte SRM ion trace (left) and the ISTD SRM ion trace (right). (B) Chromatogram of the lowest calibrator level with a concentration of 0.800 μg/mL carbamazepine spiked in native serum; analyte (left) and ISTD (right). (C) Patient sample with a concentration of 1.97 μg/mL, showing peaks of carbamazepine (peak 2) and the in-source dehydration of 10,11-dihydro-10-hydroxycarbamazepine to carbamazepine (peak 1); analyte (left) and ISTD (right). ISTD, internal standard.
When measuring patient samples, the carbamazepine ion traces show additional peaks at the retention time of the metabolite 10,11-dihydro-10-hydroxycarbamazepine (Figure 1). This signal can be attributed to the in-source water loss of 10,11-dihydro-10-hydroxycarbamazepine to carbamazepine (Figure 3) as previously reported in GC-MS and LC-MS [23, 41, 42]. If not separated chromatographically from carbamazepine, the contribution of this instrumental artefact would lead to an overestimation of the carbamazepine sample concentration. Hence, chromatographic separation of carbamazepine from its oxidized metabolite 10,11-dihydro-10-hydroxycarbamazepine is a necessity of any diagnostic method and consequently also an RMP to guarantee an accurate quantification of carbamazepine (Figure 2).

Schematic overview of the in-source dehydration of 10,11-dihydro-10-hydroxycarbamazepine to carbamazepine.
Matrix effect and specificity
Matrix dependent effects were avoided by a sample preparation protocol with a high dilution after protein precipitation. This was demonstrated by the post-column infusion experiments as no change in the ionization field was observed at the expected retention times in native human serum, surrogate serum, and native plasma matrices (Li-heparin, K2-EDTA and K3-EDTA plasma).
In addition, MEs were investigated by comparing slopes and coefficients of determination of calibration curves in different matrices. The carbamazepine calibration showed slopes (n=6, sample preparations) of 0.334 (95% CI 0.331 to 0.338) for neat solution, 0.337 (95% CI 0.335 to 0.339) for native serum, 0.336 (95% CI 0.335 to 0.338) for surrogate serum, and 0.338 (95% CI 0.336 to 0.340) for native Li-heparin plasma. The coefficients of determination were 1.00 regardless of the matrix used for calibration. The 95% CIs of the slopes overlap, which leads to the assumption that they are not significantly different. Furthermore, matrix-based samples were evaluated against neat calibrators as standards. Relative bias for all matrices ranged from −1.6 to 1.5 % (n=6, sample preparations) with CVs of ≤2.9 %.
The absence of any MEs was further proven comparing analyte peak areas, ISTD peak areas as well as area ratios of spiked serum samples with spiked neat samples. Mean peak areas ranged from 96 to 100 % for carbamazepine and [2H8]-carbamazepine in all tested matrices. The corresponding area ratios were between 98 and 101 % (Table 2). Hence, the absence of a ME can be confirmed.
Matrix effect data of carbamazepine of three different matrices compared to neat analyte solution. Analyte peak areas, ISTD peak areas, and analyte/ISTD area ratios as used in analyte quantification were investigated. Means from five-fold analysis were used as data input. The relative matrix effect (ME) was calculated as ME (%)=set 2/set 1 × 100, where set 2 corresponds to the respective matrix samples and set 1 to the neat samples. No matrix effect is present if ME=100 %.
| Carbamazepine conc., µg/mL | Analyte | ISTD | Ratio | ||||
|---|---|---|---|---|---|---|---|
| Mean, % | 95% CI, % | Mean, % | 95% CI, % | Mean, % | 95% CI, % | ||
|
Level 1 3.60 μg/mL |
Native serum | 96 | 95 to 97 | 97 | 96 to 98 | 99 | 98 to 100 |
| Surrogate serum | 97 | 95 to 99 | 97 | 95 to 99 | 99 | 98 to 101 | |
| Native plasma | 97 | 96 to 98 | 96 | 96 to 97 | 100 | 99 to 101 | |
|
Level 2 8.00 μg/mL |
Native serum | 96 | 92 to 100 | 98 | 96 to 99 | 98 | 94 to 102 |
| Surrogate serum | 99 | 97 to 100 | 98 | 97 to 99 | 101 | 99 to 102 | |
| Native plasma | 96 | 94 to 97 | 97 | 96 to 98 | 99 | 97 to 100 | |
|
Level 3 16.0 μg/mL |
Native serum | 100 | 97 to 102 | 99 | 97 to 100 | 101 | 98 to 105 |
| Surrogate serum | 100 | 96 to 103 | 100 | 99 to 100 | 100 | 97 to 104 | |
| Native plasma | 100 | 97 to 103 | 99 | 98 to 100 | 101 | 97 to 105 | |
-
CI, confidence interval; ISTD, internal standard; ME, matrix effect.
Linearity
Linearity was demonstrated by analyzing six native serum calibration curves with an extended measuring range of 20 % at both lower and higher concentrations, resulting in a measuring range from 0.640 to 21.6 μg/mL. The residuals of carbamazepine were randomly distributed in a linear regression model and the correlation coefficient was 1.00 for all individual calibration curves.
Based on the selected regression model, the dilution series was evaluated and showed a linear dependence with a correlation coefficient of 1.00. The relative deviation (n=6, sample preparations) ranged from −1.2 to 3.2 % with a CV of ≤1.7 %.
Lower limit of the measuring interval and limit of detection
The LLMI was determined using samples spiked with the concentration of the lowest calibrator concentration (0.800 μg/mL). The relative bias showed a deviation of −0.4 % and the CV was 1.0 %. The LOD of carbamazepine was estimated to be 0.115 μg/mL.
Precision and accuracy
Precision was evaluated in a multi-day validation experiment using spiked (low, mid, high) and native samples in the therapeutic range. Two different operators prepared each level in triplicate on one day over five different days and the samples were injected twice (n=60, measurements). To assess the overall variability of the methods variability components as between injections, between preparations, between calibrations, and between days were determined using an ANOVA-based variance component analysis. Intermediate precision CV was found to be ≤1.6 % and repeatability CV ranged from 0.8 to 1.3 % across all concentration levels and the measurement variability of patient samples was found to be indistinguishable from spiked levels (Table 3).
Precision performance parameters for carbamazepine quantification using the candidate RMP (n=60 measurements).
| Variance source | Serum samples CV, % | |||||
|---|---|---|---|---|---|---|
| Level 1 | Level 2 | Level 3 | Level 4 | Patient sample 1 | Patient sample 2 | |
| 1.20 μg/mL | 3.60 μg/mL | 8.00 μg/mL | 16.0 μg/mL | 4.12 μg/mL | 9.97 μg/mL | |
| Intermediate precision | 1.6 | 1.3 | 1.4 | 1.6 | 1.3 | 1.1 |
| Between-day | 0.7 | 0.4 | 0.9 | 0.6 | 0.7 | 0.4 |
| Between-calibration | 0.5 | 0.8 | 0.6 | 0.8 | 0.6 | 0.6 |
| Repeatability | 1.3 | 0.9 | 0.9 | 1.2 | 0.9 | 0.9 |
| Between-preparation | 0.9 | 0.7 | 0.4 | 0.7 | 0.2 | 0.0 |
| Between-injection | 1.0 | 0.6 | 0.8 | 1.0 | 0.9 | 0.9 |
| Variance source | Plasma samples CV, % | |||
|---|---|---|---|---|
| Level 1 | Level 2 | Level 3 | Level 4 | |
| 1.20 μg/mL | 3.60 μg/mL | 8.00 μg/mL | 16.0 μg/mL | |
| Intermediate precision | 1.6 | 1.6 | 1.3 | 1.2 |
| Between-day | 0.5 | 0.0 | 0.5 | 0.6 |
| Between-calibration | 0.9 | 1.1 | 0.8 | 0.6 |
| Repeatability | 1.1 | 1.1 | 1.0 | 0.8 |
| Between-preparation | 0.3 | 0.0 | 0.5 | 0.4 |
| Between-injection | 1.1 | 1.1 | 0.8 | 0.7 |
-
CV, coefficient of variation; RMP, reference measurement procedure; conversion factor µg/mL to µmol/L: 4.2. The coefficients of variation for repeatability and intermediate precision, which were determined from the individual variances, are printed in bold.
Trueness was demonstrated using spiked serum samples and two high-concentrated native human serum samples (20.0 and 24.0 μg/mL) which were diluted with native human serum prior to the sample preparation. The mean bias (n=6, sample preparations, two operators) of native human serum samples ranged from −0.1 to 0.6 %. Li-heparin plasma samples showed a mean bias between −0.3 and −0.1 %. The mean bias of diluted samples (dilution 1 and 2) ranged from 0.4 to 1.9 % (Table 4).
Bias and 95% CI of native serum and native Li-heparin plasma samples (n=6) of carbamazepine. The mean bias and corresponding confidence intervals were calculated using the individual sample biases of n=6 preparations.
| Concentration, µg/mL | Serum | Plasma | |||
|---|---|---|---|---|---|
| Mean bias, % | 95 % CI, % | Mean bias, % | 95% CI, % | ||
| Level 1 | 1.20 | −0.1 | −0.7 to 0.4 | −0.3 | −1.3 to 0.7 |
| Level 2 | 3.60 | 0.6 | −1.1 to 2.2 | −0.3 | −1.8 to 1.2 |
| Level 3 | 8.00 | 0.3 | −1.1 to 1.6 | −0.1 | −0.7 to 0.5 |
| Level 4 | 16.0 | 0.2 | −1.2 to 1.6 | −0.1 | −0.9 to 0.8 |
| Dilution 1 | 20.0 | 0.4 | −1.0 to 1.7 | – | – |
| Dilution 2 | 24.0 | 1.9 | −0.6 to 4.4 | – | – |
-
CI, confidence interval. Conversion factor µg/mL to µmol/L: 4.2.
Stability
Stability of processed samples at 7 °C was verified for 6 days. The recoveries of processed carbamazepine samples ranged from 101 to 105 %. The stability of spiked calibrator and QC samples stored at −20 °C was shown for 34 days. The recoveries ranged from 100 to 105 %.
Equivalence of results between the JCTLM listed RMP and the candidate RMP
Equivalence to the already existing RMP from Taibon et al. [26] was proven performing a method comparison study with a total of 126 samples, including 62 native serum, 26 native plasma patient samples, 8 native patient pools, and 30 spiked native patient samples. All samples were analyzed at site 1 using the JCTLM listed RMP whereas the newly developed candidate RMP was performed at site 2. The sample preparation of Taibon et al. had to be slightly adjusted due to insufficient sample volume: all volumes used during sample preparation were reduced to three quarters of the original volumes. Two samples were highlighted as outliers using the LORELIA (local reliability) outlier test [43]. These samples were therefore not considered for the method comparison and n=124 samples were evaluated. Passing–Bablok regression analysis showed a good agreement between the JCTLM listed RMP and the candidate RMP and resulted in a regression equation with a slope of 1.01 (95% CI 1.00 to 1.02) and an intercept of −0.01 (95% CI −0.07 to 0.06) (Figure 4A). The Pearson correlation coefficient was found to be ≥0.996. The Bland Altman plot showed a 2S agreement of 7.4 % (lower limit CI interval from −7.6 to −5.3 %, upper limit CI interval from 7.1 to 9.4 %) (Figure 4B). The mean bias in the patient cohort was 0.9 % with a 95% CI interval ranging from 0.3 to 1.6 %.

Results from the patient sample based carbamazepine method comparison study of the JCTLM listed and the modernized RMP. (A) Passing–Bablok regression plot including the Pearson regression analysis for the method comparison study of the RMPs (n=124 samples) resulted in a regression equation with a slope of 1.01 (95 % CI 1.00 to 1.02) and an intercept of −0.01 (95 % CI −0.07 to 0.06). The Pearson correlation value was ≥0.999. (B) Bland–Altman plot for the method comparison study of the RMPs (n=126 samples). The bias was 0.9 % (95 % CI interval from 0.3 to 1.6 %) and the 2S interval of the relative difference was 7.4 % (lower limit CI interval from −7.6 to −5.3 %, upper limit CI interval from 7.1 to 9.4 %).
Additionally, a precision experiment was performed at site 2. The resulting CVs of ≤1.3 % and ≤0.9 % for intermediate precision and repeatability are very good comparable to the results from site 1, showing that the method is transferable and meets the requirements independent of the laboratory equipment or personnel.
Uncertainty of results
Total measurement uncertainties of serum samples for carbamazepine for single measurements and for target value assignment (n=6, three measurements on two days) ranged from 1.4 to 1.8 % and from 1.0 to 1.3 %, respectively, independent of the concentration level of the sample (Table 5 and 6). Consequently, the expanded measurement uncertainties ranged from 2.7 to 3.6 % for single measurements and from 1.9 to 2.6 % for multiple measurements thus meeting the requirements defined in the introduction. The derived combined uncertainty is multiplied by a coverage factor of k=2 to obtain an expanded uncertainty that represents a confidence level of 95 %, assuming normal distribution.
Overview of measurement uncertainty for carbamazepine quantification with the candidate RMP in serum samples for single measurements.
| Level | ||||||
|---|---|---|---|---|---|---|
| Level 1 | Level 2 | Level 3 | Level 4 | Patient sample 1 | Patient sample 2 | |
| 1.20 μg/mL | 3.60 μg/mL | 8.00 μg/mL | 16.0 μg/mL | 4.12 μg/mL | 9.97 μg/mL | |
| Type B uncertainty: | 0.85 | 0.90 | 0.80 | 0.79 | 0.81 | 0.79 |
| calibrator preparation, CV, % | ||||||
| Characterization of reference material | 0.2 | 0.2 | 0.2 | 0.2 | 0.2 | 0.2 |
| Preparation of | ||||||
| Stock solution | 0.31 | 0.31 | 0.31 | 0.31 | 0.31 | 0.31 |
| Working solution | 0.49 | – | – | – | – | – |
| Spike solution | 0.59 | 0.66 | 0.51 | 0.49 | 0.54 | 0.49 |
| Matrix based calibrator | 0.85 | 0.90 | 0.80 | 0.79 | 0.81 | 0.79 |
|
Type A uncertainty:
mean of measurement results, CV, % |
1.6 | 1.3 | 1.4 | 1.6 | 1.3 | 1.1 |
| Measurement uncertainty (k=1), CV, % | 1.8 | 1.6 | 1.6 | 1.8 | 1.5 | 1.4 |
| Expanded measurement uncertainty (k=2), CV, % | 3.6 | 3.2 | 3.2 | 3.5 | 3.0 | 2.7 |
-
CV, coefficient of variation; RMP, reference method procedure. Conversion factor µg/mL to µmol/L: 4.2. The total measurement uncertainty of the whole approach for a single measurement estimated as a combination of the uncertainty of calibrator preparation (type B uncertainty) and uncertainty of the precision experiment (type A uncertainty) are given in bold.
Overview of measurement uncertainty for carbamazepine target value assignment (n=6) with the candidate RMP in serum samples.
| Level | ||||||
|---|---|---|---|---|---|---|
| Level 1 | Level 2 | Level 3 | Level 4 | Patient sample 1 | Patient sample 2 | |
| 1.20 μg/mL | 3.60 μg/mL | 8.00 μg/mL | 16.0 μg/mL | 4.12 μg/mL | 9.97 μg/mL | |
| Type B uncertainty: | 0.85 | 0.90 | 0.80 | 0.79 | 0.81 | 0.79 |
| calibrator preparation, CV, % | ||||||
| Characterization of reference material | 0.2 | 0.2 | 0.2 | 0.2 | 0.2 | 0.2 |
| Preparation of | ||||||
| Stock solution | 0.31 | 0.31 | 0.31 | 0.31 | 0.31 | 0.31 |
| Working solution | 0.49 | – | – | – | – | – |
| Spike solution | 0.59 | 0.66 | 0.51 | 0.49 | 0.54 | 0.49 |
| Matrix based calibrator | 0.85 | 0.90 | 0.80 | 0.79 | 0.81 | 0.79 |
|
Type A uncertainty:
mean of measurement results, CV, % |
0.5 | 0.9 | 1.0 | 0.9 | 0.7 | 0.5 |
| Measurement uncertainty (k=1), CV, % | 1.0 | 1.3 | 1.3 | 1.2 | 1.1 | 1.0 |
| Expanded measurement uncertainty (k=2), CV, % | 2.0 | 2.5 | 2.6 | 2.4 | 2.1 | 1.9 |
-
CV, coefficient of variation; RMP, reference method procedure. Conversion factor µg/mL to µmol/L: 4.2. The total measurement uncertainty of the whole approach for a single measurement estimated as a combination of the uncertainty of calibrator preparation (type B uncertainty) and uncertainty of the precision experiment (type A uncertainty) are given in bold.
Discussion
The focus of this project was the modernization of the already JCTLM listed ID-LC-MS/MS based RMP for the quantification of carbamazepine in human serum and plasma in regard of the characterization of reference material, the preparation of calibrator material, sample handling and the analytical setup as well as the reduction of measurement uncertainty. Consequently we used a qNMR characterized reference material for the establishment of the unbroken traceability chain from the RMP to the SI units (kg and mole). In addition the method was modernized to a single analyte RMP including a new stationary phase, mobile phase composition and gradient, as well as ion source optimization. Optimization of sample preparation included fluid handling, including selection of optimal pipettes; protein precipitation with equilibration times; dilution into the linear range of the MS detector; establishment of an optimal calibration and control scheme; optimized preparation of calibrator and control materials, including pipetting.
The validation study for carbamazepine showed that the developed analytical method meets the requirements for an RMP in terms of sensitivity, selectivity and reproducibility. Furthermore, the absence of MEs was evaluated by a calibration slope comparison in addition to an ion yield attenuation experiment. Based on the described approaches to estimate measurement uncertainty, the proposed measurement uncertainty for an RMP should be between 1.4 and 2.3 %. The change of the method to a single analyte method and the optimized concept for calibrator preparation has reduced measurement uncertainty and thus meet the requirements of the RMP for target value assignment.
The method comparison study between the JCTLM-listed method and the modernized candidate RMP yielded equivalent results with no significant increase in bias. These methods can therefore be used interchangeably depending on the requirements for measurement uncertainty or an additional quantification of the metabolites.
Conclusions
In this paper a modernized LC-MS/MS-based candidate RMP for carbamazepine in human serum and plasma is presented which serves as traceable and reliable platform for the standardization of routine assays and evaluation of clinically relevant samples.
Acknowledgments
We would like to thank Aline Hoffmeister, Monika Kriner, Alexandra Herbik, Marion Deuster and Michael Dedio for their support in selecting and providing samples.
-
Research ethics: All procedures were in accordance with the Helsinki Declaration. All samples used were exclusively anonymized leftover samples.
-
Informed consent: Not applicable.
-
Author contributions: All authors confirmed they have contributed to the intellectual content of this paper and have met the following 4 requirements: (a) significant contributions to the conception and design, acquisition of data, or analysis and interpretation of data; (b) drafting or revising the article for intellectual content; (c) final approval of the published article; and (d) agreement to be accountable for all aspects of the article thus ensuring that questions related to the accuracy or integrity of any part of the article are appropriately investigated and resolved.
-
Competing interests: Tobias Schierscher and Lorenz Risch are employees of Dr. Risch Ostschweiz AG. Linda Salzmann and Christoph Seger were employees of Dr. Risch Ostschweiz AG at the time the study was conducted. Judith Taibon, Neeraj Singh, Martina Bachmann, Andrea Geistanger, and Christian Geletneky are all employees of Roche Diagnostics GmbH. Friederike Bauland is an employee of Chrestos Concept GmbH & Co. KG, (Girardetstraße 1-5, 45131 Essen, Germany) and did the work on behalf of Roche Diagnostics GmbH. All authors have no conflict of interest to declare. Roche employees holding Roche non-voting equity securities (Genussscheine): Judith Taibon, Christian Geletneky, Andrea Geistanger.
-
Research funding: Lorenz Risch with team is a funded cooperation partner of Roche Diagnostics GmbH. Christoph Seger receives a consultant honorarium from Roche Diagnostics GmbH.
-
Data availability: The raw data can be obtained on request from the corresponding author.
References
1. DeLorenzo, RJ. Mechanisms of action of anticonvulsant drugs. Epilepsia 1988;29 (Suppl 2):S35–47. https://doi.org/10.1111/j.1528-1157.1988.tb05796.x.Search in Google Scholar PubMed
2. Hiemke, C, Bergemann, N, Clement, HW, Conca, A, Deckert, J, Domschke, K, et al.. Consensus guidelines for therapeutic drug monitoring in neuropsychopharmacology: update 2017. Pharmacopsychiatry 2018;51:9–62. https://doi.org/10.1055/s-0043-116492.Search in Google Scholar PubMed
3. Reynolds, E. Neurotoxicity of carbamazepine. In: Penry, JK, Daly, DD, editors. Advances in neurology. New York: Raven Press; 1975, vol 11:345–53.Search in Google Scholar
4. Schneider, H. Carbamazepine: an attempt to correlate serum levels with anti-epileptic and side effects. In: Schneider, H, Janz, D, Gardner-Thorpe, C, Meinardi, H, Sherwin, AL, editors. Clinical pharmacology of anti-epileptic drugs. Berlin, Heidelberg: Springer; 1975.10.1007/978-3-642-85921-2Search in Google Scholar
5. Shou, M, Mei, Q, Ettore, MWJr, Dai, R, Baillie, TA, Rushmore, TH. Sigmoidal kinetic model for two co-operative substrate-binding sites in a cytochrome P450 3A4 active site: an example of the metabolism of diazepam and its derivatives. Biochem J 1999;340:845–53. https://doi.org/10.1042/bj3400845.Search in Google Scholar
6. Al-Qudah, AA, Hwang, PA, Giescrecht, E, Soldin, SJ. Contribution of carbamazepine 10,11-epoxide to neurotoxicity in epileptic children on polytherapy. Jordan Med J 1991;25:171–7.Search in Google Scholar
7. Soldin, SJ. Carbamazepine. In Shaw, LM, editor. Contemporary practice in clinical toxicology. Washington, D.C.: AACC Press; 2000:163–6.Search in Google Scholar
8. Rambeck, B, May, T, Juergens, U. Serum concentrations of carbamazepine and its epoxide and diol metabolites in epileptic patients: the influence of dose and comedication. Ther Drug Monit 1987;9:298–303. https://doi.org/10.1097/00007691-198709000-00008.Search in Google Scholar PubMed
9. Warner, T, Patsalos, PN, Prevett, M, Elyas, AA, Duncan, JS. Lamotrigine-induced carbamazepine toxicity: an interaction with carbamazepine-10,11-epoxide. Epilepsy Res 1992;11:147–50. https://doi.org/10.1016/0920-1211(92)90049-y.Search in Google Scholar PubMed
10. Duncan, JS, Patsalos, PN, Shorvon, SD. Effects of discontinuation of phenytoin, carbamazepine, and valproate on concomitant antiepileptic medication. Epilepsia 1991;32:101–15. https://doi.org/10.1111/j.1528-1157.1991.tb05620.x.Search in Google Scholar PubMed
11. Schoeman, JF, Elyas, AA, Brett, EM, Lascelles, PT. Correlation between plasma carbamazepine-10,11-epoxide concentration and drug side-effects in children with epilepsy. Dev Med Child Neurol 1984;26:756–64. https://doi.org/10.1111/j.1469-8749.1984.tb08169.x.Search in Google Scholar PubMed
12. Patsalos, PN, Stephenson, TJ, Krishna, S, Elyas, AA, Lascelles, PT, Wiles, CM. Side-effects induced by carbamazepine-10,11-epoxide. Lancet 1985;2:496. https://doi.org/10.1016/s0140-6736(85)90420-9.Search in Google Scholar PubMed
13. Shen, S, Elin, RJ, Soldin, SJ. Characterization of cross reactivity by carbamazepine 10,11-epoxide with carbamazepine assays. Clin Biochem 2001;34:157–8. https://doi.org/10.1016/s0009-9120(01)00186-2.Search in Google Scholar PubMed
14. Hermida, J, Tutor, JC. How suitable are currently used carbamazepine immunoassays for quantifying carbamazepine-10,11-epoxide in serum samples? Ther Drug Monit 2003;25:384–8. https://doi.org/10.1097/00007691-200306000-00021.Search in Google Scholar PubMed
15. Dasgupta, A, Davis, B, Slawson, MH, Johnson-Davis, KL. Effect of carbamazepine 10, 11-epoxide on serum carbamazepine measurement using a new CMIA assay: comparison of values obtained by using PETINIA, CEDIA and liquid chromatography combined with tandem mass spectrometry. Ann Clin Lab Sci 2016;46:242–6.Search in Google Scholar
16. Yin, L, Wang, T, Shi, M, Zhang, Y, Zhao, X, Yang, Y, et al.. Simultaneous determination of ten antiepileptic drugs in human plasma by liquid chromatography and tandem mass spectrometry with positive/negative ion-switching electrospray ionization and its application in therapeutic drug monitoring. J Separ Sci 2016;39:964–72. https://doi.org/10.1002/jssc.201501067.Search in Google Scholar PubMed
17. Pinto, MAL, de Souza, ID, Queiroz, MEC. Determination of drugs in plasma samples by disposable pipette extraction with C18-BSA phase and liquid chromatography-tandem mass spectrometry. J Pharm Biomed Anal 2017;139:116–24. https://doi.org/10.1016/j.jpba.2017.02.052.Search in Google Scholar PubMed
18. Farouk, F, ElKady, EF, Azzazy, HME. Simultaneous UPLC-MS/MS determination of antiepileptic agents for dose adjustment. Biomed Chromatogr 2017;31:1–9. https://doi.org/10.1002/bmc.3921.Search in Google Scholar PubMed
19. Deeb, S, McKeown, DA, Torrance, HJ, Wylie, FM, Logan, BK, Scott, KS. Simultaneous analysis of 22 antiepileptic drugs in postmortem blood, serum and plasma using LC-MS-MS with a focus on their role in forensic cases. J Anal Toxicol 2014;38:485–94. https://doi.org/10.1093/jat/bku070.Search in Google Scholar PubMed
20. Collins, JA, Janis, GC. Analysis of selected anticonvulsants by high performance liquid chromatography-tandem mass spectrometry. Methods Mol Biol 2012;902:201–9. https://doi.org/10.1007/978-1-61779-934-1_18.Search in Google Scholar PubMed
21. Kim, KB, Seo, KA, Kim, SE, Bae, SK, Kim, DH, Shin, JG. Simple and accurate quantitative analysis of ten antiepileptic drugs in human plasma by liquid chromatography/tandem mass spectrometry. J Pharm Biomed Anal 2011;56:771–7. https://doi.org/10.1016/j.jpba.2011.07.019.Search in Google Scholar PubMed
22. Subramanian, M, Birnbaum, AK, Remmel, RP. High-speed simultaneous determination of nine antiepileptic drugs using liquid chromatography-mass spectrometry. Ther Drug Monit 2008;30:347–56. https://doi.org/10.1097/ftd.0b013e3181678ecb.Search in Google Scholar PubMed
23. Miao, XS, Metcalfe, CD. Determination of carbamazepine and its metabolites in aqueous samples using liquid chromatography-electrospray tandem mass spectrometry. Anal Chem 2003;75:3731–8. https://doi.org/10.1021/ac030082k.Search in Google Scholar PubMed
24. Braga, F, Panteghini, M. The utility of measurement uncertainty in medical laboratories. Clin Chem Lab Med 2020;58:1407–13. https://doi.org/10.1515/cclm-2019-1336.Search in Google Scholar PubMed
25. Bureau International des Poids et Mesures. JCTLM Database:laboratory medicine and in vitro diagnostics [Online]. https://www.jctlmdb.org/#/app/home [Accessed 26 Jul 2023].Search in Google Scholar
26. Taibon, J, Schmid, R, Lucha, S, Pongratz, S, Tarasov, K, Seger, C, et al.. An LC-MS/MS based candidate reference method for the quantification of carbamazepine in human serum. Clin Chim Acta 2017;472:35–40. https://doi.org/10.1016/j.cca.2017.07.013.Search in Google Scholar PubMed
27. Singh, N, Taibon, J, Pongratz, S, Geletneky, C. Absolute content determination by quantitative NMR (qNMR) spectroscopy: a curious case of aldosterone. RSC Adv 2021;11:23627–30. https://doi.org/10.1039/d1ra03472c.Search in Google Scholar PubMed PubMed Central
28. Singh, N, Taibon, J, Pongratz, S, Geletneky, C. Quantitative NMR (qNMR) spectroscopy based investigation of the absolute content, stability and isomerization of 25-hydroxyvitamin D2/D3 and 24(R),25-dihydroxyvitamin D2 in solution phase. Sci Rep 2022;12:3014. https://doi.org/10.1038/s41598-022-06948-4.Search in Google Scholar PubMed PubMed Central
29. Nelson, MA, Waters, JF, Toman, B, Lang, BE, Rück, A, Breitruck, K, et al.. A new realization of SI for organic chemical measurement: NIST PS1 primary standard for quantitative NMR (benzoic acid). Anal Chem 2018;90:10510–7. https://doi.org/10.1021/acs.analchem.8b02575.Search in Google Scholar PubMed PubMed Central
30. Westwood, S, Lippa, K, Shimuzu, Y, Lalerle, B, Saito, T, Duewer, D, et al.. Methods for the SI-traceable value assignment of the purity of organic compounds (IUPAC Technical Report). Pure Appl Chem 2023;95:1–77. https://doi.org/10.1515/pac-2020-0804.Search in Google Scholar
31. Steele, BW, Wang, E, Palomaki, GE, Klee, GG, Elin, RJ, Soldin, SJ, et al.. An evaluation of analytic goals for assays of drugs: a College of American Pathologists therapeutic drug monitoring survey study. Arch Pathol Lab Med 2001;125:729–35. https://doi.org/10.5858/2001-125-0729-aeoagf.Search in Google Scholar PubMed
32. Gutman, D, Baidosse, Q. Process for producing carbamazepine. United States patent 7015322B1; 2006.Search in Google Scholar
33. Clinical and Laboratory Standards Institute (CLSI). C62-A. Liquid chromatography-mass spectrometry methods; approved guideline. CLSI document C62-A. Wayne, PA: Clinical and Laboratory Standards Institute; 2014.Search in Google Scholar
34. European Medicines Agency (EMA). ICH harmonised tripartite guideline. Validation of analytical procedures: text and methodology Q2 (R1). 1995. https://www.ema. europa.eu/en/documents/scientific-guideline/ich-q- 2-r1-validation-analytical-procedures-text-methodology-step-5_ en.pdf [Accessed 1 May 2023].Search in Google Scholar
35. Working Group 1 of the Joint Committee for Guides in Metrology (JCGM/WG1). Evaluation of measurement data – Guide to the expression of uncertainty in measurement (GUM), (2008; GUM 1995 with minor corrections); 2008. Available from: https://www.bipm.org/documents/20126/2071204/JCGM_100_2008_E.pdf/cb0ef43f-baa5-11cf-3f85-4dcd86f77bd6 [Accessed 1 May 2023].Search in Google Scholar
36. Taibon, J, Santner, T, Singh, N, Ibrahim, SC, Babitzki, G, Köppl, D, et al.. An isotope dilution-liquid chromatography-tandem mass spectrometry (ID-LC-MS/MS)-based candidate reference measurement procedure (RMP) for the quantification of aldosterone in human serum and plasma. Clin Chem Lab Med 2023;61:1902–16. https://doi.org/10.1515/cclm-2022-0996.Search in Google Scholar PubMed
37. Matuszewski, BK. Standard line slopes as a measure of a relative matrix effect in quantitative HPLC-MS bioanalysis. J Chromatogr B: Anal Technol Biomed Life Sci 2006;830:293–300, https://doi.org/10.1016/j.jchromb.2005.11.009,Search in Google Scholar PubMed
38. Matuszewski, BK, Constanzer, ML, Chavez-Eng, CM. Strategies for the assessment of matrix effect in quantitative bioanalytical methods based on HPLC-MS/MS. Anal Chem 2003;75:3019–30, https://doi.org/10.1021/ac020361s.Search in Google Scholar PubMed
39. Armbruster, DA, Pry, T. Limit of blank, limit of detection and limit of quantitation. Clin Biochem Rev. 2008;29 (Suppl 1):S49–52.Search in Google Scholar
40. Schuetzenmeister, A, Dufey, F.: variance component analysis; 2022. Available from: https://cran.r-project.org/web/packages/VCA/index.html [Accessed 01 May 2023].Search in Google Scholar
41. Lewis, RJ, Angier, MK, Johnson, RD. False carbamazepine positives due to 10,11-dihydro-10-hydroxycarbamazepine breakdown in the GC-MS injector port. J Anal Toxicol 2014;38:519–23. https://doi.org/10.1093/jat/bku064.Search in Google Scholar PubMed
42. Garg, U, Johnson, L, Wiebold, A, Ferguson, A, Frazee, C, Thornton, S. False-positive carbamazepine results by gas chromatography-mass spectrometry and VITROS 5600 following a massive oxcarbazepine ingestion. J Appl Lab Med 2018;3:135–9. https://doi.org/10.1373/jalm.2016.022384.Search in Google Scholar PubMed
43. Rauch, G, Geistanger, A, Timm, J. A new outlier identification test for method comparison studies based on robust regression. J Biopharm Stat 2011;21:151–69. https://doi.org/10.1080/10543401003650275.Search in Google Scholar PubMed
Supplementary Material
This article contains supplementary material (https://doi.org/10.1515/cclm-2023-0943).
© 2023 the author(s), published by De Gruyter, Berlin/Boston
This work is licensed under the Creative Commons Attribution 4.0 International License.
Articles in the same Issue
- Frontmatter
- Editorial
- LC-MS/MS random access automation – a game changer for the 24/7 clinical laboratory
- Reviews
- Neurofilament light protein as a biomarker for spinal muscular atrophy: a review and reference ranges
- Differential diagnosis of ascites: etiologies, ascitic fluid analysis, diagnostic algorithm
- Opinion Papers
- Clinical Decision Support System in laboratory medicine
- Blood over-testing: impact, ethical issues and mitigating actions
- General Clinical Chemistry and Laboratory Medicine
- An isotope dilution-liquid chromatography-tandem mass spectrometry (ID-LC-MS/MS)-based candidate reference measurement procedure for the quantification of zonisamide in human serum and plasma
- An isotope dilution-liquid chromatography-tandem mass spectrometry (ID-LC-MS/MS)-based candidate reference measurement procedure for the quantification of carbamazepine in human serum and plasma
- An isotope dilution-liquid chromatography-tandem mass spectrometry (ID-LC-MS/MS)-based candidate reference measurement procedure (RMP) for the quantification of phenobarbital in human serum and plasma
- An isotope dilution-liquid chromatography-tandem mass spectrometry (ID-LC-MS/MS)-based candidate reference measurement procedure (RMP) for the quantification of primidone in human serum and plasma
- An isotope dilution-liquid chromatography-tandem mass spectrometry (ID-LC-MS/MS)-based candidate reference measurement procedure for the quantification of carbamazepine-10,11-epoxide in human serum and plasma
- Should we depend on reference intervals from manufacturer package inserts? Comparing TSH and FT4 reference intervals from four manufacturers with results from modern indirect methods and the direct method
- Comparison of three chatbots as an assistant for problem-solving in clinical laboratory
- Evidence-based cutoffs for total and adjusted calcium: a major factor in detecting severe hypo- and hypercalcemia
- Minor head injury in anticoagulated patients: performance of biomarkers S100B, NSE, GFAP, UCH-L1 and Alinity TBI in the detection of intracranial injury. A prospective observational study
- A comparative evaluation of the analytical performances of premier resolution-high-performance liquid chromatography (PR-HPLC) with capillary zone electrophoresis (CZE) assays for the detection of hemoglobin variants and the quantitation of HbA0, A2, E, and F
- Get reliable laboratory findings – how to recognize the deceptive effects of angiotensin-converting enzyme inhibitor therapy in the laboratory diagnostics of sarcoidosis?
- Reference Values and Biological Variations
- Vitamin D and vitamin K status in postmenopausal women with normal and low bone mineral density
- Hematology and Coagulation
- An automatic analysis and quality assurance method for lymphocyte subset identification
- Cancer Diagnostics
- Machine learning-based delta check method for detecting misidentification errors in tumor marker tests
- Cardiovascular Diseases
- Analytical evaluation of the novel Mindray high sensitivity cardiac troponin I immunoassay on CL-1200i
- Infectious Diseases
- A reactive monocyte subset characterized by low expression of CD91 is expanded during sterile and septic inflammation
- Letters to the Editor
- Inadvertent omission of a specimen integrity comment – an overlooked post-analytical error
- Falsely elevated T3 due to interference of anti-T3 autoantibodies: a case report
- Validation of the Siemens Atellica cortisol immunoassay compared to liquid chromatography mass spectrometry in adrenal venous sampling for primary hyperaldosteronism
- Lessons learned from site-specific sampling and biological half-life of IGFII and IIE(68-88) peptide: a case study
- The added value of automated HPC count: detecting clinically important interferences on the flow cytometric CD34+ cell count
- Clinical pilot study on microfluidic automation of IGH-VJ library preparation for next generation sequencing
- Long-term effects of interventions applied to optimize the use of 25-OH vitamin D tests in primary health care