Prospective validation of an automated chemiluminescence-based assay of renin and aldosterone for the work-up of arterial hypertension
-
Gian Paolo Rossi
 ,
Giulio Ceolotto
,
Giulio Ceolotto


Abstract
Background:
The availability of simple and accurate assays of plasma active renin (DRC) and aldosterone concentration (PAC) can improve the detection of secondary forms of arterial hypertension. Thus, we investigated the performance of an automated chemiluminescent assay for DRC and PAC in referred hypertensive patients.
Methods:
We prospectively recruited 260 consecutive hypertensive patients referred to an ESH Center for Hypertension. After exclusion of six protocol violations, 254 patients were analyzed: 67.3% had primary hypertension, 17.3% an aldosterone producing adenoma (APA), 11.4% idiopathic hyperaldosteronism (IHA), 2.4% renovascular hypertension (RVH), 0.8% familial hyperaldosteronism type 1 (FH-1), 0.4% apparent mineralocorticoid excess (AME), 0.4% a renin-producing tumor, and 3.9% were adrenalectomized APA patients. Bland-Altman plots and Deming regression were used to analyze results. The diagnostic accuracy (area under the curve, AUC of the ROC) of the DRC-based aldosterone-renin ratio (ARRCL) was compared with that of the PRA-based ARR (ARRRIA) using as reference the conclusive diagnosis of APA.
Results:
At Bland-Altman plot, the DRC and PAC assay showed no bias as compared to the PRA and PAC assay. A tight relation was found between the DRC and the PRA values (concordance correlation coefficient=0.92, p<0.0001) and the PAC values measured with radioimmunoassay and chemiluminescence (concordance correlation coefficient=0.93, p<0.001). For APA identification the AUC of the ARRCL was higher than that of the ARRRIA [0.974 (95% CI 0.940–0.991) vs. 0.894 (95% CI 0.841–0.933), p=0.02].
Conclusions:
This rapid automated chemiluminescent DRC/PAC assay performed better than validated PRA/PAC radioimmunoassays for the identification of APA in referred hypertensive patients.
Introduction
Potentially curable secondary forms of arterial hypertension (HT) are markedly under diagnosed even though the ESH/ESC guidelines recommend that they be looked for in hypertensive patients fulfilling certain features [1]. This strategy recently led to detect these forms in about half of the patients with resistant HT referred to tertiary centers [2], which is 50-fold more than the current detection rate in common general clinical practice.
The under detection of secondary forms of HT not only results into lifelong costly medical treatment, but more importantly, into an excess damage of the target organs of HT, which translates into an excess rate of otherwise preventable cardiovascular events [3, 4]. Hence, this is a clinical disaster that needs urgent measures.
An accurate assessment of the renin-angiotensin-aldosterone system (RAAS) is key to a successful identification of secondary forms of HT [5]. Hence, the development of accurate assays for measuring renin and aldosterone that are simple, fast, and easy to implement in real life practice can represent a major leap forward to accelerate and facilitate diagnosis and decrease the costs of undiagnosed HT. To this aim, nonradioactive methods for the simultaneous measurement of active renin and aldosterone are much desirable, as they are less labor-and time-consuming and thus ultimately cheaper. Moreover, for renin measurement they have the theoretical advantage over plasma renin activity (PRA) of the independence of renin on its substrate (angiotensinogen).
Several studies have evaluated chemiluminescent assays for measuring the plasma concentration of active renin (DRC) and aldosterone in hypertensive patients [6–11]. These studies, albeit showing that compared to the radioimmunometric methods the DRC assay allowed saving labor time and costs, overall had limitations in that most of them were designed to compare PRA to DRC [6, 8–12], rather than to test the diagnostic accuracy of the aldosterone-renin ratio (ARR) based on DRC (ARRCL) and the PRA-based ARR (ARRRIA), for identifying the subtypes of primary aldosteronism that can be diagnosed conclusively. Therefore, no such studies followed the STARD recommendations for estimating diagnostic accuracy [13], which dictate that a mandatory step before any novel test can be introduced in clinical practice entails validation using a “gold standard” as reference. Of note, a conclusive diagnosis of APA (based on the “four corners criteria” [5]), and of FH-1 (based on genetic testing) was never used as reference in these studies. Notwithstanding this, the chemiluminescent assays of renin have rapidly replaced the PRA at many centers, which is much worrying as their superiority, or even equivalence, in terms of diagnostic accuracy over the PRA assay was never proven.
This study was therefore, set up to prospectively evaluate the diagnostic accuracy of a novel chemiluminescent automated assay for DRC and PAC in a cohort of consecutive referred patients with HT in whom a conclusive diagnosis of APA was achieved.
Materials and methods
Study design
The study protocol followed the requirements of the Declaration of Helsinki and the Statement for reporting Studies of Diagnostic Accuracy (STARD) recommendations [5, 13]. The flow-chart of the study is shown in Figure 1: in brief, paired plasma samples from each patients were collected and submitted to pre-analytical handling as required for the DRC and the PRA assays. Two technicians, each kept totally blind to clinical data, the conclusive diagnosis of the type of HT, and to the results of the other renin and PAC measurements, independently performed the assays.
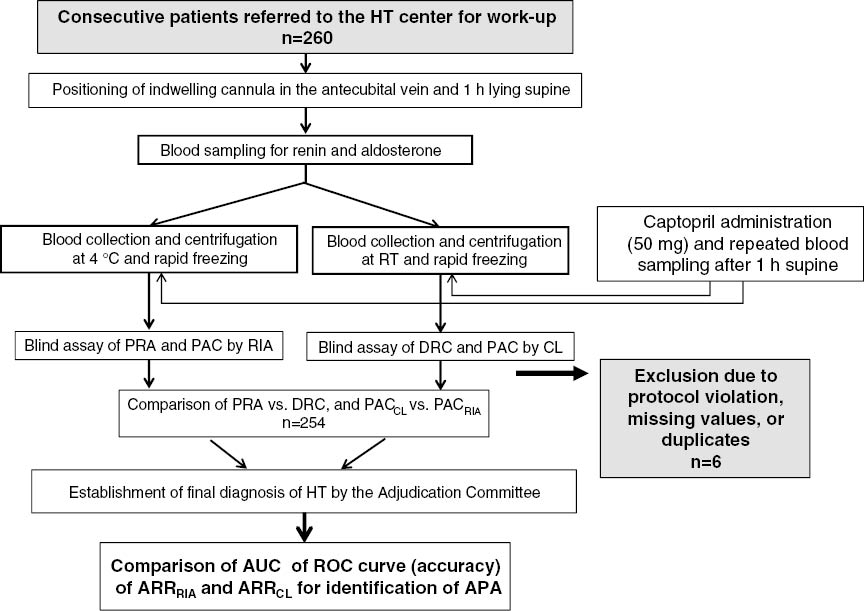
Flow-chart of the study.
After exclusion of six patients due to various reasons 254, were analyzed. For the assays the plasma samples were assigned to different technicians who were blind to the clinical diagnosis and to the results of the other tests. See text for explanations. HT, hypertension; RT, room temperature; PRA, plasma renin activity; PAC, plasma aldosterone concentration; RIA, radioimmunoassay; CL, chemiluminescence; ARR, aldosterone renin ratio; APA, aldosterone producing adenoma.
Based on previous experience [14] we determined beforehand that at least 230 patients were needed to achieve acceptable results; given an anticipated attrition rate a 10% we enrolled 260 consecutive consenting patients referred to the Clinica dell’Ipertensione Arteriosa, Centro Regionale Specializzato, Regione Veneto, Center of Excellence of the ESH, for the evaluation of HT. Exclusion criteria entailed heart failure, liver cirrhosis, type 1 diabetes mellitus, and any other major illness that could affect life expectancy and/or the renin angiotensin-aldosterone system. An Adjudication Committee made by experienced clinicians (GPR, TMS and GM) made the final diagnosis of the cause of HT.
Subjects and methods
For a detailed description of the pharmacological preparation of the patients and the conditions for testing, please refer to the Supplemental Material.
Biochemical measurements
All biochemical measurements were centralized and performed in the ISO 9001-certified central laboratory of the Azienda Università-Ospedale-Padova as detailed in the Supplemental Material.
DRC and PAC were measured shortly after blood sampling in the ad hoc collected samples using an automated system (DiaSorin, LIAISON® XL instrument), the LIAISON® Direct Renin kit (DiaSorin, Saluggia, Italy) and the LIAISON® XL Aldosterone kit. Normal ranges and antibody cross-reactivity for the hormonal measurements have already been reported [5].
ARRRIA and the ARRCL calculation and diagnostic criteria
The ARR was first calculated using PAC (in ng/dL) as numerator, and either DRC (in mIU/L, ARRCL) or PRA (in ng/mL/h, ARRRIA) values as denominator. The ARR value was also recalculated after setting the lowest possible value of the denominator to 0.6 mIU/L (corresponding to the 25th percentile) and to 0.2 ng/mL/h for the DRC and PRA, respectively, as described [14], to avoid over inflation due to low renin levels.
Primary aldosteronism (PA) was diagnosed in the presence of biochemical evidence of PA, as shown by an elevated ARRRIA: for the diagnosis of APA lateralized aldosterone excess at adrenal vein sampling (AVS); identification of APA at surgery and/or pathology; demonstration of correction of the hyperaldosteronism and cure, or marked improvement of the hypertension post-adrenalectomy, e.g. the “four corner criteria”, were also required [5]. Patients with a high ARRRIA, who showed no lateralized aldosterone excess, were presumed to have idiopathic hyperaldosteronism (IHA). Renovascular hypertension was diagnosed based on demonstration of a hemodynamically significant renal artery stenosis at angioCT using the METRAS Study criteria [15], and a fall greater than 20 mmHg systolic and diastolic blood pressure on the same or lowered antihypertensive drugs (dose and/or number) after renal revascularization [15]; familial hyperaldosteronism type 1 (FH-1) was diagnosed by long PCR [16]; renin-producing tumor (RPT) was diagnosed based on biochemistry, imaging and renal venin sampling.
Further tests
The patients with an ARR exceeding the cutoff values at baseline and post-captopril (27 and 13 ng/dL/ng/mL/h, respectively) [5] were submitted to AVS to identify a lateralized aldosterone excess production, and to an imaging test for identification of adrenocortical nodule [5, 17, 18]. Only bilaterally selective AVS were used to demonstrate lateralization of hyperaldosteronism [18]. As the bilateral simultaneous blood sampling technique was used, we did not perform AVS with cosyntropin because we previously showed that despite improving the assessment of selectivity of catheterization this stimulation does not enhance the diagnostic accuracy [19].
Statistical analysis
DRC, PRA, PAC, and ARR values were skewed and therefore, were analyzed after a normal distribution was achieved by log transformation. One-way ANOVA with Bonferroni’s post-hoc test was used to compare quantitative variables across groups. Distribution of categorical variables was investigated by χ2 analysis. Bland-Altman plots and Deming regression analysis were used to assess the within-patient relationship between DRC and PRA, and between PACRIA and PACCL values [20]. Bland-Altman plots were used to detect systematic error, proportional error, or a magnitude-dependent bias. For the Deming regression, the concordance correlation coefficient, which evaluates the degree to which pairs of observations fall on the 45° line through the origin, was calculated. This coefficient is a measure of accuracy and was estimated by the following formula: ρc=ρ Cb, with ρ indicating the Pearson correlation coefficient and Cb indicating a bias correction factor that measures how far the best-fit line deviates from the 45° line through the origin. Given the different ranges of values furnished by these assays the Z score were calculated from the raw values and used for the latter analyses.
The receiver operator characteristics (ROC) curves were employed to assess the accuracy of the ARRCL and the ARRRIA for identifying APA [21]. The area under the ROC, used as an estimate of diagnostic accuracy, was compared between the ARRCL and the ARRRIA with the method of Hanley [22]. The Youden index (J), a main summary statistic of the ROC curve defined as J=max (c) [sensitivity (c)+specificity (c)−1], was employed to determine the optimal cutoff (c*). This was defined as the value that optimizes the ARR’s discriminating ability in that it corresponds to the highest average of sensitivity and specificity [23]. The significance was set at p<0.05. SPSS™ for Mac (vers. 22.0) was used for all but the ROC curve analyses, which were performed with the MedCalc™ software (vers. 15.6 MedCalc Software, Mariakerke, Belgium).
Results
Baseline characteristics
Between April 2014 and April 2015 260 consecutive newly referred patients with HT were recruited. Of them six were excluded due to protocol violations, missing data or duplicated (n=1). Of the remaining 254 patients, 67.3% had primary hypertension (PH) and 32.7% secondary HT. In the latter group, 17.3% (of the total) had an APA, 11.4% IHA, 2.4% RVH due to atherosclerotic renal artery stenosis, 0.8% (two patients) FH-1, 0.4% (one patient) apparent mineralocorticoid excess due to licorice abuse and 0.4% (one patient) renin-producing tumor; 3.9% (ten patients) were adrenalectomized APA patients studied at follow-up after surgery. The demographic and clinical data of the entire cohort of consecutive hypertensive patients (Table 1) showed that the patients were middle aged, overweight, with normal sodium intake and renal function. Table 2 shows the clinical and the raw biochemical data of the patients in the three main groups of diagnosis; the adrenalectomized PA patients were not included as PA in the overall analysis.
The PA patients showed the lowest values of serum K+, PRA and DRC; both the PA and the RVH showed high PAC; however, only the former exhibited overtly elevated values of the ARR, regardless of the assays used for its determination. When the PA, which comprised the largest group with secondary HT, was examined, the APA patients showed slightly lower serum K+, and higher PAC and ARR values, albeit only for the ARRCL. The blood pressure values were significantly lower in the adrenalectomized APA than in the APA studied before adrenalectomy; moreover, their PRA and DRC values increased, and the PAC values fell, as compared to the pre-adrenalectomy group (Table S1). The baseline and post-captopril values of the ARRRIA and ARRCL in the patients divided by final diagnosis (Figure 2) evidenced a remarkable similarity between values determined with either method across all groups. The corresponding values of PRA, DRC, and PAC also showed prominent similarity (Figures S1 and S2), as assessed by the concordance correlation coefficient, which was 0.92 and 0.93 for renin and PAC, respectively (Figure S3).
Baseline characteristics of the entire cohort of consecutive hypertensive patients.
| Variable | All patients (n=254) |
|---|---|
| Age, years | 46.1±13.5 |
| Gender (m/f, %) | 57/43 |
| BMI, kg/m2 | 28.4±9.7 |
| Systolic BP, mmHg | 146±17 |
| Diastolic BP, mmHg | 91±13 |
| Serum Na+, mmol/L | 141.2±2.0 |
| Serum K+, mmol/L | 3.9±0.5 |
| Urinary Na+ excretion, mmol/24 h | 171±77 |
| Urinary K+ excrextion, mmol/24 h | 65±23 |
| Serum creatinine, μmol/L | 69±22 |
| eGFR, mL/min/1.73 m2 | 110±64 |
Anthropometric and clinical features of the patients in the main diagnosis groups.
| Variable | PA (n=69) | p-Value | RVH (n=6) | p-Value | PH (n=171) | p-Value |
|---|---|---|---|---|---|---|
| PA vs. RVH | RVH vs. PH | PH vs. PA | ||||
| Age, years | 48.9±11.4 | ns | 39.4±15.1 | ns | 45.2±14.1 | ns |
| Gender (m/f, %) | 62/38 | ns | 50/50 | ns | 55/45 | ns |
| Systolic BP, mmHg | 150±19 | ns | 147±18 | ns | 143±15 | ns |
| Diastolic BP, mmHg | 93±15 | ns | 93±14 | ns | 90±12 | ns |
| Serum K+, mmol/L | 3.6±0.5 | ns | 3.9±0.2 | ns | 4.0±0.4 | <0.0001 |
| PRAb, ng/mL/h | 0.34 (0.26–0.41) | <0.0001 | 1.87 (0.56–3.19) | 0.001 | 0.80 (0.68–0.91) | <0.0001 |
| PRAc, ng/mL/h | 0.45 (0.32–0.59) | <0.0001 | 6.52 (0.39–15.80) | <0.0001 | 1.38 (1.13–1.63) | 0.003 |
| DRCb, mIU/L | 5.34 (4.07–6.60) | <0.0001 | 32.87 (16.43–49.30) | 0.03 | 17.54 (15.04–20.03) | <0.0001 |
| DRCc, mIU/L | 8.30 (5.75–10.85) | <0.0001 | 88.74 (9.98–167.50) | <0.0001 | 26.69 (22.38–31.00) | <0.0001 |
| PACbRIA, ng/dL | 19.6 (16.1–23.1) | ns | 21.1 (9.1–33.1) | 0.01 | 10.1 (9.4–10.9) | <0.0001 |
| PACcRIA, ng/dL | 15.8 (12.9–18.7) | ns | 12.9 (5.1–19.9) | ns | 6.9 (6.5–7.3) | <0.0001 |
| PACbCL, ng/dL | 18.2 (14.7–21.7) | ns | 22.7 (11.6–33.9) | 0.002 | 9.6 (9.0–10.3) | <0.0001 |
| PACcCL, ng/dL | 16.6 (12.7–20.4) | ns | 16.4 (9.7–23.1) | ns | 7.6 (7.2–8.0) | <0.0001 |
| ARRbRIA (ng/dL)/(ng/mL/h) | 99.6 (76.3–123.0) | <0.0001 | 12.8 (6.9–18.8) | ns | 22.2 (19.0–25.6) | <0.0001 |
| ARRcRIA (ng/dL)/(ng/mL/h) | 76.3 (53.5–99.0) | 0.004 | 6.3 (1.3–11.2) | ns | 14.3 (11.1–17.4) | <0.0001 |
| ARRbCL (ng/dL)/(mIU/L) | 7.5 (5.3–9.7) | 0.005 | 0.9 (0.4–1.3) | ns | 1.0 (0.8–1.1) | <0.0001 |
| ARRcCL (ng/dL)/(mIU/L) | 5.2 (3.5–6.9) | 0.009 | 0.4 (0.1–0.6) | ns | 0.7 (0.5–0.8) | <0.0001 |
Median and 95% CI range, as appropriate. PA, primary aldosteronism; RVH, renovascular hypertension; PH, primary (essential) hypertension; BP, blood pressure; PRAb, plasma renin activity (PRA) at baseline; PRAc, PRA after captopril; DRCb, direct renin concentration (DRC) at baseline; DRCc, DRCRIA after captopril; PACbRIA, plasma aldosterone concentration (PAC) measured with radioimmunoassay (RIA)-based technique at baseline; PACcRIA, PAC measured with RIA after captopril; PACbCL, PAC measured with chemiluminescent assay at baseline; PACcCL, PAC measured with chemiluminescent assay after captopril; ARRbRIA, PAC-to-PRA ratio calculated using PAC measured with RIA as numerator and PRA value as denominator, at baseline; ARRcRIA, PAC-to-PRA ratio calculated using PAC measured with RIA as numerator and PRA value as denominator, after captopril; ARRbCL, PAC-to-DRC ratio calculated using PAC measured with chemiluminescent assay as numerator and DRC as denominator, at baseline; ARRcCL, PAC-to-DRC ratio calculated using PAC measured with chemiluminescent assay as numerator and DRC as denominator, after captopril.

Box and whisker plots of the aldosterone-renin ration (ARR) values calculated using PAC and DRC measured with the automated chemiluminescent method (ARRCL lower panels) or with radioimmunoassay of PAC and PRA (ARRRIA upper panels) in the 254 patients divided according to the final diagnosis.
The left panels show the baseline values while the right panels depict the values obtained after captopril challenge. Please note the remarkably similar results obtained with the different methods under both conditions, the ARR values higher in the APA group than in the PH and RVH groups, and the markedly lower values in the adrenalectomized APA patients and in the patient with a renin-producing tumor.
Relationship between the DRC and the PRA and PACRIA and PACCL
The DRC and PRA values showed a significant within–patient correlation in the whole cohort, both at baseline (r=0.91 (0.89–0.93), p<0.0001 and post-captopril (r=0.88 (0.85–0.91), p<0.0001), thus indicating a high between-method concordance in the all range of plasma renin levels (Figure S3). The PACRIA and PACCL values also showed a significant within–patient correlation in the whole cohort, both at baseline (r=0.93 (0.91–0.94), p<0.0001) and post-captopril (r=0.88 (0.84–0.90), p<0.0001). Therefore, there was a high between-method concordance in a wide range of PAC levels spanning from those found in patients with low PAC (AME and FH-1 under dexamethasone treatment) and high PAC values (PA and RVH patients).
Diagnostic accuracy of the ARRRIA and the ARRCL
Figure 3 shows the Bland-Altman plot of the ARRRIA and the ARRCL. The Z scores were used for this plot to avoid creating an artificial proportional error (due to the different units of measure of the assays). Although eyeball examination suggested a ‘funnel effect’, e.g. a magnitude-related (proportional) difference between the methods, no evidence for systematic biases was detected: only 10 of the 254 values fell out of the 95% confidence interval.

Bland-Altman plot showing the comparison of the ARRRIA and the ARRCL values (plotted as Z scores of the raw values).
See text for explanation.
The ROC curves AUC for ARRCL and ARRRIA for the unambiguously diagnosed APA, used as reference, differed significantly from that under the identity line, for both ARRs indicating that they provided a diagnostic gain in over tossing a coin (Figure 4). However, the AUC for ARRCL was higher than that for ARRRIA (p=0.02). Results were similar when the analysis was repeated after constraining the lowest value of DRC to 6 mIU/L, and the PRA to 0.2 ng/mL/h, the values used in clinical practice when calculating the ARR to avoid over-inflating its values due to exceedingly low renin values [5, 24].

The comparison of the ROC curves for the ARRCL and the ARRRIA measured under baseline conditions for the identification of APA, as conclusively established by using the ‘four corners’ criteria, shows a higher area under the curve (AUC) for the ARRCL than for the ARRRIA, indicating a better performance of the former over the latter.
Optimal cutoff of the ARRCL for identification of APA
The Youden index, used to identify the optimal cutoff for the raw and corrected ARRCL, was 2.06 for the raw ARRCL expressed as PAC in ng/dL and DRC as mUI/L, which corresponded to a sensitivity of 92% and a specificity of 91.6% (Table 3). For the ARRRIA the optimal cutoff value (in ng/dL/ng/mL/h) was 38.7, corresponding to a sensitivity of 80% and a specificity of 92%. Results were similar when the analysis was repeated after constraining the lowest DRC value to 6 mIU/L, and the PRA to 0.2 ng/mL/h.
Area under the ROC Curve (AUC) for the aldosterone-to-renin ratio (ARR) measured with the chemiluminescence-based technique and the optimal criterion value.
| ROC curve | |
| Disease prevalence, % | 12.3 |
| Area under the ROC curve (AUC) | |
| Area under the ROC curve (AUC) | 0.971 |
| Standard errora | 0.014 |
| 95% Confidence interval | 0.937–0.989 |
| Z statistic | 32.71 |
| Significance level p (Area=0.5) | <0.0001 |
| Youden index | |
| Youden index J | 0.8362 |
| Associated criterion | >2.057 |
| Sensitivity | 92.00 |
| Specificity | 91.62 |
| Optimal criterionb | |
| Optimal criteriona | >5.029 |
| Sensitivity | 80.00 |
| Specificity | 98.88 |
aTaking into account disease prevalence (12.3%) and estimated costs: cost false positive: 1; cost false negative: 1; cost true positive: 0; cost true negative: 0. bThe optimal criterion value takes into account not only sensitivity and specificity, but also disease prevalence and costs of various decisions.
Criterion values and coordinates of the ROC curve
| Criterion | Sensitivity | 95% CI | Specificity | 95% CI | +LR | –LR | +PV | –PV | Cost | |
|---|---|---|---|---|---|---|---|---|---|---|
| ≥0.063 | 100.0 | 86.3–100.0 | 0.0 | 0.0–2.0 | 1.00 | 12.3 | 0.88 | |||
| >0.905 | 100.0 | 86.3–100.0 | 69.8 | 62.5–76.5 | 3.31 | 0.00 | 31.6 | 100.0 | 0.27 | |
| >0.915 | 96.0 | 79.6–99.9 | 69.8 | 62.5–76.5 | 3.18 | 0.057 | 30.8 | 99.2 | 0.27 | |
| >1.461 | 96.0 | 79.6–99.9 | 83.2 | 76.9–88.4 | 5.73 | 0.048 | 44.4 | 99.3 | 0.15 | |
| >1.467 | 92.0 | 74.0–99.0 | 83.2 | 76.9–88.4 | 5.49 | 0.096 | 43.4 | 98.7 | 0.16 | |
| → | >2.057 | 92.0 | 74.0–99.0 | 91.6 | 86.6–95.2 | 10.98 | 0.087 | 60.5 | 98.8 | 0.08 |
| >2.094 | 88.0 | 68.8–97.5 | 91.6 | 86.6–95.2 | 10.50 | 0.13 | 59.5 | 98.2 | 0.09 | |
| >2.827 | 88.0 | 68.8–97.5 | 94.4 | 90.0–97.3 | 15.75 | 0.13 | 68.7 | 98.3 | 0.06 | |
| >2.829 | 84.0 | 63.9–95.5 | 94.4 | 90.0–97.3 | 15.04 | 0.17 | 67.7 | 97.7 | 0.07 | |
| >3.285 | 84.0 | 63.9–95.5 | 96.1 | 92.1–98.4 | 21.48 | 0.17 | 75.0 | 97.7 | 0.05 | |
| >3.328 | 80.0 | 59.3–93.2 | 96.1 | 92.1–98.4 | 20.46 | 0.21 | 74.1 | 97.2 | 0.06 | |
| >5.029 | 80.0 | 59.3–93.2 | 98.9 | 96.0–99.9 | 71.60 | 0.20 | 90.9 | 97.3 | 0.03 | |
| >7.079 | 60.0 | 38.7–78.9 | 98.9 | 96.0–99.9 | 53.70 | 0.40 | 88.2 | 94.7 | 0.06 | |
| >7.125 | 60.0 | 38.7–78.9 | 99.4 | 96.9–100.0 | 107.40 | 0.40 | 93.7 | 94.7 | 0.05 | |
| >8.572 | 40.0 | 21.1–61.3 | 99.5 | 96.9–100.0 | 71.60 | 0.60 | 90.9 | 92.2 | 0.08 | |
| >8.888 | 40.0 | 21.1–61.3 | 100.0 | 98.0–100.0 | 0.60 | 100.0 | 92.3 | 0.07 | ||
| >44.88 | 0.0 | 0.0–13.7 | 100.0 | 98.0–100.0 | 1.00 | 87.7 | 0.12 |
The arrow and bold indicate the cutoff value that meets the optimal sensitivity and specificity. +PV, positive predictive value; –PV, negative predictive value; +LR, positive likelihood ratio; –LR, negative likelihood ratio [25].
Discussion
The direct immunochemical measurement of active renin is rapidly replacing PRA for several potential advantages including independence on renin substrate availability, more consistent results, handling of plasma at room temperature, and the possibility of performing the assay with automation, thus saving time, costs and human resources. Accordingly, the replacement of the PRA with the chemiluminescent renin assay has rapidly occurred at many centers in spite of lack of any proof for superiority of the former over the latter in terms of diagnostic accuracy. The available studies mostly investigated the correlation of DRC with DRA [6–11]; only one retrospective study validated a chemiluminescent assay in PA patients, but did not compare the ARRCL, with the ARRRIA [12].
We planned this study in 2013 to prospectively compare head-to-head the ARR obtained from an automated simultaneous chemiluminescent measurement of PAC and DRC (ARRCL) with the ARR based on established and clinically validated PRA and PAC radioimmunoassay (ARRRIA) in a sizable cohort of patients. According to the protocol, we selected no specific forms of HT as we wished to test the performance of these assays in a real life situation entailing a cohort of consecutively referred hypertensive patients. Hence, we recruited mostly patients with essential HT, but also, consistently with the referral nature of our center, a notable proportion with secondary forms of HT, among which primary aldosteronism largely prevailed, but other forms, including renovascular HT, FH-1, renin-producing tumor, and apparent mineralocorticoid excess were also represented. Moreover, as a result of our policy of systematically assessing the patients post-adrenalectomy to prove correction of the PA, there were also APA patients who were studied at follow-up post-adrenalectomy. Altogether these features testified the ‘real life’ setting of this study and allowed to compare the two assays over a wide range of renin and PAC values.
Of note, the secondary forms of HT were diagnosed unambiguously by state-of-the art criteria: for APA and FH-1, the subtypes of PA that can be unequivocally diagnosed, by the “four corners criteria” and long PCR, respectively [5, 17]. Since, as expected FH-1 was found only in two cases, we used APA as reference index to determine the accuracy of either ARR following the STARD recommendations [13]. The diagnostic accuracy of the ARRCL and the ARRRIA for identifying APA could then be compared using the ROC curve analysis.
When the entire cohort was examined, both the PRA and DRC, and the PAC values, and consequently the ARRRIA and ARRCL (Figure 2) showed remarkably similar results and, more importantly, the expected differences across diagnosis groups (Table 2 and Figures S1 and S2). The renin values were lower in the PA group than in the PH and the RVH group with both assays; moreover, both PACRIA and PACCL values were higher in the PA and RVH patients than in the PH patients, as expected. Of note, the highest DRC value was observed in the patient with the renin-producing tumor, in which the PRA values were not so prominently elevated. This finding, along with the fact that another such case was identified at our center in the past few months after the introduction of the DRC assay, suggests that this assay, by circumventing the underestimation of renin with the PRA assay (due to dependency on limiting) substrate availability), can improve the detection of rate of this rare cause of HT.
We found that the DRC and PRA values were tightly within-patient correlated in the whole cohort, both for the baseline and for the post-captopril stimulation (Figure S3). This finding is at variance with what we found in a smaller retrospectively investigated cohort of the PAPY study, where only the post-captopril PRA and DRC values correlated strongly [14]. We speculated at that time that the stronger correlation post-captopril could be because of the higher precision of both renin assays when renin values are raised. Instead the present findings showed that the PRA and DRC correlated well also in the low renin range, e.g. in PA patients under unstimulated conditions. Likely this different better outcome originated from several factors: the very rigorous control of the pre-analytical phase that avoided inadvertent alteration of renin measurement due to cryoactivation [6, 26], use of an automated method in a centralized laboratory, along with a storage time duration much shorter than in the PAPY Study [14].
The notable precision of the automated DRC assay to measure the low renin levels of PA patients agrees with the findings of a highly significant correlation between PRA and DRC in plasma samples with low renin concentration (mean value of 1.63 mIU/L, range 0.8–11.7) in PA patients, as well as with the manufacturer’s claim that the LIAISON Direct Renin kit has a functional sensitivity of 2 (1.60–1.96 IFU DS) mIU/L. This finding is obviously relevant from the practical standpoint and supports the contention that the ARRCL could be at least as accurate as ARRRIA in identifying PA patients [18].
To further investigate the accuracy of the two ARR we used the AUC under the ROC curves, which estimates the overall diagnostic accuracy because it provides an index of the average sensitivity for all values of specificity, and vice versa. For the ARRCL and the ARRRIA the AUC was higher than 0.50, indicating that both tests are useful for the screening of APA over “tossing a coin”. More importantly, the accuracy of the ARRCL was higher than that of the ARRRIA: a formal comparison of the ARRCL and the AUC ARRRIA showed that the AUC for the former test (0.974 (95% CI 0.940–0.991) was higher than that of the latter (0.894 (95% CI 0.841–0.933, p=0.02) (Figure 4). Identical conclusions were reached when the ROC analysis was repeated after constraining the lowest limit of DRC- and PRA measured renin values at the aforementioned minimum values.
The optimal cutoff for the raw ARRCL (expressed as PAC in ng/dL and DRC as mIU/L, Table 2), was 2.06; it corresponded to a sensitivity of 92% and a specificity of 92% (Table 3); for the ARRRIA the optimal cutoff value was 38.7 (expressed as PAC in ng/dL and PRA as ng/mL/h) corresponding to a sensitivity of 80% and a specificity of 92%. This ARRCL cutoff is higher than the 1.2 reported for another chemiluminescent assay in a retrospective study, in which, however, the diagnosis of APA was not unambiguously confirmed by the four corner criteria (12). With that cutoff, however, in spite of slightly higher sensitivity (98.9% vs. 92%) the specificity was much lower compared to that found in the present study (79% vs. 92%). Moreover, to enable readers to select the ARRCL cutoff values that best meet their desired combination of sensitivity and specificity we have provided a table with the sensitivity, specificity, positive (+PV) and negative predictive value (–PV), positive likelihood ratio (+LR), negative likelihood ratio (–LR), and also the optimal criterion value, which takes into account not only sensitivity and specificity, but also disease prevalence, and costs of various decisions (Table 3).
It might be argued that extrapolation of these findings to the general population of hypertensives is not warranted because we examined patients referred to a specialized hypertension center, who show a prevalence of secondary forms of hypertension much higher than that found in the hypertensive patients commonly seen in general practice. However, the prevalence of secondary forms of HT was lower than the 50% reported in a recent multicenter study of patients with resistant HT [2]; moreover, our cohort had an overall prevalence of PA of 27%, higher than that (11.2%) found in the all PAPY Study [5]. Nonetheless, the rate of the different subtypes was similar, which would speak against a selection bias and overall support the generalizability of our findings to the population of referred hypertensive patients.
Strengths of this study include its prospective design, a careful standardization of the conditions for patient’s preparation, blood sampling and biochemical assay (see Supplemental Material), and, moreover, se of an accepted methodology based on the conclusive diagnosis of secondary HT, namely of APA, as reference index for the diagnosis of PA [5, 17, 27].
These results allow, in our view, the following conclusions: in patients adequately prepared from the pharmacological standpoint, when samples are properly collected and handled under carefully standardized conditions, the diagnostic performance of the ARR based on DRC is equivalent to that based on a clinically validated PRA assay in a wide range of clinical conditions. Moreover, for the detection of PA, a common cause of secondary HT that is most challenging for the renin assays because of its low or very low renin values, the ARRCL obtained from PAC and DRC measured with an automated chemiluminescent method performed better than the ARRRIA. Major advantages of the this method for estimating active renin over the PRA assay include a simpler pre-analytical handling with blood collection and at room temperature and automation, which translated in more reproducible results and in less hands-on use of human resources. Finally, lack of use of radioactivity and radioactive waste make these assays environment friendly. Based on these considerations we have now introduced the chemiluminescence-based assays instead of the PRA and PAC radioimmunoassay at our institution. This has allowed a marked shortening of the time from blood sampling to results, with the benefits of speeding up reaching the diagnostic conclusions.
Acknowledgments
We are grateful to Dr. Emma Spranzi of Diasorin Italy for the gift of the Liaison Direct Renin kit (DiaSorin, Saluggia, Italy) and the Liason XL Aldosterone kit (DiaSorin, Saluggia, Italy) and to Mr. Flaviano Favaro for expert technical assistance.
Author contributions: All the authors have accepted responsibility for the entire content of this submitted manuscript and approved submission.
Rsearch funding: This study was supported by research grants from FORICA (The FOundation for advanced Research In Hypertension and Cardiovascular diseases) and the Società Italiana dell’Ipertensione Arteriosa, the FP7-funded COST ADMIRE network (BM1301), Horizon2020 Grant SEP-210176891”. Diasorin provided an unrestricted educational grant to a commercial developer for an App for the calculation of the aldosterone-renin ratio starting from PRA or DRC. This App was conceived and prepared by Professor GP Rossi and will be freely distributed to members of the European Society of Hypertension and the Italian Society of Hypertension.
Employment or leadership: None declared.
Honorarium: None declared.
Competing interests: The funding organization(s) played no role in the study design; in the collection, analysis, and interpretation of data; in the writing of the report; or in the decision to submit the report for publication.
Note: An App for the calculation of the ARRRIA and ARRCL has been developed by the authors and it is available at the Apple Store.
References
1. Mancia G, Fagard R, Narkiewicz K, Redon J, Zanchetti A, Böhm M, et al. 2013 ESH/ESC guidelines for the management of arterial hypertension: the Task Force for the Management of Arterial Hypertension of the European Society of Hypertension (ESH) and of the European Society of Cardiology (ESC). Eur Heart J 2013;34:2159–219.10.1201/b17072-61Search in Google Scholar
2. Azizi M, Sapoval M, Gosse P, Monge M, Bobrie G, Delsart P, et al. Renal Denervation for Hypertension (DENERHTN) investigators. Optimum and stepped care standardised antihypertensive treatment with or without renal denervation for resistant hypertension (DENERHTN): a multicentre, open-label, randomised controlled trial. Lancet 2015;385:1957–65.10.1016/S0140-6736(14)61942-5Search in Google Scholar PubMed
3. Rossi GP, Sacchetto A, Pavan E, Palatini P, Graniero GR, Canali C, et al. Remodeling of the left ventricle in primary aldosteronism due to Conn’s adenoma. Circulation 1997;95:1471–8.10.1161/01.CIR.95.6.1471Search in Google Scholar
4. Rossi GP, Sechi LA, Giacchetti G, Ronconi V, Strazzullo P, Funder JW. Primary aldosteronism: cardiovascular, renal and metabolic implications. Trends Endocrinol Metab 2008;19: 88–90.10.1016/j.tem.2008.01.006Search in Google Scholar PubMed
5. Rossi GP, Bernini G, Caliumi C, Desideri G, Fabris B, Ferri C, et al. PAPY Study Investigators. A prospective study of the prevalence of primary aldosteronism in 1,125 hypertensive patients. J Am Coll Cardiol 2006;48:2293–300.10.1016/j.jacc.2006.07.059Search in Google Scholar PubMed
6. Hartman D, Sagnella GA, Chesters CA, Macgregor GA. Direct renin assay and plasma renin activity assay compared. Clin Chem 2004;50:2159–61.10.1373/clinchem.2004.033654Search in Google Scholar PubMed
7. Unger N, Lopez Schmidt I, Pitt C, Walz MK, Philipp T, Mann K, et al. Comparison of active renin concentration and plasma renin activity for the diagnosis of primary hyperaldosteronism in patients with an adrenal mass. Eur J Endocrinol 2004;150:517–23.10.1530/eje.0.1500517Search in Google Scholar PubMed
8. Perschel FH, Schemer R, Seiler L, Reincke M, Deinum J, Maser-Gluth C, et al. Rapid screening test for primary hyperaldosteronism: ratio of plasma aldosterone to renin concentration determined by fully automated chemiluminescence immunoassays. Clin Chem 2004;50:1650–5.10.1373/clinchem.2004.033159Search in Google Scholar PubMed
9. Ahmed AH, Gordon RD, Taylor P, Ward G, Pimenta E, Stowasser M. Effect of atenolol on aldosterone/renin ratio calculated by both plasma Renin activity and direct Renin concentration in healthy male volunteers. J Clin Endocrinol Metab 2010;95:3201–6.10.1210/jc.2010-0225Search in Google Scholar PubMed
10. Glinicki P, Jeske W, Bednarek-Papierska L, Kruszyńska A, Gietka-Czernel M, Rosłonowska E, et al. The ratios of aldosterone / plasma renin activity (ARR) versus aldosterone/direct renin concentration (ADRR). J Renin Angiotensin Aldosterone Syst 2015;16:1298–305.10.1177/1470320313519487Search in Google Scholar PubMed
11. Fischer E, Reuschl S, Quinkler M, Rump LC, Hahner S, Bidlingmaier M, et al. Participants of the German Conn’s Registry – Else Kröner-Fresenius-Hyperaldosteronism Registry. Assay characteristics influence the aldosterone to renin ratio as a screening tool for primary aldosteronism: results of the German Conn’s registry. Horm Metab Res 2013;45:526–31.10.1055/s-0033-1343448Search in Google Scholar PubMed
12. Manolopoulou J, Fischer E, Dietz A, Diederich S, Holmes D, Junnila R, et al. Clinical validation for the aldosterone-to-renin ratio and aldosterone suppression testing using simultaneous fully automated chemiluminescence immunoassays. J Hypertens 2015;33:2500–11.10.1097/HJH.0000000000000727Search in Google Scholar PubMed
13. Bossuyt PM, Reitsma JB, Bruns DE, Gatsonis CA, Glasziou PP, Irwig LM, et al. Standards for Reporting of Diagnostic Accuracy. The STARD statement for reporting studies of diagnostic accuracy: explanation and elaboration. Clin Chem 2003;49:7–18.10.1373/49.1.7Search in Google Scholar PubMed
14. Rossi GP, Barisa M, Belfiore A, Desideri G, Ferri C, Letizia C, et al. PAPY study Investigators. The aldosterone-renin ratio based on the plasma renin activity and the direct renin assay for diagnosing aldosterone-producing adenoma. J Hypertens 2010;28:1892–9.10.1097/HJH.0b013e32833d2192Search in Google Scholar PubMed
15. Rossi GP, Seccia TM, Miotto D, Zucchetta P, Cecchin D, Calò L, et al. METRAS Investigators. The Medical and Endovascular Treatment of Atherosclerotic Renal Artery Stenosis (METRAS) study: rationale and study design. J Hum Hypertens 2012;26:507–16.10.1038/jhh.2011.62Search in Google Scholar PubMed
16. Stowasser M, Gordon RD, Gunasekera TG, Cowley DC, Ward G, Archibald C, et al. High rate of detection of primary aldosteronism, including surgically treatable forms, after ‘non-selective’ screening of hypertensive patients. J Hypertens 2003;21:2149–57.10.1097/00004872-200311000-00025Search in Google Scholar PubMed
17. Rossi GP, Rossi E, Pavan E, Rosati N, Zecchel R, Semplicini A, et al. Screening for primary aldosteronism with a logistic multivariate discriminant analysis. Clin Endocrinol (Oxf) 1998;49:713–23.10.1046/j.1365-2265.1998.00608.xSearch in Google Scholar PubMed
18. Letavernier E, Peyrard S, Amar L, Zinzindohoue F, Fiquet B, Plouin PF. Blood pressure outcome of adrenalectomy in patients with primary hyperaldosteronism with or without unilateral adenoma. J Hypertens 2008;26:1816–23.10.1097/HJH.0b013e3283060f0cSearch in Google Scholar PubMed
19. Seccia TM, Miotto D, De Toni R, Maniero C, Vincenzi M, Motta R, et al. Chromogranin a measurement for assessing the selectivity of adrenal venous sampling in primary aldosteronism. J Clin Endocrinol Metab 2011;96:E825–9.10.1210/jc.2010-2172Search in Google Scholar PubMed
20. Bland JM, Altman DG. Measuring agreement in method comparison studies. Stat Methods Med Res 1999;8:135–60.10.1177/096228029900800204Search in Google Scholar PubMed
21. Rossi GP, Belfiore A, Bernini G, Desideri G, Fabris B, Ferri C, et al. Primary Aldosteronism Prevalence in Italy Study Investigators. Comparison of the captopril and the saline infusion test for excluding aldosterone-producing adenoma. Hypertension 2007;50:424–31.10.1161/HYPERTENSIONAHA.107.091827Search in Google Scholar PubMed
22. Hanley JA, McNeil BJ. A method of comparing the areas under receiver operating characteristic curves derived from the same cases. Radiology 1983;148:839–43.10.1148/radiology.148.3.6878708Search in Google Scholar PubMed
23. Ruopp MD, Perkins NJ, Whitcomb BW, Schisterman EF. Youden index and optimal cut-point estimated from observations affected by a lower limit of detection. Biom J 2008;50:419–30.10.1002/bimj.200710415Search in Google Scholar PubMed PubMed Central
24. Rossi GP, Pessina AC, Heagerty AM. Primary aldosteronism: an update on screening, diagnosis and treatment. J Hypertens 2008;26:613–21.10.1097/HJH.0b013e3282f4b3e6Search in Google Scholar PubMed
25. Efron B. Better bootstrap confidence intervals. J Am StatAssoc 1987;82:171–85.10.21236/ADA150798Search in Google Scholar
26. Campbell DJ, Nussberger J, Stowasser M, Danser AH, Morganti A, Frandsen E, et al. Activity assays and immunoassays for plasma Renin and prorenin: information provided and precautions necessary for accurate measurement. Clin Chem 2009;55:867–77.10.1373/clinchem.2008.118000Search in Google Scholar PubMed
27. Rossi GP, Seccia TM, Pessina AC. A diagnostic algorithm – the holy grail of primary aldosteronism. Nat Rev Endocrinol 2011;7:697–9.10.1038/nrendo.2011.180Search in Google Scholar PubMed
Supplemental Material:
The online version of this article (DOI: 10.1515/cclm-2015-1094) offers supplementary material, available to authorized users.
©2016, Gian Paolo Rossi et al., published by De Gruyter.
This work is licensed under the Creative Commons Attribution-NonCommercial-NoDerivatives 3.0 License.
Articles in the same Issue
- Frontmatter
- Editorials
- The Theranos phenomenon, scientific transparency and freedom of speech
- Holotranscobalamin: in the middle of difficultly lies opportunity
- Review
- Laboratory and clinical risk assessment to treat myelodysplatic syndromes
- Mini Review
- Quantitative nucleic acid amplification by digital PCR for clinical viral diagnostics
- Genetics and Molecular Diagnostics
- Hybrid minigene splicing assay verified the pathogenicity of a novel splice site variant in the dystrophin gene of a Chinese patient with typical Duchenne muscular dystrophy phenotype
- General Clinical Chemistry and Laboratory Medicine
- Prospective validation of an automated chemiluminescence-based assay of renin and aldosterone for the work-up of arterial hypertension
- Sex steroid hormone stability in serum tubes with and without separator gels
- Reduced absorption and enhanced synthesis of cholesterol in patients with cystic fibrosis: a preliminary study of plasma sterols
- An International Standard for holotranscobalamin (holoTC): international collaborative study to assign a holoTC value to the International Standard for vitamin B12 and serum folate
- A technical and clinical evaluation of a new assay for inhibin A and its use in second trimester Down syndrome screening
- Investigation on the ability of first trimester glycodelin and angiopoietin-2 to predict small-for-gestational age pregnancies at delivery
- Plasma total C-terminal agrin fragment (tCAF) as a marker for kidney function in patients with chronic kidney disease
- Hematology and Coagulation
- Thirty-minutes’ exposure to smartphone call triggers neutrophil activation in vitro
- Performance of the XN-2000 WPC channel-flagging to differentiate reactive and neoplastic leukocytosis
- Differences in lupus anticoagulant final conclusion through clotting time or Rosner index for mixing test interpretation
- Reference Values and Biological Variations
- Derivation of level-specific reference change values (RCV) from a health screening database and optimization of their thresholds based on clinical utility
- Cancer Diagnosis
- BRAF analysis before surgery for papillary thyroid carcinoma: correlation with clinicopathological features and prognosis in a single-institution prospective experience
- Letters to the Editor
- Significant increase of serum prostate-specific antigen after exercise
- Serum delipidation but not high-speed centrifugation is effective in clearing lipemia interference in serum lipase activity measurement
- A relationship between absolute monocyte count and C-reactive protein in patients with migraine undergoing no pharmacological therapy
- Validation of the “Vacutainer® urinalysis preservative plus urine tube” for the determination of albumin and protein
- Performance evaluation of a novel automated HIV Ag/Ab chemiluminescence immunoassay
- SLC26A4 genotypes associated with enlarged vestibular aqueduct malformation in south Italian children with sensorineural hearing loss
- Is cystatin C level altered in women with polycystic ovary syndrome?
- Venous thromboembolism in a patient with persistent inhibitor to coagulation factor V – a case report
- Free light chains nephelometric assay: human urine stability in different storage conditions
- Comparing the viscoelastomeric fibrin polymerization assays FIBTEM® (ROTEM) vs. Functional Fibrinogen® (TEG): or why is a higher threshold for fibrinogen substitution better than a lower one?
- Reply to: Comparing the visco-elastomeric fibrin polymerization assays FIBTEM® (ROTEM) vs. Functional Fibrinogen® (TEG): or why is a higher threshold for fibrinogen substitution better than a lower one? By Schöchl et al.
- Congress Abstracts
- 5th Slovenian Congress of Clinical Chemistry and Laboratory Medicine