Free gas micro-/nano-bubble water: a novel dispersion system to prepare ultrasound imaging vehicles
-
Lu Jin


Abstract
Objectives
Free gas micro-/nano-bubbles (MNBs) in water have demonstrated significant potential in various industrial applications, including water treatment, enhanced transport processes, and disinfection. However, the feasibility of utilizing MNBs water as a dispersed system for preparing ultrasound imaging vehicles is seldom explored. This study aims to investigate the potential of MNBs water for this purpose.
Methods
Initially, MNBs water containing sulfur hexafluoride (SF6) was prepared and characterized. Subsequently, the potential of SF6 MNBs water to form lipid-shelled bubbles for ultrasound imaging was evaluated. This involved the incubation of lyophilized phospholipids with SF6 MNBs water.
Results
The study confirmed the presence of SF6 MNBs in water. Through the incubation process, it was possible to obtain lipid-shelled bubbles with a nano-sized and narrow size distribution. These bubbles exhibited comparable echogenicity to those produced by conventional mechanical agitation methods during the initial 5 min of in vitro observation.
Conclusions
SF6 MNBs water represents a novel dispersion medium for generating nano-sized lipid-shelled bubbles. This approach offers a promising new method for extravascular ultrasound imaging and drug delivery, potentially expanding the applications of MNBs in medical imaging and therapeutic delivery systems.
Introduction
Shelled microbubbles, with particle sizes ranging from 1 to 5 μm, have emerged as exceptional ultrasound contrast agents (UCAs) and drug delivery carriers in the biomedical field. However, their micro-sized nature restricts their ability to extravasate, limiting their targeting capacity to antigens within the vascular lumen. Recent advancements in nanoscale contrast agents, such as gas vesicles, have revolutionized ultrasound imaging [1]. These nanoscale agents, with their smaller size and enhanced stability, hold promise for more efficient drug delivery systems, particularly for targeting deep-seated cancer lesions, thereby broadening the scope of ultrasound imaging applications. Despite these advancements, the primary manufacturing strategies for nanobubbles in imaging still largely rely on the manipulation of preformed microbubbles [2]. For example, firstly the microbubbles are prepared by thin-layer evaporation, sonication, high shear emulsification, mechanical agitation (MA) and coacervation or coalescence techniques [3]. Then the nanoscaled bubbles are obtained by filtration, floatation, centrifugation and condensation methods [4], 5]. These methods, however, are time-consuming and often yield inconsistent results.
Free gas micro-/nano-bubbles water refers to micro-/nano-bubbles (MNBs) in water, belonging to bulk MNBs, contrasted with surface MNBs. Free gas MNBs water is basically prepared by gas-water circulation or pressurization-followed-by-decompression methods [6]. For example, gas can be dispersed into water through a special device to form a ‘solution’ containing micro- or nano-diameter free gas bubbles or their mixture. Generally, micro-diameter is in the range of 1–100 µm, however, nano-diameter bubbles of less than 1 µm are now termed “ultrafine bubbles” according to the International Organization for Standardization (ISO) 20,480–1:2017 [7]. MNBs water is also known as the fine bubble system to avoid confusion. It has been revealed the MNBs in the solution can exist stably for several months, longer than those milli- or submilli-meter bubbles [8]. The special characters of MNBs such as high gas solubility [9], 10], negative interfacial charge [11] and low surface tension [12], may benefit their longer lifetime in water. Because of the interesting properties of MNBs in water [13], it arouses intensively studies. MNBs water has been explored with capacities of antibacterial preservation, repair and regeneration of tissue in medical field [14]. Meanwhile, researches about MNBs water is also focused on drug development. The called artificial seawater RNS60, produced under the Taylor-Couette-Poiseuille (TCP) flow, resulted in charge-stabilized nano-structures, is consisting of water, sodium chloride (0.9 %), and oxygen (55 ± 5 ppm) gas bubbles, without any active pharmaceutical ingredients [15], 16]. Results of a phase II randomized trial in amyotrophic lateral sclerosis imply the RNS60 can improve long term survival which was correlated with the effect on respiratory function [17].
Shelled microbubbles are always composited by poor water-soluble gas core, such as sulfur hexafluoride (SF6), perfluorocarbon, and biocompatible shells, such as lipid, protein or polymer. The shelled microbubbles of SF6 has been approved globally as UCAs for applications of echocardiography and macrovascular imaging in adults and the urinary tract imaging in pediatric patients, which all show the high safety [18], 19]. Meanwhile, SF6 has become one of the preferred choices for preparing free MNBs water due to its advantages such as high chemical stability, low water solubility, high density, excellent biocompatibility, ease of preparation, and wide range of applications [20]. Since the existence and stability of free gas nanobubbles in water produced by a pump generator was confirmed experimentally [9], the potential use of MNBs water as a novel dispersion to prepare shelled nanobubbles was proposed, and their functions of ultrasound imaging were consequently studied. Herein, we firstly produced and characterized free SF6 nanobubbles using a gas-liquid mixing pump, and secondly, lipids, such as egg phosphatidylcholine (ePC) were employed as the coat materials. Next, the prepared SF6 MNBs water and lipids were incubated to form the shelled bubbles, whose capacities of ultrasound imaging were then investigated. The shelled bubbles prepared using MA method was as comparisons (Figure 1). We hope our study will display the potent use of MNBs water in pharmaceutical and biomedical imaging sciences.

Schematic diagram of experiment setup for generation of free gas bubble dispersions (a) schematic diagram of experiment setup for generation of free gas bubble dispersions. A: water; B: SF6 gas; C: Gas-liquid mixed rotary pump; D: Gas-liquid separator; E: MNBs water reservoir; F: Product of MNBs water. M: Gas flow meter; V: valve; P: Pressure gauge. (b) Schematic diagram of preparing shelled bubbles using the (I) SF6 MNBs and (II) MA methods.
Materials and methods
Materials
ePC, PC-98T, CPC>98 %, injection grade), dipalmitoylphosphatidylcholine (DPPC) and distearoylphosphatidylcholine (DSPC), were obtained from Shanghai Advanced Vehicle Technology Pharmaceutical L.T.D. Co. (AVT, Shanghai, China); PEG4k was provided from Guangdong Guanghua Sci-Tech Co., Ltd. (Shantou, China); SF6 with the purity of 99.99 % was purchased from Anhui Qiangyuan Gas Co., Ltd. (Wuhu, China); Bazedoxifene acetate was purchased from Acesys Pharmatech (Fairfield, NJ, USA). All other solvents and reagents were analytical purity and used without any purification.
Generation of SF6 MNBs water
The schematic diagram of experiment setup for generation of SF6 MNBs water was shown in Figure 1a referred to our previous work [21]. According to Figure 1, the distilled water (A) was pumped while SF6 gas (B) was adopt through a gas flow regulator (M) into a gas-liquid mixed rotary pump (C) (15WSC04, Daile, Shanghai, China) under a pressure of 0.3–0.4 MPa to make more dissolved gas in water, and after water was released under atmospheric pressure, free gas bubbles (F) will be generated. Large bubbles could be cleared through the buoyancy of stagnant flow in a gas-liquid separator, and the released nanobubbles were transported into a reservoir whose outflow was the standby product of MNBs water. The whole procedure was operated under isothermal conditions at 25 °C. The ultimate production of MNBs water can be collected after the system stably circulated for 5 min.
Meanwhile, the degassed water prepared by boiling for 30 min and cooling to room temperature was used as the control.
Characterization of SF6 MNBs water
Phenomenon of tyndall
Collected the obtained SF6 MNBs water in a small vial, and meanwhile put degassed water into another small vial as the control. At different times, used a laser pointer to illuminate either side of the degassed water or the dissolved water vial to observe whether there had Tyndall effects then judged whether there had colloidal particles in the system.
Atomic force microscope (AFM) imaging
Took a clean silicon wafer (2.2×2.2 cm2) and immersed it into freshly obtained SF6 MNBs water, then kept at room temperature for 1 h at 1 atm, took out the silicon wafer next, and left it stand at room temperature for 1 day, then the silicon wafer was fixed in a liquid pool, distilled water was added, AFM imaging with an Agilent 5500 AFM system (Agilent, Chandler, AZ) was carried out. Silicon cantilevers tip with spring constant of about 0.1 N/m was used, and scanned in Agilent AAC mode at room temperature, scanning range 2×2 μm. The obtained AFM images were processed by WSxM 5.0 software. Sample of degassed water was operated in parallel as the control.
Size distribution determination
Size distribution of particles in MNBs water was measured by Zeta-sizer Nano ZS90 (Malvern Instrument, Ltd., Co., United Kingdom). The measurement temperature was 25 °C, the equilibrium time was 10 s, the run duration was 10 s, run number was set to 11 times, measurement angle was 90°, and the intensity was selected as the ordinate. Samples including degassed water, SF6 MNBs water, 37.8 mM of sodium chloride dissolved in MNBs water, same concentration of sodium chloride dissolved in degassed water, 49.17 μM of bazedoxifenen acetate dissolved in MNBs water, same concentration of bazedoxifenen acetate dissolved in degassed water. All samples were stand for 3 h in room temperature, and then passed through 0.22 μm aqueous filter, took the successive filtrates to conduct the size assay.
Determination of surface pressure
Changes in the surface pressure (ΔΠ) of distilled water or SF6 MNBs water upon addition of DPPC as the time were measured at constant area at 25 °C in a Langmuir-Blodgett Troughs (KSV NIMA LB Troughs, Biolin Scientific, Sweden). Putting the distilled water or SF6 MNBs water (about 800 mL) into the trough, the changes with time about 8,000 s were recorded when the aqueous surface was stable and set the surface pressure of the water against the air at 0. All the values obtained were relative to that of water. DPPC solution (10 μL) in chloroform (1 mol mL−1) were spread on each sub-phase surface. Changes were recorded after 20 min to allow the organic solvent volatilized.
Changes in the surface pressure of distilled water or SF6 MNBs water upon addition of DSPC as the area were furtherly tested. The initial surface pressure was set at 0, the slide was compressed at a rate of 5 mm/min, recorded surface pressure varied with the area (A) to obtain a Π-A isotherm curve.
Prepare shelled bubbles using SF6 MNBs water
Lyophilization of lipids
ePC was dissolved in tert-butyl alcohol, while cryoprotectant, PEG4k, was dissolved in distilled water. It is followed by two phases to be mixed completely in vials with the ultimate concentrate of ePC 3 mg/mL, and mass ratios of ePC and PEG4k at 1:1 and 1:10, respectively. Then, samples were all transferred into a freeze dryer (LGJ-10E-50/-80, Beidi, Nanjing, China) immediately for 48 h to obtain the lyophilized lipids.
SF6 MNBs water incubated with lyophilized lipids
The pre-prepared SF6 MNBs water was filled into vials with freeze-dried lipids. Sealed the vials immediately and had a very slight shaking resulting ePC reconstruction completely. Then the shelled bubbles were obtained.
Prepare shelled bubbles using MA method as comparisons
MA method refers to mechanical agitation. Briefly, lyophilized lipids in vials were filled with SF6 gas where the gas pressure was kept at atmospheric pressure and sealed promptly. Before using, injected adequate distilled water into the vial, and followed by shaken vigorously using an amalgamator (YJ-100, Xinya, Hangzhou, China) to mix gas-lipids-liquid in the vial thoroughly. Then the shelled bubbles using MA method were obtained as comparisons.
Characterization of shelled bubbles
Size and size distribution
The size and size distribution of samples obtained from the two methods were tested by dynamic light scattering (DLS) using Zeta-sizer Nano ZS90. To explore the size or its distribution affected by shaking, solutions after shaking 20 and 60 s in MA method were selected. All samples were determined after their fresh preparation and diluted equally. Refractive index of polyethylene glycol was selected. Each sample was set at 30 s equilibrium time and determined with three measurements of approximately 10 runs.
Appearance and transmission electron microscope (TEM) observation
Selected the formulation of ePC/PEG4k=1:1 to prepare shelled bubbles using the two above mentioned methods, respectively. Shaking for 20 s, then observe the amount of the upper foams in a vial. Meanwhile, took the lower layer suspension to monitor the microscopic morphology under TEM (JEM-2100, JEOL, Japan).
Ultrasound imaging evaluation in vitro
Ultrasound imaging capacity of the obtained bubbles were studied in vitro. Samples were added into wells of a custom-made 3 % (w/v) agarose mold. The imaging performance were evaluated on VisualSonics micro-imaging Vevo® 2,100 systems (Fuji Film Visual Sonics Inc., USA) and a transducer of MS250 was employed. Frequency was set at 21 MHz and the acquisition contrast gain was 30 dB. All parameters were not changed throughout all imaging acquisition. Before sampling, degassed water was scanned prior to injection to confirm a clear background signal. All samples were bolus injected and be started to image immediately. The mean power data in B-mode were analyzed according to the cross section of whole well, which was set as the Region of Interest (ROI).
Statistical analysis
The Student’s t-test was used for processing statistical analysis and p value was determined via Prism 7.0 (GraphPad Software, Inc.). If p<0.05, difference was considered to be statistically significant.
Results
SF6 MNBs water exists tyndall phenomenon
We employed the Tyndall phenomenon to test whether there have particles in the system over a long period of time (∼48 h), the degassed water and the obtained SF6 MNBs water were placed in vials, respectively. Results are shown in (Figure S1, Supplementary Materials), which shows the Tyndall phenomenon observed in SF6 MNBs water groups at different times. Each time point has two photos which represent the directions of laser from right to left and from left to the right, respectively. We can see no matter which direction of the laser, SF6 MNBs waters groups (right vial in each photo in Figure S1) in every time point display the phenomenon of Tyndall, but not the groups of degassed water (left vial in each photo in Figure S1), which suggests the micro-/nano-paritcles exist in SF6 MNBs waters over 48 h. Since the experiment was carried out in sunlight, the intensity of sunlight affected the observation of Tyndall phenomenon by naked eyes. Therefore, the results only qualitatively indicate the presence of colloidal particles within two days.
SF6 MNBs water can separate out nanobubbles
When the silicon wafer is immersed into SF6 MNBs water, the bubbles will be adsorbed onto the substrate [22]. We use AFM to observe whether there are separated bubbles from water. Results of SF6 MNBs water group are shown in Figure 2. From the obtained two-dimensional and three-dimensional images in Figure 2, it can be seen that there are height changes in the range of 2×2 μm on silicon substrate, but in degassed water group it is not observed any height change, no difference from the substrate image (data not shown). Thus, the existence of gas bubbles in SF6 MNBs water was indirectly validated.

2D and 3D AFM images of SF6 MNBs water scanning range is 2×2 μm on the wafer. Degassed water cannot be detected.
The addition of NaCl or bazedoxifene will increase the size of particles in SF6 MNBs water
In this experiment, we firstly determined the particle size distribution of SF6 MNBs water and degassed water. Furtherly, if bubbles presents, the introduction of molecules such as inorganic ionic compound NaCl or organic molecular compound bazedoxifene acetate should vary the size distribution. Figure 3 shows the results particle size distribution map of SF6 MNBs water and addition of NaCl (Figure 3a) or bazedoxifene (Figure 3b). From Figure 3a, we can see most of the particle size distributed at 141.77 nm, accounting for 94.688 % of total scattering intensity. After adding sodium chloride, the particle size is distributed at 122.42–396.06 nm, indicating the particle size shifts to the right and becomes wider after NaCl addition. The introduction of the NaCl electrolyte has an effect on the bubbles distribution which results the particle size becomes larger and the distribution becomes wider. Figure 3b displays the particle size distribution of the same concentration of bazedoxifene dissolved in MNBs water and degassed water, MNBs water is still placed in Figure 3b as a refer. After the bazedoxifene added, the particle size is distributed at 164.18–255.00 nm, accounting for 66.640 % of total scattering intensity, also with size getting larger. Besides, the drug has a particle size peak at 58–68 nm when dissolved in degassed water, which may due to impurities or insoluble components in drug powder.

Size distribution map and correlation curves (a) is size distribution of pure SF6 MNBs water and SF6 MNBs water with NaCl added. (b) Is size distribution of bazedoxifene dissolved in SF6 MNBs water and degassed water, respectively. (c) Is the correlation data of SF6 MNBs water. (d) Is the correlation data of SF6 MNBs water with NaCl added. (e) Is the correlation data of SF6 MNBs water with bazedoxifene dissolved into.
Since the polydispersity index (PDI) of the MNBs water is measured to be 1, the particle size cannot be expressed by Z-Average, and can only be observed by plotting the particle size distribution curve with Intensity as the vertical axis, with further verification by Raw Correlation Data. Figure 3c–e displays the correlation coefficient curves of MNBs water (c) and its sodium chloride solution (d) and its bazedoxifene solution (e). It can be observed that the decay curves of the three are not smooth, indicating that particles larger than 1,000 nm may exist in the system, which could be micrometer-sized bubbles within the system or larger clusters of nanobubbles. The absolute values of the slopes for the three are (c)>(e), (c)>(d), showing DPI of MNBs water increases after the addition of sodium chloride and bazedoxifene, especially the group of addition of sodium chloride (Figure 3d), where the decay angle increases and the PDI increases, from which, the clustering and merging of nanobubbles can be inferred.
The addition of NaCl or bazedoxifene can actually cause bubbles aggregation or form bubble clusters [11]. Uchida et al. reported the effect of NaCl on the particle size and stability of nanobubbles in water. It was found that low concentration of NaCl can stabilize bubbles due to shielding effect, while high concentration causes bubbles to disappear [23], which was speculated the high concentrations of NaCl can thin double layers of the bubbles [24]. Although NaCl would decrease the negative zeta potential, the hydration effects caused by NaCl, may disrupt the hydrogen bonding network between MNBs water molecules [25]. In a word, the results in this section indirectly confirmed the presence of nanoscale free bubbles in the MNBs water.
Surface tension is decreased in SF6 MNBs water
In order to examine the adsorptions of lipids onto the bubble surface, surface pressure of SF6 MNBs water and upon addition of DPPC with increase of time were measured. The distilled water was comparatively operated. The results are shown in Figure 4a, it can be seen that the surface pressure at equilibrium of SF6 MNBs water is lower than that of distilled water, which is exactly consistent with the previous reports [26]. It is confirmed that surface tension of the nanobubbles dispersion was decreased [27]. The breakdown of hydrogen bonds between water molecules and ionization in the water are the main factors causing these changes [26]. Therefore, the addition of same concentration of DPPC in the bubbles dispersion would decrease the surface tension, whilst change of surface pressure could be contrarily increased in the distilled water. Immediate reduction of the surface pressure of group of DPPC added SF6 MNBs water represents excess molecules at air-water surface were less than that in group DPPC added degassed water, like the surface is stretched, which indicates there might be an overall transport of monomer from the air-water interface to the numerously existed microscopic interface in bulk [28]. Therefore, microscopic gas/water interface in bulk liquid may lower their surface tension more efficiently and the low molecular weight surfactants including the phospholipids are prone to be absorbed on the interface resulting in stabilize the bubble [29].

Surface pressure curves of different dispersions (a) is surface pressure vs. time change. The degassed water, SF6 MNBs water, and DPPC added into each were determined. (b) Represents the surface pressure vs. surface area vary. Including degassed water, SF6 MNBs water, and with DSPC added into were determined in sequence. Test temperature is 25 °C.
Figure 4b represents the results of the Π-A isotherm curve of DSPC added degassed water and SF6 MNBs water. It has been reported the surface pressure of DSPC at air-water macro interface decreases with area at 20 °C, and the phospholipid film appears in different states [30], that is, the phospholipid membrane is in a gaseous phase (gas phase, G) at 0–1.0 mN/m, is liquid expanded phase (LE) about 1.0–4.0 mN/m, and becomes liquid condensed phase (LC) at 4.0–60 mN/m, then gets into solid state (Solid phase, S) when 60–75 mN/m, and finally collapse at 75 mN/m. It can be seen from Figure 4b that as the area decreases, the monolayer phospholipid molecules in both systems undergo G, LE, LC to S, and in degassed water system it has collapse at 70 mN/m. Moreover, in the states of LC and S, the surface pressure of MNBs water system is much lower than that of degassed water at the same area, which furtherly indicates that phospholipid molecules number at macroscopic gas-liquid interface is reduced or the area occupied by a single molecule becomes larger. It may due to the phospholipid molecules transferred into the bubble interface in bulk phase.
Therefore, the presence of nanobubbles in bulk phase can effectively reduce the surface pressure. And some low-molecular-weight surfactants, including phospholipids, are adsorbed to the gas-liquid interface then stabilizing the bubbles [29]. Although phospholipid molecules are water insoluble, the presence of nanobubbles in water provides a nano gas-liquid interface that facilitates their self-assembly at interface.
SF6 MNBs water has the potent capacity to prepare nano-sized shelled bubbles
The mean particle diameter and the PDI were determined by photon correlation spectroscopy. We examined whether shaking times alter the size or the PDI of bubbles and results are presented in Figure 5. It can be seen from Figure 5a that size differences are significant between the different formulations. Compared with the ratio of 1:10 for m (ePC): m (PEG4k), the sample of group of m (ePC): m (PEG4k)=1:1, has lower size and PDI values. Meanwhile, the shaking time also influences the size distribution. In formulation of m (ePC): m (PEG4k)=1:10, MA method results in the largest size and highest PDI value when shaking for 60 s. The reason may be that increase of shaking time would enhance the possibility of bubbles collision leading to large bubbles yielded. MA method can lead to a heterogeneous size distribution of the microbubbles, which was influenced by the formulation composition, shaking strength and time [31]. Group of SF6 MNBs water has no significant differences with the group of shaking 20 s in both size and size distribution, but has lower values than those of shaking 60 s. Considering MNBs water preparation method only requires static incubation, which eliminates the size distribution differences caused by shaking, results here suggest incubation of SF6 MNBs water and lyophilized lipids is potential to obtain nano-sized and even shorter distributed shelled bubbles.

Size (a) and size distribution (b) of different formulations and shaking time 1:1 and 1:10 in each horizontal axis represented the ratios of ePC and PEG4k by weight. Shaking different times after reconstruction were investigated.
Incubation of SF6 MNBs water and lyophilized lipids results with less foams
Figure 6 shows the appearance and TEM results of selected formulation of m (ePC): m (PEG4k)=1:1 and meanwhile shaking time for 20 s. It can be seen there are large foams floating in the upper vials, which may be caused by low concentration and low repulsion of PEG4k [32]. But it appears more foams in MA group, which may relate with the shaking strength that mechanical energy generated by the shaking will provide numbers of interfaces [33] to form bubbles in the system. It thus can be inferred that shaking is easy to generate large bubbles or even foam, which will affect the common use of the product.
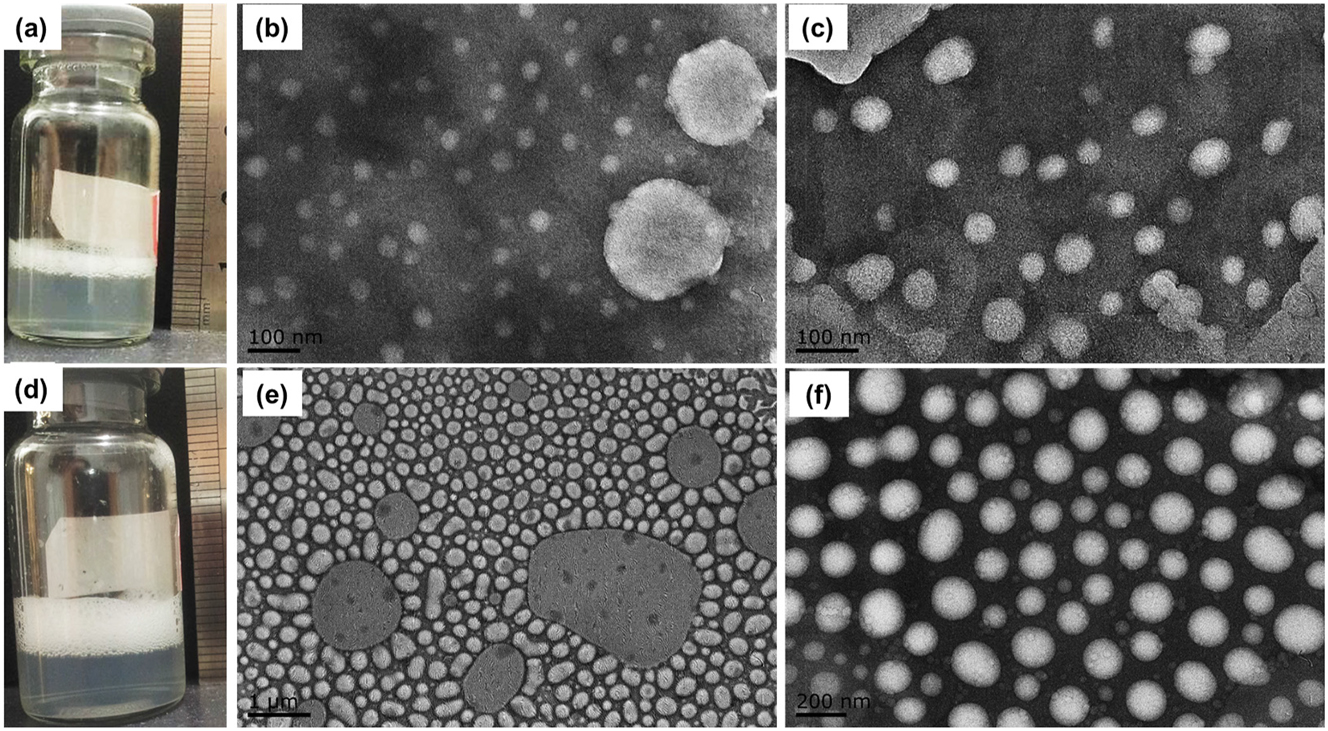
Appearance and TEM results of lipid bubbles obtained by SF6 MNBs water and MA method. Formulation of m (ePC): m (PEG4k)=1:1 was selected to investigated. (a) Is the appearance of lipid bubbles prepared by SF6 MNBs water and (b) and (c) are the TEM. (d) Is the appearance of lipid bubbles obtained by shaking method (20 s) and (e) and (f) are its TEM.
From the TEM results in Figure 6b we can see bubbles prepared by SF6 MNBs water are round shape, and there are mainly two types of bubbles, the large ones are about 200 nm, while the small micelles are about 50 nm. Figure 6c has been supplemented with TEM results of bubbles obtained using the same method but from a different field of view. As seen in Figure 6e, particles obtained by the shaking method can be seen conspicuous large particles with different sizes which internally distributed with voids that may be caused by gas. In addition, the large particles manifest with a circular or elliptical shapes. Bubble collision caused by the shaking may be one reason of ellipse. The MA method also yielded some nanobubbles with sizes around 200 nm, although no distinct gas core was observed (as shown in Figure 6f). However, as seen in Figure 6d, the MA method tends to cause collisions between bubbles, leading to fusion and the potential formation of excessive foams.
The PDI obtained by DLS method (Figure 6b) represents the behavior of the particle population, such as group of 1:1 MA method with shaking 20 s, which have a low PDI, while TEM only indicate differences in structure. It is true that the particle size distribution appears to have a certain width (Figure 6b), but multiple TEM images may be needed for statistical analysis to indicate the PDI. Secondly, TEM measurements are conducted under dry and vacuum conditions, which may lead to slight alterations in particle size. Particularly when the gas content is relatively high, the escape of gas could result in morphological changes, such as an increase in size and a more rounded shape. Additionally, for the micro-/nano-bubble system, the rising of microbubbles may also cause the possibility of deviation in the results during sampling and DLS measurement. These possibilities may contribute to discrepancies between the size distributions obtained from TEM (Figure 6) and those from DLS (Figure 5).
Lipid bubbles obtained by SF6 MNBs water has no significant difference in ultrasound imaging level with those obtained by MA method in the initial 5 min in vitro
Ultrasound imaging was evaluated by the custom-made 3 % (w/v) agarose mold. The schematic setup of ultrasound transducer was shown in Figure 7a. Formulation of m (ePC): m (PEG4k)=1:10 was selected, 1 mL of the lipid bubbles obtained by the two preparation methods (shaking time was 60 s), were added into phantom, respectively. Ultrasound imaging data were collected at 1, 2, 5 min after the samples injection. The representative B-mode and contrast images was displayed in Fig. S2 (Supplementary Material) and the B-mode mean power at each point was analyzed in Figure 7b, which quantitatively demonstrates the ultrasound imaging ability of each sample during the first 5 min. It can be seen that the gray scale of the bubbles obtained by the two methods decreases with time, and there were no significant differences between the SF6 MNBs water method and the MA method (p>0.05) in the initial 5 min in vitro, which indicates bubbles prepared by SF6 MNBs water has a promising application in enhanced ultrasound imaging. Although it has been reported that ultrasound imaging ability of the nano-sized lipid bubbles obtained by MA method is weak [34], the initial infusion of nanobubbles may contact each other closely in agarose mold, which creates a larger acoustically reflective interface.

The ultrasound contrast enhancement ability of lipid bubbles (a) schematic setup of the ultrasound imaging in vitro. (b) Gray-scale in B mode changes with time of lipid bubbles obtained by SF6 MNBs water and MA method. The formulation was m (ePC): m (PEG4k)=1:10, shaking time is 60 s, #p>0.05 (n=3, Mean ± SD).
Discussion
In this study, SF6 MNBs water was prepared using a gas-liquid mixing pump, and the existence of nanobubbles was validated by observation of the Tyndall phenomenon, atomic force microscopy, particle size analysis and surface tension determination, all of which collectively confirmed the presence and stability of nanobubbles in water.
Previous studies have employed gas-liquid mixing pumps to obtain bulk gas nanobubbles, including air [35], oxygen [9], carbon dioxide [36], nitrogen, methane, argon [37]. These nanobubbles were characterized using diverse methods [11], 22], 23], 35], [37], [38], [39], [40], consistently demonstrating the existence of gas nanobubbles in water. Together with SF6 nanobubbles studied here, it can be speculated that gas nanobubbles can be generated in water regardless of the nature of gas, such as the gas’s solubility in water. The nanobubbles are always named as ‘gas nano structures’ [41]; however, the precise arrangement of gas and water molecules at the nanoscale interface, as well as the influence of different gas molecules on bubble stability, remains an open question. Attenuated total reflectance fourier transform infrared spectroscopy analysis has identified the co-presence of dissolved and gasified states within the inner gas phase, along with hydration and gasification films at the micro-interface [6]. Despite these advancements, the stability mechanism of free bulk nanobubbles has yet to reach a consensus [42], 43]. In this study, we successfully prepared and demonstrated the generation of SF6 MNBs water; however, the specific stabilization mechanisms still require further investigation.
For shelled bubbles, the classification and concentration of the core gas, as well as the composition of the shell materials, significantly influence their physicochemical properties [44]. SF6 and perfluoropropane are commonly chosen as core gases due to the chemical inertness and low solubility in blood, which enhances lipid encapsulation and stability in the bloodstream [45]. In this study, SF6 MNBs water was incubated with lyophilized phospholipids to prepare lipid-shelled nanobubbles. SF6 MNBs water contains free nanobubbles with supersaturated gas, and it has been reported that gas in lipid-shelled nanobubbles fabricated from MNBs water is less likely to escape [46], potentially due to the lower surface tension and negative potential [47]. The balance between surface tension and electrostatic repulsion from hydroxyl ions contributes to the formation of nanobubbles with stable particle sizes [48]. The supersaturation theory provides a plausible explanation for the stability of freshly prepared MNBs [46]. The differing mechanisms of gas stability between the two preparation methods in this study, as well as the varying amounts of gas carried by the end products, likely affect their duration under ultrasound exposure. The long-term stability of shelled nanobubbles prepared from SF6 MNBs water under ultrasound may depend on a clearer understanding of the stability mechanisms of free nanobubbles in water.
Lipids with higher phase transition temperatures, such as DSPC (55 °C), can form more tightly packed shells under ultrasound radiation, creating a robust barrier that slows gas release and enhances microbubble stability [44]. Additionally, the thickness and homogeneity of the lipid shell are critical factors. PC molecules with diacyl chains of at least 16 carbons in length are known to generate stable microbubbles [45]. However, excessively thick shells may compromise microbubble flexibility and responsiveness to ultrasound stimuli. In this study, ePC, a natural phospholipid with a relatively low phase transition temperature, was used as the membrane material. While this formulation showed promise, further optimization is necessary to improve stability and performance.
PEG is a commonly used excipient in microbubble formulations, known to increase lipid shell stiffness [44]. In this study, PEG4k served dual roles as an emulsification regulator and cryoprotectant. The negative charge of PEG provided electrostatic repulsion between bubbles, while its adsorption layer on the bubble surface contributed to stabilization. However, insufficient PEG content can lead to incomplete surface coverage, are prone to bridge between adjacent bubbles, reducing spatial stability and promoting bubble aggregation [49]. In this study, a 1:1 ratio of ePC to PEG4k resulted in significant foam formation under different preparation methods (Figure 6a–d), highlighting the importance of optimizing PEG content.
The SF6 MNBs water represents a novel dispersion system, where phospholipid molecules are hypothesized to gradually adsorb and assemble at the bubble interface until saturation is reached. In the MA method, mechanical forces create gas-liquid interfaces for phospholipid adsorption. However, insufficient emulsification can lead to bubble aggregation and foam formation due to mechanical collisions. The mechanisms of phospholipid mixing and incubation in the MNBs and MA methods are summarized in Figure 8. Nevertheless, whether the molecular composition of the nanobubble interface depends on the type of loaded gas remains a scientific issue worthy of further discussion [42], as this could influence the assembly mechanism of phospholipid molecules on the bubble surface.

The mixing and incubation mechanisms of phospholipids in MNBs method (a) and MA method (b). (a) phospholipid molecules are gradually adsorbing and assembling at the interface of the free bubbles to form the encapsulated bubbles. (b) MA method uses mechanical force to mix the gas and liquid, creating interfaces where phospholipids adsorb onto. However, when the emulsifying capacity is insufficient, vigorous shaking can accelerate the collision of bubbles to form foam.
Beyond shell characteristics, the acoustic response of bubbles is highly dependent on their size [50]. Nanobubbles exhibit a strong nonlinear response to ultrasound, which is crucial for contrast-enhanced ultrasound imaging. The degree of nonlinear oscillations of nanobubbles is determined by ultrasound exposure parameters, including frequency and pressure. Nanobubbles are predicted to resonate at higher frequencies than microbubbles [51]. Meanwhile, high resonance frequency was reported to enable nanobubbles to remain stable in the bloodstream for longer periods than microbubbles [52]. However, the relationship between nanobubble size and optimal ultrasound frequency requires further investigation. Additionally, the development of functionally targeted nanobubbles, which concentrate at specific sites to enhance imaging and therapeutic efficacy, remains an area of active research [47], 53].
The bubble concentration distribution after reconstitution and shaking is a key parameter that directly affects the ultrasound imaging performance. Taking Lumason® as an example, after the MA, the bubble size distribution is mainly concentrated in the range of 1–10 μm, with an average diameter of approximately 2.5 μm. The bubble concentration distribution typically shows a unimodal or bimodal pattern [54].
The gas-to-liquid ratio, phospholipid type, and concentration significantly influence bubble stability and size distribution. Higher phospholipid concentrations tend to generate smaller bubbles, while PEG4k can further modulate bubble size and concentration. These factors provide valuable insights for optimizing the preparation of stable SF6 nanobubbles using the MNBs method. While the MA method inherently produces polydisperse lipid bubbles due to its vibration and shear emulsification process. Obviously, excessive shaking may lead to bubble rupture, while insufficient shaking may result in inadequate bubble formation [50]. However, the MNBs method offers the advantage of a narrow particle size distribution; size of shelled bubbles may depend on the pre-formed free nanobubble in water. This characteristic may hold great potential for the preparation of lipid nanobubbles as extravascular theranostic carriers with enhanced stability in ultrasonic biomedical applications. Future efforts should focus on optimizing formulation parameters, such as gas-to-liquid ratios and phospholipid composition, to minimize bubble collisions and fusion, thereby improving the uniformity and stability of nanobubble preparations.
Conclusions
Based on the comprehensive experimental findings, this study demonstrates that SF6 MNBswater, prepared through gas-liquid mixing pump technology, represents a significant advancement in nanobubble-based dispersing systems. The Tyndall phenomenon observed in SF6 MNBs water, along with its ability to spontaneously separate nanobubbles, confirms the formation of a stable colloidal system. Notably, the system’s unique properties, including reduced surface tension and the capacity to generate nano-sized shelled bubbles with narrow distribution width, establish SF6 MNBs water as a promising platform for biomedical applications. The particle size modulation capability through NaCl or bazedoxifene addition further enhances its versatility in formulation design. Particularly significant is the system’s performance in ultrasound imaging, where lipid bubbles prepared using SF6 MNBs water demonstrated comparable initial imaging quality to those produced by conventional MA methods, while simultaneously exhibiting improved foam control during lyophilized lipid incubation. These findings not only validate SF6 MNBs water has the potent as an efficient alternative for preparing ultrasound contrast agents but also open new possibilities for its application in targeted drug delivery systems. The technology offers a robust foundation for developing next-generation extravascular ultrasound imaging agents and therapeutic delivery platforms, potentially revolutionizing current approaches in diagnostic imaging and targeted therapy.
Funding source: Research Innovation Program for College Graduates of Jiangsu Province
Award Identifier / Grant number: KYLX15_0219
-
Research ethics: Not applicable.
-
Informed consent: Not applicable.
-
Author contributions: Lu Jin (Data curation; Software; Writing). Zhen Yang (Data curation; Investigation; Methodology; Visualization; Writing). Xu Wang (Investigation; Writing). Shixiao Wan (Data curation; Investigation; Methodology; Software). Huanhuan Zhao (Resources; Validation). Ying Zhang (Data curation). Juan Jin (Investigation; Methodology). Jilai Tian (Conceptualizationl; Data curation; Formal analysis; Investigation; Methodology; Project administration; Supervision). The authors have accepted responsibility for the entire content of this manuscript and approved its submission.
-
Use of Large Language Models, AI and Machine Learning Tools: None declared.
-
Conflict of interest: The authors declare no conflict of interest.
-
Research funding: This investigation was financially funded by Research Innovation Program for College Graduates of Jiangsu Province (No. KYLX15_0219).
-
Data availability: All data that support the findings of this study are included within the article. The raw data can be obtained on request from the corresponding author.
References
1. Wang, J, Wang, Y, Zhong, L, Yan, F, Zheng, H. Nanoscale contrast agents: a promising tool for ultrasound imaging and therapy. Adv Drug Deliv Rev 2024;207:115200. https://doi.org/10.1016/j.addr.2024.115200.Search in Google Scholar PubMed
2. Fournier, L, de La Taille, T, Chauvierre, C. Microbubbles for human diagnosis and therapy. Biomaterials 2023;294:122025. https://doi.org/10.1016/j.biomaterials.2023.122025.Search in Google Scholar PubMed
3. Stride, E, Edirisinghe, M. Novel microbubble preparation technologies. Soft Matter 2008;4:2350–9. https://doi.org/10.1039/b809517p.Search in Google Scholar
4. Krupka, TM, Solorio, L, Wilson, RE, Wu, H, Azar, N, Exner, AA. Formulation and characterization of echogenic lipid - pluronic nanobubbles. Molecilar Pharm 2010;7:49–59. https://doi.org/10.1021/mp9001816.Search in Google Scholar PubMed PubMed Central
5. Cai, WB, Yang, HL, Zhang, J, Yin, JK, Yang, YL, Yuan, LJ, et al.. The optimized fabrication of nanobubbles as ultrasound contrast agents for tumor imaging. Sci Rep 2015;5:13725.10.1038/srep13725Search in Google Scholar PubMed PubMed Central
6. Khuntia, S, Majumder, SK, Ghosh, P. Microbubble-aided water and wastewater purification: a review. Rev Chem Eng 2012;28:191–221. https://doi.org/10.1515/revce-2012-0007.Search in Google Scholar
7. Fine bubble technology — general principles for usage and measurement of fine bubbles — Part 1: terminology. Int Stand 2017;06. ISO 20480 1.Search in Google Scholar
8. Agarwal, A, Ng, WJ, Liu, Y. Principle and applications of microbubble and nanobubble technology for water treatment. Chemosphere 2011;84:1175–80. https://doi.org/10.1016/j.chemosphere.2011.05.054.Search in Google Scholar PubMed
9. Ushikubo, FY, Furukawa, T, Nakagawa, R, Enari, M, Makino, Y, Kawagoe, Y, et al.. Evidence of the existence and the stability of nano-bubbles in water. Colloids Surfaces A Physicochem Eng Asp 2010;361:31–7. https://doi.org/10.1016/j.colsurfa.2010.03.005.Search in Google Scholar
10. Weijs, JH, Seddon, JRT, Lohse, D. Diffusive shielding stabilizes bulk nanobubble clusters. ChemPhysChem 2012;13:2197–204. https://doi.org/10.1002/cphc.201100807.Search in Google Scholar PubMed
11. Bunkin, NF, Shkirin, AV, Suyazov, NV, Babenko, VA, Sychev, AA, Penkov, NV, et al.. Formation and dynamics of ion-stabilized gas nanobubble phase in the bulk of aqueous NaCl solutions. J Phys Chem B 2016;120:1291–303. https://doi.org/10.1021/acs.jpcb.5b11103.Search in Google Scholar PubMed
12. Ducker, WA. Contact angle and stability of interfacial nanobubbles. Langmuir 2009;25:8907–10. https://doi.org/10.1021/la902011v.Search in Google Scholar PubMed
13. Temesgen, T, Bui, TT, Han, M, Kim, Til, Park, H. Micro and nanobubble technologies as a new horizon for water-treatment techniques: a review. Adv Colloid Interface Sci 2017;246:40–51. https://doi.org/10.1016/j.cis.2017.06.011.Search in Google Scholar PubMed
14. Mano, Y. Medical field medical application of nanobubble Water. In: Tsuge, H, editor. Micro- and nanobubbles: Fundamentals and applications. New York: Pan Stanford Publishing Pte. Ltd.; 2014:317–30 pp.Search in Google Scholar
15. Vallarola, A, Sironi, F, Tortarolo, M, Gatto, N, De Gioia, R, Pasetto, L, et al.. RNS60 exerts therapeutic effects in the SOD1 ALS mouse model through protective glia and peripheral nerve rescue. J Neuroinflammation 2018;15:65. https://doi.org/10.1186/s12974-018-1101-0.Search in Google Scholar PubMed PubMed Central
16. Rao, VTS, Khan, D, Jones, RG, Nakamura, DS, Kennedy, TE, Cui, QL, et al.. Potential benefit of the charge-stabilized nanostructure saline RNS60 for myelin maintenance and repair. Sci Rep 2016;6:30020. https://doi.org/10.1038/srep30020.Search in Google Scholar PubMed PubMed Central
17. Pupillo, E, Bianchi, E, Bonetto, V, Pasetto, L, Bendotti, C, Paganoni, S, et al.. Long-term survival of participants in a phase II randomized trial of RNS60 in amyotrophic lateral sclerosis. Brain Behav Immun 2024;122:456–62. https://doi.org/10.1016/j.bbi.2024.08.044.Search in Google Scholar PubMed
18. Shang, Y, Xie, X, Luo, Y, Nie, F, Luo, Y, Jing, X, et al.. Safety findings after intravenous administration of sulfur hexafluoride microbubbles to 463,434 examinations at 24 centers. Eur Radiol 2023;33:988–95. https://doi.org/10.1007/s00330-022-09108-4.Search in Google Scholar PubMed
19. Torres, A, Koskinen, SK, Gjertsen, H, Fischler, B. Contrast-enhanced ultrasound using sulfur hexafluoride is safe in the pediatric setting. Acta Radiol 2017;58:1395–9. https://doi.org/10.1177/0284185117690423.Search in Google Scholar PubMed
20. Jin, J, Feng, Z, Yang, F, Gu, N. Bulk nanobubbles fabricated by repeated compression of microbubbles. Langmuir 2019;35:4238–45. https://doi.org/10.1021/acs.langmuir.8b04314.Search in Google Scholar PubMed
21. Tian, J, Yang, F, Cui, H, Zhou, Y, Ruan, X, Gu, N. A novel approach to making the gas-filled liposome real: based on the interaction of lipid with free nanobubble within the solution. ACS Appl Mater Interfaces 2015;7:26579–84. https://doi.org/10.1021/acsami.5b07778.Search in Google Scholar PubMed
22. Matsuno, H, Ohta, T, Shundo, A, Fukunaga, Y, Tanaka, K. Simple surface treatment of cell-culture scaffolds with ultrafine bubble water. Langmuir 2014;30:15238–43. https://doi.org/10.1021/la5035883.Search in Google Scholar PubMed
23. Uchida, T, Liu, S, Enari, M, Oshita, S, Yamazaki, K, Gohara, K. Effect of NaCl on the lifetime of micro- and nanobubbles. Nanomaterials 2016;6:31. https://doi.org/10.3390/nano6020031.Search in Google Scholar PubMed PubMed Central
24. Alam, HS, Sutikno, P, Soelaiman, TAF, Sugiarto, AT. A diffused double-layer model of bulk nanobubbles in aqueous NaCl solutions. Therm Sci Eng Prog 2024;50:102590. https://doi.org/10.1016/j.tsep.2024.102590.Search in Google Scholar
25. Feng, M, Ma, X, Zhang, Z, Luo, KH, Sun, C, Xu, X. How sodium chloride extends lifetime of bulk nanobubbles in water. Soft Matter 2022;18:2968–78. https://doi.org/10.1039/d2sm00181k.Search in Google Scholar PubMed
26. Parmar, R, Majumder, SK. Microbubble generation and microbubble-aided transport process intensification-A state-of-the-art report. Chem Eng Process Process Intensif 2013;64:79–97. https://doi.org/10.1016/j.cep.2012.12.002.Search in Google Scholar
27. Yasui, K, Tuziuti, T, Kanematsu, W. Mechanism of the decrease in surface tension by bulk nanobubbles (ultrafine bubbles). Langmuir 2023;39:16574–83. https://doi.org/10.1021/acs.langmuir.3c02545.Search in Google Scholar PubMed
28. Eastoe, J, Dalton, JS. Dynamic surface tension and adsorption mechanisms of surfactants at the air-water interface. Adv Colloid Interface Sci 2000;85:103–44. https://doi.org/10.1016/s0001-8686(99)00017-2.Search in Google Scholar PubMed
29. Bos, MA, Van Vliet, T. Interfacial rheological properties of adsorbed protein layers and surfactants: a review. Adv Colloid Interface Sci 2001;91:437–71. https://doi.org/10.1016/s0001-8686(00)00077-4.Search in Google Scholar PubMed
30. Kubo, I, Adachi, S, Maeda, H, Seki, A. Phosphatidylcholine monolayers observed with Brewster angle microscopy and π-A isotherms. Thin Solid Films 2001;393:80–5. https://doi.org/10.1016/s0040-6090(01)01101-4.Search in Google Scholar
31. Counil, C, Abenojar, E, Perera, R, Exner, AA. Extrusion: a new method for rapid formulation of high-yield, monodisperse nanobubbles. Small 2022;18:2200810. https://doi.org/10.1002/smll.202200810.Search in Google Scholar PubMed PubMed Central
32. Peng, Q, Zhang, ZR, Gong, T, Chen, GQ, Sun, X. A rapid-acting, long-acting insulin formulation based on a phospholipid complex loaded PHBHHx nanoparticles. Biomaterials 2012;33:1583–8. https://doi.org/10.1016/j.biomaterials.2011.10.072.Search in Google Scholar PubMed
33. Rodríguez Patino, JM, Carrera Sánchez, C, Rodríguez Niño, MR. Implications of interfacial characteristics of food foaming agents in foam formulations. Adv Colloid Interface Sci 2008;140:95–113. https://doi.org/10.1016/j.cis.2007.12.007.Search in Google Scholar PubMed
34. Díaz-López, R, Tsapis, N, Santin, M, Bridal, SL, Nicolas, V, Jaillard, D, et al.. The performance of PEGylated nanocapsules of perfluorooctyl bromide as an ultrasound contrast agent. Biomaterials 2010;31:1723–31. https://doi.org/10.1016/j.biomaterials.2009.11.044.Search in Google Scholar PubMed
35. Ebina, K, Shi, K, Hirao, M, Hashimoto, J, Kawato, Y, Kaneshiro, S, et al.. Oxygen and air nanobubble water solution promote the growth of plants, fishes, and mice. PLoS One 2013;8:e65339. https://doi.org/10.1371/journal.pone.0065339.Search in Google Scholar PubMed PubMed Central
36. Oh, SH, Kim, JM. Generation and stability of bulk nanobubbles. Langmuir 2017;33:3818–23. https://doi.org/10.1021/acs.langmuir.7b00510.Search in Google Scholar PubMed
37. Ohgaki, K, Khanh, NQ, Joden, Y, Tsuji, A, Nakagawa, T. Physicochemical approach to nanobubble solutions. Chem Eng Sci 2010;65:1296–300. https://doi.org/10.1016/j.ces.2009.10.003.Search in Google Scholar
38. Uchida, T, Oshita, S, Ohmori, M, Tsuno, T, Soejima, K, Shinozaki, S, et al.. Transmission electron microscopic observations of nanobubbles and their capture of impurities in wastewater. Nanoscale Res Lett 2011;6:295. https://doi.org/10.1186/1556-276x-6-295.Search in Google Scholar
39. Li, M, Tonggu, L, Zhan, X, Mega, TL, Wang, L. Cryo-EM visualization of nanobubbles in aqueous solutions. Langmuir 2016;32:11111–15.10.1021/acs.langmuir.6b00261Search in Google Scholar PubMed
40. Kobayashi, H, Maeda, S, Kashiwa, M, Fujita, T. Measurement and identification of ultrafine bubbles by resonant mass measurement method. Proc SPIE 2014;9232:92320S. https://doi.org/10.1117/12.2064811.Search in Google Scholar
41. Ivannikov, MV, Sugimori, M, Llinás, RR. Neuromuscular transmission and muscle fatigue changes by nanostructured oxygen. Muscle Nerve 2017;55:555–63. https://doi.org/10.1002/mus.25248.Search in Google Scholar PubMed
42. Wang, X, Li, P, Ning, R, Ratul, R, Zhang, X, Ma, J. Mechanisms on stability of bulk nanobubble and relevant applications: a review. J Clean Prod 2023;426:139153. https://doi.org/10.1016/j.jclepro.2023.139153.Search in Google Scholar
43. Chen, Y, Hu, Y, Wang, B, Chu, X, Zhang, LW. Interfacial thermal fluctuations stabilize bulk nanobubbles. Phys Rev Lett 2024;133:104001. https://doi.org/10.1103/PhysRevLett.133.104001.Search in Google Scholar PubMed
44. Omata, D, Unga, J, Suzuki, R, Maruyama, K. Lipid-based microbubbles and ultrasound for therapeutic application. Adv Drug Deliv Rev 2020;154–155:236–44. https://doi.org/10.1016/j.addr.2020.07.005.Search in Google Scholar PubMed
45. Al-Jawadi, S, Thakur, SS. Ultrasound-responsive lipid microbubbles for drug delivery: a review of preparation techniques to optimise formulation size, stability and drug loading. Int J Pharm 2020;585:119559. https://doi.org/10.1016/j.ijpharm.2020.119559.Search in Google Scholar PubMed
46. Tian, J, Wan, S, Tian, J, Liu, L, Xia, J, Hu, Y, et al.. Anti-HER2 scFv-nCytc-modified lipid-encapsulated oxygen nanobubbles prepared with bulk nanobubble water for inducing apoptosis and improving photodynamic therapy. Small 2023;19:2206091. https://doi.org/10.1002/smll.202206091.Search in Google Scholar PubMed
47. Foudas, AW, Kosheleva, RI, Favvas, EP, Kostoglou, M, Mitropoulos, AC, Kyzas, GZ. Fundamentals and applications of nanobubbles: a review. Chem Eng Res Des 2023;189:64–86. https://doi.org/10.1016/j.cherd.2022.11.013.Search in Google Scholar
48. Satpute, PA, Earthman, JC. Hydroxyl ion stabilization of bulk nanobubbles resulting from microbubble shrinkage. J Colloid Interface Sci 2021;584:449–55. https://doi.org/10.1016/j.jcis.2020.09.100.Search in Google Scholar PubMed
49. So, H, Fawcett, AS, Sheardown, H, Brook, MA. Surface-active copolymer formation stabilizes PEG droplets and bubbles in silicone foams. J Colloid Interface Sci 2013;390:121–8. https://doi.org/10.1016/j.jcis.2012.09.017.Search in Google Scholar PubMed
50. Cavalieri, F, Zhou, M, Tortora, M, Lucilla, B, Ashokkumar, M. Methods of preparation of multifunctional microbubbles and their in vitro/in vivo assessment of stability, functional and structural properties. Curr Pharm Des 2012;18:2135–51. https://doi.org/10.2174/138161212800099874.Search in Google Scholar PubMed
51. Wegierak, D, Nittayacharn, P, Cooley, MB, Berg, FM, Kosmides, T, Durig, D, et al.. Nanobubble contrast enhanced ultrasound imaging: a review. Wiley Interdiscip Rev Nanomed Nanobiotech 2024;16:e2007. https://doi.org/10.1002/wnan.2007.Search in Google Scholar PubMed PubMed Central
52. Sharma, Y, Ohl, CD, Rosselló, JM. Nanobubble nucleation by pulsed laser illumination of colloidal gold nanoparticles. Sci Rep 2024;14:30491. https://doi.org/10.1038/s41598-024-81831-y.Search in Google Scholar PubMed PubMed Central
53. Tian, J, Wan, S, Yang, Z, Wang, M, Zhou, W, Wo, G, et al.. PDL1/HER2-targeted lipid-encapsulated oxygen nanobubbles combined with photodynamic therapy for HER2(+) breast cancer immunotherapy. Adv Healthcare Mater 2024;13:2400030. https://doi.org/10.1002/adhm.202400030.Search in Google Scholar PubMed
54. Schneider, M. SonoVue, a new ultrasound contrast agent. Eur Radiol 1999;9:S347–8. https://doi.org/10.1007/pl00014071.Search in Google Scholar PubMed
Supplementary Material
This article contains supplementary material (https://doi.org/10.1515/bmt-2024-0280).
© 2025 the author(s), published by De Gruyter, Berlin/Boston
This work is licensed under the Creative Commons Attribution 4.0 International License.
Articles in the same Issue
- Frontmatter
- Research Articles
- Design and optimization of a high-definition transcranial electrical stimulation device with envelope wave
- Free gas micro-/nano-bubble water: a novel dispersion system to prepare ultrasound imaging vehicles
- MEMS-based narrow-bandwidth magnetic field sensors: preliminary assessment of prototypes regarding coercivity, remanence, and sensitivity
- Novel low-cost approach to build large-scale flexible sensors for spatially distributed ground reaction force measurements
- Does helical plating for proximal humeral shaft fractures benefit bone healing? – an in silico analysis in fracture healing
- Meta-analysis of animal experiments on osteogenic effects of trace element doped calcium phosphate ceramic/PLGA composites
- Classification of anemic condition based on photoplethysmography signals and clinical dataset
- Improving the cleaning quality of tube lumen instruments by imaging analysis and deep learning techniques
- Machine learning prediction of effective radiation doses in various computed tomography applications: a virtual human phantom study