A review of beat-to-beat vectorcardiographic (VCG) parameters for analyzing repolarization variability in ECG signals
-
Muhammad A. Hasan
 and
Derek Abbott
and
Derek Abbott

Abstract
Elevated ventricular repolarization lability is believed to be linked to the risk of ventricular tachycardia/ventricular fibrillation. However, ventricular repolarization is a complex electrical phenomenon, and abnormalities in ventricular repolarization are not completely understood. To evaluate repolarization lability, vectorcardiography (VCG) is an alternative approach where the electrocardiographic (ECG) signal can be considered as possessing both magnitude and direction. Recent research has shown that VCG is advantageous over ECG signal analysis for identification of repolarization abnormality. One of the key reasons is that the VCG approach does not rely on exact identification of the T-wave offset, which improves the reproducibility of the VCG technique. However, beat-to-beat variability in VCG is an emerging area for the investigation of repolarization abnormality though not yet fully realized. Therefore, the purpose of this review is to explore the techniques, findings, and efficacy of beat-to-beat VCG parameters for analyzing repolarization lability, which may have potential utility for further study.
Introduction
The biological signals are generated within the human body through different physiological processes. These signals are usually acquired in their raw form, and therefore, it is required to carry out signal processing and analysis to reveal pertinent details. In the case of an electrocardiographic (ECG) signal, the signal contains amplitude information without orientation of the heart vector direction. In clinical practice, the QT interval is measured as the duration of onset of Q wave and the offset of T wave in the heart’s ECG electrical cycle, which represents the global electrical repolarization of the ventricles. Note that QT-interval variability analysis from a single ECG beat demonstrates the static picture of repolarization abnormalities, but the beat-to-beat QT interval variability (QTV) establishes the dynamic changes of the QT interval duration and repolarization labilities. Elevated beat-to-beat QTV is of interest as it has been associated with increased cardiovascular morbidity and mortality [10, 41, 42, 66, 72].
However, recent findings suggest that beat-to-beat QTV varies between leads in 12-lead ECG, where partial factors contributing to these QTV variations can be realized through the study of T-wave amplitude [37, 40, 41]. In particular, the magnitude and temporal pattern of beat-to-beat QTV varies significantly between leads in 12-lead ECG. Therefore, quantification of QTV in different leads is associated with their respective ECG leads. Consequently, QTV data from different studies in different leads may lead to inconsistencies. Thus, caution must be taken when comparing QTV results obtained from different leads across studies. Therefore, another modality called vector electrocardiography [or vectorcardiography (VCG)] may be useful for the analysis of dynamic changes of repolarization abnormalities. Here, VCG measures cardiac electrical forces with both magnitude and vectorial direction; it may be thought of as a methodological elaboration of the ECG.
These electrical forces are generated by billions of cardiac cells in the heart that can be modeled as a continuous series of vectors that form a resultant. Moreover, VCG aims at a spatial representation that reflects the electrical activity of the heart in the three (perpendicular directions of X, Y, and Z) spatial planes as shown in Figure 1. Note that VCG allows the concept of a dipole originated in the heart and uses orthogonal leads that define these three spatial planes: frontal, horizontal, and sagittal [31]. By contrast, the standard 12-lead ECG represents only the one-dimensional scalar value of the heart function, i.e., it represents only the magnitude and not the direction or spatial information of heart signal. Improved understanding for analysis and characterization of heart signals by considering both direction and magnitude of the ECG signals as a three-dimensional phenomenon may be then possible using techniques based on VCG.
![Figure 1: The basic principle of vectorcardiography (after [31]).Electrical activity of the heart in the three perpendicular directions X, Y, and Z. The P, QRS, and T wave loops are observed in three different planes (sagittal, frontal, and horizontal).](/document/doi/10.1515/bmt-2015-0005/asset/graphic/j_bmt-2015-0005_fig_001.jpg)
The basic principle of vectorcardiography (after [31]).
Electrical activity of the heart in the three perpendicular directions X, Y, and Z. The P, QRS, and T wave loops are observed in three different planes (sagittal, frontal, and horizontal).
Further, by observing QRS- and T-wave loops, we may obtain extra features, and this is of benefit for further observation and analysis during the progress of the ventricle activation front. This is because it may require a longer time for the evolution of the activation front to proceed throughout the ventricular mass of the heart [62]. In addition, using VCG loops, it is easier to observe the direction and magnitude of the heart vector. Usually, recorded ECG cannot explain both the direction and magnitude of the heart vector. However, to observe the direction and magnitude of the heart vector, the VCG signal is required. Now, the VCG signal can be directly recorded via the Frank lead system or can be derived from the ECG signal using a transform method [singular value decomposition (SVD) or inverse Dower transform (IDT)] or via matrix coefficients (Kors). In addition, VCG loops may have clinical importance for detecting cardiac diseases such as myocardial infarction or myocardial injury in coronary surgery over conventional ECG analysis [19, 94], which is not easy to observe from a scalar ECG signal. Therefore, it has been proposed over recent decades by various researchers that VCG has significant utility compared to the standard 12-lead standard ECG [13, 14, 60, 84]. As VCG represents the spatial and temporal information of the heart action, it is thought to be a very promising tool for diagnosis of heart diseases [12, 73, 93, 96] and also can be extended as a marker for biometrics [1].
Therefore, this paper focuses on a review of techniques, findings, and efficacy of beat-to-beat VCG approach for analyzing repolarization abnormalities.
Synthesis of VCG
VCG from Frank (X, Y, and Z) lead
For clinical studies, the VCG signal is recorded directly from the surface of the body. However, in older studies, VCG was recorded from the body using a special approach that directly provided the three orthogonal components of the dipole vector, based on the Frank VCG lead system [25]. This system consists of seven electrodes. There are five electrodes in the transverse plane; one electrode is on the back of the neck and one on the left foot, as shown in Figure 2. By utilizing the Frank VCG lead system, a three-dimensional representation of electrical heart activity can be found directly by measuring ECG in three different directions (Figure 2), i.e., right-to-left (X-axis), head-to-feet (Y-axis), and front-to-back (Z-axis).
![Figure 2: Frank VCG lead system (adapted after [1]).The Frank VCG lead system consists of seven unipolar electrodes, and signals are viewed in three (X, Y, and Z) directions.](/document/doi/10.1515/bmt-2015-0005/asset/graphic/j_bmt-2015-0005_fig_002.jpg)
Frank VCG lead system (adapted after [1]).
The Frank VCG lead system consists of seven unipolar electrodes, and signals are viewed in three (X, Y, and Z) directions.
There are a number of reasons why the Frank VCG lead system is no longer used for clinical practice, mainly due to its non-standard lead configuration. Hence, an important current issue is to derive VCG from standard 12-lead ECG for improving diagnosis of heart signals. Although, a study demonstrated quantitatively for deriving VCG signal using the non-linear optimization technique from three-lead ECG (I, II, V2), which is believed to have higher correlation with the corresponding measured scalar leads [77]. However, this study needs further research for deriving beat-to-beat VCG signal from multiple databases, as the technique is based on a median beat of three-lead ECG.
VCG from 12-lead ECG
To derive VCG from standard 12-lead ECG, several techniques have been proposed [33, 63, 78, 79]. However, existing methods are limited and not yet standardized. One of the techniques suggested by Edenbrandt and Pahlm [23] is called the IDT, which is the pseudo-inverse of the matrix proposed by Dower [22]. Another technique was introduced by Kors et al. [54] for synthesizing the VCG from standard 12-lead ECG. These simple estimated transformation matrices are most commonly used to synthesize the VCG from 12-lead ECG. However, a number of studies have investigated the reliability of these estimated matrices, where the findings showed that this type of transformation has a number of limitations in achieving orthogonal VCG reconstruction [32, 33, 63]. The main problem of the proposed transform matrices is due to estimation during reconstruction that gives rise to potential information loss or even unwanted information. Furthermore, the derived orthogonal leads from 12-lead ECG by applying these matrices may differ from those obtained from the actual VCG leads.
However, an alternative technique using SVD is suggested by Acar and Koymen [2] for deriving the VCG from 12-lead standard ECG for a single ECG beat. Here, the SVD is applied to the eight independent leads (I, II, V1, V2, V3, V4, V5, and V6) of the standard 12-lead ECG configuration to obtain eight decomposed signals. The first three decomposed signals comprise an ECG dipole (see Figure 3), and 99% of the ECG energy can be represented in a three-dimensional minimum subspace [2], which are similar to the orthogonal components obtained from the Frank VCG. However, the method of Acar et al. [3], for single ECG beat analysis, does not provide detailed analysis on a beat-by-beat basis and does not completely provide the characteristics of beat-to-beat VCG based analysis. This is an issue as cardiac electrical activity is not regular or stationary but has non-linear characteristics. Therefore, to address this problem, our recent article [39] considered and extended beat-to-beat VCG analysis by employing an SVD approach, which was introduced by Acar and Koymen [2]. For extracting the beat-to-beat QT intervals, we have used the T-wave template matching algorithm proposed by Berger et al. [10]. We computed the beat-to-beat QT interval for each individual lead in 12-lead ECGs by adopting an approach that has been previously described [40]. Thus, we are able to obtain beat-to-beat QRS- and T-wave signals from standard 12-lead ECGs for beat-to-beat VCG analysis.

Eight independent leads.
Eight independent leads as input (top left) and eight decomposed ECG signal (top right) for a single-beat ECG after applying SVD transformation. The QRS and T wave loop for a single-beat ECG (bottom), where arrow refers the main vector of QRS and T wave.
Moreover, in the reconstructed VCG, the signals are resolved into three components (X, Y, and Z directions). These three orthogonal signals facilitate the construction of ventricular depolarization (QRS wave) and the repolarization (T wave) loop (see Figure 3) for various VCG-based parameter extractions. These parameters and indices may be essential factors for characterizing the temporal and spatial changes in the QRS and T loops in ventricular depolarization and repolarization.
VCG-based parameters
Several VCG-based parameters were proposed in last few decades for identifying and characterizing various cardiac patients [3, 39, 50, 58, 68, 96, 97]. A brief description of several VCG-based parameters is given below.
Total cosine R to T
Total cosine R to T (TCRT) measures the vector deviation between the depolarization and the repolarization waves by calculating cosine values between the dominant QRS loop vectors and the main T-wave loop vectors within the optimized decomposition space [3]. Note that TCRT values are limited to the range of -1 to +1 range. Minus one corresponds to an angle of 180°, indicating that the QRS- and T-wave loops are pointing in opposite directions. By contrast, +1 corresponds to an angle of 0°, indicating that the QRS- and T-wave loops are pointing at the same direction. In [3], the mean value of TCRT was found to be negative in hypertrophic cardiomyopathy (HCM) patients but positive in healthy subjects. The negative TCRT value in HCM patients indicates increased deviation between repolarization (QRS) and depolarization (T) waves in terms of their principal direction in a three-dimensional time-orthogonal space.
T-wave morphology dispersion
T-wave morphology dispersion (TMD) represents the variation of morphology of T-waves between different ECG leads during complete ventricular repolarization [3]. It is computed as the average of angles between all possible pairs of the reconstruction vector, as shown in Figure 4. A small TMD value implies the reconstruction vectors of different ECG leads are close to each other or T-wave morphologies in different ECG leads are similar. The TMD is defined as the mean of all θij excluding V1 as follows:
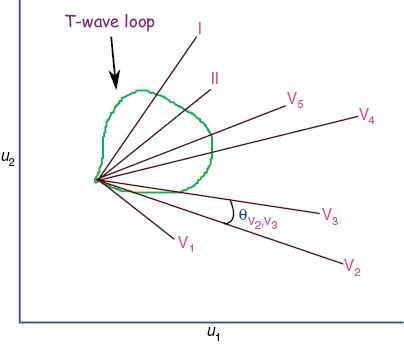
T-wave morphology dispersion.
Projection of different constructed ECG leads on u1 and u2 planes for T-wave loop.
In the study by Acar et al. [3], a significantly increased TMD value was observed in HCM patients compared to healthy subjects, which basically reflects the spatial and temporal variations of repolarization (T-wave) pattern in HCM patients.
Percentage of loop area
Generally, percentage of loop area (PL) is computed as the ratio of the T-wave loop area to the area of the surrounding rectangle, where the rectangular area is divided into 100 equal rectangular cells, as shown in Figure 5. This parameter defines the regularity of the T-wave loop [3]. For large PL, the T-wave loop is considered to be smooth and connected, but a lower value of PL is due to a more irregular T-wave loop. A higher PL value was found in healthy subjects compared to HCM patients that indicates a smooth and connected T-wave loop (not crossing itself) in normal ECGs compared to HCM ECGs [3].
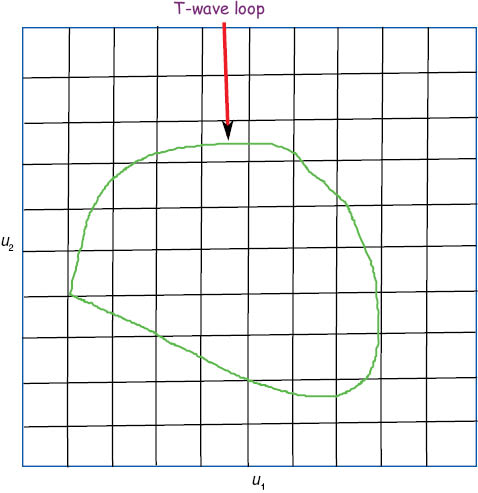
Percentage of loop area (PL).
Projection of T-wave loop on u1 and u2 planes.
Lead dispersion
Lead dispersion (LD) measures temporal variation in inter-lead relationships during ventricular repolarization [3]. This is the measurement of the temporal homogeneity of the propagation of the repolarization wave. If the value of LD is significantly different between two groups of subjects, then T-wave loops are discriminative. In the study by Acar et al. [3], the mean values of LD were similar in healthy subjects and HCM patients, which shows that the loop itself is not discriminative for healthy subjects and HCM patients. However, Lin et al. [59] demonstrated a significantly higher LD in patients with ventricular tachycardia (VT)/ventricular fibrillation (VF) compared to patients without VT.
Azimuth and elevation
Generally, the spatial orientation of the maximum T-wave vector is defined by its azimuth and elevation. Usually, the azimuth is considered as the angle in the transverse plane. The value of azimuth can be interpreted as follows: 0o, left; +90o, front; -90o, back; and 180o, right. In addition, the elevation is defined as the angle from 0o (caudal direction) to 180o (cranial direction), basing the elevation of the T-wave on the angle in the cranio-caudal direction. Significant leftward azimuthal orientation was found compared with left circumflex artery patients and downward elevation compared with both right coronary artery and left coronary artery patients [75].
Complexity ratio
The index complexity ratio (CR) reflects the complexity of repolarization. The principal component analysis provides the identification of a set of eight values, which represent the relative magnitude of spatial components of repolarization [70]. This parameter describes the global shape abnormalities of the repolarization wave, which is defined as the second component divided by the first component of eigenvalue decomposition given as a percentage. The relative contribution of these components can be used to estimate the complexity. This index may provide identification of patients with abnormal repolarization. In the study by Zabel et al. [96], the CR value was found to be significantly different in all patient groups, but it was not significant in patients with and without arrhythmic events.
However, in this article, a brief description of VCG-based parameters is discussed in the following sections based on a single-beat and a beat-to-beat basis.
Single-beat VCG-based parameters
Patients with various cardiac condition (arrhythmogenesis, myocardial infarction, heart failure, hypertrophic myocardiopathy) were investigated using several VCG parameters in several studies [3, 27, 59, 96]. A summary of the VCG-based parameters employed in single-beat analysis is given in Table 1.
Analysis of single-beat VCG-based parameters and their findings.
| Study | VCG parameters | Groups | Main findings |
|---|---|---|---|
| [3] | 1. TCRT 2. TMD 3. LD 4. PL | Supine resting healthy subjects (n=76) HCM (n=63) | The proposed VCG parameters (TCRT, TMD, and PL) were able to show the prognostic capabilities for differentiating patients with HCM from healthy subjects. However, the parameter LD was found to be similar for both studied subjects. |
| [96] | 1. TCRT 2. TMD 3. CR 4. Normalized T-wave loop area (NTLA) | Consecutive post-MI patients (n=280) Men (n=229) Women (n=51) | The TCRT parameter was found to be a strong risk predictor in this study. However, the TMD value did not show significant differences in studied groups. In patients with and without arrhythmic events, the CR value was not promising. However, it showed significant differences in all patient groups. Finally, the NTLA value was significantly differences in the patient group with events (p<0.05). |
| [27] | 1. TCRT 2. TMD 3. NTLA | HCM (n=54) Healthy subjects (n=70) | Significantly lower TCRT, higher TMD, and decreased NTLA values were found in HCM patients compared to healthy subjects (p<0.01) in supine position, which suggests that these parameters might be useful for assessing repolarization abnormalities of HCM patients. |
| [97] | 1. TCRT 2. TMD 3. CR 4. NTLA | Male US veterans (n=772) Dead (n=252) Alive (n=520) | Significantly lower TCRT, higher TMD, and increased CR values were found in increased risk of death subjects (p<0.02), which demonstrates the reproducibility of the proposed parameter. However, no significant repolarization heterogeneity was found in patients who had events (death) during long-term follow-up. |
| [95] | 1. TCRT | Post-MI patients (n=280) with 27 events (death or non-fatal sustained VT/VF) | TCRT value was found to be univariately associated (p=0.0002) with the events. |
| [8] | 1. TCRT | MI patients (n=334) | Reduced TCRT value was observed in cardiac and arrhythmic death in patients post-MI, which reflects increased repolarization heterogeneity in MI patients. |
| [18] | 1. TCRT | Male (n=8) Female (n=2) | The effortful mental arithmetic and isometric handgrip exercise tasks appeared to be inhomogeneous of TCRT values compared to the effortless control condition. |
| [58] | 1. TCRT 2. TMD 3. NTLA 4. LD | End-stage renal disease patients Survivors (n=171) All-cause death (n=154) | No significant TCRT and TMD differences were found between survivors and all-cause death patients that suggest these parameters may not be useful for studying this type of patients. Further, same scenario occurred between cardiovascular mortality and non-cardiovascular mortality. However, the parameter LD demonstrated as an independent predictor of repolarization heterogeneity between survivors and all-cause mortality. |
| [26] | 1. TCRT | Near-consecutive cohort of patients | The TCRT value may distinguish a primary from secondary T-wave abnormalities. |
| Healthy subjects (n=33) | |||
| Patients (n=121) | |||
| [51] | 1. TCRT | Type 1 diabetic patients (n=16) Healthy subjects (n=8) | The TCRT values were significantly lower in the diabetic patients compared to healthy subjects (p<0.05), which indicates about the prognostic capability of this parameter in clinical application. |
| [46] | 1. TCRT | Acute MI patients (n=45) Healthy subjects (n=25) | Computation of TCRT was failure in several AMI patients. However, small improvements of the basic TCRT algorithm may decrease the failures up to 82%. |
| [59] | 1. TCRT 2. TMD 3. NTLA 4. LD | Heart failure patients With VT/VF (n=27) Without VT as control (n=54) | The TCRT, TMD, and NTLA values were not significantly different between these studied groups (p>0.05). However, significantly higher LD was found in patients with VT/VF compared to without VT. |
| [43] | 1. TCRT 2. TMD 3. PL 4. LD | Patients with systolic heart failure (n=650) | The TCRT value was unable to demonstrate the differences between all-cause mortality and survival groups (p=0.07). However, opposite scenario was found between cardiovascular and non-cardiovascular death. Similarly, TMD, PL, and LD were also not to be found significant differences between all-cause mortality and survival groups (p>0.05) as well as between cardiovascular and non-cardiovascular death (p>0.05). |
| [44] | 1. TCRT | Patients after MI With VT (n=30) Without VT (n=13) | Significant differences of TCRT values were observed between group of patients with VT and group of patients without VT. |
| [68] | 1. TCRT 2. TMD | Total adults (n=5917) Men (n=2674) Women (n=3243) | The TCRT value was not statistically significant different in men (all-cause and cardiovascular mortality). However, was significant different in women (all-cause and cardiovascular mortality). Similarly, women showed higher value of TMD than men in all-cause and cardiovascular mortality. |
| [76] | 1. Spatial QRS-T angle 2. Azimuth and elevation | Population (n=660) | Spatial QRS-T was found to be strongly depends on sex. In addition, the direction of azimuth showed toward anterior in male than in female group. Further, the elevation appeared to be significant differences between men and women. |
| [75] | 1. Azimuth and elevation | Patients with stable CAD (n=35) Healthy subjects (n=10) | Azimuth was found to be significant leftward compared with left circumflex artery patients and elevation was more downward compared with both the right coronary artery and right coronary artery patients. |
| [21] | 1. Spatial QRS-T angle | Healthy school-age children Male (n=348) Female (n=298) | Significantly higher spatial QRS-T angle was found in boys compared to girls (p=0.031), which shows that the direction of depolarization and repolarization for boys appears to be close to each other. |
| [88] | 1. Azimuth and elevation | Patients with structurally normal hearts (n=19) | Significantly increased elevation and azimuthal orientation was observed with increased HR, which indicates that the T-wave vector appears to move slightly upward and forward. |
Beat-to-beat VCG-based parameters
The analysis of VCG parameters based on single-beat ECG for different cardiac conditions and the investigation of prognostic capabilities have received significant interest. However, little is known of VCG parameter analysis based on beat-to-beat cases. In addition to that, how these VCG parameters are influenced by beat-to-beat ECG is not completely understood. Nevertheless, recently, a few studies have investigated beat-to-beat VCG parameters in different cardiac populations and tested their independent predictive power for classifying patients [38, 39, 86]. A brief description of relevant beat-to-beat VCG-based parameters and their relationship to the findings in a number of studies is summarized in Table 2.
Analysis of beat-to-beat VCG-based parameters and their findings.
| Study | VCG parameters | Groups | Main findings |
|---|---|---|---|
| [47] | 1. TCRT 2. Cos (QRST angle) 3. Cos (plane angle) | CAD (n=10) Healthy subjects (n=10) | A negative trend of TCRT was observed during exercise, and it was more negative in healthy subjects compared to CAD patients. |
| [86] | 1. R-peak cloud volume 2. T-peak cloud volume 3. T-/R-peak cloud volume | Structural heart diseases (n=414) | Increased volume of T-peak cloud seemed to be associated with higher risk of ventricular tachyarrhythmia. |
| [35] | 1. R-peak cloud volume 2. T-peak cloud volume 3. T-/R-peak cloud volume | Patients with structural heart disease and ICD (n=81) | Higher volume of T-peak cloud appeared to be associated with higher risk of sustained ventricular tachyarrhythmias. |
| [69] | 1. Spatial QRS-T angle 2. T-wave PCA | HCM (n=56) Healthy subjects (n=56) Athletes (n=69) | The suggested VCG parameters (spatial QRS-T angle, T-wave PCA) were found to be useful for detecting the HCM patients. |
| [50] | 1. TCRT 2. QRS-T angle 3. TCRT/RR 4. QRS/RR | Exercise ECG recordings (n=1297) Men (n=872) Women (n=425) | Beat-to-beat VCG parameters from exercise ECG (TCRT-RR and QRST-RR) were found to be associated with mortality, especially with cardiac mortality and sudden cardiac death. |
| [49] | 1. TCRT/RR 2. QRST/RR | Healthy subjects during exercise (n=40) Men (n=20) Women (n=20) | The suggested VCG parameters were found to be affected by HR and gender effect. Further, hysteresis was found in the TCRT/RR slopes for delayed rate adaptation. |
| [16] | 1. Maximum magnitude of the depolarization vector of QRS loop 2. Volume of QRS loop 3. Planar area of QRS loop 4. Ratio between the area and perimeter of QRS loop 5. Ratio between the major and minor axes of QRS loop 6. QRS loop energy | Ischemic patients (n=80) that underwent PTCA | The proposed VCG parameters explained more about the morphological changes of QRS loop and reflects the modifications in the levels of cardiac ischemic before, during, and after PTCA. |
| [39] | 1. DVQRS 2. DVT 3. MLLQRS 4. MLLT 5. TMD 6 TMPpre 7 TMDpost 8. PL 9. TCRT | MI patients (n=84) Healthy subjects (n=69) | Most of the VCG parameters showed independent prognostic capabilities for diagnosing MI patients. However, TCRT did not seem to be capable of characterizing the MI patients from healthy subjects. |
| [85] | 1. Mean spatial TT′ angle 2. Normalized variances of T-wave loop area 3. Spatial T-vector amplitude 4. Tpeak-Tend area | Healthy subjects (n=160) Men (n=80) Women (n=80) | Healthy men showed higher repolarization lability of several VCG parameters than healthy women, where caution should be paid for gender-specific risk stratification study. |
Another interesting study was carried out by Karsikas et al. [47], where beat-to-beat variability of QRS-T angle was observed during an incremental exercise test. This study reported that the TCRT trend during exercise was negative and became more negative in healthy subjects compared to the patients with coronary artery disease (CAD). However, theoretically, TCRT ought to be toward a positive value in healthy subjects, compared to the CAD patient, due to the homogeneity of repolarization lability in healthy subjects, which was investigated by several studies for a single-beat ECG analysis [3]. The greater trend of TCRT toward a negative value might be found in healthy subjects due to a consequence of the experimental setup. Nevertheless, the study of Karsikas et al. [47] highlights that further research is required for beat-to-beat analysis for QRS-T angle measurements to assess the reliability of this parameter.
Two further different studies have found that the beat-to-beat three-dimensional ECG variability predicts ventricular arrhythmia (VA) in patients with structural disease and implanted implantable cardioverter defibrillator (ICD) using the same (R-peak cloud volume, T-peak cloud volume, T-/R-peak cloud volume) VCG-based parameters [35, 86]. They suggested that large T-peak cloud volume (this cloud volume was computed as the volume within the convex hull) is associated with the increased risk of VA. However, this study was limited to an analysis of 30 consecutive beats. The VCG analysis of a higher number of beats may increase the validity of the outcome significantly.
In the same year, in 2010, Kenttä et al. [50] studied the beat-to-beat rate dependency and gender affect on spatial angle (TCRT or QRS-T angle) between QRS-T loops during exercise ECG. They suggested that the beat-to-beat individual patterns of TCRT and QRS/T angle are influenced by heart rate (HR) and gender. However, further study is required for ultimate validation before considering clinical implementation. Another study by Kenttä et al. [49] suggests that spatial angles (TCRT and QRS-T angles) might be strong predictors of sudden cardiac death for risk stratification where a larger database was used for analysis.
Correa et al. [16] introduced six (maximum magnitude of the depolarization vector of QRS loop, volume of QRS loop, planar area of QRS loop, ratio between the area and the perimeter of QRS loop, ratio between the major and the minor axes of QRS loop, and QRS loop energy) different VCG-based parameters to investigate the morphological changes in the QRS loop for ischemic patients that underwent percutaneous transluminal coronary angioplasty (PTCA). They showed that VCG-based parameters were significantly different before, during, and after PTCA. However, they considered only the QRS-loop VCG parameters for ischemic patients and the morphological changes in repolarization loop descriptors. Therefore, it might be interesting if future analysis can be extended by considering the T-wave loop as well.
Hasan et al. [39] proposed two new descriptors along with some existing depolarization and repolarization indices for beat-to-beat VCG analysis. Point-to-point distance variability (DV) is one of them, which was determined based on the coefficient of variance of point-to-point distance from each loop to the mean loop of QRS- and T-wave loop. In addition, another new descriptor was mean loop length (MLL), which was calculated for the mean loop of the QRS and the T loop by adding the distance from each point to the next point in the loop. Significantly higher DV of the QRS- and T-wave loop was found in MI patients compared to healthy subjects [39]. However, the beat-to-beat TCRT value was not significant for identifying the MI patients in this study, which brings to attention the need for requiring further research before using these parameters for analyzing repolarization heterogeneity and cardiac risk stratification study.
Recent research in 2013, Sur et al. [85] suggested several VCG-based parameters for the analysis of ventricular depolarization and repolarization in healthy subjects based on gender. In this work, they suggested that the repolarization lability is gender dependent, with mostly men having higher repolarization lability than the women. In addition, Correa et al. [15] also studied seven VCG-based parameters (maximum vector magnitude, volume, planar area, maximum distance between centroid and loop, angle between XY and optimum plane, perimeter, and area-perimeter ratio). In this study, they demonstrated that several VCG-based parameters are found to be a significant marker for differentiating healthy subjects from ischemic patients. The details of the VCG-based parameters list are given in the Table 2 and their findings.
Factors affecting VCG
The factors that affect the VCG-based parameters are significantly lower than the standard ECG parameters. However, several factors need to be considered for the analysis of VCG-based parameters in clinical studies. Brief descriptions of the factors that may affect the VCG parameters are given below.
Heart rate dependency
The relationship between HR and VCG-based parameters has been investigated by a few studies [50, 76, 88]. Some of the studies demonstrated that the VCG parameters are dependent on the HR. Scherptong et al. [76] investigated VCG parameters (QRS-T angle and spatial ventricular gradient) on a young healthy population. They showed a significant influence of HR on the spatial ventricular gradient magnitude, with an apparent inverse relation between HR and the spatial ventricular gradient. They concluded that the increased HR is associated with decreased spatial ventricular gradient magnitude.
Kenttä et al. [50] investigated the affect of HR on spatial VCG parameters during exercise ECG for healthy subjects and concluded that the HR has significant influence on VCG parameters (TCRT and QRS-T angle). Particularly, HR affects TCRT during exercise and recovery periods. In a supine position, the TCRT values were found to be higher compared to sitting and standing positions [7]; however, HR is increased during the exercise. As a result, the QRS-T angle increased, decreasing the value of TCRT. Thus, TCRT is influenced by HR. Vahedi et al. [88] also found that some computed VCG parameters (QRSarea, Tarea, and Tamplitude) were also influenced by HR, where a decrease in heterogeneity of ventricular activity was observed due to increased HR.
Respiration
Respiration is one of the most important factors that may affect VCG loops or parameters. Respiratory activity influences ECG measurements with respect to both beat morphology and HR. The morphological beat-to-beat variations can be found in the ECG, during the respiratory cycle, and are mainly due to chest movements and changes in the position of the heart. The respiratory frequency is generally estimated from the respiration signal. As a result, the derived VCG loops are not synchronized due to the respiratory-induced changes or respiratory frequency in the electrical axis of the heart [74]. In addition, cardiac motion abnormalities may have some affect on VCG parameters during the process of magnetic resonance imaging (MRI). Due to the respiratory motion or irregular cardiac rhythms, the imaging of the heart is inherently prone to imaging artifact [64]. Thus, one needs to take into account the respiratory signal or respiratory frequency for the analysis of VCG loops. Thereby, the VCG analysis results may be affected. However, in 1998 and 2000, the articles published by Sörnmo [81] and Astrom et al. [5] developed the method for reducing the affect of respiration and muscular activity on VCG loops in a beat-to-beat manner. Mainly, they reduced the respiration influence by performing spatial and temporal maximum-likelihood (ML) alignment of the VCG loops, and this alignment was based on scaling, rotation, and time synchronization of the loops. Moreover, the affect of respiration on VCG loops has been validated further, and the respiration frequency was estimated in the article proposed by Leanderson et al. [57]. In 2006, Bailón et al. [6] also estimated the respiratory frequency from VCG during the stress testing, which has demonstrated the influence of respiration and existence in the VCG loops. Recently, in 2009, Karsikas et al. [47] suggested that respiration significantly affects the beat-to-beat variability of all the QRS-T angle measures. Therefore, this study suggested that care should be taken when considering the reliability of VCG angle measures for one-beat analysis as compared to beat-to-beat analysis.
Nevertheless, this proposed ML VCG loop alignment technique was limited [5, 81]. For example, the proposed technique reduces the ability to include apriori information in any of the transformations. In addition, for low-quality signals, such as fetal ECG signal, the reliability of this method is reduced. To address this situation, in 2013, Vullings et al. [91] introduced the generic Bayesian framework to derive the beat-to-beat VCG loop alignment, where the existing ML method can also be derived. This Bayesian probability theory was applied to derive maximum a posteriori estimation for robust VCG loop alignment.
Gender
The problem of gender influence on VCG parameters is not fully understood yet. However, several studies have attempted to explore the relation between gender and VCG-based parameters. In 1968, a study was carried on 101 healthy male and 102 healthy female subjects to analyze VCG dependency on gender [82]. They found significant gender differences in several VCG-based parameters (maximal QRS and T vectors). In another study in 2002, Smetana et al. [80] observed substantial differences in repolarization homogeneity between male and female subjects. In 2008, Scherptong et al. [76] also tested spatial parameter dependency on gender and proposed that they are strongly sex dependent. Later, in 2012, Vahedi et al. [89] found that there were significant differences in spatial VCG-based parameters with gender and that the parameters are significantly higher in men compared to women. In agreement with the previous investigation, a recent study was conducted on healthy subjects for analyzing the VCG parameters by Sur et al. [85] in 2013. They concluded that healthy men showed higher repolarization lability for several VCG parameters compared to healthy women, which questions the factors that may contribute to influence the VCG parameters.
Age
Several researchers have investigated the influence of VCG parameters by considering the age effect [11, 24, 34]. All of the studies have found that the VCG-based parameters are age dependent. Guller et al. [34] observed that the size of the maximal spatial QRS vector was significantly decreased in first three days of a newborn baby. In their study, they found that the QRS duration is age dependent, and the most probable reason for the change in QRS configuration in newborn infants differences in the ventricular activation process. In addition, Brohet et al. [11] also demonstrated that infants younger than 6 months have higher levels of dispersion and disparate variation in VCG parameters (maximal spatial QRS vector, QRS-T angle) than older children.
VCG parameters for arrhythmic risk prediction
Many studies have demonstrated that several VCG parameters may have independent predictive power of cardiac events or mortality [4, 9, 45, 53, 67, 92]. Perkiömäki et al. [67] carried out a study for investigating the predictive power of the T-wave loop and QRS complex loop for cardiac mortality during follow-up of consecutive survivors of acute myocardial infarction (AMI). In this study, out of several other VCG parameters, they proposed that T-wave loop dispersion (TWLD) has independent predictive capabilities of cardiac death and clinical risk markers in patients with AMI. The TWLD parameter describes the irregularities of the T-wave loop during its course. Here, it was found that a negative correlation between TWLD and the height of the T-wave loop, and the height/width ratio of the T-wave loop also independently predicted cardiac mortality when adjusted for clinical risk markers. However, the computation of T-wave loop height and width requires further validation. Because, according to the description in this study, the value of height and width may be changeable and the ratio of height/width can differ in beat-by-beat ECG. However, this study successfully demonstrated that the changes in T-wave shape have the predictive power for cardiac mortality.
Similarly, the abnormal spatial QRS-T angle was studied by Kardys et al. [45] for cardiovascular risk prediction in a large data set for an elderly population. Here, the spatial QRS-T angle was considered as the angle between the mean spatial QRS axis and the mean spatial T axis. The main contribution of this study was the population sets for increasing the statistical power and data analysis technique. However, a methodological limitation needed to be investigated and included in this study by observing the variations of QRS-T angle rather taking only the mean value of spatial QRS-T angle. This is due to variations of spatial QRS-T angle may provide an additional contribution to the prediction of high risk of cardiac mortality. This limitation was also found in another study [92], which is in line with the previous findings. However, the proposed spatial QRS-T angles for risk prediction can be used for further stratification of patients with standard ECG abnormalities as well as for clinical application.
Risk stratification study was conducted by Huang et al. [43] by proposing several VCG parameters (TCRT, TMD, LD, PL, and PO) for cardiovascular mortality in patients with systolic heart failure. However, only one parameter (TCRT) was found to be risk predictor for cardiovascular mortality in this proposed study, where other VCG parameters appeared to be not significant. The discrepancy in this result may be due to the selection of the data set, where the diversity of disease etiologies (including ischemia and non-cardiomyopathy) and different causes of death (including arrhythmia and pumping failure) may explain the discrepancy.
Moreover, the spatial ventricular gradient (sum of the areas within QRS complex and T wave) from VCG is potentially useful for assessing the abnormalities in repolarization properties before and after the ablation in patients with Wolff-Parkinson-White (WPW) syndrome. Mikio et al. [65] demonstrated that the directions of spatial ventricular gradient appears to be abnormal before ablation in patients with manifest WPW syndrome compared to healthy subjects. Moreover, the VCG approach is found to be more sensitive than ECG for the identification of pre-excitation site in WPW syndrome [28].
Computational methods for the diagnosis of cardiac diseases using VCG parameters
Several techniques are applied to transform VCG from multichannel ECG signal. However, it has been shown to have limitations in very-high-field MRI, specially, when two or three ECG leads are used for analyzing VCG [55]. Therefore, Gregory et al. [30] proposed a technique for MRI synchronization in high-field MRI that may even deal with arrhythmic beats (premature ventricular contraction), commonly found in patients with ischemic histories or during stress perfusions studies. The computational methods are found to be promising for cardiac diseases and therapy planning through VCG analysis [83, 90]. Villongco et al. [90] also showed that patient specific models of ventricular depolarization can be used for estimating the left-bundle branch block and right ventricular-paced activation sequences from VCG parameters for a single dominant excitation wave. However, most cardiac diseases and activation sequences generally involve complex wave dynamics with multiple wavefronts, where the proposed single activation site and fixed dipole equivalent source model may be ineffective in describing the ventricular depolarization patterns in detail.
TCRT and TMD versus other non-invasive risk stratification methods
Whether it is better to use the scalar ECG parameters (such as HRV, QT dispersion, QTV, T-wave inversion, ST depression) or the VCG parameters (such as TCRT, TMD) for cardiac risk prediction is a controversial issue because both approaches have pros and cons in methodological steps and dependency on the quality and appropriate data sets [29, 61, 67, 71, 87, 98]. However, VCG parameters (TCRT and TMD) are found to be advantageous over other non-invasive risk predictors’ parameters [43, 70, 92]. The main reason may the computational feasibility with fewer errors in the parameters (TCRT/TMD) compared to other ECG parameters. One of the critical problems is in finding an accurate T-wave end for extracting other non-invasive ECG parameters for risk stratification [20, 56], which is considered to be a major source of inaccuracy in automatic QT extracted measurements [48, 52]. Proper identification of T-wave offset becomes a difficult task because of the slow transition of cardiac cells to the termination of the ventricular repolarization process, where accurate localization of the T-wave end point becomes a challenging task. In addition, breathing (inspiration and expiration) may have also some affect on the accuracy of the detected T-wave offset. Therefore, estimating the variability of repolarization can be affected to some extent by the challenge of T-wave end detection in ECG [17]. Meanwhile, VCG parameters may not need exact identification of the T-wave end [70] that improves the reproducibility of VCG-based parameters over other non-invasive ECG parameters for risk stratification study.
Future directions
As mentioned, the characteristics of beat-to-beat VCG-based parameters appear to be inconsistent. Therefore, future study may address this issue and validate the existing findings. Currently, measurements and analyzing techniques are offline. In the future, with advances in low-cost computing hardware, real-time three-dimensional visualization of VCG loops may provide better interpretation of VCG and may be of benefit for remote health-monitoring systems. The quantification of the spatial QRS-T angle is not currently familiar to most clinicians and it is not routinely available from the computerized electrocardiographic analysis software currently in use. Therefore, in future, it might be incorporated in the commercial computerized software with detailed interpretation so that clinicians can make proper decision for diagnosis of cardiac patients. In addition, it can be used for biometric identification as an alternative identification technique in parallel with the existing system. Finally, we may expect that, in the future, the developed algorithm can be implemented into a field programmable gate array board (e.g., [36]) for speeding the process and classification and for many other diagnostic purposes.
Conclusion
In conclusion, the concept of VCG analysis is a known approach for testing the homogeneity of repolarization lability. In addition, most of the earlier VCG studies were limited to a static beat. However, literature clearly shows that the beat-to-beat variability of VCG-based parameters does not exactly follow the same pattern but sometimes provides new information. In addition to that, factors that may contribute for affecting the VCG parameters need to be considered. Therefore, further research is required to validate the hypothesis for repolarization abnormalities using the VCG approach in a beat-to-beat manner.
Acknowledgments
Thanks are due to the editor and reviewers for their valuable comments for improving this manuscript.
Conflict of interest statement
Competing interests:The authors declare that they have no competing interests.
Author’s contributions: M.A.H. designed the study. M.A.H. and D.A. carried out the interpretation. M.A.H. drafted the manuscript. M.A.H. and D.A. edited and revised the manuscript. D.A. supervised the study. All authors read and approved the final manuscript.
References
[1] Abdelraheem M, Selim H, Abdelhamid TK. Human identification using the main loop of the vectorcardiogram. Am J Signal Process 2012; 2: 23–29.10.5923/j.ajsp.20120202.04Search in Google Scholar
[2] Acar B, Koymen H. SVD-based on-line exercise ECG signal orthogonalization. IEEE Trans Biomed Eng 1999; 46: 311–321.10.1109/10.748984Search in Google Scholar PubMed
[3] Acar B, Yi G, Hnatkova K, Malik M. Spatial, temporal and wavefront direction characteristics of 12-lead T-wave morphology. Med Biol Eng Comput 1999; 37: 574–584.10.1007/BF02513351Search in Google Scholar PubMed
[4] Aro AL, Huikuri HV, Tikkanen JT, et al. QRS-T angle as a predictor of sudden cardiac death in a middle-aged general population. Europace 2012; 14: 872–876.10.1093/europace/eur393Search in Google Scholar PubMed
[5] Astrom M, Santos EC, Sörnmo L, Laguna P, Wohlfart B. Vectorcardiographic loop alignment and the measurement of morphologic beat-to-beat variability in noisy signals. IEEE Trans Biomed Eng 2000; 47: 497–506.10.1109/10.828149Search in Google Scholar PubMed
[6] Bailón R, Sörnmo L, Laguna P. A robust method for ECG-based estimation of the respiratory frequency during stress testing. IEEE Trans Biomed Eng 2006; 53: 1273–1285.10.1109/TBME.2006.871888Search in Google Scholar PubMed
[7] Batchvarov V, Dilaveris P, Färbom P, et al. New descriptors of homogeneity of the propagation of ventricular repolarization. PACE 2000; 23: 1968–1972.10.1111/j.1540-8159.2000.tb07064.xSearch in Google Scholar PubMed
[8] Batchvarov VN, Hnatkova K, Poloniecki J, Camm AJ, Malik M. Prognostic value of heterogeneity of ventricular repolarization in survivors of acute myocardial infarction. Clin Cardiol 2004; 27: 653–659.10.1002/clc.4960271115Search in Google Scholar PubMed PubMed Central
[9] Beckerman J, Yamazaki T, Myers J, et al. T-Wave abnormalities are a better predictor of cardiovascular mortality than ST depression on the resting electrocardiogram. Ann Noninvasive Electrocardiol 2005; 10: 146–151.10.1111/j.1542-474X.2005.05607.xSearch in Google Scholar PubMed PubMed Central
[10] Berger RD, Kasper EK, Baughman KL, Marban E, Calkins H, Tomaselli GF. Beat-to-beat QT interval variability: novel evidence for repolarization lability in ischemic and nonischemic dilated cardiomyopathy. Circulation 1997; 96: 1557–1565.10.1161/01.CIR.96.5.1557Search in Google Scholar
[11] Brohet CR, Hoeven C, Robert A, Derwael C, Fesler R, Brasseur LA. The normal pediatric Frank orthogonal electrocardiogram: variations according to age and sex. J Electrocardiol 1986; 19: 1–13.10.1016/S0022-0736(86)80002-4Search in Google Scholar
[12] Carlson J, Havmoller R, Herreros A, Platonov P, Johansson R, Olsson B. Can orthogonal lead indicators of propensity to atrial fibrillation be accurately assessed from the 12-lead ECG? Europace 2005; 7: S39–S48.10.1016/j.eupc.2005.04.012Search in Google Scholar
[13] Chou T-C. When is the vectorcardiogram superior to the scalar electrocardiogram? J Am Coll Cardiol 1986; 8: 791–799.10.1016/S0735-1097(86)80419-3Search in Google Scholar
[14] Correa R, Arini PD, Correa LS, Valentinuzzi M, Laciar E. Novel technique for ST-T interval characterization in patients with acute myocardial ischemia. Comput Biol Med 2014; 50: 49–55.10.1016/j.compbiomed.2014.04.009Search in Google Scholar PubMed
[15] Correa R, Arini PD, Valentinuzzi ME, Laciar E. Novel set of vectorcardiographic parameters for the identification of ischemic patients. Med Eng Phys 2013; 35: 16–22.10.1016/j.medengphy.2012.03.005Search in Google Scholar PubMed
[16] Correa R, Laciar E, Arini P, Jané R. Analysis of QRS loop in the vectorcardiogram of patients with Chagas’ disease. In: Proceedings of the Annual International Conference of the IEEE Engineering in Medicine and Biology Society (EMBC), 2010: 2561–2564.10.1109/IEMBS.2010.5626863Search in Google Scholar PubMed
[17] Couderc J-P. Cardiac regulation and electrocardiographic factors contributing to the measurement of repolarization variability. J Electrocardiol 2009; 42: 494–499.10.1016/j.jelectrocard.2009.06.019Search in Google Scholar PubMed
[18] Critchley HD, Taggart P, Sutton PM, et al. Mental stress and sudden cardiac death: asymmetric midbrain activity as a linking mechanism. Brain 2005; 128: 75–85.10.1093/brain/awh324Search in Google Scholar PubMed
[19] Dahlin L-G, Ebeling-Barbier C, Nylander E, Rutberg H, Svedjeholm R. Vectorcardiography is superior to conventional ECG for detection of myocardial injury after coronary surgery. Scand Cardiovasc J 2001; 35: 125–128.10.1080/140174301750164835Search in Google Scholar PubMed
[20] Daskalov I, Christov I. Automatic detection of the electrocardiogram T-wave end. Med Biol Eng Comput 1999; 37: 348–353.10.1007/BF02513311Search in Google Scholar PubMed
[21] Dilaveris P, Roussos D, Giannopoulos G, et al. Clinical determinants of electrocardiographic and spatial vectorcardiographic descriptors of ventricular repolarization in healthy children. Ann Noninvasive Electrocardiol 2011; 16: 49–55.10.1111/j.1542-474X.2010.00408.xSearch in Google Scholar
[22] Dower GE, Machado HB, Osborne J. On deriving the electrocardiogram from vectoradiographic leads. Clin Cardiol 1980; 3: 87.10.1002/clc.1980.3.2.87Search in Google Scholar
[23] Edenbrandt L, Pahlm O. Vectorcardiogram synthesized from a 12-lead ECG: superiority of the inverse Dower matrix. J Electrocardiol 1988; 21: 361–367.10.1016/0022-0736(88)90113-6Search in Google Scholar
[24] Edenbrandt L, Jonson B, Lundh B, Pahlm O. Sex- and age-related normal limits for the QRS complex in vectorcardiography. Clin Physiol 1987; 7: 525–536.10.1111/j.1475-097X.1987.tb00194.xSearch in Google Scholar
[25] Frank E. An accurate, clinically practical system for spatial vectorcardiography. Circulation 1956; 13: 737–749.10.1161/01.CIR.13.5.737Search in Google Scholar
[26] Friedman HS. Determinants of the total cosine of the spatial angle between the QRS complex and the T-wave (TCRT): implications for distinguishing primary from secondary T-wave abnormalities. J Electrocardiol 2007; 40: 12–17.10.1016/j.jelectrocard.2006.05.008Search in Google Scholar
[27] Gang Y, Hnatkova K, Guo X, et al. Reproducibility of T-wave morphology assessment in patients with hypertrophic cardiomyopathy and in healthy subjects. Comput Cardiol 2001; 393–396.Search in Google Scholar
[28] Giorgi C, Nadeau R, Primeau R, et al. Comparative accuracy of the vectorcardiogram and electrocardiogram in the localization of the accessory pathway in patients with Wolff-Parkinson-White syndrome: validation of a new vectorcardiographic algorithm by intraoperative epicardial mapping and electrophysiologic studies. Am Heart J 1990; 119(Pt 1): 592–598.10.1016/S0002-8703(05)80282-0Search in Google Scholar
[29] Goldenberg I, Mathew J, Moss AJ, et al. Corrected QT variability in serial electrocardiograms in long QT syndrome the importance of the maximum corrected QT for risk stratification. J Am Coll Cardiol 2006; 48: 1047–1052.10.1016/j.jacc.2006.06.033Search in Google Scholar PubMed
[30] Gregory TS, Schmidt EJ, Zhang SH, Ho Tse ZT. 3DQRS: a method to obtain reliable QRS complex detection within high field MRI using 12-lead electrocardiogram traces. Magn Reson Med 2014; 71: 1374–1380.10.1002/mrm.25078Search in Google Scholar PubMed PubMed Central
[31] Grishman A, Donoso E. Spatial vectorcardiography. II. Mod Concepts Cardiovasc Dis 1961; 30: 693–696.Search in Google Scholar
[32] Guillem MS, Climent AM, Bollmann A, Husser D, Millet J, Castells F. Limitations of Dower’s inverse transform for the study of atrial loops during atrial fibrillation. PACE 2009; 32: 972–980.10.1111/j.1540-8159.2009.02426.xSearch in Google Scholar PubMed
[33] Guillem MS, Sahakian AV, Swiryn S. Derivation of orthogonal leads from the 12-lead electrocardiogram. Performance of an atrial-based transform for the derivation of P loops. J Electrocardiol 2008; 41: 19–25.10.1016/j.jelectrocard.2007.07.003Search in Google Scholar
[34] Guller B, Lau FY, Dunn RF, Pipberger HA, Pipberger HV. Computer analysis of changes in Frank vectorcardiograms of 666 normal infants in the first 72 hours of life. J Electrocardiol 1977; 10: 19–26.10.1016/S0022-0736(77)80027-7Search in Google Scholar
[35] Han L, Tereshchenko LG. Lability of R-and T-wave peaks in three-dimensional electrocardiograms in implantable cardioverter defibrillator patients with ventricular tachyarrhythmia during follow-up. J Electrocardiol 2010; 43: 577–582.10.1016/j.jelectrocard.2010.05.011Search in Google Scholar PubMed
[36] Hasan M, Reaz M. Hardware prototyping of neural network based fetal electrocardiogram extraction. Meas Sci Rev 2012; 12: 52–55.10.2478/v10048-012-0007-8Search in Google Scholar
[37] Hasan MA, Abbott D, Baumert M. Beat-to-beat QT interval variability in the 12 lead ECG. Comput Cardiol 2011; 61–64.Search in Google Scholar
[38] Hasan MA, Abbott D, Baumert M. Beat-to-beat spatial and temporal analysis for QRS-T morphology. In: Proceedings of the Annual International Conference of the IEEE Engineering in Medicine and Biology Society (EMBC), 2012: 4193–4195.10.1109/EMBC.2012.6346891Search in Google Scholar PubMed
[39] Hasan MA, Abbott D, Baumert M. Beat-to-beat vectorcardiographic analysis of ventricular depolarization and repolarization in myocardial infarction. PLoS One 2012; 7: e49489.10.1371/journal.pone.0049489Search in Google Scholar PubMed PubMed Central
[40] Hasan MA, Abbott D, Baumert M. Relation between beat-to-beat QT interval variability and T-Wave amplitude in healthy subjects. Ann Noninvasive Electrocardiol 2012; 17: 195–203.10.1111/j.1542-474X.2012.00508.xSearch in Google Scholar PubMed PubMed Central
[41] Hasan MA, Abbott D, Baumert M. Beat-to-beat QT interval variability and T-wave amplitude in patients with myocardial infarction. Physiol Meas 2013; 34: 1075–1083.10.1088/0967-3334/34/9/1075Search in Google Scholar PubMed
[42] Hinterseer M, Thomsen MB, Beckmann B-M, et al. Beat-to-beat variability of QT intervals is increased in patients with drug-induced long-QT syndrome: a case control pilot study. Eur Heart J 2008; 29: 185–190.10.1093/eurheartj/ehm586Search in Google Scholar PubMed
[43] Huang HC, Lin LY, Yu HY, Ho YL. Risk stratification by T-wave morphology for cardiovascular mortality in patients with systolic heart failure. Europace 2009; 11: 1522–1528.10.1093/europace/eup294Search in Google Scholar PubMed
[44] Kania M, Fereniec M, Janusek D, et al. Optimal ECG lead system for arrhythmia assessment with use of TCRT parameter. Biocybern Biomed Eng 2009; 29: 75–82.Search in Google Scholar
[45] Kardys I, Kors JA, van der Meer IM, Hofman A, van der Kuip DA, Witteman JC. Spatial QRS-T angle predicts cardiac death in a general population. Eur Heart J 2003; 24: 1357–1364.10.1016/S0195-668X(03)00203-3Search in Google Scholar
[46] Karsikas M, Huikuri H, Seppanen T. Improving reliability of “total-cosine-R-to-T” (TCRT) in patients with acute myocardial infarction. Comput Cardiol 2008; 373–376.10.1109/CIC.2008.4749056Search in Google Scholar
[47] Karsikas M, Noponen K, Tulppo M, Huikuri HV, Seppanen T. Beat-to-beat variation of three-dimensional QRS-T angle measures during exercise test. Comput Cardiol 2009; 125–128.Search in Google Scholar
[48] Kautzner J, Yi G, Camm A, Malik M. Short-and long-term reproducibility of QT, QTc, and QT dispersion measurement in healthy subjects. PACE 1994; 17: 928–937.10.1111/j.1540-8159.1994.tb01435.xSearch in Google Scholar PubMed
[49] Kenttä T, Karsikas M, Junttila MJ, et al. QRS-T morphology measured from exercise electrocardiogram as a predictor of cardiac mortality. Europace 2011; 13: 701–707.10.1093/europace/euq461Search in Google Scholar PubMed
[50] Kenttä T, Karsikas M, Kiviniemi A, Tulppo M, Seppänen T, Huikuri HV. Dynamics and rate-dependence of the spatial angle between ventricular depolarization and repolarization wave fronts during exercise ECG. Ann Noninvasive Electrocardiol 2010; 15: 264–275.10.1111/j.1542-474X.2010.00374.xSearch in Google Scholar PubMed PubMed Central
[51] Koivikko M, Karsikas M, Salmela P, et al. Effects of controlled hypoglycaemia on cardiac repolarisation in patients with type 1 diabetes. Diabetologia 2008; 51: 426–435.10.1007/s00125-007-0902-ySearch in Google Scholar PubMed
[52] Kors J, van Herpen G. Measurement error as a source of QT dispersion: a computerised analysis. Heart 1998; 80: 453–458.10.1136/hrt.80.5.453Search in Google Scholar PubMed PubMed Central
[53] Kors JA, Kardys I, van der Meer IM, et al. Spatial QRS-T angle as a risk indicator of cardiac death in an elderly population. J Electrocardiol 2003; 36: 113–114.10.1016/j.jelectrocard.2003.09.033Search in Google Scholar PubMed
[54] Kors JA, Van Herpen G, Sittig AC, Van Bemmel JH. Reconstruction of the Frank vectorcardiogram from standard electrocardiographic leads: diagnostic comparison of different methods. Eur Heart J 1990; 11: 1083–1092.10.1093/oxfordjournals.eurheartj.a059647Search in Google Scholar PubMed
[55] Krug J, Rose G, Stucht D, Clifford G, Oster J. Limitations of VCG based gating methods in ultra high field cardiac MRI. J Cardiovasc Magn Reson 2013; 15(Suppl 1): W19.10.1186/1532-429X-15-S1-W19Search in Google Scholar
[56] Laguna P, Thakor N, Caminal P, et al. New algorithm for QT interval analysis in 24-hour Holter ECG: performance and applications. Med Biol Eng Comput 1990; 28: 67–73.10.1007/BF02441680Search in Google Scholar
[57] Leanderson S, Laguna P, Sörnmo L. Estimation of the respiratory frequency using spatial information in the VCG. Med Eng Phys 2003; 25: 501–507.10.1016/S1350-4533(03)00017-1Search in Google Scholar
[58] Lin CY, Lin LY, Chen PC. Analysis of T-wave morphology from the 12-lead electrocardiogram for prediction of long-term prognosis in patients initiating haemodialysis. Nephrol Dialysis Transplant 2007; 22: 2645–2652.10.1093/ndt/gfm238Search in Google Scholar PubMed
[59] Lin YH, Lin LY, Chen YS, et al. The association between T-wave morphology and life-threatening ventricular tachyarrhythmias in patients with congestive heart failure. PACE 2009; 32: 1173–1177.10.1111/j.1540-8159.2009.02461.xSearch in Google Scholar PubMed
[60] Lingman M, Hartford M, Karlsson T, et al. Transient repolarization alterations dominate the initial phase of an acute anterior infarction-a vectorcardiography study. J Electrocardiol 2014; 47: 478–485.10.1016/j.jelectrocard.2014.04.017Search in Google Scholar PubMed
[61] Malik M, Hnatkova K, Batchvarov VN. Post infarction risk stratification using the 3-D angle between QRS complex and T-wave vectors. J Electrocardiol 2004; 37(Suppl): 201–208.10.1016/j.jelectrocard.2004.08.058Search in Google Scholar PubMed
[62] Malmivuo J, Plonsey R. Bioelectromagnetism: principles and applications of bioelectric and biomagnetic fields. Oxford: Oxford University Press 1995.10.1093/acprof:oso/9780195058239.001.0001Search in Google Scholar
[63] Man S, van Zwet E, Maan A, Schalij M, Swenne C. Individually improved VCG synthesis. Comput Cardiol 2009; 277–280.Search in Google Scholar
[64] Maredia N, Radjenovic A, Kozerke S, Larghat A, Greenwood JP, Plein S. Effect of improving spatial or temporal resolution on image quality and quantitative perfusion assessment with k-t SENSE acceleration in first-pass CMR myocardial perfusion imaging. Magn Reson Med 2010; 64: 1616–1624.10.1002/mrm.22493Search in Google Scholar PubMed PubMed Central
[65] Mikio S, Inden Y, Sawada T, et al. Comparison of vectorcardiographic and 12-lead electrocardiographic detections of abnormalities in repolarization properties due to preexcitation in patients with Wolff-Parkinson-White syndrome. Jpn Heart J 2000; 41: 295–312.10.1536/jhj.41.295Search in Google Scholar PubMed
[66] Murabayashi T, Fetics B, Kass D, Nevo E, Gramatikov B, Berger RD. Beat-to-beat QT interval variability associated with acute myocardial ischemia. J Electrocardiol 2002; 35: 19–25.10.1054/jelc.2002.30250Search in Google Scholar PubMed
[67] Perkiömäki JS, Hyytinen-Oinas M, Karsikas M, et al. Usefulness of T-wave loop and QRS complex loop to predict mortality after acute myocardial infarction. Am J Cardiol 2006; 97: 353–360.10.1016/j.amjcard.2005.08.052Search in Google Scholar
[68] Porthan K, Viitasalo M, Jula A, et al. Predictive value of electrocardiographic QT interval and T-wave morphology parameters for all-cause and cardiovascular mortality in a general population sample. Heart Rhythm 2009; 6: 1202–1208.10.1016/j.hrthm.2009.05.006Search in Google Scholar
[69] Potter SLP, Holmqvist F, Platonov PG, et al. Detection of hypertrophic cardiomyopathy is improved when using advanced rather than strictly conventional 12-lead electrocardiogram. J Electrocardiol 2010; 43: 713–718.10.1016/j.jelectrocard.2010.08.010Search in Google Scholar
[70] Priori SG, Mortara DW, Napolitano C, et al. Evaluation of the spatial aspects of T-wave complexity in the long-QT syndrome. Circulation 1997; 96: 3006–3012.10.1161/01.CIR.96.9.3006Search in Google Scholar
[71] Priori SG, Schwartz PJ, Napolitano C, et al. Risk stratification in the long-QT syndrome. N Engl J Med 2003; 348: 1866–1874.10.1056/NEJMoa022147Search in Google Scholar
[72] Raghunandan D, Desai N, Mallavarapu M, Berger RD, Yeragani VK. Increased beat-to-beat QT variability in patients with congestive cardiac failure. Ind Heart J 2004; 57: 138–142.Search in Google Scholar
[73] Rautaharju PM, Warren J, Wolf H. Waveform vector analysis of orthogonal electrocardiograms: quantification and data reduction. J Electrocardiol 1973; 6: 103–111.10.1016/S0022-0736(73)80003-2Search in Google Scholar
[74] Riekkinen H, Rautaharju P. Body position, electrode level, and respiration effects on the Frank lead electrocardiogram. Circulation 1976; 53: 40–45.10.1161/01.CIR.53.1.40Search in Google Scholar
[75] Rubulis A, Jensen SM, Näslund U, Lundahl G, Jensen J, Bergfeldt L. Ischemia-induced repolarization response in relation to the size and location of the ischemic myocardium during short-lasting coronary occlusion in humans. J Electrocardiol 2010; 43: 104–112.10.1016/j.jelectrocard.2009.10.004Search in Google Scholar PubMed
[76] Scherptong RW, Henkens IR, Man SC, et al. Normal limits of the spatial QRS-T angle and ventricular gradient in 12-lead electrocardiograms of young adults: dependence on sex and heart rate. J Electrocardiol 2008; 41: 648–655.10.1016/j.jelectrocard.2008.07.006Search in Google Scholar PubMed
[77] Schreck DM, Fishberg RD. Derivation of the 12-lead electrocardiogram and 3-lead vectorcardiogram. Am J Emerg Med 2013; 31: 1183–1190.10.1016/j.ajem.2013.04.037Search in Google Scholar PubMed
[78] Shvilkin A, Bojovic B, Vajdic B, Gussak I, Zimetbaum P, Josephson ME. Vectorcardiographic determinants of cardiac memory during normal ventricular activation and continuous ventricular pacing. Heart Rhythm 2009; 6: 943–948.10.1016/j.hrthm.2009.03.025Search in Google Scholar PubMed
[79] Shvilkin A, Bojovic B, Vajdic B, et al. Vectorcardiographic and electrocardiographic criteria to distinguish new and old left bundle branch block. Heart Rhythm 2010; 7: 1085–1092.10.1016/j.hrthm.2010.05.024Search in Google Scholar PubMed
[80] Smetana P, Batchvarov VN, Hnatkova K, Camm AJ, Malik M. Sex differences in repolarization homogeneity and its circadian pattern. Am J Physiol Heart Circul Physiol 2002; 282: H1889–H1897.10.1152/ajpheart.00962.2001Search in Google Scholar PubMed
[81] Sörnmo L. Vectorcardiographic loop alignment and morphologic beat-to-beat variability. IEEE Trans Biomed Eng 1998; 45: 1401–1413.10.1109/10.730434Search in Google Scholar PubMed
[82] Sotobata I, Richman H, Simonson E, Fukomoto A. Sex differences in the vectorcardiogram. Circulation 1968; 37: 438–448.10.1161/01.CIR.37.3.438Search in Google Scholar PubMed
[83] Sovilj S, Magjarević R, Lovell NH, Dokos S. A simplified 3D model of whole heart electrical activity and 12-lead ECG generation. Comput Math Methods Med 2013; 2013: 1–10.10.1155/2013/134208Search in Google Scholar PubMed PubMed Central
[84] Strauss DG, Olson CW, Wu KC, et al. Vectorcardiogram synthesized from the 12-lead electrocardiogram to image ischemia. J Electrocardiol 2009; 42: 190–197.10.1016/j.jelectrocard.2008.12.018Search in Google Scholar PubMed
[85] Sur S, Han L, Tereshchenko LG. Comparison of sum absolute QRST integral, and temporal variability in depolarization and repolarization, measured by dynamic vectorcardiography approach, in healthy men and women. PLoS One 2013; 8: e57175.10.1371/journal.pone.0057175Search in Google Scholar PubMed PubMed Central
[86] Tereshchenko LG, Han L, Cheng A, et al. Beat-to-beat three-dimensional ECG variability predicts ventricular arrhythmia in ICD recipients. Heart Rhythm 2010; 7: 1606–1613.10.1016/j.hrthm.2010.08.022Search in Google Scholar PubMed PubMed Central
[87] Turrini P, Corrado D, Basso C, Nava A, Bauce B, Thiene G. Dispersion of ventricular depolarization-repolarization a noninvasive marker for risk stratification in arrhythmogenic right ventricular cardiomyopathy. Circulation 2001; 103: 3075–3080.10.1161/01.CIR.103.25.3075Search in Google Scholar
[88] Vahedi F, Haney MF, Jensen SM, Näslund U, Bergfeldt L. Effect of heart rate on ventricular repolarization in healthy individuals applying vectorcardiographic T vector and T vector loop analysis. Ann Noninvasive Electrocardiol 2011; 16: 287–294.10.1111/j.1542-474X.2011.00444.xSearch in Google Scholar PubMed PubMed Central
[89] Vahedi F, Odenstedt J, Hartford M, Gilljam T, Bergfeldt L. Vectorcardiography analysis of the repolarization response to pharmacologically induced autonomic nervous system modulation in healthy subjects. J Appl Physiol 2012; 113: 368–376.10.1152/japplphysiol.01190.2011Search in Google Scholar PubMed
[90] Villongco CT, Krummen DE, Stark P, Omens JH, McCulloch AD. Patient-specific modeling of ventricular activation pattern using surface ECG-derived vectorcardiogram in bundle branch block. Progr Biophys Mol Biol 2014; 115: 305–313.10.1016/j.pbiomolbio.2014.06.011Search in Google Scholar PubMed PubMed Central
[91] Vullings R, Mischi M, Oei SG, Bergmans JWM. Novel Bayesian vectorcardiographic loop alignment for improved monitoring of ECG and fetal movement. IEEE Trans Biomed Eng 2013; 60: 1580–1588.10.1109/TBME.2013.2238938Search in Google Scholar PubMed
[92] Yamazaki T, Froelicher VF, Myers J, Chun S, Wang P. Spatial QRS-T angle predicts cardiac death in a clinical population. Heart Rhythm 2005; 2: 73–78.10.1016/j.hrthm.2004.10.040Search in Google Scholar PubMed
[93] Yang H, Bukkapatnam ST, Komanduri R. Spatiotemporal representation of cardiac vectorcardiogram (VCG) signals. Biomed Eng Online 2012; 11: 1–15.10.1186/1475-925X-11-16Search in Google Scholar PubMed PubMed Central
[94] Yang Q, Kiyoshige K, Fujimoto T, et al. Vector u loop in patients with old myocardial infarction. Clin Cardiol 1989; 12: 277–282.10.1002/clc.4960120510Search in Google Scholar PubMed
[95] Zabel M, Malik M. Practical use of T wave morphology assessment. Cardiac Electrophysiol Rev 2002; 6: 316–322.10.1023/A:1016353714372Search in Google Scholar
[96] Zabel M, Acar B, Klingenheben T, Franz MR, Hohnloser SH, Malik M. Analysis of 12-lead T-wave morphology for risk stratification after myocardial infarction. Circulation 2000; 102: 1252–1257.10.1161/01.CIR.102.11.1252Search in Google Scholar
[97] Zabel M, Malik M, Hnatkova K, et al. Analysis of T-wave morphology from the 12-lead electrocardiogram for prediction of long-term prognosis in male US veterans. Circulation 2002; 105: 1066–1070.10.1161/hc0902.104598Search in Google Scholar PubMed
[98] Zhang Z-m, Prineas RJ, Case D, Soliman EZ, Rautaharju PM. Comparison of the prognostic significance of the electrocardiographic QRS/T angles in predicting incident coronary heart disease and total mortality (from the atherosclerosis risk in communities study). Am J Cardiol 2007; 100: 844–849.10.1016/j.amjcard.2007.03.104Search in Google Scholar PubMed PubMed Central
©2016 by De Gruyter
Articles in the same Issue
- Frontmatter
- Editorial
- Biosignal processing
- Review
- A review of beat-to-beat vectorcardiographic (VCG) parameters for analyzing repolarization variability in ECG signals
- Research articles
- Classification of persistent and long-standing persistent atrial fibrillation by means of surface electrocardiograms
- Entropy at the right atrium as a predictor of atrial fibrillation recurrence outcome after pulmonary vein ablation
- P wave detection and delineation in the ECG based on the phase free stationary wavelet transform and using intracardiac atrial electrograms as reference
- Multi-modal signal acquisition using a synchronized wireless body sensor network in geriatric patients
- A portable device for recording evoked potentials, optimized for pattern ERG
- Random forests in non-invasive sensorimotor rhythm brain-computer interfaces: a practical and convenient non-linear classifier
- Fractal and twin SVM-based handgrip recognition for healthy subjects and trans-radial amputees using myoelectric signal
- Nonlinear analysis of pupillary dynamics
- A multichannel bioimpedance monitor for full-body blood flow monitoring
- Recognition of amyotrophic lateral sclerosis disease using factorial hidden Markov model
- Short communication
- Quantifying the complexity of human colonic pressure signals using an entropy measure