Universal Basic Income Universally Welcomed? – Relevance of Socio-Demographic and Psychological Variables for Acceptance in Germany
-
Antonia Sureth
 ,
Lioba Gierke
,
Lioba Gierke

Abstract
The COVID-19 pandemic plunged economies into recessions and advancements in artificial intelligence create widespread automation of job tasks. A debate around how to address these challenges has moved the introduction of a universal basic income (UBI) center stage. However, existing UBI research mainly focuses on economic aspects and normative arguments but lacks an individual perspective that goes beyond examining the association between socio-demographic characteristics and UBI support. We add to this literature by investigating not only socio-demographic but also psychological predictors of UBI acceptance in a multivariate analysis using a representative sample of the German working population collected in 2020 (N = 1986). Our results indicate that being more supportive of a UBI went along with being comparably younger, of East-German origin, and more in favor of equal living standards, as well as perceiving one’s economic situation to be worse and the threat of the corona-pandemic to be higher.
1 Introduction
The concept of technological unemployment is not new and has been subject to scientific debate for decades (Spencer 2018). Technological advancements are causing unemployment by, for example, making jobs obsolete (online banking replacing bank clerks), increasing employee efficiency (automated production lines lowering the demand of assembly workers), or eliminating business models (online mail order replacing brick-and-mortar retail). It has never been more pressing: artificial intelligence is on the rise and can outperform humans at an unprecedented pace, vastly expanding its application in organizations (Zhang et al. 2021). The policy discourse around the future of work has been much centered around a heated debate on whether this will lead to a dramatic rise in unemployment (Acemoglu and Restrepo 2018; Arntz, Gregory, and Zierahn 2017; Autor 2015; Frey and Osborne 2017). Some argue that a whole set of new jobs will evolve out of these developments which will compensate job losses (Wilson, Daugherty, and Bianzino 2017). Others stress that “technological singularity” and the prospects of a jobless future are still far from imminent (Naudé 2021; Upchurch 2018). Nevertheless, it can hardly be denied, that a considerable number of jobs will become obsolete in the future due to technological advancements that drive automation (Brynjolfsson and McAfee 2014; Susskind 2020). On top of that, the COVID-19 pandemic led to one of the largest global economic crises in recent history, with a loss of 114 million jobs relative to pre-crisis employment levels (International Labour Organization 2021) and profound impacts on work structures as well as employment (Hodder 2020).
In a society facing technological unemployment (Peters 2017) and economic insecurities, the need for different welfare systems becomes more urgent (Denuit 2018). In Germany, the current social security system provides need-based financial aid which requires a proof of indigency and is thus not unconditional. Essentially, this encompasses unemployment benefits, student loans and statutory pension schemes. A possible alternative or addition to this is the introduction of a universal basic income (UBI) as a “social safety net” (Perkins et al. 2022, p. 1), providing every individual with an unconditional, universal, regular, and sufficient payment (Standing 2012). However, the implementation of a UBI, which is entirely hypothetical at this point, would represent a profound change of the welfare system that would have enormous implications for those who implement and fund it, as well as for those who benefit from it. This raises many questions – including specific design principles (Chrisp, Pulkka, and García 2020; Rincon, Vlandas, and Hiilamo 2022), funding channels (Ghatak and Jaravel 2020), implementation and communication strategies, but also at the individual level about potential effects on work engagement (Cabrales, Hernández, and Sánchez 2020) and overall support of a UBI (Busemeyer, Rinscheid, and Schupp 2023; Vlandas 2021).
Even though there has been a decade-long, extensive academic and political debate on a UBI, it has been primarily focused on the questions of feasibility, economic effects, and normative arguments for and against it. Surprisingly, in the future of work literature, the topic has been remarkably underrepresented (Schlogl, Weiss, and Prainsack 2021) and to date, there are only few studies that consider a UBI in the context of automation and technological unemployment (e.g., Busemeyer and Sahm 2022; Cabrales, Hernández, and Sánchez 2020; Dermont and Weisstanner 2020). Further, the existing literature on a UBI mostly focuses on political, systemic, or social research questions and is less concerned with the individual perspective of recipients. Existing research that does take the individual perspective examines either (1) individual characteristics associated with UBI support (e.g., Busemeyer, Rinscheid, and Schupp 2023; Shin, Keppnanien, and Kuitto 2021; Vlandas 2021) or (2) individual attitudes towards a UBI in general (e.g., Laenen, Van Hootegem, and Rossetti 2023; Stadelmann-Steffen and Dermont 2020; Zimmermann et al. 2020) or (3) towards specific features of a UBI (e.g., Rincon 2023; Rincon, Vlandas, and Hiilamo 2022; Rossetti et al. 2020). While (2) and (3) are aimed to better understand what features of a UBI are attractive or unattractive to people, (1) aims to better understand what characterizes people who accept or reject a UBI.
There are several studies that have examined individual characteristics associated with UBI support. Roosma and van Oorschot (2020), Vlandas (2021), and Shin, Keppnanien, and Kuitto (2021), for example, used pre-pandemic data from 2016 to analyze socio-demographic variables across different European countries. Choi (2021) examined the association between values and UBI support, and Parolin and Siöland (2020) investigated the association between political attitudes and UBI support. However, all these studies used the same dataset (8th wave of the European Social Survey collected in 2016), which means that the richness of the results, especially with regard to socio-demographic variables such as gender, age, etc., is not quite as high as it first appears.
Furthermore, UBI support is very likely to depend on existing welfare systems as well as historical, economic, and cultural factors of a country (Zimmermann et al. 2020). Thus, country-specific research is important to complement cross-country comparisons, especially because neither evidence from cross-country studies nor from single-country studies can be transferred to other countries unreservedly. There are several studies that have used pre-pandemic country-specific data, e.g., from Japan (Yang, Mohan, and Fukushi 2020), the UK and Finland (Chrisp, Pulkka, and García 2020), or Germany (Adriaans, Liebig, and Schupp 2019), to add a country-specific perspective to the aforementioned cross-country studies. More recently, Weisstanner (2022) and Van Hootegem and Laenen (2023) used data that was collected during the COVID-19 pandemic to examine socio-demographic variables in the UK and Belgium, and Busemeyer, Rinscheid, and Schupp (2023) investigated UBI acceptance in Germany using post-pandemic data.
Although the abovementioned studies investigated factors associated with UBI support, all of these studies have a strong socio-demographic focus and lack a psychological perspective. As it is very likely that both socio-demographic variables, i.e., variables that cover facts about people (e.g., age or gender), and psychological variables, i.e., variables that cover people’s subjective experience (e.g., equality orientation or job satisfaction), are relevant for explaining UBI support, this is a major research gap. Especially considering that UBI support is also a product of subjective evaluation and thus a psychological variable, it is very plausible that psychological variables significantly contribute to explaining UBI support and might even surpass socio-demographic factors in relevance. Furthermore, because many potential predictors are likely to overlap, it is important not only to analyze bivariate relationships between UBI support and potentially relevant variables, but to identify unique relations and examine their relative importance in explaining UBI support. To our knowledge, there is no research that does this and examines the relative importance of socio-demographic and psychological predictions in a multivariate analysis. Moreover, all presented studies examined predictors of UBI support in the full population. Studies focusing on the working population as the largest group that is directly affected by technological unemployment and potential changes of the welfare system in reaction to this, to our knowledge, have not yet been conducted.
We address these research gaps by identifying not only socio-demographic but also psychological predictors of UBI acceptance (which we use equivalent to UBI support) in a multivariate analysis with a specific focus on the German working population using data that was collected during the COVID-19 pandemic. With our research, we intend to take the individual dimension of the UBI debate into focus and add a psychological perspective to the ongoing debates. We do so by (1) investigating a psychological criterion, i.e., UBI acceptance, (2) by examining several well-established psychological predictors (e.g., job satisfaction, performance orientation, loneliness) regarding their relevance for explaining UBI acceptance, and (3) by differentiating between objectively measurable socio-demographic and subjective psychological predictor variables of UBI acceptance in a multivariate analysis.
Specifically, we combined a total of 15 variables in a comprehensive multivariate analysis to identify relevant socio-demographic and psychological predictors of UBI acceptance. Of these 15 variables, eight were socio-demographic (i.e., gender, age, income, education, care duty for children, unemployment frequency, regional origin in Germany, and employment status) and seven were psychological (i.e., job satisfaction, perceived economic situation, performance orientation, corona perception, equality orientation, leisure satisfaction, and loneliness).
We investigated these variables partly based on directed hypotheses and partly exploratory. For a first set of variables (i.e., gender, age, income, and education), we aimed to replicate existing findings to provide more robust evidence and complement existing research by examining their relative importance in explaining UBI acceptance. Thus, existing empirical evidence was used to derive directed hypotheses.
A second set of variables captures concepts that are considered established in psychology but have not yet or only sporadically been studied in the context of UBI acceptance (i.e., job satisfaction, perceived economic situation, performance orientation, corona perception, and equality orientation). Consequently, there is little to no empirical evidence on the relationship between those psychological predictors and UBI acceptance. This is not surprising, since psychological research in general paid little attention to the topic of a UBI so far (Hüffmeier and Zacher 2021). Still, there are related empirical findings on the predictor level that we combined and argumentatively related to UBI acceptance to derive directed hypotheses.
For a last set of variables containing both socio-demographic and psychological predictors, there is too little robust prior work to justify hypotheses (i.e., care duty for children, unemployment frequency, regional origin in Germany, employment status, leisure satisfaction, and loneliness). Thus, we conducted exploratory analyses for these variables.
1.1 Gender, Age, and Education
Gender is much discussed in the context of a UBI (emancipation, gender pay gap, etc.). However, the empirical evidence on the association between gender and UBI acceptance is inconclusive: Vlandas (2021) finds slightly higher UBI support among men, which he did not expect based on the literature consulted, which rather suggests higher UBI support among women. Roosma and van Oorschot (2020) and Shin, Keppnanien, and Kuitto (2021) find no gender effect based on the same data (European Social Survey, 2016, 8th wave), neither do Adriaans, Liebig, and Schupp (2019) and Busemeyer, Rinscheid, and Schupp (2023) for the German resident population. However, even though gender may not be relevant for UBI support in resident populations, this could be different for the working population, which does not include pupils, students, and probably most importantly pensioners. Gender-specific differences in care work, income, and working hours are thus likely to be much more pronounced in the working population compared to the full resident population. As these are plausibly relevant factors shaping individuals’ expectation on how a UBI might influence their personal circumstances, gender may still be a relevant predictor in the working population. It is often argued that a UBI could provide women, who are still often earning less than men, with financial security, potentially strengthening emancipation as women’s financial independence increases (Schulz 2017). Additionally, it is likely that families expect a UBI to significantly increase their household income. Consequently, reducing regular working hours and using the UBI to compensate for the resulting loss of income may be an attractive option that allows for more flexibility in families. Assuming that women are still primarily responsible for childcare, it is plausible that they would particularly benefit from this gained flexibility. On the one hand, because more family time is created in which women are relieved of their care duties. On the other hand, because more care time can be covered by the partner, creating free space for women to use for their own purposes (professional or private). Taken together, we therefore find it plausible that women in the working population would expect greater personal benefits from a UBI than men. Accordingly, we assume that women are more likely to support the idea of a UBI and hypothesize for our data of the German working population:
H1:
Women show significantly higher UBI acceptance than men.
In Germany, as a country with a relatively old and comparatively well-educated population, age and education play a significant role in the UBI discussion. A study conducted by Adriaans, Liebig, and Schupp (2019) revealed significantly higher UBI acceptance among people of younger age and higher education in Germany. Similar results have been found for Europe. Vlandas (2021) also found younger age and higher education to be significantly associated with higher UBI support, while Roosma and van Oorschot (2020) found the same age effect, but the opposite for education and Shin, Keppnanien, and Kuitto (2021) only found the same age effect. Findings by Busemeyer, Rinscheid, and Schupp (2023) point into a similar direction. Their analysis of two representative samples of the German resident population shows that compared to people above 65 years old, UBI acceptance was significantly higher among people between 25 and 45 years old, while there was no significant effect for people below 25 years and people between 46 and 65 years old. In tendency, these results suggest that UBI acceptance is higher among younger people in the working population. Thus, for our sample of the German working population, we hypothesize:
H2:
Age correlates significantly negatively with UBI acceptance.
H3:
People with higher education show significantly higher UBI acceptance than people with lower education.
1.2 Perceived Economic Situation and Income
As a UBI would constitute an additional source of income, it is intuitively plausible that the current amount of income may have an influence on UBI acceptance. Vlandas (2021) and Shin, Keppnanien, and Kuitto (2021) found lower income to be associated with higher UBI support using the European Social Survey data. Results by Adriaans, Liebig, and Schupp (2019) and Busemeyer, Rinscheid, and Schupp (2023) for Germany also suggest higher UBI acceptance among those who would directly financially profit from a UBI.
However, a distinction must be made between the objective and subjective conceptualization and operationalization of people’s economic situation. It is possible that people are objectively in a privileged economic situation but perceive their economic situation as difficult. Accordingly, the objective and subjective assessment of people’s economic situation can diverge. The relevance of this differentiation is particularly important in cases of difficult economic situations, as Sinclair and Cheung (2016) show in their overview and Klug, Selenko, and Gerlitz (2021) in their current study for data from Germany. With regard to a UBI, research by Roosma and van Oorschot (2020) finds that unemployment (objective) but also a lower subjective income (subjective) correspond with higher UBI acceptance. Thus, we hypothesize:
H4:
People with a lower net income show significantly higher UBI acceptance than people with a higher net income.
H5:
The perceived own current economic situation correlates significantly negatively with UBI acceptance.
1.3 Corona Perception
The COVID-19 pandemic was an “economic shock” (Hensher 2020, p. 1) and quickly became one of the largest global economic crises. This led to a large increase in macroeconomic (Carriero et al. 2021) and subjectively perceived economic uncertainty (Thum 2021). As times of financial insecurity often call for a change in policies, it is not surprising that the idea of a UBI has been discussed extensively among mainstream media since the onset of the pandemic (Hampel 2020). Both public opinion research insitutes (e.g., YouGov, WeMove Europe 2020) and academia (e.g., Nettle et al. 2021; Van Hootegem and Laenen 2023) have developed an interest in examining how support for a UBI changed during the COVID-19 pandemic and, if so, why.
Nettle and colleagues (2021) found that study participants who rated it as important to have a social security system that reduces stress and anxiety show higher UBI support. It seems likely that people who perceive the pandemic as threatening in that they expect negative consequences for themselves and people around them are more likely to experience anxiety and therefore more likely to value systems that reduce stress and anxiety. Thus, it seems plausible that these people also show higher UBI support. Busemeyer, Rinscheid, and Schupp (2023) analyzed two large representative samples of the German resident population and found that greater concern about one’s economic situation was significantly associated with higher UBI acceptance. Plausibly, a high perceived level of threat posed by the corona-pandemic includes concern about one’s economic situation and is thus also associated with higher UBI acceptance. Following this, we hypothesize:
H6:
The perceived level of personal threat posed by the corona-pandemic correlates significantly positively with UBI acceptance.
1.4 Equality Orientation
Since a UBI would be paid unconditionally to all citizens, thus treating all citizens equally regardless of their characteristics or proof of indigency, it is reasonable to assume that people associate an increase in equality with the implementation of a UBI. Thus, it is plausible that people who inherently care about equality would also be in favor of a UBI. This is supported by Schwander and Vlandas (2020) in their analysis of the European Social Survey data from 2016 (8th wave) and Adriaans, Liebig, and Schupp (2019) who analyzed data from Germany and found that people who perceive the needs of the most vulnerable in society as not being met are more likely to support a UBI. Therefore, we assume:
H7:
Equality orientation correlates significantly positively with UBI acceptance.
1.5 Performance Orientation
A representative poll in Germany found that 80 % of participants perceive it as fair that people who perform well make a lot of money (Informationsdienst des Instituts der deutschen Wirtschaft 2019). “Performance must pay off” appears to be a central motive of performance-oriented societies such as Germany, in which we often also see a relatively high centrality of work in life (Lu et al. 2019). Thus, it is not surprising that in countries with higher average employment commitment, the acceptance of a UBI, which is need- and not performance-oriented (Segbers 2019), is lower (Kozák 2021). For Germany, Adriaans, Liebig, and Schupp (2019) found that people who are more likely to support the performance principle as a social distribution rule are less likely to support a UBI. Thus, we hypothesize:
H8:
Performance orientation correlates significantly negatively with UBI acceptance.
1.6 Job Satisfaction
Low job satisfaction scores are associated with higher absenteeism rates (Scott and Taylor 1985; Čikeš, Maškarin Ribarić, and Črnjar 2018 for a review), and turnover intentions (Chen et al. 2011; Hom et al. 2017). However, people who are not satisfied with their professional situation often do not quit their jobs due to extrinsic restraints such as financial necessities (Herzberg et al. 1993; Suadicani et al. 2013). An unconditional regular payment could free these people from financial boundaries and their unsatisfying work situation. Following this, we hypothesize:
H9:
Job satisfaction correlates significantly negatively with UBI acceptance.
1.7 Further Variables
Apart from the abovementioned, further variables, i.e., people’s care duty for children, regional origin in Germany, employment status, unemployment frequency, leisure satisfaction, and loneliness might also be relevant for UBI acceptance. Since these variables were included in the full survey dataset but cannot profoundly be grounded in the literature, we investigate them exploratively.
The introduction of a UBI is one possible way to address economic insecurities. However, many unanswered questions, including the issue of acceptance, remain. Our research contributes to the ongoing UBI discussion by providing insights into socio-demographic and psychological variables associated with UBI acceptance among the German working population based on recent data from the COVID-19 pandemic.
2 Method
2.1 Participants and Procedure
For the present study, we used a subsample of the 2020 data from a large representative multi-topic survey of the German-speaking resident population on physical and mental health that is conducted annually by the University of Leipzig. The 2020 survey was approved by the institutional ethics review board of the University of Leipzig (ref. 043/20-ek) and followed the ICH-GCP-guidelines. It was examined from ethical, medical-scientific, and legal points of view and was approved with no further restrictions.
The compilation of the survey sample and the data collection were carried out by USUMA GmbH, an independent institute for market and social research. The data were collected between May and June 2020. To ensure representativeness of the sample for the German-speaking resident population, the sample was randomly drawn using an area-based sample provided by the ADM (Arbeitskreis Deutscher Markt- und Sozialforschungsinstitute e.V. [Working Group of German Market and Social Research Institutes e.V.]) covering all inhabited areas in Germany. Within a total of 258 regional areas, 5418 households were randomly selected using a random-route-procedure and one target person was randomly identified in each household using a Kish-Selection-Grid. Of 5418 identified persons, 2521 could be reached and were interviewed.
All participants were informed about the study procedure, the voluntary nature, the right to withdraw, the strict confidentiality as well as the anonymization of all personal data. After giving informed consent, participants completed guided structured face-to-face interviews with trained interviewers at their homes. The interviews consisted of two parts. First, socio-demographic questions were read out loud and participant answers were noted down by the interviewer. Second, participants independently, and without any further moderation by the interviewer, filled in a questionnaire. A total of 18 interviews were unusable and directly excluded by USUMA so that the full survey dataset provided by USUMA comprised 2503 participants. Table S1 in the Supplemental Material provides details on the response rate.
For the present study, we used a subsample of the full survey dataset compiled by USUMA, which covers only the German working population (details on participant exclusion are provided in the analytic strategy section). The final sample size was N = 1986. The mean age was 44.4 years (SD = 13.64). Of the participants, 49.3 % were female, 15 % had a university degree, 32 % reported a personal net income of 2000 Euro or more, and 75.8 % reported being employed at the time of the study. Figure 1 provides an overview of the sampling procedure.
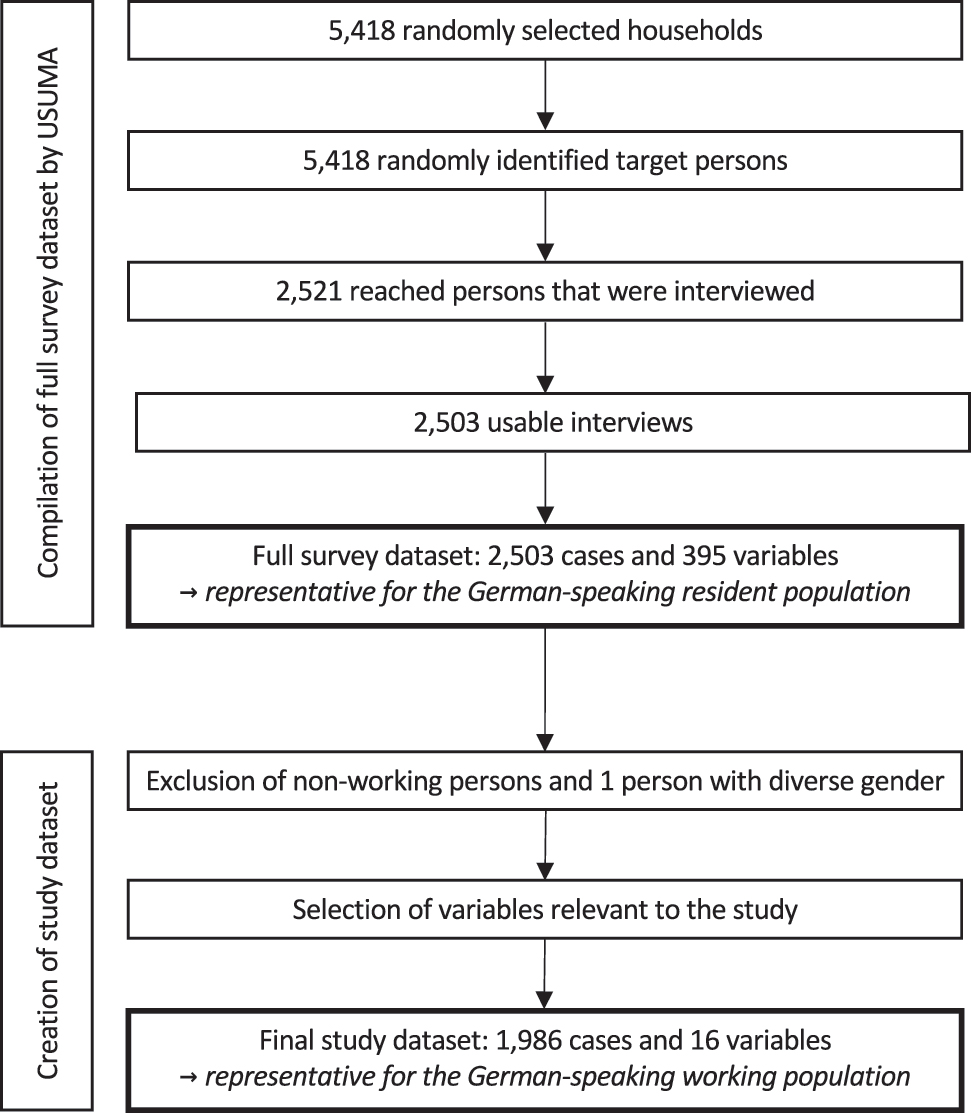
Sampling and variable selection procedure.
2.2 Measures
The full survey covered a wide range of topics (e.g., politics, health, religion). For the present study, selected measures were used. Those are reported below. Note that the survey was conducted in German. Thus, an English translation is provided here.
2.2.1 UBI Acceptance
UBI acceptance was assessed using two proxies, UBI agreement and UBI Amount. First, the UBI was shortly introduced: “A universal basic income (UBI) is defined as financial contributions that are sufficient to cover a person’s basic needs and are paid to each individual by the state on an ongoing basis and without any conditions.”. Following this, UBI agreement was measured using the item “I am convinced that everyone should receive a universal basic income (even people who are very well off financially).” (1 = not correct at all to 5 = fully correct). Thereafter, UBI Amount was measured using the following item: “How much basic income do you consider appropriate for an adult person in Germany per month (in Euros)?”. Due to space limitations, and as agreement contains richer information on UBI acceptance than the Euro amount, the present study focuses on UBI agreement.
2.2.2 Gender
Gender was measured using three categories: male, female, and diverse. For the present study, a dummy-coded variable was generated distinguishing between male (0) and female (1). The category “diverse” (n = 1) was excluded due to the small number of cases.
2.2.3 Age
Age was measured asking for the month and year of birth, and a variable was generated containing age in years.
2.2.4 Education
Education was measured using nine categories (see Table S2 in the Supplemental Material for all categories). For the present study, a dummy-coded variable was generated distinguishing between no university degree (0) and university degree (1), as we assume higher education to be relevant for UBI acceptance (Adriaans, Liebig, and Schupp 2019).
2.2.5 Regional Origin
Regional origin was measured asking for the German federal state where participants mostly grew up in. For the present study, a dummy-coded variable was generated distinguishing between West- (0) and East-Germany (1), as there are notable socialization differences between those groups that may influence UBI acceptance.
2.2.6 Care Duty (Children)
Care duty (children) was measured asking for the number of children below 15 years permanently living in the household.
2.2.7 Employment Status
Employment status was measured using nine categories (see Table S2 in the Supplemental Material for all categories). For the present study, a dummy-coded variable was generated distinguishing between participants currently not employed (e.g., due to unemployment, parenting or pension; 0) and employed (either part- or full-time; 1), as this differentiation is likely to be relevant for UBI acceptance (e.g., Roosma and van Oorschot 2020 for the relevance of unemployment).
2.2.8 Unemployment Frequency
Unemployment frequency was measured asking for the number of times of unemployment, including current unemployment.
2.2.9 Income
The personal net income was measured using 14 categories depicting different income ranges (see Table S2 in the Supplemental Material for all categories). The categories were not comparable as the income ranges varied across categories. Thus, a dummy-coded variable was generated for the present study distinguishing between a personal net income of up to 2000 Euro (0) and of 2000 Euro or higher (1). This cut-off was chosen following Schröder (2020) who finds that life satisfaction particularly benefits from rising income levels up to a personal net income of about 2000 Euro.
2.2.10 Perceived Economic Situation
Participants’ perceived own current economic situation was measured with one item: “And your own economic situation today? Is it … ” (1 = very good to 5 = very bad, 6 = don’t know), that was a follow-up item to “In general, how do you assess the economic situation in Germany today? Is it … ”. For the present analyses, the answers were inverted (1 = very bad to 5 = very good) for better understanding.
2.2.11 Job Satisfaction
Job satisfaction was measured with a single item taken from the general life satisfaction module of the FLZM-Questionnaire (Questions on Life SatisfactionModules, Henrich and Herschbach 2000). The module measures life satisfaction with eight items, of which each item measures satisfaction in one of eight different life domains (e.g., leisure activities/hobbies, family life/children, job/work). We used the item on job/work satisfaction, which was worded as follows: “How satisfied are you [with the life domain]…” “job/work” (1 = unsatisfied to 5 = very satisfied).
2.2.12 Leisure Satisfaction
Leisure satisfaction was measured with another single item taken from the general life satisfaction module of the FLZM-Questionnaire. The item was worded as follows: “How satisfied are you [with the life domain]…” “leisure activities/hobbies” (1 = unsatisfied to 5 = very satisfied).
2.2.13 Performance Orientation
Performance orientation was measured with one item that was part of a seven-item scale assessing different values and principles (e.g., “performance orientation”) concerning their importance (1 = not important at all to 7 = very important) (Decker and Brähler 2020).
2.2.14 Loneliness
Loneliness was measured with the three-item Loneliness scale-SOEP (LS-S, Richter and Weinhardt 2013). The items were worded as follows: “How often do you have the feeling … ” (1) “… that you miss the company of others?”, (2) “… of being left out?”, (3) “… that you are socially isolated?” and were answered from 1 = never to 5 = very often. The item answers were added up to a total scale value ranging from 3 to 15 (α = 0.83).
2.2.15 Equality Orientation
Equality orientation was measured with one item from a four-item short-scale assessing social dominance orientation using statements about how groups in society should relate to each other (SDO-4, Stellmacher, Sommer, and Brähler 2005). The item on equality orientation was worded as follows: “We should do what we can to create equal living standards for everyone.” (1 = do not agree at all to 4 = fully agree).
2.2.16 Corona Perception
The perception of the corona-pandemic was measured with one item that was part of a six-item scale assessing general attitudes towards the current social situation in Germany and the world (Schließler, Hellweg, and Decker 2020). The item was worded as follows: “The Corona pandemic is likely to have dire consequences for me and those around me.” (1 = not correct at all to 5 = fully correct).
2.3 Analytic Strategy
Data processing and all analyses were done in SPSS Version 27.0.1.0 (IBM 2020) and R Version 4.0.4 using the following packages: lavaan, Matrix, survey, spatstat, and weights. To create a subsample of the German working population, participants below 18 and over 67 years (n = 406), as well as university students and pupils (n = 190), were excluded. Furthermore, due to the small number of cases, participants who indicated a diverse gender (n = 1) were also excluded. Note that 80 of the excluded participants met several exclusion criteria. In total, data from 517 participants were excluded and the final sample comprised N = 1986. Participants with missing values in at least one of the variables of interest were identified (n = 462). A sensitivity analysis with G*Power Version 3.1.9.6 (Faul et al. 2009) indicated that the sample size provides sufficient power to detect effect sizes as small as f 2 = .003 with a power of .80 and an alpha error probability of .05.
The representativeness of the full survey sample for the German-speaking resident population was ensured by USUMA through the sample compilation procedure (see Section 2.1). However, dropouts may have limited the representativeness of the sample. Comparing the data with the known distributions from the German microcensus on household and person level revealed slight deviations (the microcensus is the largest annual household survey in Germany conducted by the German Federal Statistical Office (Statistische Ämter des Bundes und der Länder 2022), participation is mandatory by law and thus self-selection bias is not an issue). To account for this, statistical weights were applied to the data to correct for these deviations and ensure representativeness of the data. Specifically, the statistical weighting corrected at household level for deviations in the distribution of household sizes and at the personal level for deviations in the joint distribution of age and gender as well as deviations in the distribution of the state of residence (USUMA 2020). All analyses were performed on the weighted dataset of N = 1986.
To answer the research question and hypotheses, a four-step hierarchical multiple linear regression was performed defining UBI agreement as outcome variable. The other variables were used as correlated predictors. The four models of the hierarchical multiple linear regression were specified and tested in lavaan as path models. Although the model specifications as path models were identical to the regression models, path modeling allows to use maximum likelihood estimation which has fewer assumptions than ordinary least square regression and allows to better address missing data via using a full information maximum likelihood estimator (Enders and Bandalos 2001).
The order of variable entry for the hierarchical regression was based on two criteria: the assumed sequence of effects between predictor variables (socio-demographic predictors before psychological predictors) and the importance of predictors in explaining the outcome (hypothesized effect before exploratory investigation). This means that, first, socio-demographic predictors (e.g., Age) entered the model before psychological predictors (e.g., Job satisfaction) and second, predictors for which hypotheses have been formulated (e.g., Age or Job satisfaction) entered the model before predictors that should be examined exploratively, i.e., without hypotheses (e.g., Regional origin or Loneliness). Thus, socio-demographic predictors were entered in steps 1 and 2, with “hypothesized-effect” predictors preceding “exploratory” predictors (step 1 included “hypothesized-effect” socio-demographic predictors: Gender, Age, Income, Education; step 2 included “exploratory” socio-demographic predictors: Care duty (children), Unemployment frequency, Regional origin, Employment status). In steps 3 and 4, psychological predictors were entered accordingly, i.e., with “hypothesized-effect” predictors preceding “exploratory” predictors (step 3 included “hypothesized-effect” psychological predictors: Job satisfaction, Perceived economic situation, Performance orientation, Corona perception, Equality orientation; step 4 included “exploratory” psychological predictors: Leisure satisfaction, Loneliness).
Multivariate normal distribution was tested. Potential suppression effects were evaluated and relative weights of predictors as a percentage of R 2 were computed (Bhalla 2020; Johnson 2000). In order to estimate relative weights, a model implied correlation matrix was obtained for each path model. This variance is based on the sampling weights and full information maximum likelihood. To obtain the relative weights, the correlation matrix was entered into a Shiny App by Tonidandel and LeBreton (2015). Effect sizes were calculated and interpreted according to Gignac and Szodorai (2016) with r = .10 being a small, r = .20 a moderate, and r = .30 a large effect. Due to the large sample size, p-values should be interpreted with caution and only in the context of effect sizes. In line with this, it was refrained from halving p-values for one-tailed hypotheses.
To further test the robustness of the main effects and complement the main analysis, possible interaction effects were investigated. For this, an empirical-inductive (i.e., an exploratory) approach was adopted and all possible interactions between the significant variables in the main analysis were investigated. Dummy-coded variables were coded −1 and 1, variables with no meaningful zero-point were mean-centered, and all possible interactions were generated. First, a reduced regression model, specified and tested as a path model, was computed, including the significant predictors from the main model specification and all respective interactions. In a next step, the significant interactions from the first step were added to the main model specification to ensure the specificity of the interaction effects. Interaction plots were derived from this extended model using the interaction utility by Preacher, Curran, and Bauer (2006).
3 Results
3.1 Descriptive Statistics
Frequencies of all dichotomous variables can be found in Table 1. Descriptive statistics for all metric variables are shown in Table 2. On average, participants rather agreed with a UBI (M = 3.34, SD = 1.38, CI LL = 3.28, CI UL = 3.41). Frequencies of participants’ UBI agreement rating can be found in Figure 2.
Frequencies of all dichotomous variables.
| Variable | n | % |
|---|---|---|
| Gender | ||
| Male | 1007 | 51 |
| Female | 979 | 49 |
| Missing | 0 | 0 |
| Income | ||
| Income <2000€ | 1262 | 64 |
| Income ≥2000€ | 635 | 32 |
| Missing | 89 | 4 |
| Education | ||
| No university degree | 1681 | 85 |
| University degree | 298 | 15 |
| Missing | 7 | <1 |
| Regional origin | ||
| West-German origin | 1414 | 71 |
| East-German origin | 379 | 19 |
| Missing | 193 | 10 |
| Employment status | ||
| Not employed | 455 | 23 |
| Employed | 1505 | 76 |
| Missing | 26 | 1 |
-
Based on N = 1986.
Descriptive statistics and confidence intervals for all metric variables.
| Variable | Min | Max | Mdn | M | SD | 95 % CI | Number of missings | |
|---|---|---|---|---|---|---|---|---|
| LL | UL | |||||||
| UBI agreement | 1 | 5 | 2.50 | 3.34 | 1.38 | 3.28 | 3.41 | 13 |
| Age | 18 | 67 | 45.50 | 44.39 | 13.64 | 43.75 | 45.02 | 0 |
| Care duty (children) | 0 | 6 | 0.00 | 0.28 | 0.66 | 0.25 | 0.30 | 0 |
| Unemployment frequency | 0 | 14 | 0.00 | 1.01 | 1.51 | 0.94 | 1.09 | 75 |
| Job satisfaction | 1 | 5 | 3.50 | 3.57 | 1.10 | 3.51 | 3.62 | 47 |
| Perceived economic situation | 1 | 5 | 2.50 | 3.31 | 0.96 | 3.26 | 3.36 | 43 |
| Performance orientation | 1 | 7 | 4.50 | 5.15 | 1.35 | 5.09 | 5.21 | 11 |
| Corona perception | 1 | 5 | 2.50 | 3.30 | 1.13 | 3.25 | 3.36 | 10 |
| Equality orientation | 1 | 4 | 2.50 | 3.32 | 0.68 | 3.29 | 3.35 | 16 |
| Leisure satisfaction | 1 | 5 | 3.50 | 3.81 | 0.90 | 3.77 | 3.85 | 10 |
| Loneliness | 3 | 15 | 5.50 | 6.11 | 2.60 | 5.99 | 6.23 | 24 |
-
Based on N = 1986. Min = minimum; Max = maximum; Mdn = median; M = mean; SD = standard deviation; CI = confidence interval; LL = lower limit; UL = upper limit.
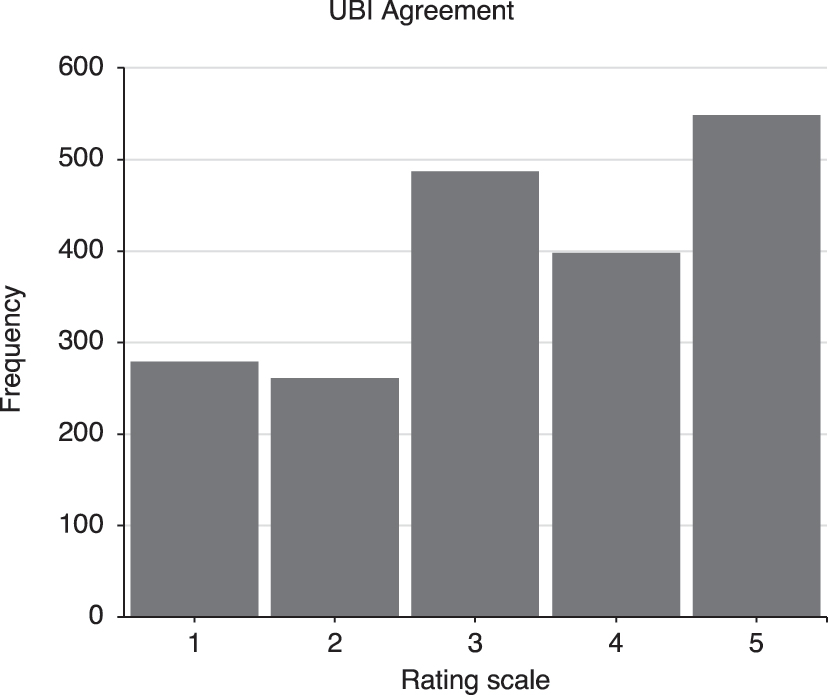
Frequencies of participants’ UBI agreement rating. UBI agreement was measured with the item “I am convinced that everyone should receive a universal basic income (even people who are very well off financially).” on a scale from 1 = not correct at all to 5 = fully correct.
3.2 Model Specification: Hierarchical Regression
The correlations for all variables can be found in Table 3. The results of the hierarchical multiple regression are shown in Table 4. The models were evaluated using the amount of explained variance (R 2) and the increase in R 2 across models (ΔR 2). As can be seen in Table 4, the R 2 improves with each step, from .01 in step 1 to .07 in step 4 (ΔR 2 = .06). Thus, the complete model containing all 15 predictors provides the best model information and can be considered the model of choice yielding a small to moderate amount of explained variance. The comparison of results using weighted and unweighted data did not reveal any substantial differences (see Table S3 in the Supplemental Material).
Bivariate correlations for all variables.
| Variable | 1 | 2 | 3 | 4 | 5 | 6 | 7 | 8 | 9 | 10 | 11 | 12 | 13 | 14 | 15 | 16 |
|---|---|---|---|---|---|---|---|---|---|---|---|---|---|---|---|---|
| 1. UBI agreement | – | |||||||||||||||
| 2. Gender | .03 | – | ||||||||||||||
| 3. Age | −.05* | .03 | – | |||||||||||||
| 4. Income | −.07** | −.27** | .10** | – | ||||||||||||
| 5. Education | <.01 | −.05* | .09** | .30** | – | |||||||||||
| 6. Care duty (children) | <.01 | .07** | −.23** | .03 | <.01 | – | ||||||||||
| 7. Unemployment frequency | .07** | −.01 | .11** | −.21** | −.10** | <.01 | – | |||||||||
| 8. Regional origin | .12** | .02 | .05* | −.10** | .02 | .03 | .13** | – | ||||||||
| 9. Employment status | −.04 | −.07** | −.24** | .23** | .05* | .04 | −.21** | −.01 | – | |||||||
| 10. Job satisfaction | −.05* | −.04 | −.03 | .26** | .09** | .03 | −.24** | −.06* | .36** | – | ||||||
| 11. Perceived economic situation | −.13** | −.04 | .09** | .28** | .21** | −.02 | −.25** | −.06* | .19** | .47** | – | |||||
| 12. Performance orientation | −.02 | −.07** | −.02 | .10** | >–.01 | .04 | −.06* | .09** | .09** | .18** | .12** | – | ||||
| 13. Corona perception | .09** | .02 | .05* | >–.01 | −.06* | .02 | .05* | <.01 | −.01 | −.06** | −.19** | .09** | – | |||
| 14. Equality orientation | .18** | .11** | .01 | −.06* | .02 | .03 | .04 | .01 | −.05* | −.01 | −.03 | −.02 | .08** | – | ||
| 15. Leisure satisfaction | .02 | −.08** | −.03 | .13** | .04 | −.03 | −.17** | −.08** | .13** | .39** | .23** | .11** | −.05* | .03 | – | |
| 16. Loneliness | .04 | .09** | −.07** | −.21** | −.11** | −.01 | .23** | .03 | −.21** | −.36** | −.39** | −.09** | .15** | >–.01 | −.33** | – |
-
Based on N = 1986. For each variable pair, cases with missing values in at least one of the respective variables were excluded. *p < .05. **p < .01.
Hierarchical regression results for UBI agreement.
| Variable | B | 95 % CI for B | SE B | β | z | p | r part | R 2 | ΔR 2 | |
|---|---|---|---|---|---|---|---|---|---|---|
| LL | UL | |||||||||
| Step 1 | .009 | .009 | ||||||||
| Gendera | 0.05 | −0.08 | 0.17 | 0.06 | .02 | 0.77 | .441 | .02 | ||
| Age | >–0.01 | −0.01 | <0.01 | <0.01 | −.04 | −1.53 | .126 | −.03 | ||
| Incomeb | −0.25** | −0.39 | −0.11 | 0.07 | −.09** | −3.44 | .001 | −.07 | ||
| Educationc | 0.13 | −0.05 | 0.31 | 0.09 | .04 | 1.46 | .143 | .03 | ||
| Step 2 | .025 | .016 | ||||||||
| Gendera | 0.08 | −0.05 | 0.21 | 0.06 | .03 | 1.25 | .211 | .03 | ||
| Age | −0.01** | −0.01 | >−0.01 | <0.01 | −.06** | −2.62 | .009 | −.05 | ||
| Incomeb | −0.13 | −0.28 | 0.02 | 0.08 | −.05 | −1.72 | .086 | −.03 | ||
| Educationc | 0.11 | −0.06 | 0.29 | 0.09 | .03 | 1.25 | .211 | .03 | ||
| Care duty (children) | −0.01 | −0.10 | 0.08 | 0.05 | −.01 | −0.20 | .840 | .00 | ||
| Unemployment frequency | 0.06* | 0.01 | 0.10 | 0.02 | .06* | 2.55 | .011 | .06 | ||
| Regional origind | 0.33*** | 0.17 | 0.49 | 0.08 | .10*** | 4.12 | <.001 | .10 | ||
| Employment statuse | −0.11 | −0.27 | 0.04 | 0.08 | −.04 | −1.42 | .154 | −.03 | ||
| Step 3 | .072 | .047 | ||||||||
| Gendera | 0.02 | −0.10 | 0.14 | 0.06 | .01 | 0.34 | .737 | .01 | ||
| Age | −0.01* | −0.01 | >–0.01 | <0.01 | −.06* | −2.40 | .017 | −.05 | ||
| Incomeb | −0.09 | −0.24 | 0.06 | 0.08 | −.03 | −1.12 | .263 | −.02 | ||
| Educationc | 0.15 | −0.02 | 0.33 | 0.09 | .04 | 1.71 | .087 | .04 | ||
| Care duty (children) | −0.03 | −0.12 | 0.07 | 0.05 | −.01 | −0.54 | .587 | −.01 | ||
| Unemployment frequency | 0.03 | −0.01 | 0.07 | 0.02 | .03 | 1.41 | .159 | .03 | ||
| Regional origind | 0.34*** | 0.18 | 0.50 | 0.08 | .10*** | 4.27 | <.001 | .10 | ||
| Employment statuse | −0.08 | −0.24 | 0.08 | 0.08 | −.03 | −1.01 | .313 | −.02 | ||
| Job satisfaction | 0.08* | 0.01 | 0.14 | 0.03 | .06* | 2.26 | .024 | .04 | ||
| Perceived economic situation | −0.18*** | −0.26 | −0.11 | 0.04 | −.13*** | −4.73 | <.001 | −.09 | ||
| Performance orientation | −0.03 | −0.07 | 0.02 | 0.02 | −.03 | −1.15 | .250 | −.03 | ||
| Corona perception | 0.08** | 0.03 | 0.14 | 0.03 | .07** | 3.01 | .003 | .07 | ||
| Equality orientation | 0.33*** | 0.25 | 0.42 | 0.05 | .17*** | 7.46 | <.001 | .16 | ||
| Step 4 | .074 | .002 | ||||||||
| Gendera | 0.03 | −0.10 | 0.15 | 0.06 | .01 | 0.46 | .648 | .01 | ||
| Age | −0.01* | −0.01 | >–0.01 | <0.01 | −.06* | −2.34 | .019 | −.05 | ||
| Incomeb | −0.09 | −0.24 | 0.06 | 0.08 | −.03 | −1.14 | .255 | −.02 | ||
| Educationc | 0.16 | −0.02 | 0.33 | 0.09 | .04 | 1.74 | .081 | .04 | ||
| Care duty (children) | −0.02 | −0.11 | 0.07 | 0.05 | −.01 | −0.45 | .653 | −.01 | ||
| Unemployment frequency | 0.03 | −0.01 | 0.08 | 0.02 | .04 | 1.54 | .125 | .03 | ||
| Regional origind | 0.35*** | 0.19 | 0.50 | 0.08 | .10*** | 4.36 | <.001 | .10 | ||
| Employment statuse | −0.08 | −0.24 | 0.08 | 0.08 | −.02 | −0.95 | .344 | −.02 | ||
| Job satisfaction | 0.05 | −0.02 | 0.12 | 0.04 | .04 | 1.39 | .166 | .02 | ||
| Perceived economic situation | −0.18*** | −0.26 | −0.11 | 0.04 | −.13*** | −4.70 | <.001 | −.09 | ||
| Performance orientation | −0.03 | −0.07 | 0.02 | 0.02 | −.03 | −1.24 | .217 | −.03 | ||
| Corona perception | 0.08** | 0.03 | 0.14 | 0.03 | .07** | 3.04 | .002 | .07 | ||
| Equality orientation | 0.33*** | 0.24 | 0.42 | 0.05 | .16*** | 7.37 | <.001 | .16 | ||
| Leisure satisfaction | 0.08* | 0.01 | 0.15 | 0.04 | .05* | 2.12 | .034 | .04 | ||
| Loneliness | >–0.01 | −0.03 | 0.03 | 0.01 | >–.01 | −0.10 | .917 | <.01 | ||
-
Based on N = 1986. B = unstandardized beta; CI = confidence interval; LL = lower limit; UL = upper limit; SE B = standard error for the unstandardized beta; β = standardized beta; z = z-value; p = p-value; r part = semi-partial correlation; R 2 = coefficient of determination; ΔR 2 = change in R 2. a0 = male, 1 = female. b0 = income <2000€, 1 = income ≥ 2000€. c0 = no university degree, 1 = university degree. d0 = West-German origin, 1 = East-German origin. e0 = not employed, 1 = employed. *p < .05. **p < .01. ***p < .001.
3.3 Main Analysis: Hypotheses
The basis for answering the hypotheses is the complete model of the hierarchical multiple linear regression (step 4 in Table 4). As can be seen here, Age (β = −.06, z = −2.34, p = .019, r part = −.05), Regional origin (β = .10, z = 4.36, p < .001, r part = .10), Perceived economic situation (β = −.13, z = −4.70, p < .001, r part = −.09), Corona perception (β = .07, z = 3.04, p = .002, r part = .07), Equality orientation (β = .16, z = 7.37, p < .001, r part = .16), and Leisure satisfaction (β = .05, z = 2.12, p = .034, r part = .04) had significantly unique relations with UBI agreement with small effect sizes except for Equality orientation, where the effect size was moderate.
Thus, H2 (Age), H5 (Perceived economic situation), H6 (Corona perception), and H7 (Equality orientation) could be confirmed. Hence, being comparably younger, perceiving one’s current economic situation to be worse and the threat of the corona-pandemic to be higher, as well as being more in favor of equal living standards were uniquely associated with higher UBI agreement. Additionally, being of East-German origin was also uniquely associated with higher UBI agreement. However, H1 (Gender, β = .01, z = 0.46, p = .648, r part = .01), H3 (Education, β = .04, z = 1.74, p = .081, r part = .04), H4 (Income, β = −.03, z = −1.14, p = .255, r part = −.02), H8 (Performance orientation, β = −.03, z = −1.24, p = .217, r part = −.03), and H9 (Job satisfaction, β = .04, z = 1.39, p = .166, r part = .02) had to be rejected. Furthermore, there was no significant unique relationship between UBI agreement and Care duty (children), (β = −.01, z = −0.45, p = .653, r part = −.01), Unemployment frequency (β = .04, z = 1.54, p = .125, r part = .03), Employment status (β = −.02, z = −0.95, p = .344, r part = −.02), and Loneliness (β > −.01, z = −0.10, p = .917, r part < .01).
The final model explains about 7 % of variance in UBI agreement. To identify the contribution of each variable to R 2, relative weights were computed. The largest contributions came from Equality orientation (39 %), Perceived economic situation (19 %), and Regional origin (14 %).
3.4 Further Analyses: Interactions
To explore interaction effects, an empirical-inductive approach was used. First, all possible interactions were generated based on the main effects (i.e., fifteen interactions for six main effects). Second, to identify significant interactions, a reduced regression model including the significant predictors from the complete model (i.e., the six main effects) and all respective interactions (i.e., fifteen interactions) was computed. Third, a second regression analysis was calculated, adding the significant interactions to the complete model (i.e., all 15 predictors and all significant interactions). The first analysis revealed three significant interactions between Perceived economic situation and Equality orientation (β = .06, z = 2.66, p = .008, r part = .06), Equality orientation and Leisure Satisfaction (β = −.05, z = −2.13, p = .034, r part = −.05), and Corona perception and Leisure satisfaction (β = .05, z = 2.01, p = .044, r part = .04). Adding these three interactions to the complete model in the second analysis yielded significant coefficients with small effect sizes for the interactions between Perceived economic situation and Equality orientation (β = .07, z = 2.86, p = .004, r part = .06) and Equality orientation and Leisure satisfaction (β = −.05, z = −2.07, p = .038, r part = −.05) (see Table S4 in the Supplemental Material for the regression results). See Figures 3 and 4 for the corresponding interaction plots. As shown in Figure 3, for people with higher Equality orientation, the perception of their economic situation had a smaller relation with UBI agreement than for people with lower Equality orientation. Moreover, people with higher Equality orientation had a higher UBI agreement than people with lower Equality orientation regardless of their perceived economic situation and vice versa. As shown in Figure 4, while for people with higher Equality orientation there is almost no relation between UBI agreement and Leisure satisfaction, there is a strong positive relation between Leisure satisfaction and UBI agreement for people with lower Equality orientation. Again, Figure 4 also shows that people with higher Equality orientation had a higher UBI agreement than people with lower Equality orientation regardless of their Leisure satisfaction and vice versa.
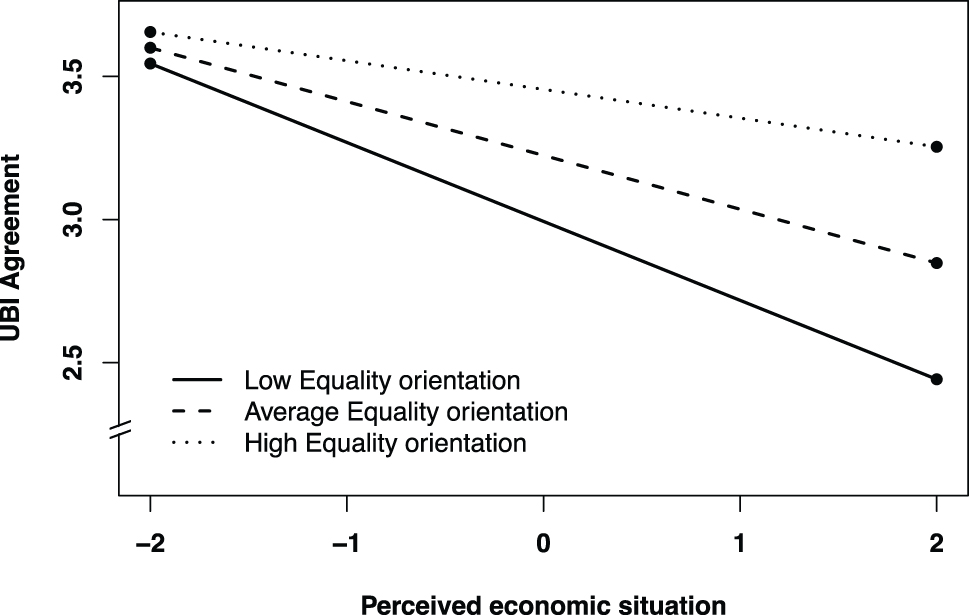
Interaction plot of Equality orientation and Perceived economic situation.
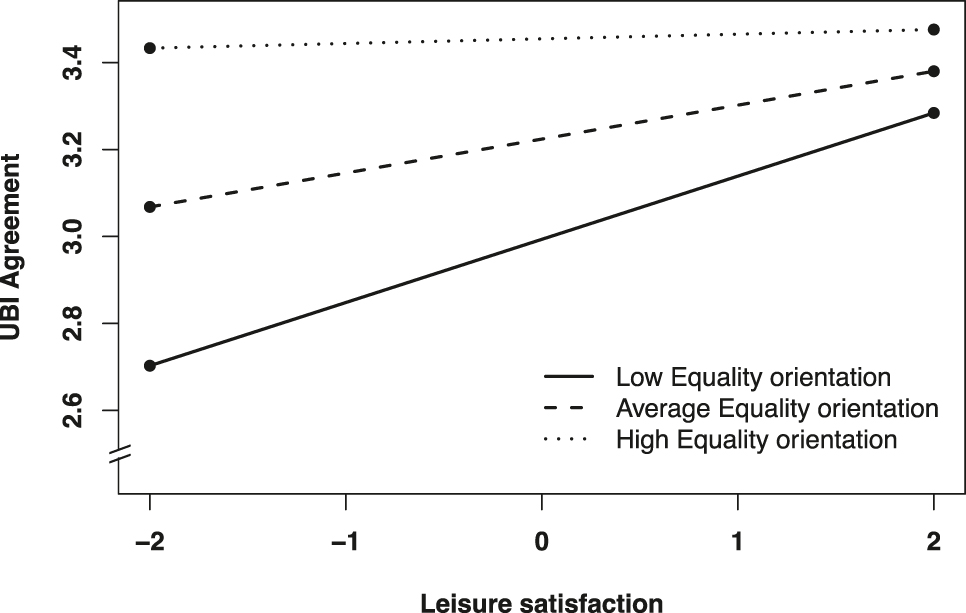
Interaction plot of Leisure satisfaction and Equality orientation.
4 Discussion
4.1 Summary of Results
To identify relevant socio-demographic and psychological predictors of UBI acceptance among the German working population, we analyzed representative data that were collected during the first peak of the COVID-19 pandemic between May and June 2020 in a comprehensive multivariate analysis. First of all, we found that, on average, members of the German working population supported the idea of a UBI. Further, we found that being more supportive of a UBI went along with being comparably younger (H2), of East-German origin, and more in favor of equal living standards (H7), as well as perceiving one’s economic situation to be worse (H5) and the threat of the corona-pandemic to be higher (H6). Moreover, for participants being more in favor of equal living standards, their perceived economic situation as well as their leisure satisfaction had a lower influence on UBI agreement and vice versa. Yet, we found no significant association between UBI agreement and Gender (H1), Education (H3), Income (H4), Performance orientation (H8), and Job satisfaction (H9).
With our research, we add to the literature on individual characteristics associated with UBI support by providing a perspective on the German working population using current data from the onset of the COVID-19 pandemic, and most importantly, by identifying not only relevant socio-demographic but also psychological predictors of UBI acceptance in a comprehensive multivariate analysis.
4.2 Discussion of Selected Results
4.2.1 Equality Orientation
We found a significantly positive and unique relation between Equality orientation and UBI acceptance in our multivariate analysis. As a UBI intends to create more equal basic living standards and social security, this seems not surprising. It can be assumed that there is a notable overlap regarding values driving opinions on both concepts necessitating future research. First studies on UBI and values (e.g., Choi 2021) support this.
4.2.2 Perceived Economic Situation and Income
Following evidence by Sinclair and Cheung (2016) and Klug, Selenko, and Gerlitz (2021) as well as a recent meta-analysis by Tan et al. (2020) that support the importance of differentiating between objective and subjective measures of people’s economic situation, we included Income (objective) as well as Perceived economic situation (subjective) in our multivariate analysis. Interestingly, we only found Perceived economic situation but not Income to be significantly negatively associated with UBI acceptance. Most likely, income is one component, along with, for example, wealth, debt, expenditures, and personal living standards that influences participants’ subjective assessment of their economic situation. Thus, it is plausible that the subjective measure of perceived economic situation also captures the effect of income on UBI acceptance, and that income by itself has no direct effect on UBI acceptance. Not the amount of money received every month itself but the subjective evaluation of this amount of money (and more) impacts UBI acceptance. If both variables are included in the regression, it is therefore plausible that the effect of income is not significant. Nevertheless, we still suggest including income in any multivariate analysis of UBI agreement as it may be a good proxy for other relevant variables that may not be measurable and thus cannot be included in the regression model. However, for our analysis only a dummy-coded income variable was available. Future research should use a metric income measure that captures more variability.
4.2.3 Regional Origin
We found a significant positive relation between Regional origin and UBI acceptance, indicating that being more supportive of a UBI went along with being of East-German origin. The different economic, social, and political systems in East- and West-Germany before reunification led to very different socialization experiences that still shape today’s East-German population. In former East-Germany, unemployment was very rare and income differences were suppressed by the state (Diewald, Solga, and Goedicke 1999). With reunification in 1989 this changed. Suddenly, unemployment skyrocketed, income inequality emerged, and the currency reform devalued savings (Ketzmerick 2016). Research finds persisting differences between East- and West-Germany, e.g., lower income and higher unemployment rates (Petrunyk and Pfeifer 2016), lower wealth (Grabka 2014), lower life satisfaction (Kasinger et al. 2022), lower occupational achievement (Granato 2011), and more chronic exhaustion (Braunheim et al. 2022) in East-Germany. All these aspects can be expected to be associated with UBI acceptance (see, e.g., Shin, Keppnanien, and Kuitto 2021 for evidence on unemployment). However, these many aspects are difficult to assess individually in a single survey. Proxy variables such as Regional origin that capture a multitude of factors and reflect large differences in socialization experiences of certain population groups are, therefore, useful for future UBI research.
Interestingly, the COVID-19 pandemic incidences were higher in East-Germany (Schuppert et al. 2021), but are not associated with measurable differences in various mental health indicators between East- and West-Germany (Liebig et al. 2020).
4.2.4 Corona Perception
Consistent with our expectations, we found that the perceived level of personal threat posed by the corona-pandemic was significantly positively associated with UBI acceptance. This association is likely due to the feared economic hardship caused by the pandemic and the resulting need for economic security (Busemeyer, Rinscheid, and Schupp 2023). However, we only found a relatively small effect size. This may be due to the time of the data collection when the pandemic had just started, and health concerns were dominating over long-term financial consequences. Thus, fear of economic hardship may not have dominated yet, thereby diminishing the effect. Abstracting from the COVID-19 pandemic, it seems promising to investigate the fear of economic instability caused by crises (e.g., through climate, financial, technological disruptions) and UBI acceptance.
4.2.5 Performance Orientation
Contrary to our hypothesis, we did not find a significant negative association between Performance orientation and UBI acceptance. This is interesting because performance orientation is often used as a prominent example in the public discourse: People with low performance orientation may cease to exert themselves, while people with high performance orientation may feel their efforts to be devalued by the introduction of a UBI. Our findings suggest that it is much more complex than that. Either performance orientation does indeed not play a major role in explaining UBI acceptance or, and this is more likely, the construct needs more differentiation, and the use of a single-item measure was not sufficient in this case. Using a scale to cover the well-established differentiation between success-oriented and failure-avoiding individuals within the group of performance-oriented people might produce different results (see the seminal work by Atkinson 1957, for the origins of the concept of performance orientation as well as Brunstein and Heckhausen 2018, for a more recent overview). It is plausible that success-oriented individuals may feel threatened by the idea of a UBI as it devalues their efforts (in line with our hypothesis on performance orientation). Failure-avoiding individuals, on the other hand, may support the idea of a UBI as this provides them with economic security, and thus, reduces the risk of failing.
4.3 Limitations and Implications
Our research is intended to provide insights into and guidance about socio-demographic as well as psychological variables relevant for UBI acceptance and thus lay a foundation for future research on this topic. First of all, our research intends to draw attention to the fact that there is an individual dimension to the UBI debate that needs to be considered. This dimension is unrepresented in existing UBI research and a psychological perspective is lacking. However, the consideration of psychological variables, both, at criterion and predictor level, is imminent when investigating individual characteristics associated with UBI support.
Second, we investigated a set of psychological and socio-demographic predictor variables. Of course, this set of variables is not exhaustive, particularly because the theory-based variable selection was limited to the variables available in the multi-topic survey that our data was based on. The amount of variance explained by these variables was moderate at best. Thus, there must be other variables, particularly other psychological variables, that might be relevant and should be investigated in future research. We made a conscious decision to include variables from different disciplines to examine their relevance in explaining UBI acceptance not only in isolation but also in relative comparison and would recommend this approach for future research. Besides predictor level, the amount of variance explained might be also partly due to the potentially constrained reliability and validity of the one-item outcome variable. There are no established UBI acceptance measures to date, so we developed a single-item measure for this purpose. As a UBI is still hypothetical, the development of such a measure necessarily depends on assumptions about the definition of a UBI and its design. Of course, these assumptions and the resulting measure may influence participants’ UBI acceptance and corresponding results must always be evaluated in light of the underlying UBI definition. In fact, research suggests that (U)BI support is fragile and highly dependent on the underlying basic income model (e.g., Busemeyer, Rinscheid, and Schupp 2023; Chrisp, Pulkka, and García 2020; Laenen, Van Hootegem, and Rossetti 2023). Thus, for future research examining individual characteristics associated with UBI acceptance, it may be interesting to investigate predictors of acceptance for different (U)BI models (see, for example, Chrisp, Pulkka, and García 2020, who examined socio-demographic predictors of support for different basic income models in the United Kingdom and Finland or Laenen, Van Hootegem, and Rossetti 2023, who examined support for a broad range of different basic income models in Belgium). Although there are some studies that have done this, to our knowledge this has not yet been done for Germany, and the predictors examined in the existing studies are again limited to socio-demographic predictors.
Third, we followed a “screening-approach” to identify variables that could possibly be relevant for UBI acceptance. For this, we had to use economic feasible measures, i.e., single item measures. Fortunately, the controversy on the use of single item measures, which has been around for decades, is easing, so that the use of single item measures can be considered an established procedure in psychology by now (see, e.g., Fisher, Matthews, and Gibbons 2016, or Allen, Iliescu, and Greiff 2022; Matthews, Pineault, and Hong 2022, for very recent perspectives on the topic). Thalmayer, Saucier, and Eigenhuis (2011) and Ziegler, Kemper, and Kruyen (2014) furthermore show that the criterion validity is not affected by the use of shortened scales. Regarding construct validity, the coverage of single item measures is of course smaller than it is when using scales. Nevertheless, in line with the literature, we are confident that single items can cover the core aspect of a construct and are therefore sufficient measures. Of course, in the context of further research, a reasonable next step is the investigation of a little number of constructs that have been identified as relevant (by us and others) in their full complexity, including facets, via well-established scales.
Fourth, we used cross-sectional data from Germany that was collected just after the first peak of the COVID-19 pandemic. There are three limitations to that. First, it is likely that the specific time-point had an impact on our results, but it remains unclear what the exact nature of this impact was. Second, due to the cross-sectional nature of the data, we did not gain any insights about dynamics and causal explanations are not feasible. Third, we adopted a German perspective and therefore cannot provide insights on cross-country comparisons. Our research aim was to investigate UBI acceptance and relevant correlates among the German working population during the COVID-19 pandemic. However, for future research with other research foci, it may be interesting to replicate our results with post-pandemic data, conduct longitudinal studies to investigate dynamics, and add a cross-country perspective to the country-specific investigation.
Last, to better understand why people with certain characteristics agree or disagree with a UBI, and thus to corroborate the quantitative results, we also recommend the use of qualitative research methods for future research. Although some qualitative studies have been conducted to examine individual attitudes towards a UBI or towards specific features of a UBI, for example, by Herke and Vicsek (2022) for Hungary, Rossetti and colleagues (2020) for the Dutch Tilburg, or Zimmermann and colleagues (2020) for Slovenia and Germany, to our knowledge there are no qualitative approaches focusing on individual characteristics associated with UBI acceptance. However, this qualitative research is central to bridge the gap between the scientific groundwork done in studies like ours and potential practical implications of the resulting research findings. As a UBI has not been implemented in Germany, decision makers would have to specify design principles to develop a concrete policy. For this, knowledge of socio-demographic and psychological variables corresponding with UBI acceptance can be useful when combined with the understanding of why people with certain characteristics oppose or favor a UBI. For instance, if there is evidence that UBI acceptance tends to be lower in older age groups, and the reasons behind this are assessed in further research, this knowledge can be used to specifically address the concerns of older age groups when designing and communicating a UBI.
4.4 Conclusion
Even though the UBI gained popularity in times of the COVID-19 pandemic, its relevance goes far beyond that. Technological unemployment calls for alternative welfare systems that provide people with social safety in times of economic insecurity. The UBI can be one important instrument to address this. However, there is a broader need for psychological research on UBI that complements the social and economic viewpoints often focused on in current debates. The insights about variables relevant for UBI acceptance and a stronger psychological focus, thus, constitute a first critical step on a long-term research agenda.
References
Acemoglu, D., and P. Restrepo. 2018. “Artificial Intelligence, Automation, and Work” [Working Paper 24196]. National Bureau of Economic Research. Cambridge, Massachusetts. http://www.nber.org/papers/w24196.10.3386/w24196Search in Google Scholar
Adriaans, J., S. Liebig, and J. Schupp. 2019. “Zustimmung für bedingungsloses Grundeinkommen eher bei jungen, bei besser gebildeten Menschen sowie in unteren Einkommensschichten [Higher Universal Basic Income approval among people of younger age, well-educated people and low-income groups].” DIW Wochenbericht 86 (15): 263–70. https://doi.org/10.18723/DIW_WB:2019-15-1.Search in Google Scholar
Allen, M. S., D. Iliescu, and S. Greiff. 2022. “Single Item Measures in Psychological Science: A Call to Action [Editorial].” European Journal of Psychological Assessment 38 (1): 1–5. https://doi.org/10.1027/1015-5759/a000699.Search in Google Scholar
Arntz, M., T. Gregory, and U. Zierahn. 2017. “Revisiting the Risk of Automation.” Economics Letters 159: 157–60. https://doi.org/10.1016/j.econlet.2017.07.001.Search in Google Scholar
Atkinson, J. W. 1957. “Motivational Determinants of Risk-Taking Behavior.” Psychological Review 64 (6, Pt. 1): 359–72. https://doi.org/10.1037/h0043445.Search in Google Scholar
Autor, D. H. 2015. “Why Are There Still So Many Jobs? The History and Future of Workplace Automation.” Journal of Economic Perspectives 29 (3): 3–30. https://doi.org/10.1257/jep.29.3.3.Search in Google Scholar
Bhalla, D. 2020. “Relative Importance (Weight) Analysis with SPSS” Listen Data. https://www.listendata.com/2015/05/relative-importance-weight-analysis.html.Search in Google Scholar
Braunheim, L., D. Otten, C. Kasinger, E. Brähler, and M. E. Beutel. 2022. “Individual and Work-Related Predictors of Exhaustion in East and West Germany.” International Journal of Environmental Research and Public Health 19 (18): 11533. https://doi.org/10.3390/ijerph191811533.Search in Google Scholar
Brunstein, J. C., and H. Heckhausen. 2018. “Achievement Motivation.” In Motivation and Action, edited by J. Heckhausen, and H. Heckhausen, 221–304. Cham: Springer.10.1007/978-3-319-65094-4_6Search in Google Scholar
Brynjolfsson, E., and A. McAfee. 2014. The Second Machine Age: Work, Progress, and Prosperity in a Time of Brilliant Technologies. New York: WW Norton & Company.Search in Google Scholar
Busemeyer, M. R., A. Rinscheid, and J. Schupp. 2023. “Hohe Zustimmung zu bedingungslosem Grundeinkommen – vor allem bei den möglichen Profiteur*innen [High approval of Universal Basic Income – especially among the possible profiteers].” DIW Wochenbericht 90 (21): 245–53. https://doi.org/10.18723/diw_wb:2023-21-1.Search in Google Scholar
Busemeyer, M. R., and A. H. Sahm. 2022. “Social Investment, Redistribution or Basic Income? Exploring the Association between Automation Risk and Welfare State Attitudes in Europe.” Journal of Social Policy 51 (4): 751–70. https://doi.org/10.1017/S0047279421000519.Search in Google Scholar
Cabrales, A., P. Hernández, and A. Sánchez. 2020. “Robots, Labor Markets, and Universal Basic Income.” Humanities and Social Sciences Communications 7 (185). https://doi.org/10.1057/s41599-020-00676-8.Search in Google Scholar
Carriero, A., T. E. Clark, M. G. Marcellino, and E. Mertens. 2021. Measuring Uncertainty and its Effects in the COVID-19 Era [CEPR Discussion Paper No. DP15965]. SSRN. https://ssrn.com/abstract=3816850.10.2139/ssrn.3717973Search in Google Scholar
Chen, G., R. E. Ployhart, H. C. Thomas, N. Anderson, and P. D. Bliese. 2011. “The Power of Momentum: A New Model of Dynamic Relationships between Job Satisfaction Change and Turnover Intentions.” Academy of Management Journal 54 (1): 159–81. https://doi.org/10.5465/amj.2011.59215089.Search in Google Scholar
Choi, G. 2021. “Basic Human Values and Attitudes Towards a Universal Basic Income in Europe.” Basic Income Studies 16 (2): 101–23. https://doi.org/10.1515/bis-2021-0010.Search in Google Scholar
Chrisp, J., V.-V. Pulkka, and L. R. García. 2020. “Snowballing or Wilting? What Affects Public Support for Varying Models of Basic Income?” Journal of International and Comparative Social Policy 36 (3): 223–36. https://doi.org/10.1017/ics.2020.28.Search in Google Scholar
Čikeš, V., H. Maškarin Ribarić, and K. Črnjar. 2018. “The Determinants and Outcomes of Absence Behavior: A Systematic Literature Review.” Social Sciences 7 (8): 120. https://doi.org/10.3390/socsci7080120.Search in Google Scholar
Decker, O., and E. Brähler, eds. 2020. Autoritäre Dynamiken: Alte Ressentiments – Neue Radikalität. Leipziger Autoritarismus Studie 2020 [Authoritarian dynamics: Old resentments – new radicalism. Leipzig authoritarianism study 2020]. Gießen: Psychosozial-Verlag.10.30820/9783837977714Search in Google Scholar
Denuit, F. 2018. Fighting Poverty in the European Union: An Assessment of the Prospects for a European Universal Basic Income (EUBI) [Doctoral Dissertation, University of Warwick]. http://wrap.warwick.ac.uk/134559/1/WRAP_Theses_Denuit_2018.pdf.Search in Google Scholar
Dermont, C., and D. Weisstanner. 2020. “Automation and the Future of the Welfare State: Basic Income as a Response to Technological Change?” Political Research Exchange 2 (1): 1757387. https://doi.org/10.1080/2474736X.2020.1757387.Search in Google Scholar
Diewald, M., H. Solga, and A. Goedicke. 1999. Back to Labor Markets: The Transformation of the East German Employment System after 1989 [Working Report No. 3/1999]. Berlin: Max Planck Institut für Bildungsforschung. https://pure.mpg.de/rest/items/item_3072570/component/file_3378629/content.Search in Google Scholar
Enders, C. K., and D. L. Bandalos. 2001. “The Relative Performance of Full Information Maximum Likelihood Estimation for Missing Data in Structural Equation Models.” Structural Equation Modeling 8 (3): 430–57. https://doi.org/10.1207/S15328007SEM0803_5.Search in Google Scholar
Faul, F., E. Erdfelder, A. Buchner, and A.-G. Lang. 2009. “Statistical Power Analyses Using G*Power 3.1: Tests for Correlation and Regression Analyses.” Behavior Research Methods 41 (4): 1149–60. https://doi.org/10.3758/BRM.41.4.1149.Search in Google Scholar
Fisher, G. G., R. A. Matthews, and A. M. Gibbons. 2016. “Developing and Investigating the Use of Single-Item Measures in Organizational Research.” Journal of Occupational Health Pychology 21 (1): 3–23. https://doi.org/10.1037/a0039139.Search in Google Scholar
Frey, C. B., and M. A. Osborne. 2017. “The Future of Employment: How Susceptible Are Jobs to Computerisation?” Technological Forecasting and Social Change 114: 254–80. https://doi.org/10.1016/j.techfore.2016.08.019.Search in Google Scholar
Ghatak, M., and X. Jaravel. 2020. “Is Funding a Large Universal Basic Income Feasible? A Quantitative Analysis of UBI with Endogenous Labour Supply.” LSE Public Policy Review 1 (2): 1–11. https://doi.org/10.31389/lseppr.9.Search in Google Scholar
Gignac, G. E., and E. T. Szodorai. 2016. “Effect Size Guidelines for Individual Differences Researchers.” Personality and Individual Differences 102: 74–8. https://doi.org/10.1016/j.paid.2016.06.069.Search in Google Scholar
Grabka, M. M. 2014. “Private Vermögen in Ost-Und Westdeutschland Gleichen Sich Nur Langsam an [Private Wealth in East and West Germany Only Slowly Converging].” DIW Wochenbericht 81 (40): 959–66.Search in Google Scholar
Granato, N. 2011. “Verdrängungsprozesse Oder Strukturelle Faktoren? Ursachen Geringerer Arbeitsmarkterträge in Ostdeutschland [Crowding Out or Structural Factors: Why Occupational Achievement Is Lower in East germany].” Zeitschrift für Soziologie 40 (2): 112–31. https://doi.org/10.1515/zfsoz-2011-0202.Search in Google Scholar
Hampel, L. 2020, 7 May. Corona: Aktivisten Fordern Krisen-Grundeinkommen [Corona: Activists Demand Crisis-Universal Income]. Süddeutsche Zeitung. https://www.sueddeutsche.de/wirtschaft/corona-grundeinkommen-1.4900168.Search in Google Scholar
Henrich, G., and P. Herschbach. 2000. “Questions on Life Satisfaction (FLZM): A Short Questionnaire for Assessing Subjective Quality of Life.” European Journal of Psychological Assessment 16 (3): 150–9. https://doi.org/10.1027/1015-5759.16.3.150.Search in Google Scholar
Hensher, M. 2020. “Covid-19, Unemployment, and Health: Time for Deeper Solutions?” BMJ 371: m3687. https://doi.org/10.1136/bmj.m3687.Search in Google Scholar
Herke, B., and L. Vicsek. 2022. “The Attitudes of Young Citizens in Higher Education Towards Universal Basic Income in the Context of Automation – A Qualitative Study.” International Journal of Social Welfare 31 (3): 310–22. https://doi.org/10.1111/ijsw.12533.Search in Google Scholar
Herzberg, F., B. Mausner, and B. B. Snyderman, eds. 1993. The Motivation to Work. New Brunswick, NJ: Transaction Publishers.Search in Google Scholar
Hodder, A. 2020. “New Technology, Work and Employment in the Era of COVID-19: Reflecting on Legacies of Research.” New Technology, Work and Employment 35 (3): 262–75. https://doi.org/10.1111/ntwe.12173.Search in Google Scholar
Hom, P. W., T. W. Lee, J. D. Shaw, and J. P. Hausknecht. 2017. “One Hundred Years of Employee Turnover Theory and Research.” Journal of Applied Psychology 102 (3): 530–45. https://doi.org/10.1037/apl0000103.Search in Google Scholar
Hüffmeier, J., and H. Zacher. 2021. “The Basic Income: Initiating the Needed Discussion in Industrial, Work, and Organizational Psychology.” Industrial and Organizational Psychology 14 (4): 531–62. https://doi.org/10.1017/iop.2021.91.Search in Google Scholar
IBM. 2020. IBM SPSS Statistics for Macintosh (Version 27.0.1.0) [Computer Software]. https://www.ibm.com/support/pages/downloading-ibm-spss-statistics-27010.Search in Google Scholar
Informationsdienst des Instituts der deutschen Wirtschaft. 2019. Die Nachteile des bedingungslosen Grundeinkommens [The disadvantages of the Universal Basic Income]. Institut der deutschen Wirtschaft. https://www.iwd.de/artikel/grundeinkommen-geschenkt-ist-viel-zu-teuer-418078/.Search in Google Scholar
International Labour Organization. 2021. ILO Monitor: COVID-19 and the World of Work. 7th Edition: Updated Estimates and Analysis [Briefing note]. https://www.ilo.org/global/topics/coronavirus/impacts-and-responses/WCMS_767028/lang--en/index.htm.Search in Google Scholar
Johnson, J. W. 2000. “A Heuristic Method for Estimating the Relative Weight of Predictor Variables in Multiple Regression.” Multivariate Behavioral Research 35 (1): 1–19. https://doi.org/10.1207/S15327906MBR3501_1.Search in Google Scholar
Kasinger, C., L. Braunheim, M. Beutel, and E. Brähler. 2022. “Closing the “Happiness Gap” by Closing the Wealth Gap: The Role of Wealth on Life Satisfaction between East and West-Germans.” Journal of Public Health 31: 1433–42. https://doi.org/10.1007/s10389-022-01716-0.Search in Google Scholar
Ketzmerick, T. 2016. “The Transformation of the East German Labour Market: From Short-Term Responses to Long-Term Consequences.” Historical Social Research 41 (3): 229–55. https://doi.org/10.12759/hsr.41.2016.3.229-255.Search in Google Scholar
Klug, K., E. Selenko, and J.-Y. Gerlitz. 2021. “Working, but Not for a Living: A Longitudinal Study on the Psychological Consequences of Economic Vulnerability Among German Employees.” European Journal of Work and Organizational Psychology 30 (6): 790–807. https://doi.org/10.1080/1359432X.2020.1843533.Search in Google Scholar
Kozák, M. 2021. “Cultural Productivism and Public Support for the Universal Basic Income from a Cross-National Perspective.” European Societies 23 (1): 23–45. https://doi.org/10.1080/14616696.2020.1758741.Search in Google Scholar
Laenen, T., A. Van Hootegem, and F. Rossetti. 2023. “The Multidimensionality of Public Support for Basic Income: A Vignette Experiment in Belgium.” Journal of European Public Policy 30 (5): 849–72. https://doi.org/10.1080/13501763.2022.2055112.Search in Google Scholar
Liebig, S., L. Buchinger, T. M. Entringer, and S. Kühne. 2020. “Ost-und Westdeutschland in der Corona-Krise: Nachwendegeneration im Osten erweist sich als resilient [East and West Germany in the corona crisis: Post-transition generation in the east proves resilient].” DIW Wochenbericht 87 (38): 721–9. https://doi.org/10.18723/diw_wb:2020-38-5.Search in Google Scholar
Lu, Q., X. Huang, M. H. Bond, and E. H. Xu. 2019. “Committing to Work at the Expense of Other Life Pursuits: The Consequence of Individuals’ Relative Centrality of Work Across Job Types and Nations Differing in Performance Orientation.” Journal of Cross-Cultural Psychology 50 (7): 848–69. https://doi.org/10.1177/0022022119865614.Search in Google Scholar
Matthews, R. A., L. Pineault, and Y.-H. Hong. 2022. “Normalizing the Use of Single-Item Measures: Validation of the Single-Item Compendium for Organizational Psychology.” Journal of Business and Psychology 37 (4): 639–73. https://doi.org/10.1007/s10869-022-09813-3.Search in Google Scholar
Naudé, W. 2021. “Artificial Intelligence: Neither Utopian Nor Apocalyptic Impacts Soon.” Economics of Innovation and New Technology 30 (1): 1–23. https://doi.org/10.1080/10438599.2020.1839173.Search in Google Scholar
Nettle, D., E. Johnson, M. Johnson, and R. Saxe. 2021. “Why Has the COVID-19 Pandemic Increased Support for Universal Basic Income?” Humanities and Social Sciences Communications 8 (79). https://doi.org/10.1057/s41599-021-00760-7.Search in Google Scholar
Parolin, Z., and L. Siöland. 2020. “Support for a Universal Basic Income: A Demand–Capacity Paradox?” Journal of European Social Policy 30 (1): 5–19. https://doi.org/10.1177/0958928719886525.Search in Google Scholar
Perkins, G., S. Gilmore, D. S. A. Guttormsen, and S. Taylor. 2022. “Analysing the Impacts of Universal Basic Income in the Changing World of Work: Challenges to the Psychological Contract and a Future Research Agenda.” Human Resource Management Journal 32 (1): 1–18. https://doi.org/10.1111/1748-8583.12348.Search in Google Scholar
Peters, M. A. 2017. “Technological Unemployment: Educating for the Fourth Industrial Revolution.” Educational Philosophy and Theory 49 (1): 1–6. https://doi.org/10.1080/00131857.2016.1177412.Search in Google Scholar
Petrunyk, I., and C. Pfeifer. 2016. “Life Satisfaction in Germany after Reunification: Additional Insights on the Pattern of Convergence.” Jahrbücher für Nationalökonomie und Statistik 236 (2): 217–39. https://doi.org/10.1515/jbnst-2015-1010.Search in Google Scholar
Preacher, K. J., P. J. Curran, and D. J. Bauer. 2006. “Computational Tools for Probing Interactions in Multiple Linear Regression, Multilevel Modeling, and Latent Curve Analysis.” Journal of Educational and Behavioral Statistics 31 (4): 437–48. https://doi.org/10.3102/10769986031004437.Search in Google Scholar
Richter, D., and M. Weinhardt. 2013. “LS-S: Loneliness Scale-SOEP.” In Psychologische und sozialwissenschaftliche Kurzskalen: Standardisierte Erhebungsinstrumente für Wissenschaft und Praxis, edited by C. J. Kemper, M. Zenger, and E. Brähler. Berlin: MMV Medizinisch Wissenschaftliche Verlagsgesellschaft.Search in Google Scholar
Rincon, L. 2023. “A Robin Hood for All: A Conjoint Experiment on Support for Basic Income.” Journal of European Public Policy 30 (2): 375–99. https://doi.org/10.1080/13501763.2021.2007983.Search in Google Scholar
Rincon, L., T. Vlandas, and H. Hiilamo. 2022. “What’s Not to like? Benefit Design, Funding Structure and Support for Universal Basic Income.” Journal of European Social Policy 32 (4): 467–83. https://doi.org/10.1177/09589287211072638.Search in Google Scholar
Roosma, F., and W. van Oorschot. 2020. “Public Opinion on Basic Income: Mapping European Support for a Radical Alternative for Welfare Provision.” Journal of European Social Policy 30 (2): 190–205. https://doi.org/10.1177/0958928719882827.Search in Google Scholar
Rossetti, F., F. Roosma, T. Laenen, and K. Abts. 2020. “An Unconditional Basic Income? How Dutch Citizens Justify Their Opinions about a Basic Income and Work Conditionality.” Journal of International and Comparative Social Policy 36 (3): 284–300. https://doi.org/10.1017/ics.2020.15.Search in Google Scholar
Schließler, C., N. Hellweg, and O. Decker. 2020. “Aberglaube, Esoterik und Verschwörungsmentalität in Zeiten der Pandemie [Superstition, esotericism, and conspiracy mentality in times of the pandemic].” In Autoritäre Dynamiken: Alte Ressentiments – Neue Radikalität. Leipziger Autoritarismus Studie 2020, edited by O. Decker, and E. Brähler, 283–308. Gießen: Psychosozial-Verlag.10.30820/9783837977714-283Search in Google Scholar
Schlogl, L., E. Weiss, and B. Prainsack. 2021. “Constructing the ‘Future of Work’: An Analysis of the Policy Discourse.” New Technology, Work and Employment 36 (3): 307–26. https://doi.org/10.1111/ntwe.12202.Search in Google Scholar
Schröder, M. 2020. Wann sind wir wirklich zufrieden? Überraschende Erkenntnisse zu Arbeit, Liebe, Kindern, Geld. Auf Basis der größten Langzeitstudie mit über 600.000 Befragungen [When are we really satisfied? Surprising insights into work, love, children, money. Based on the largest long-term study with over 600,000 surveys]. München: C. Bertelsmann Verlag.Search in Google Scholar
Schulz, P. 2017. “Universal Basic Income in a Feminist Perspective and Gender Analysis.” Global Social Policy 17 (1): 89–92. https://doi.org/10.1177/1468018116686503.Search in Google Scholar
Schuppert, A., K. Polotzek, J. Schmitt, R. Busse, J. Karschau, and C. Karagiannidis. 2021. “Different Spreading Dynamics throughout Germany during the Second Wave of the COVID-19 Pandemic: A Time Series Study Based on National Surveillance Data.” The Lancet Regional Health-Europe 6: 100151. https://doi.org/10.1016/j.lanepe.2021.100151.Search in Google Scholar
Schwander, H., and T. Vlandas. 2020. “The Left and Universal Basic Income: The Role of Ideology in Individual Support.” Journal of International and Comparative Social Policy 36 (3): 237–68. https://doi.org/10.1017/ics.2020.25.Search in Google Scholar
Scott, K. D., and G. S. Taylor. 1985. “An Examination of Conflicting Findings on the Relationship between Job Satisfaction and Absenteeism: A Meta-Analysis.” Academy of Management Journal 28 (3): 599–612. https://doi.org/10.5465/256116.Search in Google Scholar
Segbers, F. 2019, May 23. Leben frei von Furcht und Not: Zur Ethik des Grundeinkommens aus theologischer Sicht [Conference session]. Berlin: Fachtag der Diakonie zum Grundeinkommen 2019. https://www.diakonie-wissen.de/documents/10179/9364092/2019_05_23+Segbers+Manuskript.pdf/0a477a3a-c3cf-426d-8151-1307ec2ac13a.Search in Google Scholar
Shin, Y. K., T. Keppnanien, and K. Kuitto. 2021. “Precarious Work, Unemployment Benefit Generosity and Universal Basic Income Preferences: A Multilevel Study on 21 European Countries.” Journal of Social Policy 50 (2): 323–45. https://doi.org/10.1017/s0047279420000185.Search in Google Scholar
Sinclair, R. R., and J. H. Cheung. 2016. “Money Matters: Recommendations for Financial Stress Research in Occupational Health Psychology.” Stress and Health 32 (3): 181–93. https://doi.org/10.1002/smi.2688.Search in Google Scholar
Spencer, D. A. 2018. “Fear and Hope in an Age of Mass Automation: Debating the Future of Work.” New Technology, Work and Employment 33 (1): 1–12. https://doi.org/10.1111/ntwe.12105.Search in Google Scholar
Stadelmann-Steffen, I., and C. Dermont. 2020. “Citizens’ Opinions about Basic Income Proposals Compared – A Conjoint Analysis of Finland and Switzerland.” Journal of Social Policy 49 (2): 383–403. https://doi.org/10.1017/S0047279419000412.Search in Google Scholar
Standing, G. 2012. “Basic Income Pilot Schemes: Seventeen Design and Evaluation Imperatives.” In Wege zum Grundeinkommen, edited by D. Jacobi, and W. Strengmann-Kuhn, 133–52. Berlin: Bildungswerk Berlin der Heinrich-Böll-Stiftung.Search in Google Scholar
Statistische Ämter des Bundes und der Länder. 2022, October 24. Mikrozensus [Mikrocensus]. https://erhebungsportal.estatistik.de/Erhebungsportal/#t1JaZlbFQq2RsbqU/unterstuetzte-statistiken/bevoelkerung-private-haushalte/private-haushalte/mikrozensus.Search in Google Scholar
Stellmacher, J., G. Sommer, and E. Brähler. 2005. “The Cognitive Representation of Human Rights: Knowledge, Importance, and Commitment.” Peace and Conflict: Journal of Peace Psychology 11 (3): 267–92. https://doi.org/10.1207/s15327949pac1103_4.Search in Google Scholar
Suadicani, P., J. P. Bonde, K. Olesen, and F. Gyntelberg. 2013. “Job Satisfaction and Intention to Quit the Job.” Occupational Medicine 63 (2): 96–102. https://doi.org/10.1093/occmed/kqs233.Search in Google Scholar
Susskind, D. 2020. A World without Work: Technology, Automation, and How We Should Respond. New York, NY: Metropolitan Books.Search in Google Scholar
Tan, J. J., M. W. Kraus, N. C. Carpenter, and N. E. Adler. 2020. “The Association between Objective and Subjective Socioeconomic Status and Subjective Well-Being: A Meta-Analytic Review.” Psychological Bulletin 146 (11): 970–1020. https://doi.org/10.1037/bul0000258.Search in Google Scholar
Thalmayer, A. G., G. Saucier, and A. Eigenhuis. 2011. “Comparative Validity of Brief to Medium-Length Big Five and Big Six Personality Questionnaires.” Psychological Assessment 23 (4): 995–1009. https://doi.org/10.1037/a0024165.Search in Google Scholar
Thum, M. 2021. “Landesweite Lockdowns, wirtschaftliche Wahrnehmung und politische Einstellungen in der Bevölkerung [Nationwide lockdowns, economic perceptions, and political attitudes among the population].” ifo Dresden berichtet 28 (2): 15–8.Search in Google Scholar
Tonidandel, S., and J. M. LeBreton. 2015. “RWA Web: A Free, Comprehensive, Web-Based, and User-Friendly Tool for Relative Weight Analyses.” Journal of Business and Psychology 30 (2): 207–16. https://doi.org/10.1007/s10869-014-9351-z.Search in Google Scholar
Upchurch, M. 2018. “Robots and AI at Work: the Prospects for Singularity.” New Technology, Work and Employment 33 (3): 205–18. https://doi.org/10.1111/ntwe.12124.Search in Google Scholar
USUMA. 2020. Feldbericht zum Projekt: Repräsentative Befragung der deutschsprachigen Wohnbevölkerung zum körperlichen und geistigen Wohlbefinden – 2020-1 [Field report on the project: Representative survey of the German-speaking resident population on physical and mental well-being – 2020-1].Search in Google Scholar
Van Hootegem, A., and T. Laenen. 2023. “A Wave of Support? A Natural Experiment on How the COVID-19 Pandemic Affected the Popularity of a Basic Income.” Acta Politica 58: 695–713. https://doi.org/10.1057/s41269-022-00260-9.Search in Google Scholar
Vlandas, T. 2021. “The Political Economy of Individual-Level Support for the Basic Income in Europe.” Journal of European Social Policy 31 (1): 62–77. https://doi.org/10.1177/0958928720923596.Search in Google Scholar
Weisstanner, D. 2022. “COVID-19 and Welfare State Support: The Case of Universal Basic Income.” Policy and Society 41 (1): 96–110. https://doi.org/10.1093/polsoc/puab015.Search in Google Scholar
WeMove Europe. 2020. Results of the YouGov Poll about UBI. https://www.wemove.eu/results-yougov-poll-about-ubi.Search in Google Scholar
Wilson, H. J., P. Daugherty, and N. Bianzino. 2017. “The Jobs that Artificial Intelligence Will Create.” MIT Sloan Management Review 58 (4): 14–6.Search in Google Scholar
Yang, J., G. Mohan, and K. Fukushi. 2020. “An Analysis of the Factors Influencing Public Attitudes toward Implementing Basic Income (BI) from an Individual Perspective: A Case Study of Hokuriku Region, Japan.” Societies 10 (3): 52. https://doi.org/10.3390/soc10030052.Search in Google Scholar
Zhang, D., S. Mishra, E. Brynjolfsson, J. Etchemendy, D. Ganguli, B. Grosz, T. Lyons, et al.. 2021. The AI Index 2021 Annual Report. Stanford, CA: AI Index Steering Committee Human-Centered AI Institute Stanford University. https://aiindex.stanford.edu/wp-content/uploads/2021/03/2021-AI-Index-Report_Master.pdf.Search in Google Scholar
Ziegler, M., C. J. Kemper, and P. Kruyen. 2014. “Short Scales – Five Misunderstandings and Ways to Overcome Them.” Journal of Individual Differences 35 (4): 185–9. https://doi.org/10.1027/1614-0001/a000148.Search in Google Scholar
Zimmermann, K., U. Boljka, T. Rakar, and M. F. Hrast. 2020. “The Social Legitimacy of the Universal Basic Income from a Social Justice Perspective: A Comparative Analysis of Germany and Slovenia.” Journal of International and Comparative Social Policy 36 (3): 301–31. https://doi.org/10.1017/ics.2020.29.Search in Google Scholar
Supplementary Material
This article contains supplementary material (https://doi.org/10.1515/bis-2023-0023).
© 2024 the author(s), published by De Gruyter, Berlin/Boston
This work is licensed under the Creative Commons Attribution 4.0 International License.
Articles in the same Issue
- Frontmatter
- Research Articles
- The Introduction of Basic Income is a Pillar of a Socio-cultural Revolution
- Functional Finance and the Sustainability of Universal Basic Income
- Monitoring Public Interest and Sentiment on Basic Income: Using Google and Twitter Data in the U.S.
- Universal Basic Income Universally Welcomed? – Relevance of Socio-Demographic and Psychological Variables for Acceptance in Germany
- Basic Income and Violence Against Women: A Review of Cash Transfer Experiments
- Are the UN Sustainable Development Goals a Valuable Platform for Advancing a Basic Income? A Critical Historical Studies Account
- Book Review
- Karl Widerquist: The Problem of Property. Taking the Freedom of Nonowners Seriously