
A Peer Like Me? Peer Effects Among International Students in Doctoral Programs
-
Pauline Khoo


Abstract
This paper investigates how peers from the same country of origin affect persistence and degree completion among international doctoral students. Using a comprehensive administrative dataset of Ph.D. students in Ohio that links individuals to their peers within institutions and programs over time, I exploit the year-to-year variation in peer composition and construct threshold-based categories for both the share and number of own-country peers. The results reveal that a higher presence of own-country peers adversely affect educational outcomes, particularly once exposure exceeds certain thresholds. This negative effect is driven by country-specific dynamics, rather than the generalized peer effects among the broader international student population. These insights suggest that greater cohort diversity in terms of country of origin may enhance international student outcomes.
1 Introduction
The proportion of international students in the United States has increased by around 890,000, or by more than 300 %, over the last four decades (National Center for Education Statistics 2022). Similarly, the number of international students awarded doctoral degrees increased by approximately 6,000, or by 47 %, in the last two decades (National Science Foundation and National Center for Science and Engineering 2024). Given their numbers, international students are a sizable portion of the stock of high-skilled labor, and they contribute significantly to innovation with a notable presence among Nobel Prize winners, successful entrepreneurs, and patent holders (Akcigit et al. 2017; Hunt and Gauthier-Loiselle 2010; Kerr and Lincoln 2010; Kerr 2013; Moser et al. 2014).
Despite these contributions, immigration, even among those who will be successful, remains contentious and presents a challenge for universities that face political and social constraints with respect to their policies toward international students (Batalova 2021; Otterman 2024; Saul). International students tend to be high-performing and often pay full price. Therefore, universities care about attracting and retaining international students. In this study, I investigate a potentially important determinant of retention and degree completion of international students. Specifically, I examine how peers, defined by immigrant status and country of origin, affect persistence and degree completion of international students in doctoral programs.
Sharing a country of origin with peers can affect persistence by directly altering academic and social networks and through an indirect institutional response. The direct effect stems from the fact that peers from the same country of origin are likely to form a social network that is based on similarities in culture and language. This network can affect persistence by altering both academic and non-academic interactions. For example, a doctoral student with many same-country peers may socialize more and study less (Andrade 2006, 2007; Mamiseishvili 2012). Alternatively, a strong network might ease the process of social and academic integration, which has been shown to correlate positively with student retention.[1] Though integration is generally beneficial, heavy reliance on same-country peers can limit broader social integration. International students who interact predominantly with same-country peers can become isolated from host-national peers and the wider academic community (Hendrickson et al. 2011; Trice 2007). If international doctoral students socialize exclusively with peers from their own country, they might miss out on academic collaboration and integration with the broader cohort, undermining academic progress (Bochner et al. 1977; Furnham and Alibhai 1985; Sam 2001).
Same-country peers may also influence performance through competitive dynamics. Competition often boosts effort and performance in educational settings – students work harder when rewards are structured as tournaments or relative ranking. In this context, the competitiveness may be even stronger as individuals tend to compare themselves to those who share similar characteristics.[2] Students may increase effort to distinguish themselves academically among peers from the same country, potentially enhancing academic performance. However, competition may be counterproductive when collaboration is important or if it discourages students if they perceive themselves to be underperforming relative to their peers (Chen and Hu 2024; Loch et al. 2000). On the institutional side, this duality also exists. A large concentration of students from one country in a program may aid collaborative learning. However, it might inadvertently reinforce insularity from the broader community if classes or group work become linguistically or culturally segmented.
Two contrasting frameworks from classroom diversity research help explain these dynamics (Hoxby and Weingarth 2005; Wennberg and Norgren 2021). Homogeneity can boost learning and interaction by enabling tailored instruction and by grouping students with similar abilities or values. In the same country-of-origin context, it is possible that instructors change their methods of teaching as the share of students from the same country becomes significant; there could be more investment from the part of the instructors to make sure that the material is understood by the majority. By contrast, heterogeneity enriches learning by exposing students to diverse perspectives, strengthening analytical skills, and fostering broader networks. When same-country peers dominate a cohort, students risk losing these cross-cultural advantages – limiting critical discussion, interdisciplinary collaboration, and exposure to new ideas. Given the conflicting forces at play, how same-country peers affect academic persistence is an interesting empirical question.
Notably, there is hardly any research on how peers affect international students’ performance. For doctoral students, peers have the potential to be particularly important because of the nature of Ph.D. programs in which cohorts of students take many courses together, study together, and socialize together. Despite this, the empirical evidence on how peer characteristics shape performance in doctoral programs, especially for international students, remains scarce.[3] Bostwick and Weinberg (2022) investigated the effect of gender composition in STEM doctoral programs and found that increasing the share of female peers improves on-time graduation rates. Other research in postgraduate education has focused on gender matching between doctoral students and their advisors. Studies have shown that female students paired with female advisors tend to achieve higher academic outcomes, including increased publication rates (Gaule and Piacentini 2018; Hilmer and Hilmer 2007; Neumark and Gardecki 1996; Pezzoni et al. 2016). However, it remains unclear how other types of peers influence doctoral students.
This study is the first to investigate the relationship between country-of-origin peer composition and persistence in and completion of doctoral programs for international students, providing novel insights into how cohort diversity affects academic outcomes. The paucity of research is partly due to a lack of data. Data is a major obstacle because most existing surveys of doctoral students are not designed to capture detailed peer characteristics or include sufficient numbers of students from the same cohort within a given program. The data I use is uniquely well suited for studying the effect of peers on doctoral students because it includes the universe of doctoral students at every Ph.D. program in the state of Ohio. Importantly, the data identify the country of origin for each student and can be used to construct measures of peer composition each year for each Ph.D. program in every university. Furthermore, this detailed, administrative data tracks international students from their first term of enrollment to their completion of doctoral degree or until they exit the program without a degree, and the data cover a 7-year period. This feature of the data facilitates studying both the short- and long-run effect of peers.
To conduct the empirical analysis, I define a cohort as all students who begin a doctoral program at a particular institution in a specific field in the same year. Because of the longitudinal nature of the data, I can compare student outcomes across cohorts within an institution and field as their peer composition changes. I find that a higher presence of own-country peers – whether measured by share or number – reduces the likelihood of students persisting into subsequent years, particularly when the exposure exceeds certain thresholds. I also find that a higher presence of own-country peers has an adverse effect on Ph.D. completion, though the statistical significance of this effect diminishes in later years, likely due to smaller sample sizes and limited power. Beyond the primary findings, the negative impact of same-country peers persists even after accounting for general spillovers from other international peers, suggesting that the effect is not driven by broader international networks. These findings suggest that university administrators may want to implement policies to foster integration. For example, universities could implement cross-cultural mentoring schemes that pair students from diverse backgrounds, orientation programs emphasizing cultural exchange, and classroom strategies designed to balance inclusivity with the benefits of cultural affinity.
This study contributes to several strands of literature. First, it adds to the limited research on how peer characteristics affect doctoral student persistence, particularly for international students, where prior studies have primarily focused on gender effects (Bostwick and Weinberg 2022; Pezzoni et al. 2016). Second, it contributes to the broader peer effects literature in education, which has documented both positive and negative effects in different contexts,[4] and extends it by complementing work on racial composition and student outcomes (e.g. Fairlie et al. 2014; Hanushek et al. 2009; Hoxby 2000; Price 2010). Third, it enriches the understanding of international student success by highlighting how country-specific cultural factors shape persistence (Hyun et al. 2007; Olivas and Li 2006). Finally, this research broadens the scope of studies on cultural match and economic outcomes to include educational settings (Edin et al. 2003; Kirabo Jackson and Schneider 2011). This aligns with a growing body of literature that examines the broader implications of cultural peer match in educational contexts, focusing on aspects such as trust, performance, and occupational choices (Canaan et al. 2022; Pregaldini et al. 2022).
2 Data
My primary data are administrative data made available to researchers by the Ohio Education Research Center (OERC). The data include term-level information on admission, enrollment, demographics and fields of study, and the data includes all students, including international students enrolled in public tertiary education in the state of Ohio. Since information on the country of origin of international students are only available from 2009 onwards, I restricted my analysis to students enrolled in institutions from 2009 to 2015, which is the last year of the Data Use Agreement governing this research.
Using administrative data has several advantages. The data provide a relatively large sample size that is necessary given my focus on peers within an institution and field. Because of the information on enrollment and completion, I can track international students once they enroll in a program and know if they drop out, complete, or if they switch to other universities in Ohio. One limitation of the data is the absence of background information on the students, for example, entrance exam scores, and any records of students prior to attending their respective Ohio institutions.
I focus on international students enrolled in doctoral programs. There are 11 institutions that offer doctoral programs in Ohio, but I use data from only 8 because three institutions (Bowling Green State University, Miami University and Youngstown State University) have very few Ph.D. programs and/or international students. I define a cohort to be those entering a doctoral program (e.g. economics) in a specific institution in the same year.[5],[6] I also restrict the analysis to programs within institutions that have more than 5 students enrolled. The advantage of focusing on doctoral programs is twofold. First, peers in doctoral programs are more distinct and more easily identified than in other degree programs. Doctoral students are more likely to attend classes or progress in the program with peers who enter at the same time as them.[7] Cohorts of doctoral programs are much smaller than undergraduate cohorts, and network ties are typically more intensive among doctoral students.
I further limit the sample to international students from China, Taiwan, India, Iran, South Korea and Saudi Arabia. These groups were chosen because they are the countries with non-trivial numbers of students. However, I include all students, domestic and international, when constructing measures of own-country share of peers. For example, while I do not include Ph.D. students from Ireland in my analysis, such students of which there is hardly any, are considered part of the cohort and are used to calculate own-country share of peers. Such students are also used to calculate the share of peers that are international, which I use in some analyses to assess whether performance is affected by the presence of foreign peers in general and not own-country peers in particular. The peer composition is also calculated based on their initial cohort composition, which is in the year of their enrollment.
Table 1 shows the summary statistics for international students in doctoral programs. The sample consists of cohorts that enroll in 2009 through 2014, making up 1706 observations. Female students represent 43 % of the sample, and the average age of enrollment is approximately 28 years. The average cohort size for each department is around 12 students, with international students forming the majority, averaging around 7 students or 60 % of the cohort, compared to domestic students, who average around 5 students (40 % of the cohort size).
Summary statistics.
| Observation | Mean | Std. Dev. | |
|---|---|---|---|
| Female | 1,706 | 0.43 | (0.49) |
| Age of Enrollment | 1,706 | 28.71 | (3.93) |
| Size of Cohort | 1,706 | 12.73 | (12.1) |
| International students from China | 1,706 | 0.42 | (0.49) |
| International students from India | 1,706 | 0.24 | (0.43) |
| International students from South Korea | 1,706 | 0.14 | (0.35) |
| International students from Iran | 1,706 | 0.09 | (0.29) |
| International students from Taiwan | 1,706 | 0.07 | (0.25) |
| International students from Saudi Arabia | 1,706 | 0.04 | (0.20) |
| Total international students in cohort | 1,706 | 7.86 | (6.42) |
| Total domestic students in cohort | 1,706 | 4.69 | (8.72) |
| Share of peers from same country of origin | 1,706 | 0.21 | (0.23) |
| Any peer from same country of origin | 1,706 | 0.65 | (0.48) |
| Number of peers from same country of origin | 1,706 | 2.17 | (2.64) |
| Other international share | 1,706 | 0.29 | (0.26) |
| Persistence into year 2 | 1,706 | 0.91 | (0.29) |
| Persistence into year 3 | 1,364 | 0.79 | (0.41) |
| Persistence into year 4 | 1,031 | 0.68 | (0.47) |
| Complete MA degree within 2 years | 1,706 | 0.06 | (0.24) |
| Complete MA degree within 3 years | 1,364 | 0.11 | (0.32) |
| Complete Ph.D. degree within 4 years | 1,031 | 0.05 | (0.22) |
| Complete Ph.D. degree within 5 years | 720 | 0.14 | (0.35) |
I examine three outcomes: persistence into a specific year, whether a person obtained an MA degree within two or three years, and whether a person obtained a Ph.D. within four or five years. Persistence is an indicator that the student continued in the program, for example, in year two, three or four. Persistence is a conditional indicator; I examine persistence into the third year, only for those who persisted through the first two years. Completion of an MA or Ph.D. is defined as it sounds and is an indicator that the person obtained an MA within two or three years and a Ph.D. within four or five years. I cannot examine a six-year window for Ph.D. because I have too few cohorts that I observe for six years.
Note that the number of observations varies across the dependent variables. For persistence into the second year, I observe all cohorts enrolling between 2009 and 2014, with 91 % of the international students persisting into their second year. For persistence into the third year, the sample size decreases to 1,364 observations, corresponding to cohorts enrolling from 2009 to 2013. This trend of decreasing sample sizes continues for subsequent years, with 68 % of students persisting into their fourth year.[8] In this sample, around 5 % of the students have graduated with a Ph.D degree from their respective program by the fourth year, and 14 % by the fifth year.9 While Master’s degree completion is not the focus of this paper, I also observe that 6 % of students complete their MA within two years, and this figure increases to 11 % within three years. These completion patterns provide additional context for understanding academic outcomes among doctoral students.
I use two different measures of peers: percentage of own-country peers in the cohort and the number of own-country peers in the cohort. For all measures, person i is excluded from the calculation. For example, the country of origin share is defined as
The “number of students from the same country of origin – 1” would be the total number of students from the same country of origin as individual i excluding the individual i themselves in their cohort. The denominator for the proportion is the total number of students – both international and domestic students – in the cohort excluding individual i. The share is constructed for every cohort in each department. For each of the two measures of own-country peers, I construct a set of dummy variables. For the percent of own-country peers, the categories are: 0, >0 and ≤0.15, >0.15 and ≤0.3, and >0.3. For the number of peers, the categories are: 0, 1, 2, and 3 or more.[10]
On average, approximately 20 % of the cohort in an institution-field is from the same country of origin. Additionally, 65 % of students have at least one peer from their country of origin, with approximately 2 peers in the same cohort. The “other international share,” representing students from countries other than the student’s own country, is 29 % on average. Among international students in this sample, 42 % are from China, making up the largest group, followed by 24 % from India, 14 % from South Korea, 9 % from Iran, 7 % from Taiwan, and 4 % from Saudi Arabia.
3 Empirical Approach
The challenge in establishing the causal effects of peers has been thoroughly analyzed. In his seminal work, Manski (1993) provides a framework for empirical analysis of peer effects and, more importantly, the empirical difficulties associated with estimating such effects. First there is the reflection problem – the difficulty of disentangling the effect that the peer group has on an individual when the individual is also affecting the group simultaneously. The second empirical difficulty is the correlated effects problem (sometimes referred to as common shocks) where individuals in the whole group face similar institutional environments. The third issue is the tendency of individuals to self-select into networks that they share similarities with. The phenomenon – referred to as homophily – is a classic selection issue when it comes to establishing any type of causality.[11]
Sacerdote (2011) reviewed the literature and strategies that social scientists have used to overcome the endogeneity and selection problems. Two types of strategies have been used to address these problems. The first strategy is to exploit contexts where individuals are randomly assigned to their peer groups. A group of studies has used the random assignment of roommates, dormmates, squadron members, or course-section mates in establishing peer effects in higher education (Carrell et al. 2009; Foster 2006; Griffith and Rask 2014; Kremer and Levy 2008; Sacerdote 2001; Shue 2013; Stinebrickner and Stinebrickner 2006; Zimmerman 2003). Another strategy is to rely on the variation across classrooms or cohorts within an institution that is plausibly random, conditional on other covariates and fixed effects (e.g. Betts and Zau 2004; Bifulco et al. 2011; Burke and Sass 2013; Hanushek et al. 2003; Hoxby 2000; Vigdor and Nechyba 2007).
My empirical approach is closely related to the second strategy. I examine how peers from the same country of origin affect student (i) performance in doctoral programs controlling for various fixed effects indicating institution (j), field (d), country (c) and entry-cohort (t). The primary model is specified as:
In Equation (2), Y
ijdct
denotes the probability that student i from country c and entry-cohort t will persist in the Ph.D. field d at a specific institution j. I include individual-level controls such as gender and age at enrollment,
A naïve model that just includes share of own-country peers and institution-by-field, country and cohort fixed effects (without the three-way interaction of institution-by-field-by-country fixed effects) would be measuring the difference in Y for students exposed to a higher share of peers from their country of origin versus students exposed to a lower share of peers from their country of origin. An example of this variation would be comparing the relative outcomes for students from China in the department of Engineering (high share) to the relative outcomes for students from China in the department of Philosophy (low share). The model accounts for the possibility that Engineering may generally have lower persistence than Philosophy, but it does not account for the possibility that Chinese students in Engineering may have relatively better persistence than Chinese students in Philosophy. These institution-by-field-by-country differences have the potential to bias estimates.
To address this concern, the main model includes the three-way interaction of institution-by-field-by-country, as this is the building block for the construction of the share of own-country peers, which varies by institution-by-field-by-country-by-cohort. Here, the comparison groups will be cohorts with own-country peers from the same country of origin to other cohorts with no own-country peers within the same institution-field. I also include fixed effects for country-by-cohort (φ ct ), institution-by-cohort (δ jt ), and field-by-cohort (λ dt ). The coefficients (β p ) on the dummy variables that indicate the share of own-country peers measure the difference in outcome Y for students exposed to a higher share of peers from their country of origin versus students with no own-country peers, accounting for country-specific trends at the cohort level, institutional changes over time, and field-specific cohort-level differences.
Equation (2) is the primary model of the analysis but given that the key independent variable of own-country share of peers varies at the institution-field-country-year level, there are additional three-way fixed effects that could be included to control for confounding. Ideally, I would include all four possible three-way fixed effects in the model. However, this is not possible given the data. There is insufficient variation in the own-country share of peers to include all the three-way fixed effects to obtain reasonably precise standard errors. For example, there are non-trivial number of cases in which institution-by-field-by-country-by-year is identical to institution-by-country-by-year because, in some years, an institution may have only one field with any international students from a given country.
To address this issue, and to show how estimates vary with different combinations of fixed effects, I re-estimated equation (2) including various combinations of three-way fixed effects. These are reported in Appendix Table 3 and 4. I report these results in more detail below, but here I note that estimates are relatively stable across specifications and results are qualitatively similar to those obtained from the main model (equation (2)). The lack of substantial sensitivity of estimates to inclusion of various fixed effects supports the reasonableness of the research design and bolsters the case for interpreting estimates as causal.
4 Further Assessment of the Validity of Research Design
Before describing an additional analysis (to inclusion of various fixed effects) that I conducted to provide evidence of my research design, it is useful to consider the underlying source of the variation in peer groups. Assume that characteristics of a cohort are determined jointly by the choices of departmental admission committees and individual students. The most straightforward objective of admission committees is to maximize the expected quality of students who will ultimately enroll in their program. If departments follow this approach, variation in country composition will come from variation in how applicants from different countries compare to one another each year. For instance, when the applicants from China are relatively weak, the department admits fewer Chinese students. This is exactly the type of variation that is useful (plausibly exogenous). While the number of Chinese students will be smaller when the applicant pool from China is weaker, the quality of Chinese students accepted into the department will not change. So, there will not be a correlation between the share of peers from the same country and unmeasured quality.[12]
Admissions decisions may be problematic in terms of the validity of the research design if departments make admissions decisions based on the outcomes of recently enrolled students. For example, admissions committees may decide to raise entry requirements and admit fewer students from a particular country if current students from that country have been performing poorly. If so, then the unmeasured quality of peers will be related to the share of own-country peers.
The share of peers from any specific country may also reflect students’ choices of whether to accept the admission offers. Students accept an admission offer if it dominates all other offers and their non-graduate institution options. There are many factors that would lead to differences across countries in the probability of accepting a given offer. For instance, countries like China have seen an increase in students going abroad to further their studies in the recent decade relative to other countries. Another example is the differential returns to obtaining a degree in certain fields and institutions for different countries. Such time invariant factors – differences in country-specific application patterns, differences in program quality, and field-specific sorting of students within institutions – can influence both cohort composition and student outcomes, thereby biasing estimates.[13] However, most of these factors entering the students’ decisions would be captured by institution-by-field-by-country fixed effects or by institution-by-country-by-year fixed effects. The types of processes related to students’ considerations that would be problematic for the research design are if applicants decide to apply for or accept an admission offer based on the performance of the current students.
Though it is not possible to directly test for admissions committees’ or students’ behavior that is problematic for the research design, in both cases, the problem boils down to there being a correlation between past performance of own-country peers and current share of own-country peers. To assess if this correlation is present, I empirically assess whether past performance of students from a particular country predicts the share of students from that country in future cohorts. I test whether the persistence into the second year for the t – 1 cohort predicts the share of students enrolled from that country in year t. This also serves as a falsification test to validate my causal interpretation of the estimates. If significant effects were observed, it would suggest that the main results might capture unobserved, institution-field level factors, rather than peer effects. To focus on the same source of identifying variation as in my main analysis, this test is also conditional on the same fixed effects as shown in equation (2).
In Figure 1, I provide visual evidence that, conditional on the fixed effects, there is no correlation between persistence into the second year for the previous cohort and the share of country-of-origin in the current cohort. The lack of correlation between persistence of the t – 1 cohort and the share from that country in year t is important evidence against various forms of potential bias, but it does not rule out all potential sources of bias.[14] Though it is not possible to rule out every potential source of bias, it is important to highlight that there are many sources of random variation in my context. Admission committees must admit a small percentage of hundreds of applicants, and there is likely to be some randomness in the exact set of admitted students. Similarly, attendance is a complicated function of admission decisions at other universities, and these are also subject to a degree of randomness. As such, there are many reasons why the proportion of peers from the same country would vary across cohorts within a department that would not be correlated with potential outcomes of the enrolled students. My empirical assessments of including various combinations of fixed effects in the model and by assessing whether past performance of own-country peers predicts the current share of own-country peers supports the hypothesis that the share of own-country peers is plausibly random.
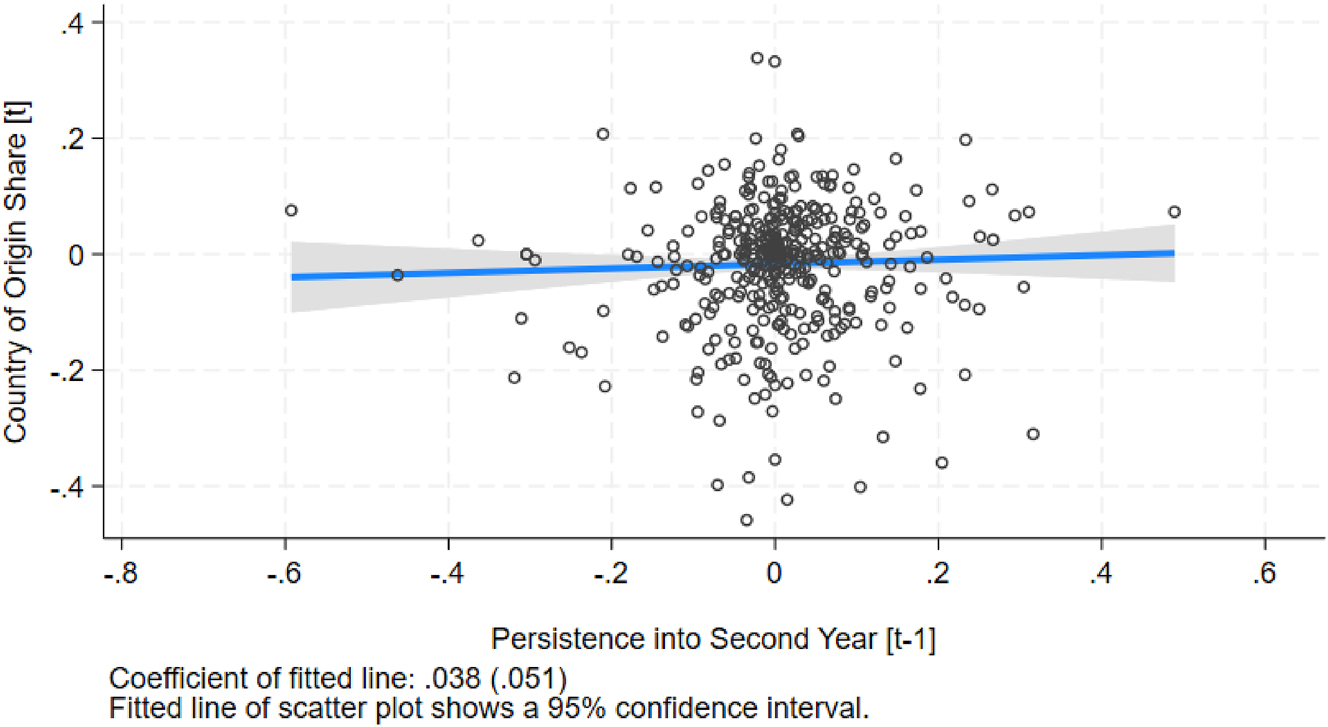
Lagged persistence into the second year against country of origin share. Note: This figure plots the relationship between the residualized share of students from the same country of origin in the current cohort (t) against the residualized persistence rate into the second year from the same country in the prior cohort (t-1). The residuals are from Equation (2), and each point represents a unique combination of country, institution and field, collapsed by enrollment year. The fitted line represents the linear relationship with a coefficient of 0.038 (SE = 0.051), and the shaded area depicts the 95 % confidence interval.
5 Primary Results
Table 2 shows the results from the main model (equation (2)). The sample used to generate estimates in this table combines all cohorts and the model restricts the coefficients on the peer variables to be the same across cohorts. For example, when examining persistence into year two, all cohorts from 2009 to 2014 are observed. However, when examining persistence into year four, only cohorts from 2009 to 2012 are observed for at least four years. Cohorts from 2009 to 2014 contribute to the year two persistence analysis but only the cohorts from 2009 to 2012 contribute to the year four persistence outcome. It is possible that estimates of the effect of the share of own-country peers on persistence into year two could differ by cohort. To assess this possibility, I re-estimated the models underlying Table 2 using only balanced panels of cohorts. Results are reported in Appendix Table 1 and 2 and indicate that using the unbalanced panel of cohorts is not materially affecting estimates.
Effect of own-country peer composition on educational outcomes.
| (1) | (2) | (3) | (4) | (5) | (6) | |
|---|---|---|---|---|---|---|
| Share of peers | Number of peers | |||||
| 0 < s ≤ 0.15 | 0.15 < s ≤ 0.30 | s > 0.30 | = 1 | = 2 | ≥ 3 | |
| Persistence into year 2 | −0.047 | −0.041 | −0.074** | −0.032 | −0.035 | −0.120*** |
| (0.033) | (0.034) | (0.033) | (0.032) | (0.033) | (0.045) | |
| Observation | 1,706 | 1,706 | 1,706 | 1,706 | 1,706 | 1,706 |
| Mean of Dep. Var. | 0.91 | 0.91 | 0.91 | 0.91 | 0.91 | 0.91 |
| Persistence into year 3 | −0.059 | −0.150** | −0.139*** | −0.103** | −0.205*** | −0.184** |
| (0.053) | (0.058) | (0.052) | (0.052) | (0.064) | (0.073) | |
| Observation | 1,364 | 1,364 | 1,364 | 1,364 | 1,364 | 1,364 |
| Mean of Dep. Var. | 0.79 | 0.79 | 0.79 | 0.79 | 0.79 | 0.79 |
| Persistence into year 4 | −0.108 | −0.103 | −0.115 | −0.132** | −0.213** | −0.106 |
| (0.069) | (0.088) | (0.088) | (0.066) | (0.106) | (0.111) | |
| Observation | 1,031 | 1,031 | 1,031 | 1,031 | 1,031 | 1,031 |
| Mean of Dep. Var. | 0.68 | 0.68 | 0.68 | 0.68 | 0.68 | 0.68 |
| Complete MA within 2 years | 0.019 | 0.003 | 0.001 | 0.030 | −0.028 | −0.009 |
| (0.031) | (0.029) | (0.027) | (0.020) | (0.035) | (0.033) | |
| Observation | 1,706 | 1,706 | 1,706 | 1,706 | 1,706 | 1,706 |
| Mean of Dep. Var. | 0.06 | 0.06 | 0.06 | 0.06 | 0.06 | 0.06 |
| Complete MA within 3 years | −0.003 | −0.023 | −0.034 | 0.014 | −0.081 | −0.023 |
| (0.044) | (0.055) | (0.041) | (0.035) | (0.054) | (0.054) | |
| Observation | 1,364 | 1,364 | 1,364 | 1,364 | 1,364 | 1,364 |
| Mean of Dep. Var. | 0.11 | 0.11 | 0.11 | 0.11 | 0.11 | 0.11 |
| Complete PhD within 4 years | 0.003 | 0.053 | −0.051 | 0.018 | −0.058 | −0.018 |
| (0.050) | (0.048) | (0.036) | (0.044) | (0.054) | (0.052) | |
| Observation | 1,031 | 1,031 | 1,031 | 1,031 | 1,031 | 1,031 |
| Mean of Dep. Var. | 0.05 | 0.05 | 0.05 | 0.05 | 0.05 | 0.05 |
| Complete PhD within 5 years | −0.273*** | −0.188* | −0.107 | −0.266** | −0.190 | −0.164 |
| (0.104) | (0.113) | (0.010) | (0.108) | (0.139) | (0.143) | |
| Observation | 720 | 720 | 720 | 720 | 720 | 720 |
| Mean of Dep. Var. | 0.14 | 0.14 | 0.14 | 0.14 | 0.14 | 0.14 |
-
Robust standard errors in parentheses. ***p < 0.01, **p < 0.05, *p < 0.1. Note: Each row corresponds to a separate regression outcome. All regressions control for individual demographics (gender and age at enrollment) and include institution-by-field-by-country fixed effects, country-by-year fixed effects, institution-by-year fixed effects, and field-by-year fixed effects. Standard errors are clustered at the institution, field, and enrollment year level. Columns (1) to (3) report estimates from a regression where the independent variable is the share of peers from the same country, categorized into three bins: (0 < s ≤ 0.15), (0.15 < s ≤ 0.30), and s > 0.30, where the omitted category is 0, while Columns (4) to (6) report estimates from a regression where the independent variable is the number of same-country peers, categorized into three bins: one peer, two peers, and three or more peers, where the omitted category is zero peer.
Table 2 presents estimates from models using each of the own-country peers measures: share of own-country peers and number of own-country peers. Each of these measures is grouped into dummy variable categories. There are also estimates pertaining to three measures of persistence – into year two, year three and year four – and two measures of MA completion – within 2 years and within three years – and Ph.D. completion – within four years and within five years, respectively.
Starting with estimates related to persistence, there is a distinct pattern. In programs where there are a substantial share or number of own-country peers, persistence into years two and three is significantly lower. For example, in programs in which more than 30 percent of the cohort is own-country peers, persistence into year two is lower by approximately seven percentage points (eight percent). Similarly, in programs where there are three or more own-country peers, persistence into year two is lower by 12 percentage points (13 percent). There is not much evidence that the association between own-country peers and persistence is characterized by a dose-response relationship. Instead, estimates indicate more of a threshold effect. Persistence into year two declines significantly only when there are more than 30 percent, or three or more, own-country peers. Persistence into year three is lower by approximately the same amount after there are more than 15 percent, or 2 or more own-country peers.
The own-country peer effects appear to be both larger and more precisely estimated for persistence into year 3 than year 2. This pattern is consistent with student attrition models where students typically persist through an initial adjustment period before deciding to leave. Moreover, studies have shown that high-stakes examinations serve as critical points as students who fail are substantially more likely to opt out (Lindo et al. 2010; Ou 2010). In doctoral programs, these high-stakes examinations like comprehensive exams are often taken during the second year, one retake permitted. The timing coincides with the large effect found in persistence into year 3. While interesting, it is important to note these potential mechanisms are speculative and I am unable to directly test for these mechanisms with the current data. Own-country peers do not have a significant effect on persistence into year four.
Estimates related to obtaining a master’s degree indicate that the negative effect on persistence is not driven by students leaving with a master’s degree instead of completing their doctoral program. Even though lower persistence into the second year is observed in programs with a higher share or number of own-country peers, there is no corresponding increase in master’s degree completion within two years. Similarly, while persistence into the third year is also lower when the share or number of own-country peers exceeds certain thresholds, there is no significant effect on the likelihood of completing a master’s degree within three years. This suggests that students who leave after one or two years are more likely to have dropped out without a terminal master’s degree. On the other hand, estimates related to obtaining a Ph.D. indicate that own-country peers may have an adverse effect on completion within four or five years, but estimates are relatively imprecise. Only five percent of the sample obtained a Ph.D. within four years and only 14 percent obtained a Ph.D. within five years. These figures are consistent with national figures.[15] Given the caveat related to statistical power, estimates in Table 2 suggest that having own-country peers lowers the probability of obtaining a Ph.D. within five years.
5.1 Sensitivity Results
As noted above, estimates in Table 2 are from a model that includes the three-way fixed effects of institution-by-field-by-country and all possible two-way fixed effects. To assess whether estimates in Table 2 are sensitive to the inclusion of other fixed effects, I re-estimated the regression models including three of the four possible three-way fixed effect combinations. Each time I re-estimated the model, I excluded a different three-way fixed effect. Estimates from these sensitivity analyses are in Appendix Table 3 and 4.
Most estimates in Appendix Table 3 are not qualitatively different from those shown in Columns 1 to 3 of Table 2. For example, in Table 2, the coefficient on having an own-country share of greater than 30 percent in the model of persistence into year two was −0.07. The analogous coefficients in Appendix Table 3 range from −0.066 to −0.12. In Table 2, having an own-country share of greater than 30 percent was associated with a 14-percentage point lower probability of persisting into year three. In Appendix Table 3, the analogous estimates range from −0.21 to −0.63 – somewhat higher but also more imprecisely estimated. Nevertheless, qualitatively, all estimates suggest a negative own-country peer effect. Similarly, the coefficient on having three or more own-country peers in the model of persistence into year two was −0.12 (Columns 4 to 6 of Table 2). Analogous estimates in Appendix Table 4 range from −0.02 to −0.12, which suggest a somewhat smaller effect than the estimate in Table 2 but still negative. And having three or more own-country peers was associated with an 18-percentage point lower probability of persisting into year three. Estimates in Appendix Table 4 range from −0.14 to −0.23.
In sum, while there is some variation in estimates of the effect of own-country peers on international student performance in Ph.D. programs, it is not the case that qualitatively and often quantitatively as well, estimates are highly dependent on the fixed effects included. This result suggests that the research design is plausible and that the variation in own-country peers is plausibly exogenous conditional on the fixed effects included in the main model.
5.2 Is It Own-Country Peers or International Peers?
To assess whether the observed own-country effects are driven by general broader peer dynamics among international students, I augment the preferred model to include the share of other international students. This specification allows me to separate the effects of same-country peers from those of other international students. Estimates from this augmented model are presented in Table 3 (Columns 4 to 6), while Columns 1 to 3 provide estimates from the preferred model for comparison. Across all outcomes, the results indicate that the negative effect of own-country peers on persistence remains even after accounting for the presence of other international students. The estimates for persistence into the second and third years remain statistically significant, while the share of other international students does not exhibit a strong or systematic relationship with persistence. Similarly, the inclusion of other international peers does not alter the findings related to degree completion. The likelihood of obtaining a master’s within two or three years remains unaffected, reinforcing that lower persistence is not explained by students dropping out with a terminal master’s degree. The negative relationship between own-country peer composition and Ph.D. completion within five years also persists, further indicating that the observed effects are specific to same-country peers rather than general international peer exposure.
Effect of own-country and other international share on educational outcomes.
| (1) | (2) | (3) | (4) | (5) | (6) | |
|---|---|---|---|---|---|---|
| Share of peers | Share of peers | |||||
| 0 < s ≤ 0.15 | 0.15 < s ≤ 0.30 | s > 0.30 | 0 < s ≤ 0.15 | 0.15 < s ≤ 0.30 | s > 0.30 | |
| Persistence into year 2 | ||||||
| Share of own country | −0.047 | −0.041 | −0.074** | −0.049 | −0.027 | −0.072* |
| (0.033) | (0.034) | (0.033) | (0.036) | (0.036) | (0.042) | |
| Share of other international | −0.062 | −0.054 | −0.027 | |||
| (0.074) | (0.061) | (0.045) | ||||
| Observation | 1,706 | 1,706 | 1,706 | 1,706 | 1,706 | 1,706 |
| Mean of Dep. Var. | 0.91 | 0.91 | 0.91 | 0.91 | 0.91 | 0.91 |
| Persisteftnce into year 3 | ||||||
| Share of own country | −0.059 | −0.150** | −0.139*** | −0.083 | −0.181*** | −0.161** |
| (0.053) | (0.058) | (0.052) | (0.056) | (0.063) | (0.068) | |
| Share of other international | −0.026 | −0.004 | 0.051 | |||
| (0.112) | (0.084) | (0.074) | ||||
| Observation | 1,364 | 1,364 | 1,364 | 1,364 | 1,364 | 1,364 |
| Mean of Dep. Var. | 0.79 | 0.79 | 0.79 | 0.79 | 0.79 | 0.79 |
| Persistence into year 4 | ||||||
| Share of own country | −0.108 | −0.103 | −0.115 | −0.087 | −0.143 | −0.094 |
| (0.070) | (0.088) | (0.088) | (0.074) | (0.092) | (0.107) | |
| Share of other international | −0.253 | 0.041 | 0.071 | |||
| (0.164) | (0.140) | (0.109) | ||||
| Observation | 1,031 | 1,031 | 1,031 | 1,031 | 1,031 | 1,031 |
| Mean of Dep. Var. | 0.68 | 0.68 | 0.68 | 0.68 | 0.68 | 0.68 |
| Complete MA within 2 years | ||||||
| Share of own country | 0.019 | 0.003 | 0.001 | 0.030 | −0.000 | 0.015 |
| (0.031) | (0.029) | (0.027) | (0.030) | (0.029) | (0.028) | |
| Share of other international | 0.028 | 0.079* | 0.062** | |||
| (0.049) | (0.040) | (0.025) | ||||
| Observation | 1,706 | 1,706 | 1,706 | 1,706 | 1,706 | 1,706 |
| Mean of Dep. Var. | 0.06 | 0.06 | 0.06 | 0.06 | 0.06 | 0.06 |
| Complete MA within 3 years | ||||||
| Share of own country | −0.003 | −0.023 | −0.034 | −0.004 | −0.030 | −0.046 |
| (0.044) | (0.055) | (0.041) | (0.043) | (0.056) | (0.042) | |
| Share of other international | 0.098 | 0.057 | 0.018 | |||
| (0.074) | (0.063) | (0.042) | ||||
| Observation | 1,364 | 1,364 | 1,364 | 1,364 | 1,364 | 1,364 |
| Mean of Dep. Var. | 0.11 | 0.11 | 0.11 | 0.11 | 0.11 | 0.11 |
| Complete PhD within 4 years | ||||||
| Share of own country | 0.003 | 0.053 | −0.051 | −0.014 | 0.040 | −0.092** |
| (0.050) | (0.048) | (0.036) | (0.050) | (0.051) | (0.039) | |
| Share of other international | 0.165* | 0.037 | 0.003 | |||
| (0.087) | (0.063) | (0.050) | ||||
| Observation | 1,031 | 1,031 | 1,031 | 1,031 | 1,031 | 1,031 |
| Mean of Dep. Var. | 0.05 | 0.05 | 0.05 | 0.05 | 0.05 | 0.05 |
| Complete PhD within 5 years | ||||||
| Share of own country | −0.273*** | −0.188* | −0.107 | −0.300*** | −0.228* | −0.256** |
| (0.104) | (0.113) | (0.010) | (0.100) | (0.118) | (0.126) | |
| Share of other international | 0.063 | −0.017 | −0.193 | |||
| (0.232) | (0.183) | (0.136) | ||||
| Observation | 720 | 720 | 720 | 720 | 720 | 720 |
| Mean of Dep. Var. | 0.14 | 0.14 | 0.14 | 0.14 | 0.14 | 0.14 |
-
Robust standard errors in parentheses. ***p < 0.01, **p < 0.05, *p < 0.1. Note: Each row corresponds to a separate regression outcome. All regressions control for individual demographics (gender and age at enrollment) and include institution-by-field-by-country fixed effects, country-by-year fixed effects, institution-by-year fixed effects, and field-by-year fixed effects. Standard errors are clustered at the institution, field, and enrollment year level. Columns (1) to (3) report estimates from a regression where the independent variable is the share of peers from the same country, categorized into three bins: (0 < s ≤ 0.15), (0.15 < s ≤ 0.30), and s > 0.30, where the omitted category is 0. Columns (4) to (6) report estimates from a separate regression that includes both the share of same-country peers and the share of other international students (excluding those from the respondent’s country), using the same categorical bins and omitted category.
I extend the analysis by also including both the number of own-country peers and the number of other international peers. Table 4 presents these results, with Columns 1 to 3 replicating the preferred model and Columns 4 to 6 including both own-country peers and other international peers. The findings remain consistent with previous results. The inclusion of other international peers does not substantially alter these patterns, as their coefficients remain small and statistically insignificant for most persistence outcomes. For degree completion, the results continue to show no evidence that lower persistence is explained by students dropping out with a terminal master’s degree. A higher number of own-country peers is still associated with lower Ph.D. completion rates within five years, reinforcing that the observed effects are specific to same-country peer composition.
Effect of number of own-country and other international peers on educational outcomes.
| (1) | (2) | (3) | (4) | (5) | (6) | |
|---|---|---|---|---|---|---|
| Number of peers | Number of peers | |||||
| n = 1 | n = 2 | n ≥ 3 | n = 1 | n = 2 | n ≥ 3 | |
| Persistence into year 2 | ||||||
| Number of own country | −0.032 | −0.035 | −0.120*** | −0.032 | −0.031 | −0.122*** |
| (0.032) | (0.033) | (0.045) | (0.032) | (0.033) | (0.045) | |
| Number of other international | −0.022 | 0.049 | −0.030 | |||
| (0.041) | (0.052) | (0.052) | ||||
| Observation | 1,706 | 1,706 | 1,706 | 1,706 | 1,706 | 1,706 |
| Mean of Dep. Var. | 0.91 | 0.91 | 0.91 | 0.91 | 0.91 | 0.91 |
| Persistence into year 3 | ||||||
| Number of own country | −0.103** | −0.205*** | −0.184** | −0.100* | −0.201*** | −0.182** |
| (0.052) | (0.064) | (0.073) | (0.053) | (0.066) | (0.073) | |
| Number of other international | 0.026 | 0.021 | 0.043 | |||
| (0.076) | (0.079) | (0.076) | ||||
| Observation | 1,364 | 1,364 | 1,364 | 1,364 | 1,364 | 1,364 |
| Mean of Dep. Var. | 0.79 | 0.79 | 0.79 | 0.79 | 0.79 | 0.79 |
| Persistence into year 4 | ||||||
| Number of own country | −0.132** | −0.213** | −0.106 | −0.134* | −0.247** | −0.115 |
| (0.066) | (0.106) | (0.111) | (0.069) | (0.117) | (0.105) | |
| Number of other international | 0.008 | −0.049 | 0.132 | |||
| (0.120) | (0.123) | (0.132) | ||||
| Observation | 1,031 | 1,031 | 1,031 | 1,031 | 1,031 | 1,031 |
| Mean of Dep. Var. | 0.68 | 0.68 | 0.68 | 0.68 | 0.68 | 0.68 |
| Complete MA within 2 years | ||||||
| Number of own country | 0.030 | −0.028 | −0.009 | 0.034* | −0.030 | −0.006 |
| (0.020) | (0.035) | (0.033) | (0.021) | (0.034) | (0.032) | |
| Number of other international | 0.078*** | 0.022 | 0.068** | |||
| (0.026) | (0.031) | (0.031) | ||||
| Observation | 1,706 | 1,706 | 1,706 | 1,706 | 1,706 | 1,706 |
| Mean of Dep. Var. | 0.06 | 0.06 | 0.06 | 0.06 | 0.06 | 0.06 |
| Complete MA within 3 years | ||||||
| Number of own country | 0.014 | −0.081 | −0.023 | 0.005 | −0.092* | −0.027 |
| (0.035) | (0.054) | (0.054) | (0.035) | (0.054) | (0.052) | |
| Number of other international | 0.081* | −0.001 | −0.019 | |||
| (0.046) | (0.051) | (0.047) | ||||
| Observation | 1,364 | 1,364 | 1,364 | 1,364 | 1,364 | 1,364 |
| Mean of Dep. Var. | 0.11 | 0.11 | 0.11 | 0.11 | 0.11 | 0.11 |
| Complete PhD within 4 years | ||||||
| Number of own country | 0.018 | −0.058 | −0.018 | 0.020 | −0.047 | −0.015 |
| (0.044) | (0.054) | (0.052) | (0.047) | (0.058) | (0.052) | |
| Number of other international | 0.033 | 0.042 | 0.007 | |||
| (0.057) | (0.049) | (0.056) | ||||
| Observation | 1,031 | 1,031 | 1,031 | 1,031 | 1,031 | 1,031 |
| Mean of Dep. Var. | 0.05 | 0.05 | 0.05 | 0.05 | 0.05 | 0.05 |
| Complete PhD within 5 years | ||||||
| Number of own country | −0.266** | −0.190 | −0.164 | −0.331*** | −0.305* | −0.215 |
| (0.108) | (0.139) | (0.143) | (0.108) | (0.163) | (0.147) | |
| Number of other international | −0.029 | −0.343*** | −0.240 | |||
| (0.140) | (0.126) | (0.155) | ||||
| Observation | 720 | 720 | 720 | 720 | 720 | 720 |
| Mean of Dep. Var. | 0.14 | 0.14 | 0.14 | 0.14 | 0.14 | 0.14 |
-
Robust standard errors in parentheses. ***p < 0.01, **p < 0.05, *p < 0.1. Note: Each row corresponds to a separate regression outcome. All regressions control for individual demographics (gender and age at enrollment) and include institution-by-field-by-country fixed effects, country-by-year fixed effects, institution-by-year fixed effects, and field-by-year fixed effects. Standard errors are clustered at the institution, field, and enrollment year level. Columns (1) to (3) report estimates from a regression where the independent variable is the number of same-country peers, categorized into three bins: one peer, two peers, and three or more peers, where the omitted category is zero peer. Columns (4) to (6) report estimates from a separate regression that includes both the number of same-country peers and the number of other international students (excluding those from the respondent’s country), using the same categorical bins and omitted category.
Additionally, to assess if own-country peers from the prior cohort also affect educational performance, I redefine peer group to include both the contemporaneous and previous year cohort. Note that because the data begin in 2009, I cannot construct the two-cohort peer groups for those who enter in 2009. In Appendix Table 5, present the two specifications side by side where Columns 1 to 3 report the estimates of the share-based measure while Columns 4–6 report the estimates from the number-based measure. The results indicate that incorporating peers from the prior cohort leaves the results largely unchanged. These results imply that the influence of the one-year prior cohort is about the same as the contemporaneous cohort.
6 Conclusions
Using a unique administrative dataset that matches students to their peers from the same country of origin, I study the importance of cultural match among international students at the post-graduate level. The estimation uses year-to-year variation in the share of country of origin peers within doctoral programs to address concerns about systematic sorting into programs. To investigate the nature of the peer effect, I examine the peer effect by constructing categorical indicators for both the share and number of own-country peers, using threshold-based groupings to capture potential non-linear relationships. I find that a greater concentration of own-country peers has a negative effect on performance in doctoral programs, especially once exposure surpasses certain thresholds. Importantly, the adverse effect remains even after controlling for the influence of other international peers, indicating that it is not simply a result of broader international peer dynamics.
The results imply that a more heterogenous (in terms of country of origin) cohort may help with the persistence of international students. These results have direct implications for policymakers and university administrators striving to enhance doctoral student outcomes through low-cost, scalable interventions. First, universities could implement cross-cultural mentorship programs, pairing international doctoral students with mentors from diverse cultural or academic backgrounds. Such programs can help students expand their networks and access alternative sources of guidance, mitigating the risks of isolation within homogenous groups. Second, orientation programs designed to encourage cultural exchange and collaboration among peers from different backgrounds could foster integration from the outset, creating a more inclusive cohort experience. Finally, faculty training in inclusive pedagogical strategies and language classes can play a vital role in addressing implicit group dynamics and promoting equitable classroom learning, ensuring that diverse cohorts benefit collectively from the educational environment. Departments can track cohort country-of-origin shares at key junctures (e.g. Matriculation and end of year 1) and implement these supports as cohorts evolve.
While encouraging admissions committees to increase diversity across country of origin might seems like another natural recommendation, a more detailed understanding of the mechanisms underlying the peer effects from country composition is required before implementing such measures. In contrast, the proposed initiatives – mentorship programs, orientation activities, and faculty training – are low-cost in nature, making them particularly appealing options. These interventions not only improve student outcomes without imposing significant financial burdens but also align with broader institutional goals of attracting and retaining a diverse global talent pool, thereby enhancing both student experiences and the university’s academic reputation.
By documenting the first evidence of peer effects among international students in doctoral programs, my research provides the reduced form estimates that can provide the basis for further work on mechanisms. Future research might use a qualitative approach to better understand how international students perceive their same-country peers, or use more detailed data on networks to better understand mechanisms. Also, future research might investigate whether the negative effects documented in this study generalize to other contexts, either in Ph.D. programs in other states or in lower-level degrees.
Effect of own-country share on educational outcomes by enrollment year.
| (1) | (2) | (3) | (4) | (5) | (6) | (7) | (8) | (9) | (10) | (11) | (12) | |
|---|---|---|---|---|---|---|---|---|---|---|---|---|
| Enrolled in year 2009–2011 | Enrolled in year 2009–2012 | Enrolled in year 2009–2013 | Enrolled in year 2009–2014 | |||||||||
| Share of peers | Share of peers | Share of peers | Share of peers | |||||||||
| 0 < s ≤ 0.15 | 0.15 < s ≤ | s > 0.30 | 0 < s ≤ 0.15 | 0.15 < s ≤ | s > 0.30 | 0 < s ≤ 0.15 | 0.15 < s ≤ | s > 0.30 | 0 < s ≤ 0.15 | 0.15 < s ≤ | s > 0.30 | |
| Persistence into year 2 | −0.076 | −0.094 | −0.145** | −0.077** | −0.062 | −0.092** | −0.049 | −0.080** | −0.102*** | −0.048 | −0.033 | −0.077** |
| (0.049) | (0.058) | (0.068) | (0.031) | (0.043) | (0.045) | (0.032) | (0.038) | (0.036) | (0.034) | (0.035) | (0.034) | |
| Observation | 720 | 720 | 720 | 1,031 | 1,031 | 1,031 | 1,364 | 1,364 | 1,364 | 1,706 | 1,706 | 1,706 |
| Mean of Dep. Var. | 0.91 | 0.91 | 0.91 | 0.91 | 0.91 | 0.91 | 0.92 | 0.92 | 0.92 | 0.92 | 0.92 | 0.92 |
| Persistence into year 3 | −0.183*** | −0.311*** | −0.344*** | −0.129** | −0.191*** | −0.230*** | −0.088* | −0.191*** | −0.191*** | |||
| (0.068) | (0.086) | (0.106) | (0.056) | (0.069) | (0.069) | (0.053) | (0.062) | (0.056) | ||||
| Observation | 720 | 720 | 720 | 1,031 | 1,031 | 1,031 | 1,364 | 1,364 | 1,364 | |||
| Mean of Dep. Var. | 0.79 | 0.79 | 0.79 | 0.79 | 0.79 | 0.79 | 0.79 | 0.79 | 0.79 | |||
| Persistence into year 4 | −0.161 | −0.192 | −0.274** | −0.126* | −0.154 | −0.164* | ||||||
| (0.103) | (0.125) | (0.111) | (0.068) | (0.094) | (0.094) | |||||||
| Observation | 720 | 720 | 720 | 1,031 | 1,031 | 1,031 | ||||||
| Mean of Dep. Var. | 0.67 | 0.67 | 0.67 | 0.68 | 0.68 | 0.68 | ||||||
| Complete MA within 2 years | 0.018 | −0.069 | −0.092* | −0.019 | −0.027 | −0.029 | 0.001 | −0.018 | −0.034 | 0.019 | 0.003 | 0.001 |
| (0.061) | (0.062) | (0.054) | (0.042) | (0.038) | (0.033) | (0.034) | (0.030) | (0.028) | (0.031) | (0.029) | (0.027) | |
| Observation | 720 | 720 | 720 | 1,031 | 1,031 | 1,031 | 1,364 | 1,364 | 1,364 | 1,706 | 1,706 | 1,706 |
| Mean of Dep. Var. | 0.05 | 0.05 | 0.05 | 0.05 | 0.05 | 0.05 | 0.06 | 0.06 | 0.06 | 0.06 | 0.06 | 0.06 |
| Complete MA within 3 years | 0.048 | −0.029 | −0.029 | 0.013 | 0.051 | 0.006 | −0.003 | −0.023 | −0.034 | |||
| (0.076) | (0.095) | (0.095) | (0.047) | (0.065) | (0.048) | (0.044) | (0.055) | (0.041) | ||||
| Observation | 720 | 720 | 720 | 1,031 | 1,031 | 1,031 | 1,364 | 1,364 | 1,364 | |||
| Mean of Dep. Var. | 0.11 | 0.11 | 0.11 | 0.10 | 0.10 | 0.10 | 0.11 | 0.11 | 0.11 | |||
| Complete PhD within 4 years | −0.076 | −0.034 | −0.066 | 0.001 | 0.045 | −0.064* | ||||||
| (0.078) | (0.081) | (0.071) | (0.0507) | (0.051) | (0.038) | |||||||
| Observation | 720 | 720 | 720 | 1,031 | 1,031 | 1,031 | ||||||
| Mean of Dep. Var. | 0.05 | 0.05 | 0.05 | 0.05 | 0.05 | 0.05 | ||||||
| Complete PhD within 5 years | −0.076 | −0.202* | −0.136 | |||||||||
| (0.078) | (0.119) | (0.108) | ||||||||||
| Observation | 720 | 720 | 720 | |||||||||
| Mean of Dep. Var. | 0.14 | 0.14 | 0.14 | |||||||||
-
Robust standard errors in parentheses. ***p < 0.01, **p < 0.05, *p < 0.1. Note: Each row corresponds to a separate regression outcome. All regressions control for individual demographics (gender and age at enrollment) and include institution-by-field-by-country fixed effects, country-by-year fixed effects, institution-by-year fixed effects, and field-by-year fixed effects. Standard errors are clustered at the institution, field, and enrollment year level. Columns are grouped by enrollment cohorts: Columns (1)–(3) include students who enrolled between 2009 and 2011, Columns (4)–(6) include students enrolled between 2009 and 2012, Columns (7)–(9) include students enrolled between 2009 and 2013, and Columns (10)–(12) include students enrolled between 2009 and 2014. Within each cohort group, the independent variable is the share of peers from the same country, categorized into three bins: (0 < s ≤ 0.15), (0.15 < s ≤ 0.30), and s > 0.30, where the omitted category is 0.
Effect of number of own-country peers on educational outcomes by enrollment year.
| (1) | (2) | (3) | (4) | (5) | (6) | (7) | (8) | (9) | (10) | (11) | (12) | |
|---|---|---|---|---|---|---|---|---|---|---|---|---|
| Enrolled in year 2009–2011 | Enrolled in year 2009–2012 | Enrolled in year 2009–2013 | Enrolled in year 2009–2014 | |||||||||
| Number of peers | Number of peers | Number of peers | Number of peers | |||||||||
| = 1 | = 2 | ≥ 3 | = 1 | = 2 | ≥ 3 | = 1 | = 2 | ≥ 3 | = 1 | = 2 | ≥ 3 | |
| Persistance into year 2 | −0.069 | −0.071 | −0.218*** | −0.059 | −0.070* | −0.133*** | −0.057* | −0.060* | −0.130*** | −0.032 | −0.035 | −0.120*** |
| (0.050) | (0.071) | (0.075) | (0.036) | (0.041) | (0.041) | (0.034) | (0.036) | (0.040) | (0.032) | (0.033) | (0.045) | |
| Observation | 720 | 720 | 720 | 1,031 | 1,031 | 1,031 | 1,364 | 1,364 | 1,364 | 1,706 | 1,706 | 1,706 |
| Mean of Dep. Var. | 0.91 | 0.91 | 0.91 | 0.91 | 0.91 | 0.91 | 0.92 | 0.92 | 0.92 | 0.92 | 0.92 | 0.92 |
| Persistance into year 3 | −0.185*** | −0.335*** | −0.372*** | −0.119** | −0.266*** | −0.216*** | −0.103** | −0.205*** | −0.184** | |||
| (0.066) | (0.111) | (0.108) | (0.056) | (0.074) | (0.071) | (0.052) | (0.064) | (0.073) | ||||
| Observation | 720 | 720 | 720 | 1,031 | 1,031 | 1,031 | 1,364 | 1,364 | 1,364 | |||
| Mean of Dep. Var. | 0.79 | 0.79 | 0.79 | 0.79 | 0.79 | 0.79 | 0.79 | 0.79 | 0.79 | |||
| Persistance into year 4 | −0.194** | −0.212 | −0.141 | −0.132** | −0.213** | −0.106 | ||||||
| (0.093) | (0.140) | (0.150) | (0.066) | (0.106) | (0.111) | |||||||
| Observation | 720 | 720 | 720 | 1,031 | 1,031 | 1,031 | ||||||
| Mean of Dep. Var. | 0.67 | 0.67 | 0.67 | 0.68 | 0.68 | 0.68 | ||||||
| Complete MA within 2 years | −0.029 | −0.015 | −0.059 | −0.012 | −0.059 | −0.020 | 0.005 | −0.048 | −0.026 | 0.030 | −0.028 | −0.009 |
| (0.043) | (0.086) | (0.052) | (0.028) | (0.051) | (0.039) | (0.025) | (0.035) | (0.039) | (0.020) | (0.035) | (0.033) | |
| Observation | 720 | 720 | 720 | 1,031 | 1,031 | 1,031 | 1,364 | 1,364 | 1,364 | 1,706 | 1,706 | 1,706 |
| Mean of Dep. Var. | 0.05 | 0.05 | 0.05 | 0.05 | 0.05 | 0.05 | 0.06 | 0.06 | 0.06 | 0.06 | 0.06 | 0.06 |
| Complete MA within 3 years | 0.022 | −0.023 | −0.005 | 0.042 | −0.045 | 0.030 | 0.014 | −0.081 | −0.023 | |||
| (0.068) | (0.098) | (0.074) | (0.040) | (0.067) | (0.053) | (0.035) | (0.054) | (0.054) | ||||
| Observation | 720 | 720 | 720 | 1,031 | 1,031 | 1,031 | 1,364 | 1,364 | 1,364 | |||
| Mean of Dep. Var. | 0.11 | 0.11 | 0.11 | 0.10 | 0.10 | 0.10 | 0.11 | 0.11 | 0.11 | |||
| Complete PhD within 4 years | −0.059 | −0.058 | −0.064 | 0.018 | −0.058 | −0.018 | ||||||
| (0.072) | (0.110) | (0.103) | (0.044) | (0.054) | (0.052) | |||||||
| Observation | 720 | 720 | 720 | 1,031 | 1,031 | 1,031 | ||||||
| Mean of Dep. Var. | 0.05 | 0.05 | 0.05 | 0.05 | 0.05 | 0.05 | ||||||
| Complete PhD within 5 years | −0.266** | −0.190 | −0.164 | |||||||||
| (0.108) | (0.139) | (0.143) | ||||||||||
| Observation | 720 | 720 | 720 | |||||||||
| Mean of Dep. Var. | 0.14 | 0.14 | 0.14 | |||||||||
-
Robust standard errors in parentheses. ***p < 0.01, **p < 0.05, *p < 0.1. Note: Each row corresponds to a separate regression outcome. All regressions control for individual demographics (gender and age at enrollment) and include institution-by-field-by-country fixed effects, country-by-year fixed effects, institution-by-year fixed effects, and field-by-year fixed effects. Standard errors are clustered at the institution, field, and enrollment year level. Columns are grouped by enrollment cohorts: Columns (1)–(3) include students who enrolled between 2009 and 2011, Columns (4)–(6) include students enrolled between 2009 and 2012, Columns (7)–(9) include students enrolled between 2009 and 2013, and Columns (10)–(12) include students enrolled between 2009 and 2014. Within each cohort group, the independent variable is the number of same-country peers, categorized into three bins: one peer, two peers, and three or more peers, where the omitted category is zero peer.
Effect of own-country share on educational outcomes across different fixed effects specifications.
| (1) | (2) | (3) | (4) | (5) | (6) | (7) | (8) | (9) | (10) | (11) | (12) | |
|---|---|---|---|---|---|---|---|---|---|---|---|---|
| Share of peers | Share of peers | Share of peers | Share of peers | |||||||||
| 0 < s ≤ 0.15 | 0.15 < s ≤ 0.30 | s > 0.30 | 0 < s ≤ 0.15 | 0.15 < s ≤ 0.30 | s > 0.30 | 0 < s ≤ 0.15 | 0.15 < s ≤ 0.30 | s > 0.30 | 0 < s ≤ 0.15 | 0.15 < s ≤ 0.30 | s > 0.30 | |
| Persistence into year 2 | −0.013 | 0.010 | −0.121** | 0.001 | 0.034 | −0.070 | 0.164** | −0.062 | −0.066 | −0.116 | −0.104 | −0.097 |
| (0.066) | (0.042) | (0.048) | (0.042) | (0.051) | (0.053) | (0.077) | (0.085) | (0.109) | (0.159) | (0.077) | (0.067) | |
| Observation | 1,706 | 1,706 | 1,706 | 1,706 | 1,706 | 1,706 | 1,706 | 1,706 | 1,706 | 1,706 | 1,706 | 1,706 |
| Mean of Dep. Var. | 0.91 | 0.91 | 0.91 | 0.91 | 0.91 | 0.91 | 0.91 | 0.91 | 0.91 | 0.91 | 0.91 | 0.91 |
| Persistence into year 3 | 0.099 | −0.179 | −0.211* | −0.115* | −0.196** | −0.295*** | 0.067 | −0.097 | −0.627*** | −0.345*** | −0.030 | – |
| (0.129) | (0.115) | (0.124) | (0.066) | (0.090) | (0.083) | (0.106) | (0.160) | (0.175) | (0.106) | (0.205) | (0.063) | |
| Observation | 1,364 | 1,364 | 1,364 | 1,364 | 1,364 | 1,364 | 1,364 | 1,364 | 1,364 | 1,364 | 1,364 | 1,364 |
| Mean of Dep. Var. | 0.78 | 0.77 | 0.77 | 0.78 | 0.77 | 0.77 | 0.78 | 0.77 | 0.77 | 0.78 | 0.77 | 0.77 |
| Persistence into year 4 | 0.344 | 0.227 | 0.161 | −0.239** | −0.346** | −0.367*** | 0.570* | 0.677* | 0.135 | −0.334 | – | |
| (0.335) | (0.275) | (0.212) | (0.099) | (0.162) | (0.116) | (0.345) | (0.376) | (0.260) | (0.278) | (0.125) | ||
| Observation | 1,031 | 1,031 | 1,031 | 1,031 | 1,031 | 1,031 | 1,031 | 1,031 | 1,031 | 1,031 | 1,031 | |
| Mean of Dep. Var. | 0.68 | 0.68 | 0.68 | 0.68 | 0.68 | 0.68 | 0.68 | 0.68 | 0.68 | 0.68 | 0.68 | |
| Complete MA within 2 years | −0.067 | −0.040 | 0.025 | −0.003 | −0.077 | −0.024 | −0.107 | −0.187* | 0.174 | 0.203** | −0.135 | 0.018 |
| (0.052) | (0.041) | (0.045) | (0.040) | (0.055) | (0.053) | (0.084) | (0.098) | (0.159) | (0.094) | (0.129) | (0.041) | |
| Observation | 1,706 | 1,706 | 1,706 | 1,706 | 1,706 | 1,706 | 1,706 | 1,706 | 1,706 | 1,706 | 1,706 | 1,706 |
| Mean of Dep. Var. | 0.06 | 0.06 | 0.06 | 0.06 | 0.06 | 0.06 | 0.06 | 0.06 | 0.06 | 0.06 | 0.06 | 0.06 |
| Complete MA within 3 years | −0.038 | −0.067 | −0.104 | 0.037 | 0.037 | 0.088 | −0.160*** | −0.249** | −0.144* | 0.033 | −0.024 | 0.071 |
| (0.108) | (0.097) | (0.080) | (0.051) | (0.051) | (0.088) | (0.058) | (0.099) | (0.081) | (0.146) | (0.202) | (0.067) | |
| Observation | 1,364 | 1,364 | 1,364 | 1,364 | 1,364 | 1,364 | 1,364 | 1,364 | 1,364 | 1,364 | 1,364 | 1,364 |
| Mean of Dep. Var. | 0.11 | 0.11 | 0.11 | 0.11 | 0.11 | 0.11 | 0.11 | 0.11 | 0.11 | 0.11 | 0.11 | 0.11 |
| Complete PhD within 4 years | 0.159 | 0.162 | −0.080 | −0.027 | −0.001 | 0.011 | 0.055 | 0.040 | 0.085 | −0.214** | −0.020 | |
| (0.123) | (0.120) | (0.100) | (0.047) | (0.054) | (0.060) | (0.123) | (0.143) | (0.093) | (0.088) | (0.032) | ||
| Observation | 1,031 | 1,031 | 1,031 | 1,031 | 1,031 | 1,031 | 1,031 | 1,031 | 1,031 | 1,031 | 1,031 | |
| Mean of Dep. Var. | 0.05 | 0.05 | 0.05 | 0.05 | 0.05 | 0.05 | 0.05 | 0.05 | 0.05 | 0.05 | 0.05 | |
| Complete PhD within 5 years | −0.217 | −0.416*** | −0.065 | −0.231*** | −0.060 | −0.054 | 0.130 | −0.490*** | −0.518*** | |||
| (0.195) | (0.157) | (0.189) | (0.056) | (0.082) | (0.116) | (0.107) | (0.162) | (0.057) | ||||
| Observation | 720 | 720 | 720 | 720 | 720 | 720 | 720 | 720 | 720 | |||
| Mean of Dep. Var. | 0.14 | 0.14 | 0.14 | 0.14 | 0.14 | 0.14 | 0.14 | 0.14 | 0.14 | |||
| Institution x field x country | ✓ | ✓ | ✓ | ✓ | ✓ | ✓ | ✓ | ✓ | ✓ | |||
| Institution x country x year | ✓ | ✓ | ✓ | ✓ | ✓ | ✓ | ✓ | ✓ | ✓ | |||
| Field x country x year | ✓ | ✓ | ✓ | ✓ | ✓ | ✓ | ✓ | ✓ | ✓ | |||
| Institution x field x year | ✓ | ✓ | ✓ | ✓ | ✓ | ✓ | ✓ | ✓ | ✓ | |||
-
Robust standard errors in parentheses. ***p < 0.01, **p < 0.05, *p < 0.1. Note: Each row corresponds to a separate regression outcome where the independent variable is the share of peers from the same country, categorized into three bins: (0 < s ≤ 0.15), (0.15 < s ≤ 0.30), s > 0.30, and the omitted category is 0. All regressions control for individual demographics (gender and age at enrollment) and standard errors are clustered at the institution, field, and enrollment year level, alternated between different combinations of fixed effects.
Effect of number of own-country peers on educational outcomes across different fixed effects specifications.
| (1) | (2) | (3) | (4) | (5) | (6) | (7) | (8) | (9) | (10) | (11) | (12) | |
|---|---|---|---|---|---|---|---|---|---|---|---|---|
| Number of peers | Number of peers | Number of peers | Number of peers | |||||||||
| = 1 | = 2 | ≥ 3 | = 1 | = 2 | ≥ 3 | = 1 | = 2 | ≥ 3 | = 1 | = 2 | ≥ 3 | |
| Persistence into year 2 | −0.047 | −0.023 | −0.109 | 0.001 | −0.004 | −0.022 | 0.100* | 0.052 | −0.121 | −0.147* | −0.033 | −0.052 |
| (0.043) | (0.047) | (0.072) | (0.041) | (0.045) | (0.069) | (0.060) | (0.094) | (0.100) | (0.077) | (0.083) | (0.068) | |
| Observation | 1,706 | 1,706 | 1,706 | 1,706 | 1,706 | 1,706 | 1,706 | 1,706 | 1,706 | 1,706 | 1,706 | 1,706 |
| Mean of Dep. Var. | 0.91 | 0.91 | 0.91 | 0.91 | 0.91 | 0.91 | 0.91 | 0.91 | 0.91 | 0.91 | 0.91 | 0.91 |
| Persistence into year 3 | −0.093 | −0.307*** | −0.191 | −0.113 | −0.342*** | −0.144 | 0.005 | −0.140 | −0.237 | −0.195 | −0.160 | −0.191** |
| (0.106) | (0.105) | (0.175) | (0.071) | (0.074) | (0.110) | (0.130) | (0.217) | (0.172) | (0.153) | (0.177) | (0.074) | |
| Observation | 1,364 | 1,364 | 1,364 | 1,364 | 1,364 | 1,364 | 1,364 | 1,364 | 1,364 | 1,364 | 1,364 | 1,364 |
| Mean of Dep. Var. | 0.79 | 0.79 | 0.79 | 0.79 | 0.79 | 0.79 | 0.79 | 0.79 | 0.79 | 0.79 | 0.79 | 0.79 |
| Persistence into year 4 | 0.082 | 0.108 | 0.273 | −0.128 | −0.698*** | −0.280** | −0.752 | −1.354 | −0.709 | −0.218 | −0.469* | −0.421** |
| (0.208) | (0.245) | (0.252) | (0.095) | (0.094) | (0.113) | (0.852) | (1.313) | (0.510) | (0.184) | (0.257) | (0.170) | |
| Observation | 1,031 | 1,031 | 1,031 | 1,031 | 1,031 | 1,031 | 1,031 | 1,031 | 1,031 | 1,031 | 1,031 | 1,031 |
| Mean of Dep. Var. | 0.68 | 0.68 | 0.68 | 0.68 | 0.68 | 0.68 | 0.68 | 0.68 | 0.68 | 0.68 | 0.68 | 0.68 |
| Complete MA within 2 years | 0.010 | −0.035 | −0.0192 | 0.002 | −0.125* | −0.061 | −0.096 | −0.128 | 0.064 | 0.019 | 0.028 | 0.010 |
| (0.040) | (0.046) | (0.061) | (0.032) | (0.065) | (0.060) | (0.086) | (0.133) | (0.140) | (0.100) | (0.079) | (0.036) | |
| Observation | 1,364 | 1,364 | 1,364 | 1,364 | 1,364 | 1,364 | 1,364 | 1,364 | 1,364 | 1,364 | 1,364 | 1,364 |
| Mean of Dep. Var. | 0.06 | 0.06 | 0.06 | 0.06 | 0.06 | 0.06 | 0.06 | 0.06 | 0.06 | 0.06 | 0.06 | 0.06 |
| Complete MA within 3 years | −0.067 | −0.137 | −0.088 | 0.075 | −0.065 | 0.099 | −0.252** | −0.300* | −0.060 | −0.005 | 0.034 | 0.095 |
| (0.076) | (0.088) | (0.089) | (0.049) | (0.090) | (0.077) | (0.099) | (0.169) | (0.111) | (0.137) | (0.164) | (0.067) | |
| Observation | 1,031 | 1,031 | 1,031 | 1,031 | 1,031 | 1,031 | 1,031 | 1,031 | 1,031 | 1,031 | 1,031 | 1,031 |
| Mean of Dep. Var. | 0.11 | 0.11 | 0.11 | 0.11 | 0.11 | 0.11 | 0.11 | 0.11 | 0.11 | 0.11 | 0.11 | 0.11 |
| Complete PhD within 4 years | −0.094 | −0.166 | 0.030 | −0.007 | −0.048 | 0.024 | −1.080** | −1.582* | −0.489 | −0.085** | −0.239** | 0.013 |
| (0.097) | (0.119) | (0.142) | (0.044) | (0.050) | (0.057) | (0.532) | (0.819) | (0.308) | (0.042) | (0.096) | (0.044) | |
| Observation | 1,031 | 1,031 | 1,031 | 1,031 | 1,031 | 1,031 | 1,031 | 1,031 | 1,031 | 1,031 | 1,031 | 1,031 |
| Mean of Dep. Var. | 0.05 | 0.05 | 0.05 | 0.05 | 0.05 | 0.05 | 0.05 | 0.05 | 0.05 | 0.05 | 0.05 | 0.05 |
| Complete PhD within 5 years | 0.071 | −0.145 | −0.214 | −0.187** | −0.079 | −0.021 | −0.125 | −0.118 | −0.147 | −0.413*** | ||
| (0.162) | (0.210) | (0.172) | (0.083) | (0.105) | (0.108) | (0.100) | (0.117) | (0.250) | (0.123) | |||
| Observation | 720 | 720 | 720 | 720 | 720 | 720 | 720 | 720 | 720 | 720 | ||
| Mean of Dep. Var. | 0.14 | 0.14 | 0.14 | 0.14 | 0.14 | 0.14 | 0.14 | 0.14 | 0.14 | 0.14 | ||
| Institution x field x country | ✓ | ✓ | ✓ | ✓ | ✓ | ✓ | ✓ | ✓ | ✓ | |||
| Institution x country x year | ✓ | ✓ | ✓ | ✓ | ✓ | ✓ | ✓ | ✓ | ✓ | |||
| Field x country x year | ✓ | ✓ | ✓ | ✓ | ✓ | ✓ | ✓ | ✓ | ✓ | |||
| Institution x field x year | ✓ | ✓ | ✓ | ✓ | ✓ | ✓ | ✓ | ✓ | ✓ | |||
-
Robust standard errors in parentheses. ***p < 0.01, **p < 0.05, *p < 0.1. Note: Each row corresponds to a separate regression outcome where independent variable is the number of same-country peers, categorized into three bins: one peer, two peers, and three or more peers, where the omitted category is zero peer. All regressions control for individual demographics (gender and age at enrollment) and standard errors are clustered at the institution, field, and enrollment year level, alternated between different combinations of fixed effects.
Effect of own-country peer composition Cohort (t) and Cohort (t-1) on educational outcomes.
| (1) | (2) | (3) | (4) | (5) | (6) | |
|---|---|---|---|---|---|---|
| Share of peers | Number of peers | |||||
| 0 < s ≤ 0.15 | 0.15 < s ≤ 0.30 | s > 0.30 | = 1 | = 2 | ≥ 3 | |
| Persistence into year 2 | −0.031 | −0.151*** | −0.108** | −0.052 | −0.087** | −0.147*** |
| (0.039) | (0.038) | (0.042) | (0.038) | (0.039) | (0.050) | |
| Observation | 1,540 | 1,540 | 1,540 | 1,540 | 1,540 | 1,540 |
| Mean of Dep. Var. | 0.90 | 0.90 | 0.90 | 0.90 | 0.90 | 0.90 |
| Persistence into year 3 | −0.018 | −0.054 | −0.164** | 0.009 | −0.145* | −0.083 |
| (0.077) | (0.079) | (0.077) | (0.066) | (0.088) | (0.100) | |
| Observation | 1,198 | 1,198 | 1,198 | 1,198 | 1,198 | 1,198 |
| Mean of Dep. Var. | 0.78 | 0.78 | 0.78 | 0.78 | 0.78 | 0.78 |
| Persistence into year 4 | −0.070 | −0.114 | −0.232 | −0.044 | −0.164 | −0.177 |
| (0.088) | (0.103) | (0.169) | (0.084) | (0.108) | (0.136) | |
| Observation | 860 | 860 | 860 | 860 | 860 | 860 |
| Mean of Dep. Var. | 0.68 | 0.68 | 0.68 | 0.68 | 0.68 | 0.68 |
| Complete MA within 2 years | −0.015 | 0.050* | 0.002 | 0.011 | −0.027 | 0.043 |
| (0.026) | (0.028) | (0.037) | (0.023) | (0.026) | (0.033) | |
| Observation | 1,540 | 1,540 | 1,540 | 1,540 | 1,540 | 1,540 |
| Mean of Dep. Var. | 0.07 | 0.07 | 0.07 | 0.07 | 0.07 | 0.07 |
| Complete MA within 3 years | −0.086 | −0.041 | −0.121* | −0.022 | −0.156** | −0.127* |
| (0.066) | (0.051) | (0.063) | (0.049) | (0.070) | (0.068) | |
| Observation | 1,198 | 1,198 | 1,198 | 1,198 | 1,198 | 1,198 |
| Mean of Dep. Var. | 0.12 | 0.12 | 0.12 | 0.12 | 0.12 | 0.12 |
| Complete PhD within 4 years | 0.008 | −0.055 | −0.165** | −0.014 | 0.017 | −0.133*** |
| (0.053) | (0.039) | (0.075) | (0.051) | (0.058) | (0.048) | |
| Observation | 860 | 860 | 860 | 860 | 860 | 860 |
| Mean of Dep. Var. | 0.05 | 0.05 | 0.05 | 0.05 | 0.05 | 0.05 |
| Complete PhD within 5 years | −0.392** | −0.582*** | 0.533* | −0.430** | −0.395* | −0.731** |
| (0.189) | (0.213) | (0.307) | (0.186) | (0.233) | (0.292) | |
| Observation | 546 | 546 | 546 | 546 | 546 | 546 |
| Mean of Dep. Var. | 0.15 | 0.15 | 0.14 | 0.15 | 0.15 | 0.14 |
-
Robust standard errors in parentheses. ***p < 0.01, **p < 0.05, *p < 0.1. Note: Each row corresponds to a separate regression outcome. All regressions control for individual demographics (gender and age at enrollment) and include institution-by-field-by-country fixed effects, country-by-year fixed effects, institution-by-year fixed effects, and field-by-year fixed effects. Standard errors are clustered at the institution, field, and enrollment year level. Columns (1) to (3) report estimates from a regression where the independent variable is the share of peers from the same country from the contemporaneous and previous year cohort, categorized into three bins: (0 < s ≤ 0.15), (0.15 < s ≤ 0.30), and s > 0.30, where the omitted category is 0, while Columns (4) to (6) report estimates from a regression where the independent variable is the number of same-country peers from the contemporaneous and previous year cohort, categorized into three bins: one peer, two peers, and three or more peers, where the omitted category is zero peer. Because this two-year peer group cannot be constructed for those who enrolled in 2009, the sample size is smaller compared to the sample used in the main analysis.
References
Akcigit, U., J. Grigsby, and T. Nicholas. 2017. “Immigration and the Rise of American Ingenuity.” American Economic Review 107 (5): 327–31, https://doi.org/10.1257/aer.p20171021.Search in Google Scholar
Andrade, M. S. 2006. “International Student Persistence: Integration or Cultural Integrity?” Journal of College Student Retention: Research, Theory & Practice 8 (1): 57–81, https://doi.org/10.2190/9my5-256h-vfva-8r8p.Search in Google Scholar
Andrade, M. S. 2007. “Learning Communities: Examining Positive Outcomes.” Journal of College Student Retention: Research, Theory & Practice 9 (1): 1–20, https://doi.org/10.2190/e132-5x73-681q-k188.Search in Google Scholar
Batalova, J., and E. Israel. 2021. “International Students in the United States.” Migration Policy Institute. Retrieved from https://www.migrationpolicy.org/article/international-students-united-states (accessed October 31, 2025).Search in Google Scholar
Bean, J. P. 1980. “Dropouts and Turnover: The Synthesis and Test of a Causal Model of Student Attrition.” Research in Higher Education 12: 155–87, https://doi.org/10.1007/bf00976194.Search in Google Scholar
Bean, J. P. 1982. “Conceptual Models of Student Attrition: How Theory Can Help the Institutional Researcher.” New Directions for Institutional Research 1982 (36): 17–33, https://doi.org/10.1002/ir.37019823604.Search in Google Scholar
Betts, J. R., and A. Zau. 2004. Peer Groups and Academic Achievement: Panel Evidence from Administrative Data. Unpublished Manuscript.Search in Google Scholar
Bifulco, R., J. M. Fletcher, and S. L. Ross. 2011. “The Effect of Classmate Characteristics on Post-secondary Outcomes: Evidence from the Add Health.” American Economic Journal: Economic Policy 3 (1): 25–53, https://doi.org/10.1257/pol.3.1.25.Search in Google Scholar
Bochner, S., B. M. McLeod, and A. Lin. 1977. “Friendship Patterns of Overseas Students: A Functional Model.” International Journal of Psychology 12 (4): 277–94.10.1080/00207597708247396Search in Google Scholar
Booij, A. S., E. Leuven, and H. Oosterbeek. 2017. “Ability Peer Effects in University: Evidence from a Randomized Experiment.” The Review of Economic Studies 84 (2): 547–78.Search in Google Scholar
Bostwick, V. K., and B. A. Weinberg. 2022. “Nevertheless She Persisted? Gender Peer Effects in Doctoral STEM Programs.” Journal of Labor Economics 40 (2): 397–436, https://doi.org/10.1086/714921.Search in Google Scholar
Brady, R. R., M. A. Insler, and A. S. Rahman. 2017. “Bad Company: Understanding Negative Peer Effects in College Achievement.” European Economic Review 98: 144–68, https://doi.org/10.1016/j.euroecorev.2017.06.013.Search in Google Scholar
Burke, M. A., and T. R. Sass. 2013. “Classroom Peer Effects and Student Achievement.” Journal of Labor Economics 31 (1): 51–82, https://doi.org/10.1086/666653.Search in Google Scholar
Cabrera, A. F., A. Nora, and M. B. Castaneda. 1993. “College Persistence: Structural Equations Modeling Test of an Integrated Model of Student Retention.” The Journal of Higher Education 64 (2): 123–39, https://doi.org/10.2307/2960026.Search in Google Scholar
Canaan, S., A. Deeb, and P. Mouganie. 2022. “Does Religious Diversity Improve Trust and Performance? Evidence from Lebanon.” In IZA Discussion Papers No. 15206. Bonn: IZA – Institute of Labor Economics.10.2139/ssrn.4114779Search in Google Scholar
Carrell, S. E., R. L. Fullerton, and J. E. West. 2009. “Does Your Cohort Matter? Measuring Peer Effects in College Achievement.” Journal of Labor Economics 27 (3): 439–64, https://doi.org/10.1086/600143.Search in Google Scholar
Chen, S., and Z. Hu. 2024. “How Competition Shapes Peer Effects: Evidence from a University in China.” Review of Economics and Statistics 1–27, https://doi.org/10.1162/rest_a_01471.Search in Google Scholar
Dee, T. S. 2004. “Teachers, Race, and Student Achievement in a Randomized Experiment.” Review of Economics and Statistics 86 (1): 195–210, https://doi.org/10.1162/003465304323023750.Search in Google Scholar
Dee, T. S. 2005. “A Teacher like Me: Does Race, Ethnicity, or Gender Matter?” American Economic Review 95 (2): 158–65, https://doi.org/10.1257/000282805774670446.Search in Google Scholar
Edin, P. A., P. Fredriksson, and O. Åslund. 2003. “Ethnic Enclaves and the Economic Success of Immigrants – Evidence from a Natural Experiment.” The Quarterly Journal of Economics 118 (1): 329–57, https://doi.org/10.1162/00335530360535225.Search in Google Scholar
Ehrenberg, R. G., D. D. Goldhaber, and D. J. Brewer. 1995. “Do Teachers’ Race, Gender, and Ethnicity Matter? Evidence from the National Educational Longitudinal Study of 1988.” ILR Review 48 (3): 547–61, https://doi.org/10.2307/2524781.Search in Google Scholar
Fairlie, R. W., F. Hoffmann, and P. Oreopoulos. 2014. “A Community College Instructor like Me: Race and Ethnicity Interactions in the Classroom.” American Economic Review 104 (8): 2567–91, https://doi.org/10.1257/aer.104.8.2567.Search in Google Scholar
Festinger, L. 1957. “Social Comparison Theory.” Selective Exposure Theory 16 (401): 3.Search in Google Scholar
Foster, G. 2006. “It’s Not Your Peers, and It’s Not Your Friends: Some Progress Toward Understanding the Educational Peer Effect Mechanism.” Journal of Public Economics 90 (8–9): 1455–75, https://doi.org/10.1016/j.jpubeco.2005.12.001.Search in Google Scholar
Furnham, A., and N. Alibhai. 1985. “The Friendship Networks of Foreign Students: A Replication and Extension of the Functional Model.” International Journal of Psychology 20 (3–4): 709–22.10.1080/00207598508247565Search in Google Scholar
Garcia, S. M., A. Tor, and T. M. Schiff. 2013. “The Psychology of Competition: A Social Comparison Perspective.” Perspectives on Psychological Science 8 (6): 634–50, https://doi.org/10.1177/1745691613504114.Search in Google Scholar
Gaule, P., and M. Piacentini. 2018. “An Advisor Like Me? Advisor Gender and Post-graduate Careers in Science.” Research Policy 47 (4): 805–13, https://doi.org/10.1016/j.respol.2018.02.011.Search in Google Scholar
Gong, J., Y. Lu, and H. Song. 2018. “The Effect of Teacher Gender on Students’ Academic and Noncognitive Outcomes.” Journal of Labor Economics 36 (3): 743–78, https://doi.org/10.1086/696203.Search in Google Scholar
Griffith, A. L., and K. N. Rask. 2014. “Peer Effects in Higher Education: a Look at Heterogeneous Impacts.” Economics of Education Review 39: 65–77, https://doi.org/10.1016/j.econedurev.2014.01.003.Search in Google Scholar
Hanushek, E. A., J. F. Kain, J. M. Markman, and S. G. Rivkin. 2003. “Does Peer Ability Affect Student Achievement?” Journal of Applied Econometrics 18 (5): 527–44, https://doi.org/10.1002/jae.741.Search in Google Scholar
Hanushek, E. A., J. F. Kain, and S. G. Rivkin. 2009. “New Evidence About Brown v. Board of Education: The Complex Effects of School Racial Composition on Achievement.” Journal of Labor Economics 27 (3): 349–83, https://doi.org/10.1086/600386.Search in Google Scholar
Hendrickson, B., D. Rosen, and R. K. Aune. 2011. “An Analysis of Friendship Networks, Social Connectedness, Homesickness, and Satisfaction Levels of International Students.” International Journal of Intercultural Relations 35 (3): 281–95, https://doi.org/10.1016/j.ijintrel.2010.08.001.Search in Google Scholar
Hilmer, C., and M. Hilmer. 2007. “Women Helping Women, Men Helping Women? Same-gender Mentoring, Initial Job Placements, and Early Career Publishing Success for Economics Ph.D.s.” American Economic Review 97 (2): 422–6, https://doi.org/10.1257/aer.97.2.422.Search in Google Scholar
Hoxby, C. M. 2000. “Peer Effects in the Classroom: Learning from Gender and Race Variation.” In NBIR Working Paper No. 7867. Cambridge, MA: National Bureau of Economic Research.10.3386/w7867Search in Google Scholar
Hoxby, C. M., and G. Weingarth. 2005. ”Taking Race out of the Equation: School Reassignment and the Structure of Peer Effects.” Unpublished senior honor thesis, Harvard University.Search in Google Scholar
Hunt, J., and M. Gauthier-Loiselle. 2010. “How Much Does Immigration Boost Innovation?” American Economic Journal: Macroeconomics 2 (2): 31–56, https://doi.org/10.1257/mac.2.2.31.Search in Google Scholar
Hyun, J., B. Quinn, T. Madon, and S. Lustig. 2007. “Mental Health Need, Awareness, and Use of Counseling Services Among International Graduate Students.” Journal of American College Health 56 (2): 109–18, https://doi.org/10.3200/jach.56.2.109-118.Search in Google Scholar
Kerr, W. R. 2013. US High-skilled Immigration, Innovation, and Entrepreneurship: Empirical Approaches and Evidence (No. w19377). National Bureau of Economic Research.10.3386/w19377Search in Google Scholar
Kerr, W. R., and W. F. Lincoln. 2010. “The Supply Side of Innovation: H-1B Visa Reforms and US Ethnic Invention.” Journal of Labor Economics 28 (3): 473–508, https://doi.org/10.1086/651934.Search in Google Scholar
Kirabo Jackson, C., and H. S. Schneider. 2011. “Do Social Connections Reduce Moral Hazard? Evidence from the New York City Taxi Industry.” American Economic Journal: Applied Economics 3 (3): 244–67, https://doi.org/10.1257/app.3.3.244.Search in Google Scholar
Klopfenstein, K. 2005. “Beyond Test Scores: The Impact of Black Teacher Role Models on Rigorous Math Taking.” Contemporary Economic Policy 23 (3): 416–28, https://doi.org/10.1093/cep/byi031.Search in Google Scholar
Kremer, M., and D. Levy. 2008. “Peer Effects and Alcohol Use Among College Students.” Journal of Economic Perspectives 22 (3): 189–206, https://doi.org/10.1257/jep.22.3.189.Search in Google Scholar
Lindo, J. M., N. J. Sanders, and P. Oreopoulos. 2010. “Ability, Gender, and Performance Standards: Evidence from Academic Probation.” American Economic Journal: Applied Economics 2 (2): 95–117, https://doi.org/10.1257/app.2.2.95.Search in Google Scholar
Loch, C. H., B. A. Huberman, and S. Stout. 2000. “Status Competition and Performance in Work Groups.” Journal of Economic Behavior & Organization 43 (1): 35–55, https://doi.org/10.1016/s0167-2681(00)00107-4.Search in Google Scholar
Mamiseishvili, K. 2012. “International Student Persistence in US Postsecondary Institutions.” Higher Education 64: 1–17, https://doi.org/10.1007/s10734-011-9477-0.Search in Google Scholar
Manski, C. F. 1993. “Identification of Endogenous Social Effects: the Reflection Problem.” The Review of Economic Studies 60 (3): 531–42, https://doi.org/10.2307/2298123.Search in Google Scholar
McPherson, M., L. Smith-Lovin, and J. M. Cook. 2001. “Birds of a Feather: Homophily in Social Networks.” Annual Review of Sociology 27 (1): 415–44, https://doi.org/10.1146/annurev.soc.27.1.415.Search in Google Scholar
Moser, P., A. Voena, and F. Waldinger. 2014. “German Jewish Émigrés and US Invention.” American Economic Review 104 (10): 3222–55, https://doi.org/10.1257/aer.104.10.3222.Search in Google Scholar
National Center for Education Statistics. 2023. Integrated Postsecondary Education Data System Enrollment. Retrieved from https://nces.ed.gov/ipeds/ (accessed October 31, 2025).Search in Google Scholar
National Science Foundation, National Center for Science and Engineering, Statistics. (2024). Doctorate Recipients from U.S. Universities: 2023 (NSF 25-300). Retrieved from https://ncses.nsf.gov/pubs/nsf25300/report/u-s-doctorate-awards (accessed October 31, 2025).Search in Google Scholar
Neumark, D., and R. Gardecki. 1996. Women Helping Women? Role-model and Mentoring Effects on Female Ph. D. Student in Economics.10.3386/w5733Search in Google Scholar
Olivas, M., and C. S. Li. 2006. “Understanding Stressors of International Students in Higher Education: What College Counselors and Personnel Need to Know.” Journal of Instructional Psychology 33 (3): 217–22.Search in Google Scholar
Otterman, S. 2024, December 11. Colleges and International Students: Trump Travel Ban and Its Impact. The New York Times. Retrieved from https://www.nytimes.com/2024/12/11/us/colleges-international-students-trump-travel-ban.html?smid=nytcore-ios-share&referringSource=articleShare (accessed October 31, 2025).Search in Google Scholar
Ou, D. 2010. “To Leave or Not to Leave? A Regression Discontinuity Analysis of the Impact of Failing the High School Exit Exam.” Economics of Education Review 29 (2): 171–86, https://doi.org/10.1016/j.econedurev.2009.06.002.Search in Google Scholar
Pezzoni, M., J. Mairesse, P. Stephan, and J. Lane. 2016. “Gender and the Publication Output of Graduate Students: A Case Study.” PLoS One 11 (1): e0145146, https://doi.org/10.1371/journal.pone.0145146.Search in Google Scholar
Pregaldini, D., S. Balestra, and U. Backes-Gellner. 2022. “Does Ethnic Diversity in Schools Affect Occupational Choices?” In IZA Discussion Papers No. 15780. Bonn: IZA - Institute of Labor Economics.10.2139/ssrn.4297662Search in Google Scholar
Price, J. 2010. “The Effect of Instructor Race and Gender on Student Persistence in STEM Fields.” Economics of Education Review 29 (6): 901–10, https://doi.org/10.1016/j.econedurev.2010.07.009.Search in Google Scholar
Sacerdote, B. 2001. “Peer Effects with Random Assignment: Results for Dartmouth Roommates.” The Quarterly Journal of Economics 116 (2): 681–704, https://doi.org/10.1162/00335530151144131.Search in Google Scholar
Sacerdote, B. 2011. “Peer Effects in Education: How Might They Work, How Big Are They and How Much Do We Know Thus Far?” In Handbook of the Economics of Education, Vol. 3, 249–77. Amsterdam, Netherlands: Elsevier.10.1016/B978-0-444-53429-3.00004-1Search in Google Scholar
Sam, D. L. 2001. “Satisfaction with Life among International Students: an Exploratory Study.” Social Indicators Research 53 (3): 315–37.10.1023/A:1007108614571Search in Google Scholar
Saul, S. January 2, 2018. As Flow of Foreign Students Wanes, U.S. Universities Feel the Sting. The New York Times. Retrieved from https://www.nytimes.com/2018/01/02/us/international-enrollment-drop.html (accessed October 31, 2025).Search in Google Scholar
Shue, K. 2013. “Executive Networks and Firm Policies: Evidence from the Random Assignment of MBA Peers.” The Review of Financial Studies 26 (6): 1401–42, https://doi.org/10.1093/rfs/hht019.Search in Google Scholar
Sowell, R., T. Zhang, N. Bell, and K. Redd. 2008. Ph.D. Completion and Attrition: Analysis of Baseline Demographic Data from the Ph.D. Completion Project, edited by M. F. King, 18–26. Washington, DC: Council of Graduate Schools.Search in Google Scholar
Spady, W. G. 1970. “Dropouts from Higher Education: an Interdisciplinary Review and Synthesis.” Interchange 1 (1): 64–85, https://doi.org/10.1007/bf02214313.Search in Google Scholar
Spady, W. G. 1971. “Dropouts from Higher Education: toward an Empirical Model.” Interchange 2 (3): 38–62, https://doi.org/10.1007/bf02282469.Search in Google Scholar
Stinebrickner, R., and T. R. Stinebrickner. 2006. “What Can Be Learned About Peer Effects Using College Roommates? Evidence from New Survey Data and Students from Disadvantaged Backgrounds.” Journal of Public Economics 90 (8–9): 1435–54, https://doi.org/10.1016/j.jpubeco.2006.03.002.Search in Google Scholar
Tinto, V. 1975. “Dropout from Higher Education: a Theoretical Synthesis of Recent Research.” Review of Educational Research 45 (1): 89–125, https://doi.org/10.3102/00346543045001089.Search in Google Scholar
Tinto, V. 2012. Leaving College: Rethinking the Causes and Cures of Student Attrition. Chicago, USA: University of Chicago Press.Search in Google Scholar
Trice, A. G. 2007. “Faculty Perspectives regarding Graduate International Students’ Isolation from Host National Students.” International Education Journal 8 (1): 108–17.Search in Google Scholar
Vigdor, J., and T. Nechyba. 2007. “Peer Effects in North Carolina Public Schools.” In Schools and the Equal Opportunity Problem, edited by L. Woessmann, and P. Peterson, 73–102. Massachusetts, USA: MIT Press.10.7551/mitpress/6051.003.0008Search in Google Scholar
Wennberg, K., and A. Norgren. 2021. “Models of Peer Effects in Education.” In Stockholm School of Economics, Center for Educational Leadership and Excellence Working Papers (21/3). Stockholm: Center for Educational Leadership and Excellence.Search in Google Scholar
Wood, J. V. 1989. “Theory and Research Concerning Social Comparisons of Personal Attributes.” Psychological Bulletin 106 (2): 231, https://doi.org/10.1037/0033-2909.106.2.231.Search in Google Scholar
Zimmerman, D. J. 2003. “Peer Effects in Academic Outcomes: Evidence from a Natural Experiment.” Review of Economics and Statistics 85 (1): 9–23, https://doi.org/10.1162/003465303762687677.Search in Google Scholar
© 2025 the author(s), published by De Gruyter, Berlin/Boston
This work is licensed under the Creative Commons Attribution 4.0 International License.