Do Female Politicians Lead to Better Learning Outcomes?
-
Sadia Priyanka


Abstract
Despite progress towards universal primary education, children in India lag in age and grade-appropriate learning competencies. This paper studies the effect of women’s political leadership in state legislatures on primary school-aged children’s learning outcomes. I use close elections won by women against men as an instrument for the election of a female politician and find significant gains in math and reading proficiency in children 8–11. Using a rich set of school and household-level data, I evaluate the impact on public and household investments. There is an increased likelihood of public schools receiving grants and inputs beneficial for learning. Further, female politicians lead households to exhibit more confidence in the ability of public schools to provide a better education. Consistent with this perception change, there are reduced time allocation and spending on supplementary household resources. The net positive effect suggests the policy effect outweighs the crowding out of private resources.
Election year and states in the sample.
| States | 2006 | 2007 | 2008 | 2009 | 2010 |
|---|---|---|---|---|---|
| Andhra Pradesh | • | ||||
| Assam | • | ||||
| Bihar | • | ||||
| Gujarat | • | ||||
| Haryana | • | ||||
| Himachal Pradesh | • | ||||
| Karnataka | • | ||||
| Kerala | • | ||||
| Madhya Pradesh | • | ||||
| Maharashtra | • | ||||
| Orissa | • | ||||
| Punjab | • | ||||
| Rajasthan | • | ||||
| Tamil nadu | • | ||||
| West Bengal | • |
-
The black dot represents the election year data included in the sample for each state.
Distribution of proficiency levels.
| Reading levels | Math levels | Writing levels | |||
|---|---|---|---|---|---|
| Cannot read | 8% | Cannot recognize | 12% | Cannot write | 21% |
| Letters | 16% | Numbers | 36% | 1–2 mistakes | 41% |
| Words | 24% | Subtraction | 33% | No mistake | 38% |
| Paragraph | 23% | Division | 19% | ||
| Story | 29% | ||||
-
Weighted using sample weights.
First stage.
| Dependent variable: share of seats won by women in a district (Female MLA) | |
|---|---|
| Linear margins (1) | |
| Share of seats won by women in close elections against men in a district | 1.045*** |
| (Female MLA Close) | (0.104) |
| Share of seats with close elections between women and men in a district | −0.746*** |
| (Total Close) | (0.199) |
| F statistic | 103.3 |
| R square | 0.951 |
| Individual and household controls | Yes |
| State fixed effects | Yes |
| Observations | 1,970 |
-
Robust standard errors clustered at the district level in parentheses. Significance levels ***p < 0.01, **p < 0.05.
Test of identifying assumptions.
| Panel A: personal covariates | |||||
|---|---|---|---|---|---|
| Age (1) | Female (2) | Hindu (3) | Muslim (4) | SCST (5) | |
| Female MLAs | −0.179 | −0.093 | 0.325 | −0.024 | −0.593* |
| (0.515) | (0.316) | (0.389) | (0.344) | (0.359) | |
| Total Close | 0.518 | 0.108 | 0.450 | −0.482 | −0.165 |
| (0.629) | (0.346) | (0.602) | (0.397) | (0.432) | |
| Observations | 1,970 | 1,970 | 1,970 | 1,970 | 1,970 |
| Panel B: Household covariates | |||||
| HH size | Income per | Adult years of | |||
| (1) | capita (2) | education (3) | |||
| Female MLAs | −1.199 | 7,677 | 1.750 | ||
| (1.512) | (28,028) | (4.870) | |||
| Total Close | −0.109 | 5,351 | −1.248 | ||
| (2.130) | (34,011) | (5.192) | |||
| Observations | 1,970 | 1,970 | 1,970 | ||
| Panel C: Probability of women winning elections | |||||
| Female MLAs | |||||
| (Close election-years) (1) | |||||
| Share independent | 0.621* | ||||
| (0.335) | |||||
| Share BJP | −0.176 | ||||
| (0.165) | |||||
| Share Janata | −0.053 | ||||
| (0.175) | |||||
| Share congress | −0.086 | ||||
| (0.171) | |||||
| Share soft left | 0.314 | ||||
| (0.366) | |||||
| Share hard left | −0.307 | ||||
| (0.231) | |||||
| Share regional | 0.262 | ||||
| (0.169) | |||||
| Total seats | 0.0007 | ||||
| (0.001) | |||||
| Total electors | −2.16e-07 | ||||
| (2.22e-07) | |||||
| Total votes cast | 1.02e-07 | ||||
| (3.16e-07) | |||||
| Observations | 1,970 | ||||
-
Estimation applies sample survey weights so that the covariates are representative of the sample. Previous research shows that female MLAs increase primary education attainment (Clots-Figueras 2012), so we expect them to affect children’s years of education. Similarly, MLAs could affect short-term household expenditures. However, the main results are robust to whether we include them as controls or not. Significance levels *** p<0.01, ** p<0.05, * p<0.1.
Gender heterogeneity.
| Reading | Math | |||
|---|---|---|---|---|
| Girls (1) | Boys (2) | Girls (3) | Boys (4) | |
| Female MLAs | 0.347 | 0.592** | 0.650** | 0.708** |
| (0.221) | (0.259) | (0.260) | (0.311) | |
| Observations | 913 | 1,057 | 913 | 1,057 |
| Electoral margins | Linear | Linear | Linear | Linear |
| Individual controls | Yes | Yes | Yes | Yes |
| Household controls | Yes | Yes | Yes | Yes |
| State fixed effect | Yes | Yes | Yes | Yes |
-
Robust clustered standard errors at district level in parentheses. Regressions include share of seats in district with close man-woman elections. Individual child controls include age dummies, gender, religion, caste, and years of education completed. Household controls include household size, expenditure and income per capita, and highest adult years of education. Significance levels ***p < 0.01, **p < 0.05, *p < 0.1.
Accounting for ordinal test scores.
| Test scores | ≥1 (1) | ≥2 (2) | ≥3 (3) | ≥4 (4) |
|---|---|---|---|---|
| Panel A: Reading | ||||
| Female MLAs | 0.330** | 0.310 | 0.382 | 0.370* |
| (0.147) | (0.355) | (0.366) | (0.206) | |
| Observations | 1,970 | 1,970 | 1,970 | 1,970 |
| Panel B: Math | ||||
| Female MLAs | 0.213* | 0.064 | 0.697*** | |
| (0.111) | (0.324) | (0.249) | ||
| Observations | 1,970 | 1,970 | 1,970 | |
| Electoral margins | Linear | Linear | Linear | Linear |
| Individual controls | Yes | Yes | Yes | Yes |
| Household controls | Yes | Yes | Yes | Yes |
| State fixed effect | Yes | Yes | Yes | Yes |
-
Robust clustered standard errors at district level in parentheses. The dependent variable is a dummy variable equal to 1 if the child has mastered at least the skill level corresponding to each score. Regressions include share of seats in district with close man-woman elections. Individual child controls include age dummies, gender, religion, caste, and years of education completed. Household controls include household size, expenditure and income per capita, and highest adult years of education. Significance levels ***p < 0.01, **p < 0.05, *p < 0.1.
OLS and 2SLS estimates (full sample of 8–11 year olds).
| Reading | Math | Writing | ||||
|---|---|---|---|---|---|---|
| OLS (1) | 2SLS (2) | OLS (3) | 2SLS (4) | OLS (5) | 2SLS (6) | |
| Female MLAs | 0.078 | 0.122 | 0.010 | 0.208 | 0.021 | 0.299 |
| (0.108) | (0.220) | (0.078) | (0.248) | (0.105) | (0.388) | |
| Observations | 5,998 | 5,998 | 5,998 | 5,998 | 5,998 | 5,998 |
| Electoral margins | Linear | Linear | Linear | Linear | Linear | Linear |
| Individual controls | Yes | Yes | Yes | Yes | Yes | Yes |
| Household controls | Yes | Yes | Yes | Yes | Yes | Yes |
| State fixed effect | Yes | Yes | Yes | Yes | Yes | Yes |
-
Robust clustered standard errors at district level in parentheses. Full sample of 5998 observations include all children with non-missing test scores (including close and non-close election observations) Regressions include share of seats in district with close man-woman elections. Individual child controls include age dummies, gender, religion, caste, and years of education completed. Household controls include household size, expenditure and income per capita, and highest adult years of education. Significance levels ***p < 0.01, **p < 0.05, *p < 0.1.
Robustness.
| (1) | (2) | (3) | (4) | (5) | (6) | |
|---|---|---|---|---|---|---|
| Female MLAs | 1.195* | 1.393 | 0.973** | 0.714*** | 0.725** | 1.000*** |
| (Close elections) | (0.648) | (0.958) | (0.399) | (0.260) | (0.313) | (0.257) |
| Observations | 1,970 | 1,970 | 1,970 | 1,537 | 1,970 | 1,970 |
| Sample | Average | Continuous | Continuous | Exclusion | Sample | Sample |
| z-score | test score | test score | 8-year old | weights | weights | |
| reading | math | math | reading | math | ||
| Female MLAs | 0.320 | 0.730*** | 0.722*** | 0.920*** | 0.387* | 0.728*** |
| (Close elections) | (0.363) | (0.266) | (0.269) | (0.217) | (0.205) | (0.250) |
| Observations | 1,970 | 1,970 | 1,970 | 1,970 | 1,970 | 1,970 |
| Sample | Quadratic | Quadratic | Political | Political | Reduced | Reduced |
| margins | margins | controls | controls | Form | form | |
| reading | math | reading | math | reading | math | |
| All controls | Yes | Yes | Yes | Yes | Yes | Yes |
| State fixed effect | Yes | Yes | Yes | Yes | Yes | Yes |
-
Robust clustered standard errors at district level in parentheses. Regressions include share of seats in district with close man-woman elections. Individual child controls include age dummies, gender, religion, caste, and years of education completed. Household controls include household size, expenditure and income per capita, and highest adult years of education. Significance levels ***p < 0.01, **p < 0.05, *p < 0.1.
Effect of female MLAs on teachers.
| Received training (1) | Female teacher (2) | Years of education (3) | |
|---|---|---|---|
| Female MLAs | 0.265** | −0.487 | −0.533 |
| (Close elections) | (0.119) | (0.521) | (1.396) |
| Observations | 2,484 | 2,473 | 2,484 |
| Electoral margins | Linear | Linear | Linear |
| State fixed effects | Yes | Yes | Yes |
-
Robust clustered standard errors at district level in parentheses. Regressions include share of seats with close man-woman elections. Significance levels ***p < 0.01, **p < 0.05, *p < 0.1.
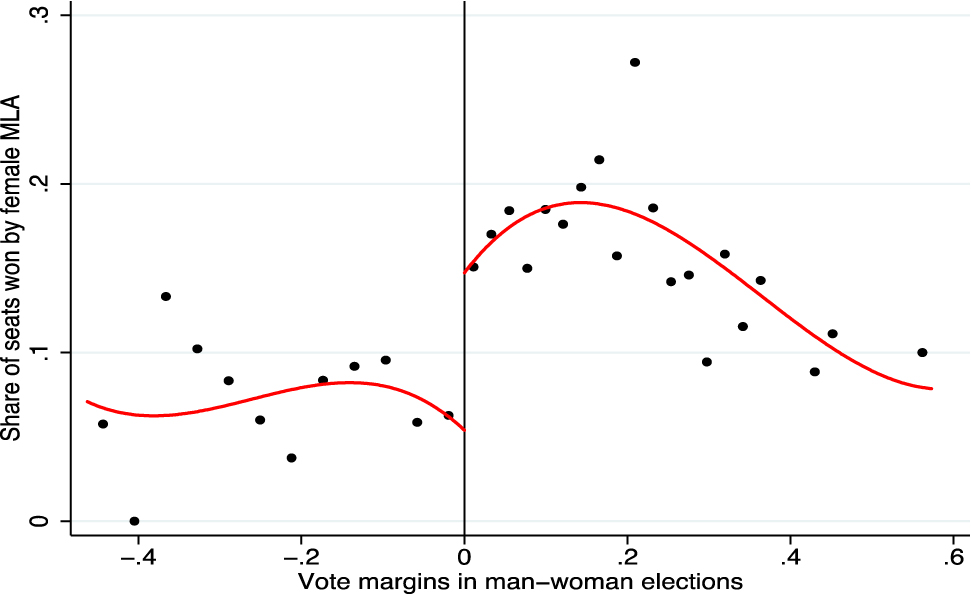
Illustration of first stage estimate.
The figure shows the share of seats won by female MLAs against the vote margins of all man-woman elections in the sample. The plot uses data-driven and evenly spaced bins to mimic the underlying variability of the data.
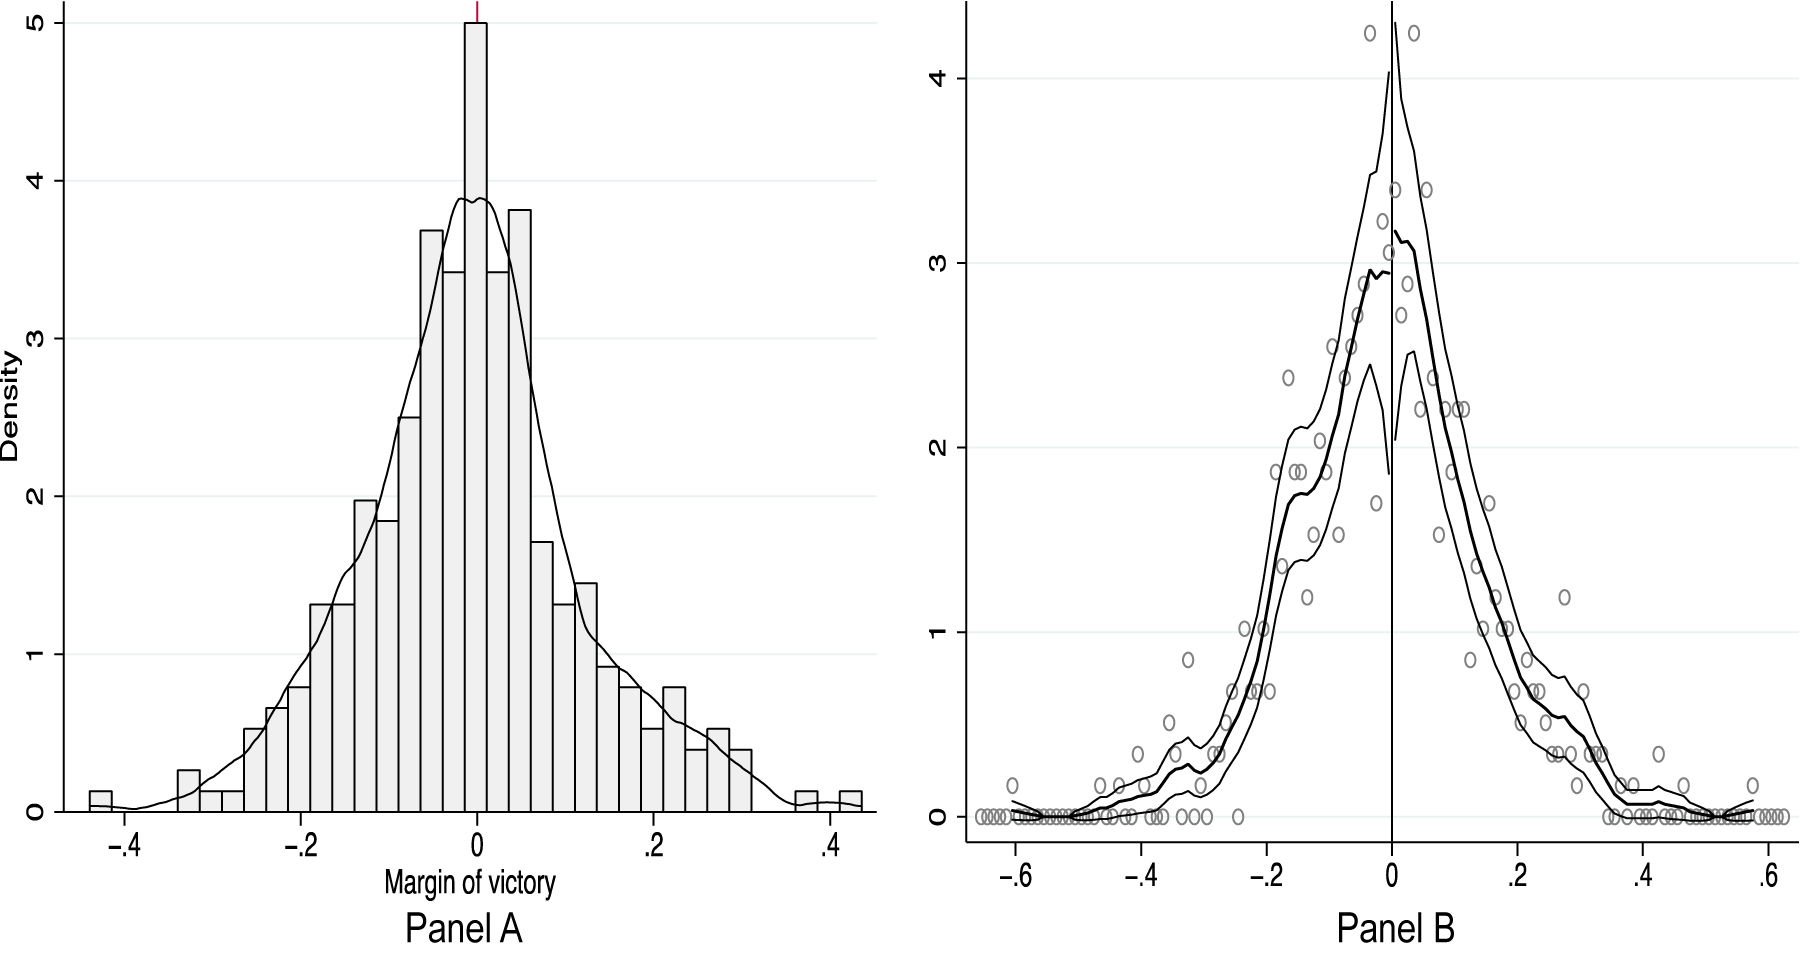
Electoral margins in man-woman elections.
Notes: Panel A plots the distribution of electoral margins in man-woman elections. Panel B depicts the McCrary density test.
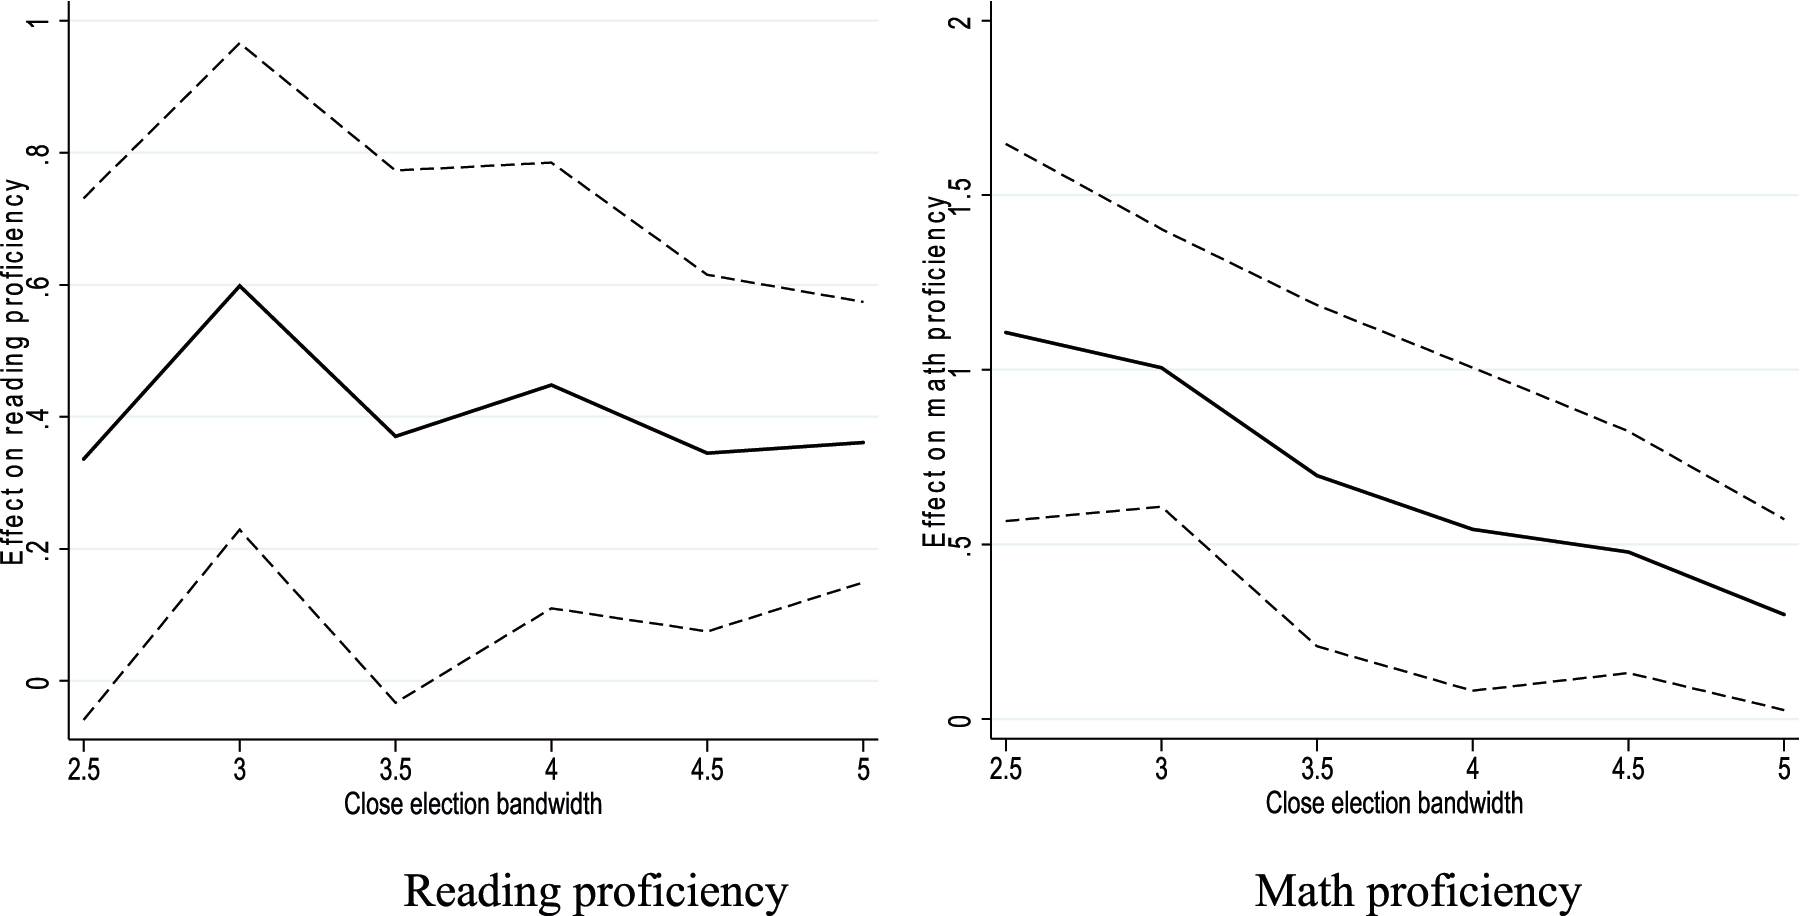
Election margins and test scores.
The graph plots the effect of female MLAs on reading and math proficiency against various close election bandwidths ranging from 2.5 to 5%. The dashed line represents the 95% confidence intervals of the coefficient estimates.
References
Adukia, A. 2017. “Sanitation and Education.” American Economic Journal: Applied Economics 9 (2): 23–59. https://doi.org/10.1198/016214508000000841.Search in Google Scholar
Agarwal, A., N. Agrawal, S. Bhogale, S. Hangal, F. R. Jensenius, M. Kumar, C. Narayan, B. U. Nissa, P. Trivedi, and G. Verniers. 2021. TCPD Indian Elections Data V2. 0. Trivedi Centre for Political Data, Ashoka University.Search in Google Scholar
Anderson, M. L. 2008. “Multiple Inference and Gender Differences in the Effects of Early Intervention: A Reevaluation of the Abecedarian, Perry Preschool, and Early Training Projects.” Journal of the American Statistical Association 103 (484): 1481–95. https://doi.org/10.1198/016214508000000841.Search in Google Scholar
Angrist, J. D., and J. Pischke. 2009. Mostly Harmless Econometrics: An Empiricist’s Companion. Princeton University Press.10.1515/9781400829828Search in Google Scholar
ASER. 2012. “Annual Status of Education Report 2012.” New Delhi: Pratham.Search in Google Scholar
ASER. 2017. “Annual Status of Education Report 2017.” New Delhi: Pratham.Search in Google Scholar
Asher, S., and P. Novosad. 2017. “Politics and Local Economic Growth: Evidence from India.” American Economic Journal: Applied Economics 9 (1): 229–73. https://doi.org/10.1257/app.20150512.Search in Google Scholar
Azam, M. 2016. “Private Tutoring: Evidence from India.” Review of Development Economics 20 (4): 739–61, https://doi.org/10.1111/rode.12196.Search in Google Scholar
Bagues, M., and P. Campa. 2021. “Can Gender Quotas in Candidate Lists Empower Women? Evidence from a Regression Discontinuity Design.” Journal of Public Economics 194: 104315 https://doi.org/10.1016/j.jpubeco.2020.104315.Search in Google Scholar
Banerjee, A. V., S. Cole, E. Duflo, and L. Linden. 2007. “Remedying Education: Evidence from Two Randomized Experiments in India.” The Quarterly Journal of Economics 122 (3): 1235–64. https://doi.org/10.1162/qjec.122.3.1235.Search in Google Scholar
Baron, E. J. 2022. “School Spending and Student Outcomes: Evidence from Revenue Limit Elections in Wisconsin.” American Economic Journal: Economic Policy 14 (1): 1–39. https://doi.org/10.1257/pol.20200226.Search in Google Scholar
Baskaran, T., and Z. Hessami. 2018. “Does the Election of a Female Leader Clear the Way for More Women in Politics?” American Economic Journal: Economic Policy 10 (3): 95–121. https://doi.org/10.1257/pol.20170045.Search in Google Scholar
Bhalotra, S., and I. Clots-Figueras. 2014. “Health and the Political Agency of Women.” American Economic Journal: Economic Policy 6 (2): 164–97. https://doi.org/10.1257/pol.6.2.164.Search in Google Scholar
Beaman, L., R. Chattopadhyay, E. Duflo, R. Pande, and P. Topalova. 2009. “Powerful Women: Does Exposure Reduce Bias?” The Quarterly Journal of Economics 124 (4): 1497–540. https://doi.org/10.1162/qjec.2009.124.4.1497.Search in Google Scholar
Beaman, L., E. Duflo, R. Pande, and P. Topalova. 2012. “Female Leadership Raises Aspirations and Educational Attainment for Girls: A Policy Experiment in India.” Science 335 (6068): 582–6. https://doi.org/10.1126/science.1212382.Search in Google Scholar
Besley, T., and S. Coate. 1997. “An Economic Model of Representative Democracy.” The Quarterly Journal of Economics 112 (1): 85–114. https://doi.org/10.1162/003355397555136.Search in Google Scholar
Bhalotra, S., I. Clots-Figueras, G. Cassan, and L. Iyer. 2014. “Religion, Politician Identity and Development Outcomes: Evidence from India.” Journal of Economic Behavior & Organization 104: 4–17. https://doi.org/10.1016/j.jebo.2013.09.006.Search in Google Scholar
Carozzi, F., and A. Gago. 2020. Do Female Leaders Promote Gender-Sensitive Policies. Mimeo.Search in Google Scholar
Casarico, A., S. Lattanzio, and P. Profeta. 2022. “Women and Local Public Finance.” European Journal of Political Economy 72: 102096. https://doi.org/10.1016/j.ejpoleco.2021.102096.Search in Google Scholar
Case, A., and A. Deaton. 1999. “School Inputs and Educational Outcomes in South Africa.” The Quarterly Journal of Economics 114 (3): 1047–84. https://doi.org/10.1162/003355399556124.Search in Google Scholar
Case, A., and C. Paxson. 2008. “Height, Health, and Cognitive Function at Older Ages.” American Economic Review 98 (2): 463–7. https://doi.org/10.1257/aer.98.2.463.Search in Google Scholar
Chakraborty, T., and R. Jayaraman. 2019. “School Feeding and Learning Achievement: Evidence from India’s Midday Meal Program.” Journal of Development Economics 139: 249–65. https://doi.org/10.1016/j.jdeveco.2018.10.011.Search in Google Scholar
Chatterjee, I., I. Li, and M. C. Robitaille. 2018. “An Overview of India’s Primary School Education Policies and Outcomes 2005–2011.” World Development 106: 99–110. https://doi.org/10.1016/j.worlddev.2018.01.016.Search in Google Scholar
Chattopadhyay, R., and E. Duflo. 2004. “Women as Policy Makers: Evidence from a Randomized Policy Experiment in India.” Econometrica 72 (5): 1409–43. https://doi.org/10.1111/j.1468-0262.2004.00539.x.Search in Google Scholar
Clots-Figueras, I. 2011. “Women in Politics: Evidence from the Indian States.” Journal of Public Economics 95 (7–8): 664–90. https://doi.org/10.1016/j.jpubeco.2010.11.017.Search in Google Scholar
Clots-Figueras, I. 2012. “Are Female Leaders Good for Education?” American Economic Journal: Applied Economics 4 (1): 212–44. https://doi.org/10.1257/app.4.1.212.Search in Google Scholar
Currie, J., and D. Almond. 2011. “Human Capital Development before Age Five.” In Handbook of Labor Economics, Vol. 4, 1315–486. Elsevier.10.1016/S0169-7218(11)02413-0Search in Google Scholar
Currie, J., and T. Vogl. 2013. “Early-Life Health and Adult Circumstance in Developing Countries.” Annual Review of Economics 5 (1): 1–36. https://doi.org/10.1146/annurev-economics-081412-103704.Search in Google Scholar
Das, J., S. Dercon, J. Habyarimana, P. Krishnan, K. Muralidharan, and V. Sundararaman. 2013. “School Inputs, Household Substitution, and Test Scores.” American Economic Journal: Applied Economics 5 (2): 29–57. https://doi.org/10.1257/app.5.2.29.Search in Google Scholar
Desai, S., and R. Vanneman. 2018. India Human Development Survey-II (IHDS-II), 2011-12. Inter-University Consortium for Political and Social Research. https://doi.org/10.3886/ICPSR36151.v6.Search in Google Scholar
Duflo, E., and P. Topalova. 2004. Unappreciated Service: Performance, Perceptions, and Women Leaders in India. Department of Economics, Massachusetts Institute of Technology.Search in Google Scholar
Eggers, A. C., A. Fowler, J. Hainmueller, A. B. Hall, and J. M. SnyderJr. 2015. “On the Validity of the Regression Discontinuity Design for Estimating Electoral Effects: New Evidence from over 40,000 Close Races.” American Journal of Political Science 59 (1): 259–74. https://doi.org/10.1111/ajps.12127.Search in Google Scholar
Fagernäs, S., and P. Pelkonen. 2020. “Teachers, Electoral Cycles, and Learning in India.” Journal of Human Resources 55 (2): 699–732. https://doi.org/10.3368/jhr.55.3.0816-8100r.Search in Google Scholar
Ferreira, F., and J. Gyourko. 2014. “Does Gender Matter for Political Leadership? the Case of US Mayors.” Journal of Public Economics 112: 24–39. https://doi.org/10.1016/j.jpubeco.2014.01.006.Search in Google Scholar
Gangadharan, L., T. Jain, P. Maitra, and V. Joseph. 2016. “Social Identity and Governance: The Behavioral Response to Female Leaders.” European Economic Review 90: 302–25. https://doi.org/10.1016/j.euroecorev.2016.01.003.Search in Google Scholar
Gelman, A., and G. Imbens. 2019. “Why High-Order Polynomials Should Not Be Used in Regression Discontinuity Designs.” Journal of Business & Economic Statistics 37 (3): 447–56, https://doi.org/10.1080/07350015.2017.1366909.Search in Google Scholar
Glewwe, P. 2002. “Schools and Skills in Developing Countries: Education Policies and Socioeconomic Outcomes.” Journal of Economic Literature 40 (2): 436–82. https://doi.org/10.1257/jel.40.2.436.Search in Google Scholar
Glewwe, P., and K. Muralidharan. 2016. “Improving Education Outcomes in Developing Countries: Evidence, Knowledge Gaps, and Policy Implications.” In Handbook of the Economics of Education, Vol. 5, 653–743. Elsevier.10.1016/B978-0-444-63459-7.00010-5Search in Google Scholar
Glewwe, P., H. G. Jacoby, and E. M. King. 2001. “Early Childhood Nutrition and Academic Achievement: A Longitudinal Analysis.” Journal of Public Economics 81 (3): 345–68. https://doi.org/10.1016/s0047-2727(00)00118-3.Search in Google Scholar
Glewwe, P., M. Kremer, and S. Moulin. 2009. “Many Children Left behind? Textbooks and Test Scores in Kenya.” American Economic Journal: Applied Economics 1 (1): 112–35. https://doi.org/10.1257/app.1.1.112.Search in Google Scholar
Grantham-McGregor, S., Y. B. Cheung, S. Cueto, P. Glewwe, L. Richter, B. Strupp, and International Child Development Steering Group, and others. 2007. “Developmental Potential in the First 5 Years for Children in Developing Countries.” The Lancet 369 (9555): 60–70. https://doi.org/10.1016/s0140-6736(07)60032-4.Search in Google Scholar
Guven, C., and W. S. Lee. 2015. “Height, Aging and Cognitive Abilities across Europe.” Economics & Human Biology 16: 16–29. https://doi.org/10.1016/j.ehb.2013.12.005.Search in Google Scholar
Hanushek, E. A. 1992. “The Trade-Off between Child Quantity and Quality.” Journal of Political Economy 100 (1): 84–117. https://doi.org/10.1086/261808.Search in Google Scholar
Hanushek, E. A. 2003. “The Failure of Input-Based Schooling Policies.” The Economic Journal 113 (485): F64–F98. https://doi.org/10.1111/1468-0297.00099.Search in Google Scholar
Hanushek, E. A. 2006. “Chapter 14 School Resources.” In Handbook of the Economics of Education Welch, edited by E. Hanushek, and F. B. T. Welch, Vol. 2, 865–908. Elsevier.10.1016/S1574-0692(06)02014-9Search in Google Scholar
Hanushek, E. A. 2008. “Education Production Functions.” The New Palgrave Dictionary of Economics 1–8: 1645–8.10.1057/978-1-349-95121-5_1930-1Search in Google Scholar
Hanushek, E. A., and L. Woessmann. 2008. “The Role of Cognitive Skills in Economic Development.” Journal of Economic Literature 46 (3): 607–68. https://doi.org/10.1257/jel.46.3.607.Search in Google Scholar
Hanushek, E. A., and L. Woessmann. 2011. “The Economics of International Differences in Educational Achievement.” In Handbook of the Economics of Education, 3, 89–200. Elsevier.10.3386/w15949Search in Google Scholar
Hanushek, E. A., V. Lavy, and K. Hitomi. 2008. “Do Students Care about School Quality? Determinants of Dropout Behavior in Developing Countries.” Journal of Human Capital 2 (1): 69–105. https://doi.org/10.1086/529446.Search in Google Scholar
Heckman, J. J., J. Stixrud, and S. Urzua. 2006. “The Effects of Cognitive and Noncognitive Abilities on Labor Market Outcomes and Social Behavior.” Journal of Labor Economics 24 (3): 411–82. https://doi.org/10.1086/504455.Search in Google Scholar
Hessami, Z., and M. L. d Fonseca. 2020. “Female Political Representation and Substantive Effects on Policies: A Literature Review.” European Journal of Political Economy 63: 101896. https://doi.org/10.1016/j.ejpoleco.2020.101896.Search in Google Scholar
Heyneman, S. P., and W. A. Loxley. 1983. “The Effect of Primary-School Quality on Academic Achievement across Twenty-Nine High-And Low-Income Countries.” American Journal of Sociology 88 (6): 1162–94. https://doi.org/10.1086/227799.Search in Google Scholar
Holmlund, H., S. McNally, and M. Viarengo. 2010. “Does Money Matter for Schools?” Economics of Education Review 29 (6): 1154–64. https://doi.org/10.1016/j.econedurev.2010.06.008.Search in Google Scholar
Houtenville, A. J., and K. S. Conway. 2008. “Parental Effort, School Resources, and Student Achievement.” Journal of Human Resources 43 (2): 437–53. https://doi.org/10.1353/jhr.2008.0027.Search in Google Scholar
Huang, W., X. Lei, G. Ridder, J. Strauss, and Y. Zhao. 2013. “Health, Height, Height Shrinkage, and SES at Older Ages: Evidence from China.” American Economic Journal: Applied Economics 5 (2): 86–121. https://doi.org/10.1257/app.5.2.86.Search in Google Scholar
Hyman, J. 2017. “Does Money Matter in the Long Run? Effects of School Spending on Educational Attainment.” American Economic Journal: Economic Policy 9 (4): 256–80. https://doi.org/10.1257/pol.20150249.Search in Google Scholar
Jackson, C. K. 2018. Does School Spending Matter? the New Literature on an Old Question. National Bureau of Economic Research.10.3386/w25368Search in Google Scholar
Jacoby, H. G. 2002. “Is There an Intrahousehold ‘Flypaper Effect’? Evidence from a School Feeding Programme.” The Economic Journal 112 (476): 196–221. https://doi.org/10.1111/1468-0297.0j679.Search in Google Scholar
Jensenius, F. R. 2013. Power, Performance and Bias: Evaluating the Electoral Quotas for Scheduled Castes in India. Berkeley: UC.Search in Google Scholar
Khemani, S. 2004. “Political Cycles in a Developing Economy: Effect of Elections in the Indian States.” Journal of Development Economics 73 (1): 125–54. https://doi.org/10.1016/j.jdeveco.2003.01.002.Search in Google Scholar
Kim, H.-K. 2001. “Is There a Crowding-Out Effect between School Expenditure and Mother’s Child Care Time?” Economics of Education Review 20 (1): 71–80. https://doi.org/10.1016/s0272-7757(99)00038-2.Search in Google Scholar
Lahoti, R., and S. Sahoo. 2020. “Are Educated Leaders Good for Education? Evidence from India.” Journal of Economic Behavior & Organization 176: 42–62. https://doi.org/10.1016/j.jebo.2020.03.026.Search in Google Scholar
Macours, K., and R. Vakis. 2014. “Changing Households’ Investment Behaviour through Social Interactions with Local Leaders: Evidence from a Randomised Transfer Programme.” The Economic Journal 124 (576): 607–33. https://doi.org/10.1111/ecoj.12145.Search in Google Scholar
Maurer, J. 2010. “Height, Education and Later-Life Cognition in Latin America and the Caribbean.” Economics & Human Biology 8 (2): 168–76. https://doi.org/10.1016/j.ehb.2010.05.013.Search in Google Scholar
Mbiti, I., K. Muralidharan, M. Romero, Y. Schipper, C. Manda, and R. Rajani. 2019. “Inputs, Incentives, and Complementarities in Education: Experimental Evidence from Tanzania.” The Quarterly Journal of Economics 134 (3): 1627–73. https://doi.org/10.1093/qje/qjz010.Search in Google Scholar
Muralidharan, K., and V. Sundararaman. 2011. “Teacher Performance Pay: Experimental Evidence from India.” Journal of Political Economy 119 (1): 39–77. https://doi.org/10.1086/659655.Search in Google Scholar
O’Connell, S. D. 2018. “Political Inclusion and Educational Investment: Estimates from a National Policy Experiment in India.” Journal of Development Economics 135: 478–87. https://doi.org/10.1016/j.jdeveco.2018.08.004.Search in Google Scholar
Olea, J. L. M., and C. Pflueger. 2013. “A Robust Test for Weak Instruments.” Journal of Business & Economic Statistics 31 (3): 358–69. https://doi.org/10.1080/00401706.2013.806694.Search in Google Scholar
Osborne, M. J., and A. Slivinski. 1996. “A Model of Political Competition with Citizen-Candidates.” The Quarterly Journal of Economics 111 (1): 65–96. https://doi.org/10.2307/2946658.Search in Google Scholar
Paola, M. D., V. Scoppa, and R. Lombardo. 2010. “Can Gender Quotas Break Down Negative Stereotypes? Evidence from Changes in Electoral Rules.” Journal of Public Economics 94 (5–6): 344–53. https://doi.org/10.1016/j.jpubeco.2010.02.004.Search in Google Scholar
Pathak, Y., and K. Macours. 2017. “Women’s Political Reservation, Early Childhood Development, and Learning in India.” Economic Development and Cultural Change 65 (4): 741–66. https://doi.org/10.1086/692114.Search in Google Scholar
Priyanka, S. 2022. “Effect of Female Politicians on Post-Primary Education and Intergenerational Education Spending.” Forthcoming, Journal of Human Capital. https://doi.org/10.1086/721616.Search in Google Scholar
Shah, M., and B. Steinberg. 2019. “The Right to Education Act: Trends in Enrollment, Test Scores, and School Quality.” 109, 232–8. AEA Papers and Proceedings. https://doi.org/10.1257/pandp.20191060.Search in Google Scholar
Spears, D. 2012. “Height and Cognitive Achievement Among Indian Children.” Economics & Human Biology 10 (2): 210–9. https://doi.org/10.1016/j.ehb.2011.08.005.Search in Google Scholar
Stock, J. H., and M. Yogo. 2005. “Testing for Weak Instruments in Linear IV Regression.” In Identification and Inference for Econometric Models: Essays in Honor of Thomas Rothenberg, 80–108. New York: Cambridge University Press.10.3386/t0284Search in Google Scholar
Sulaiman, M. 2012. “Does the Labor Market Reward Easy Certificates? Evidence from Bangladesh.” Journal of Human Capital 6 (4): 336–67. https://doi.org/10.1086/669140.Search in Google Scholar
Svaleryd, H. 2009. “Women’s Representation and Public Spending.” European Journal of Political Economy 25 (2): 186–98. https://doi.org/10.1016/j.ejpoleco.2008.12.004.Search in Google Scholar
Todd, J. E., and P. Winters. 2011. “The Effect of Early Interventions in Health and Nutrition on On-Time School Enrollment: Evidence from the Oportunidades Program in Rural Mexico.” Economic Development and Cultural Change 59 (3): 549–81. https://doi.org/10.1086/658347.Search in Google Scholar
Uppal, Y. 2009. “The Disadvantaged Incumbents: Estimating Incumbency Effects in Indian State Legislatures.” Public Choice 138 (1–2): 9–27. https://doi.org/10.1007/s11127-008-9336-4.Search in Google Scholar
Vogl, T. S. 2014. “Height, Skills, and Labor Market Outcomes in Mexico.” Journal of Development Economics 107: 84–96. https://doi.org/10.1016/j.jdeveco.2013.11.007.Search in Google Scholar
Yao, Y., and W. You. 2018. Women’s Political Participation and Gender Gaps of Education in China: 1950–1990, Vol. 106, 220–37. World Development.10.1016/j.worlddev.2018.01.004Search in Google Scholar
© 2022 Walter de Gruyter GmbH, Berlin/Boston
Articles in the same Issue
- Frontmatter
- Research Articles
- Default Behavior and Risk Aversion in Defined Contribution Retirement Systems: Evidence from Chile
- Linking Employment and Death: Measuring the Structural Disparity in COVID-19 Deaths for Non-telework Essential Workers
- Estimating the Effect of Distance on the Migration of Higher Education Candidates
- Do Female Politicians Lead to Better Learning Outcomes?
- Understanding Household Consumption Behaviour: What do we Learn from a Developing Country?
- Learning with Differing-Ability Peers: Evidence from a Natural Experiment in South Korea
- Is Bilingual Education Desirable in Multilingual countries?
- Letter
- Is the Non-disclosure Policy of Audit Intensity Always Effective? A Theoretical Exploration