The Wage Response to a Reduction in Income Tax Rates: The Israeli Tax Reform
-
Roni Frish

 ,
Noam Zussman
,
Noam Zussman

Abstract
This study examines the effect of an income tax reform on wages. An Israeli reform implemented in 2003–2009 reduced individuals’ marginal income tax rate by 7–17 percentage points. We utilized the differential and non-monotonic marginal tax rate reduction, and used Israel Tax Authority panel data of wage earners, merged with Labor Force Surveys. We found that in the business sector, the elasticity of reported gross wages relative to the net-of-tax rate is about 0.1. The wage earners in the lowest wage quintile were not affected by the tax reform, those in the second and third quintiles did not respond to the tax cut, but elasticity increased with wage, reaching about 0.4 in the upper decile. We did not find statistically significant differences in elasticity by gender, ethnicity, or education.
Appendix
Outline of reduction in income tax rates according to the recommendations published by the committee for tax reform in 2002.
| Brackets (in monthly NIS in 2002 prices) | The proportion of the average monthly wage in the economy in 2002 (percentages) | Income tax rates (percentages) |
The change in income tax rates (percentage points) |
|||
|---|---|---|---|---|---|---|
| 2002 | 2003 | 2005 | 2008 | 2008 Compared with 2002 | ||
| 0–1,970 | 0–28 | 10 | 10 | 10 | 10 | 0 |
| 1,971–3,950 | 28–56 | 20 | 19 | 19 | 17 | −3 |
| 3,951–4,900 | 56–70 | 30 | 26 | 26 | 26 | −4 |
| 4,901–10,400 | 70–148 | 30 | 28 | 27 | 26 | −4 |
| 10,401–10,590 | 148–151 | 45 | 28 | 27 | 26 | −19 |
| 10,591–18,840 | 151–268 | 45 | 45 | 41 | 34 | −11 |
| 18,841–30,000 | 268–427 | 50 | 50 | 47 | 37 | −13 |
| 30,001–34,820 | 427–496 | 50 | 50 | 47 | 39 | −11 |
| Over 34,820 | Over 496 | 50 | 50 | 50 | 49 | −1 |
-
Source: Income Tax Reform: Recommendations of the Committee for Tax Reform, Table 4; Central Bureau of Statistics; and analyses by the authors.
Characteristics of the study population by gender, 1998–2010.
| Average |
Standard deviation |
||||||
|---|---|---|---|---|---|---|---|
| All | Men | Women | All | Men | Women | ||
| Men1 (rate, percentages) | 61.0 | 48.8 | |||||
| Age (years) | 42.1 | 42.9 | 40.8 | 8.2 | 8.6 | 7.3 | |
| Jews1 (rate, percentages) | 88.6 | 86.5 | 91.9 | 31.7 | 34.2 | 27.2 | |
| Well-educated1,2 (rate, percentages) | 29.9 | 29.7 | 30.1 | 45.8 | 45.7 | 45.9 | |
| Married3 (rate, percentages) | 79.6 | 83.6 | 73.1 | 40.3 | 37.0 | 44.3 | |
| Number of children4 (under 18) | 1.55 | 1.56 | 1.52 | 1.49 | 1.53 | 1.44 | |
| Employment rate (percentages) | 77.9 | 80.2 | 74.3 | 41.5 | 39.8 | 43.7 | |
| Yearly wages5 (NIS, 2010 prices) | 135,810 | 162,577 | 91,010 | 208,785 | 249,323 | 96,455 | |
| Distribution of economic branches6 (percentages) | Agriculture | 2.2 | 2.3 | 2.0 | |||
| Low-tech industries | 10.9 | 14.3 | 7.3 | ||||
| High-tech industries | 4.0 | 5.7 | 2.2 | ||||
| Electricity and water | 0.8 | 1.3 | 0.3 | ||||
| Construction | 5.4 | 8.9 | 1.6 | ||||
| Wholesale and retail trade | 12.9 | 14.5 | 11.2 | ||||
| Accommodation and food services | 2.7 | 2.9 | 2.4 | ||||
| Transportation, storage, and mail | 4.5 | 6.3 | 2.6 | ||||
| Communications | 1.0 | 1.2 | 0.8 | ||||
| Banking, insurance, and other financial institutions | 3.6 | 2.8 | 4.5 | ||||
| Computer services and R&D | 4.3 | 5.6 | 2.9 | ||||
| Real estate and miscellaneous business services | 13.2 | 14.9 | 11.5 | ||||
| “Private” community and social services and miscellaneous personal services | 1.9 | 1.8 | 2.6 | ||||
| Foreign organizations and state agencies | 0.0 | 0.0 | 0.0 | ||||
| Public sector | 32.6 | 17.5 | 48.1 | ||||
| Distribution of residential district (percentages) | Jerusalem | 6.5 | |||||
| North | 16.9 | ||||||
| Haifa | 12.8 | ||||||
| Center | 27.2 | ||||||
| Tel Aviv | 19.6 | ||||||
| South | 13.6 | ||||||
| Judea and Samaria | 3.4 | ||||||
-
Source: Israel Tax Authority – employee-employer files; Central Bureau of Statistics – Labor Force Surveys and Population Registry; and analyses by the authors.
-
(1) Based on the Labor Force Surveys. The other explanatory variables rely on the employee-employer files and the Population Registry.
-
(2) The most recent school or academic institution.
-
(3) The proportion calculated among taxpayers whose family status is known.
-
(4) Employees during at least 1 month of the year (this definition is equivalent to a positive wage during the year).
-
(5) Those who had a positive wage during the year.
-
(6) The following is the division into economic branches in the business sector (according to the uniform classification of the economic branches, 1993): agriculture (0); low-tech industries (10–29, 36–39); high-tech industries (30–35); electricity and water (40–41); construction (45–46); wholesale and retail trade (50–53); accommodation and food services (55–56); transportation, storage, and mail (60–65); communications (66); banking, insurance, and other financial institutions (67–68); computer and R&D services (72–73); real estate and other business services (70, 71, 74, 75, 76); “private” community and social services and other personal services (94–97); foreign organizations and entities (99). The public sector: public administration (77–79), education (80); health services (85), welfare and nursing services (86), “public” community and social services (90–93).
Elasticity of gross annual wages relative to the net-of-tax rate by sector1 (positive gross annual wages in the earlier and later years).
| All2 | Business sector | Public sector3 | ||
|---|---|---|---|---|
| Non-weighted | With virtual income | 0.016 | 0.039** | −0.030* |
| (0.012) | (0.015) | (0.017) | ||
| Without virtual income | −0.011 | 0.004 | −0.040** | |
| (0.011) | (0.014) | (0.016) | ||
| Weighted4 | 0.066*** | 0.072*** | −0.009 | |
| (0.013) | (0.016) | (0.018) | ||
-
Source: Israel Tax Authority – employee-employer files; Central Bureau of Statistics – Labor Force Surveys and Population Registry; and analyses by the authors.
-
*, **, *** Significant at a level of 10 %, 5 %, and 1 %, respectively. The standard deviations (clustered by taxpayer) are displayed in parentheses. All of the estimations include the explanatory variables appearing in Table 1.
-
(1) The dummy variables for the deciles are based on the wage deciles of wage earners in the business and public sectors together.
The results for the business sector are very similar to the results in Table 1 (the positive wage columns), but are not identical to them, because the deciles there are based only on the business sector.
-
(2) The estimations include a dummy variable for the public sector.
-
(3) The main branches included in the public sector (according to the uniform classification of the economic branches, 1993): public administration (77–79); education (80); health services (85); welfare and nursing services (86); and “public” community and social services (90–93).
-
(4) Weighted according to the wage in the earlier year.
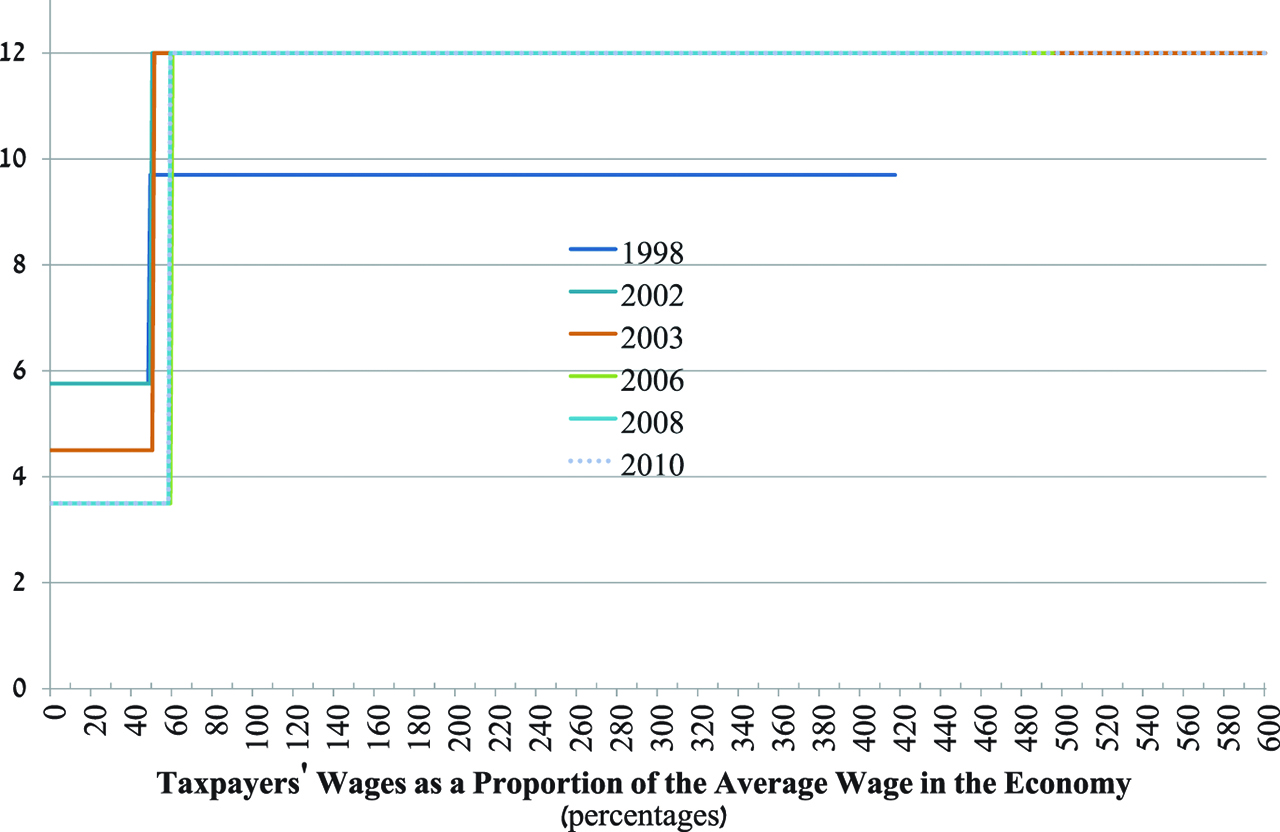
National insurance institute fees plus health tax rates,1 1998–20102 (percentages).
Source: Israel Tax Authority, Central Bureau of Statistics, and analyses by the authors.
(1) The rates applying to wage earners whose ages vary between 18 and retirement age.
(2) Between July 2002 and June 2003, the ceiling on income subject to National Insurance Institute fees was canceled, and the figure reflects this. In August 2008, the ceiling was raised to 10 times the average wage.
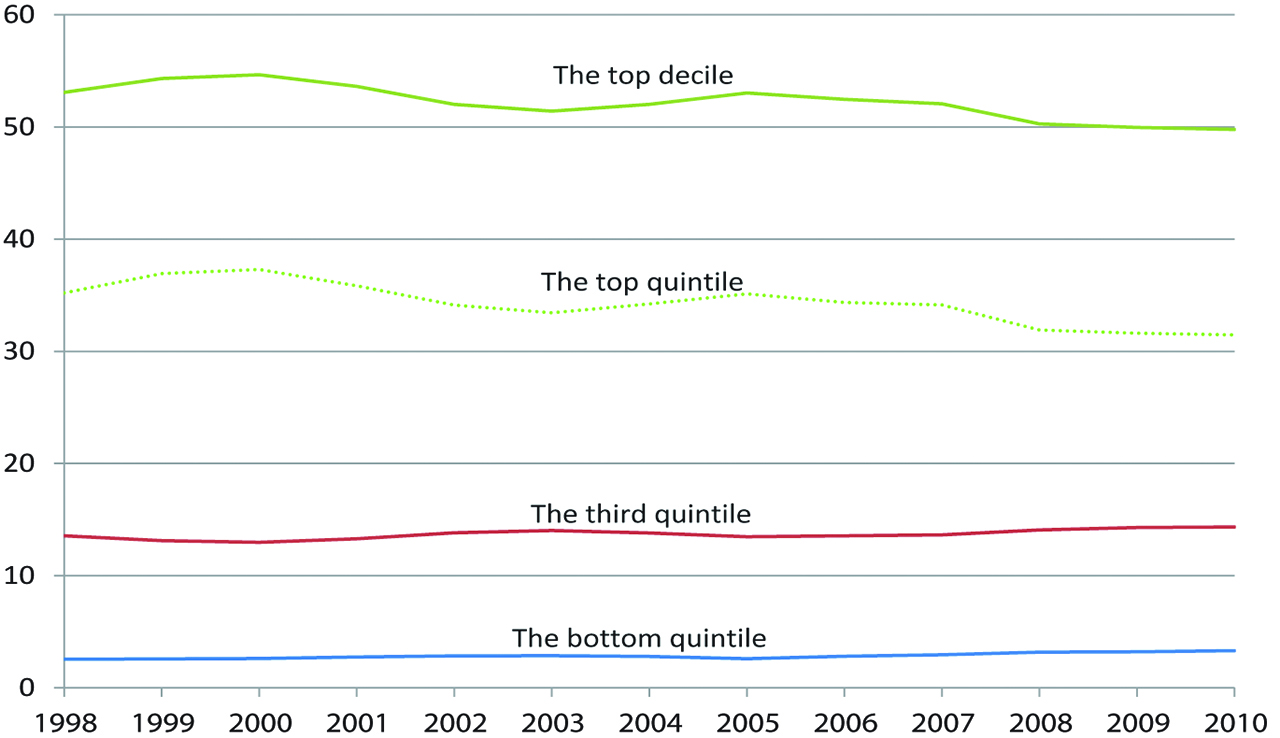
The share of selected quintiles in reported gross annual wages,1 1998–2010 (percentages).
Source: Israel Tax Authority – employee-employer files; and analyses by the authors.
(1) From all jobs held by the taxpayer. Taxpayers belonging to the study population (including taxpayers in the top three thousandths).
References
Auten, G., and R. Carroll. 1999. “The Effect of Income Taxes on Household Income.” Review of Economics and Statistics 81 (4): 681–93.10.1162/003465399558409Search in Google Scholar
Blomquist, S., and H. Selin. 2010. “Hourly Wage Rate and Taxable Labor Income Responsiveness to Changes in Marginal Tax Rates.” Journal of Public Economics 94 (11): 878–89.10.1016/j.jpubeco.2010.08.001Search in Google Scholar
Burns, S. K., and J. P. Ziliak. 2017. “Identifying the Elasticity of Taxable Income.” The Economic Journal 127 (600): 297–329.10.1111/ecoj.12299Search in Google Scholar
Carey, S., J. Creedy, N. Gemmell, and J. Teng. 2015. “Estimating the Elasticity of Taxable Income in New Zealand.” Economic Record 91 (292): 54–78.10.1111/1475-4932.12151Search in Google Scholar
Central Bureau of Statistics. 2011. “Labor Force Survey 2010.” Publication No. 1460. Jerusalem: (in Hebrew).Search in Google Scholar
Chetty, R., J. N. Friedman, T. Olsen, and L. Pistaferri. 2011. “Adjustment Costs, Firm Responses, and Micro Vs. Macro Labor Supply Elasticities: Evidence from Danish Tax Records.” The Quarterly Journal of Economics 126 (2): 749–804.10.3386/w15617Search in Google Scholar
Creedy, J., N. Gemmell, and J. Teng. 2016. “The Elasticity of Taxable Income: Allowing for Endogeneity and Income Effects.” Working Paper in Public Finance, No. 03/2016. Wellington: University of Victoria Business School.Search in Google Scholar
Feldstein, M. S. 1995. “The Effect of Marginal Tax Rates on Taxable Income: A Panel Study of the 1986 Tax Reform Act.” Journal of Political Economy 103 (3): 551–72.10.1086/261994Search in Google Scholar
Giertz, S. H. 2004. “Recent Literature on Taxable-Income Elasticities.” Technical Paper Series, No. 2004-16. Washington D.C: Congressional Budget Office.10.2139/ssrn.1092195Search in Google Scholar
Gruber, J., and E. Saez. 2002. “The Elasticity of Taxable Income: Evidence and Implications.” Journal of Public Economics 84 (1): 1–32.10.3386/w7512Search in Google Scholar
Income Tax Reform: Recommendations of the Committee for Tax Reform. 2002. Jerusalem (in Hebrew).Search in Google Scholar
Jongen, E. L. W., and M. Stoel. 2016. “The Elasticity of Taxable Labour Income in the Netherlands.” CPB Discussion Paper No. 337. CPB Netherland Bureau for Economic Policy Analysis.Search in Google Scholar
Kawano, L., C. Weber, and A. Whitten. 2016. Estimating the Elasticity of Broad Income for High-Income Taxpayers. unpublished manuscript.10.2139/ssrn.2852048Search in Google Scholar
Kiss, A., and P. Mosberger. 2015. “The Elasticity of Taxable Income of High Earners: Evidence from Hungary.” Empirical Economics 48 (2): 883–908.10.1007/s00181-014-0809-7Search in Google Scholar
Kleven, H. J., and E. A. Schultz. 2014. “Estimating Taxable Income Responses Using Danish Tax Reforms.” American Economic Journal: Economic Policy 6 (4): 271–301.10.1257/pol.6.4.271Search in Google Scholar
Lehmann, E., F. Marical, and L. Rioux. 2013. “Labor Income Responds Differently to Income-Tax and Payroll-Tax Reforms.” Journal of Public Economics 99: 66–84.10.1016/j.jpubeco.2013.01.004Search in Google Scholar
Lindsey, L. 1987. “Individual Taxpayer Response to Tax Cuts: 1982–1984, with Implications for the Revenue Maximizing Tax Rate.” Journal of Public Economics 33 (2): 173–206.10.3386/w2069Search in Google Scholar
Matikka, T. forthcoming. “The Elasticity of Taxable Income: Evidence from Changes in Municipal Income Tax Rates in Finland.” The Scandinavian Journal of Economics.10.1111/sjoe.12236Search in Google Scholar
(National Insurance Institute) (2004).Annual Report 2002–2003 Jerusalem: Research and Planning Administration .Search in Google Scholar
Neisser, C. 2017. “The Elasticity of Taxable Income: A Meta-Regression Analysis.” Discussion Paper No. 17-032. ZEW Centre for European Economic Research.10.2139/ssrn.3091201Search in Google Scholar
Saez, E. 2010. “Do Taxpayers Bunch at Kink Points?” American Economic Journal: Economic Policy 2 (3): 180–212.10.3386/w7366Search in Google Scholar
Saez, E., J. Slemrod, and S. H. Giertz. 2012. “The Elasticity of Taxable Income with respect to Marginal Tax Rates: A Critical Review.” Journal of Economic Literature 50 (1): 3–50.10.3386/w15012Search in Google Scholar
Sanz-Sanz, J. F., M. Arrazola-Vacas, N. Rueda-Lopez, and D. Romero-Jordan. 2015. “Reported Gross Income and Marginal Tax Rates: Estimation of the Behavioral Reactions of Spanish Taxpayers.” Applied Economics 47 (5): 466–84.10.1080/00036846.2014.972548Search in Google Scholar
Toledano, E., N. Zussman, R. Frish, and D. Gottlieb. 2012. “The Effect of Child Allowances on Fertility.” Israel Economic Review 9 (1): 103–50 (in Hebrew).Search in Google Scholar
© 2020 Walter de Gruyter GmbH, Berlin/Boston
Articles in the same Issue
- Research-Articles
- The Wage Response to a Reduction in Income Tax Rates: The Israeli Tax Reform
- Employee Choice and the Demand for Health Insurance Coverage: Evidence from Random Coefficients Models
- Marathon, Hurdling, or Sprint? The Effects of Exam Scheduling on Academic Performance
- Sharing Competition: An Agent-Based Model for the Short-Term Accommodations Market
- Timing of Adopting a Flexible Manufacturing System and Product Differentiation
- Childcare Allowances and Public Pensions: Welfare and Demographic Effects in an Aging Japan
- The Crucial Role of Social Welfare Criteria and Individual Heterogeneity for Optimal Inheritance Taxation
- The Economics of Enlightenment: Time Value of Knowledge and the Net Present Value (NPV) of Knowledge Machines, A Proposed Approach Adapted from Finance
- The Consequences of the 1959–1961 Chinese Famine for Educational Attainment
- Investment in Green Technology and Entry Deterrence
- Analyzing the Effect of Mandatory Water Restrictions on Water Usage
- Acquisitions for Sleep
- Gender Differences in Performance and Risk-taking among Children, Teenagers, and College Students: Evidence from Jeopardy!
- Letters
- Accounting for Differences in Female Labor Force Participation between China and India
- Conflict Intensity and Birth Outcomes – Evidence from the West Bank
- Search and Bidding Costs