The Interdependence of Immigration Restrictions and Expropriation Risk
-
Lena Calahorrano


Abstract
Factor price differences create economic incentives for migration to industrialized countries and for capital flows to developing countries. However, immigration restrictions and capital expropriation risks impede factor flows. Using a political-economy approach that takes into account different generations’ conflicting attitudes toward immigration and expropriation, we explore how these restrictions interact. Then, we run two separate country fixed regressions to explore the interdependence of policies empirically. The results from our theoretical model are borne out by the data: We find a positive relationship between emigration and foreign investors’ perceived security of property rights in developing countries and a negative relationship between the US foreign direct investment (FDI) outflows to developing countries and the share of US green cards granted to natives from the respective countries. Based on our analyses, we conclude that the key to lowering mobility barriers is not simply a quid pro quo.
1 Introduction
The importance of demographic structures for international migration and foreign direct investment (FDI) has aroused international interest. Factor movements are discussed not only as a means to realize efficiency gains but also as a driver for economic growth in developing countries and to secure pension systems in industrialized countries.[1]
However, developing countries often do not offer the institutional framework for international investors to fully reap efficiency gains.[2] In turn, governments of aging industrialized countries tend to be sensitive to native resentments toward the admission of immigrants. Observed international factor flows are indeed far too low to equalize the returns to capital and labor.[3]
Even though research on the (political) impediments to international labor and capital flows is well established, the simultaneous consideration of migration and investment policies has so far been neglected. This is a gap in the literature which we aim to fill with our paper. Accounting for the interplay of policies provides new insights on the interdependence of restrictions to factor flows and on remedies to ease those restrictions.
We construct an integrated theoretical model to investigate this interplay of policies. We consider two open economies, each populated by two generations. While the majority of the population is young in the developing country, the reverse is true for the industrialized country. We assume policies to be determined by the respective median voter’s preferences in a one-period setting with sequential decisions. The government’s policy decision in the industrialized country is how many immigrants to admit, while in the developing country imported capital can either be expropriated or not.
We account for the fact that industrialized countries’ natives’ immigration preferences are driven by both income and non-income motives. In the static theoretical models by Benhabib (1996) and Mazza and van Winden (1996), capital owners support labor immigration while the working population does not. In dynamic settings, attitudes may be reversed if immigrants receive political rights, see, e.g., Dolmas and Huffman (2004) or Ortega (2010). In our model, old capital owners’ preferred level of immigration is limited because we account for the possibility that capital is invested abroad, but also because immigration entails a non-income disutility as in Calahorrano and Lorz (2011). For instance, natives may resent an increased heterogeneity of norms and customs, as in Hillman (2002), or immigration may reduce utility derived from public goods, as in Alesina and La Ferrara (2005). In fact, the empirical literature finds labor market, welfare state and cultural concerns to be the main determinants of immigration attitudes.[4]
Concerning expropriation, we adhere to, e.g., Eaton and Gersovitz (1984), Azzimonti and Sarte (2007) or Harms and an de Meulen (2012) and assume that foreign investors withdraw their expertise after expropriation. While expropriated capital can still be used in production, this induces a drop in total factor productivity (TFP) and thus in the local wage level.[5]
Our analysis is based on the notion that political decisions are influenced by heterogeneous interests within countries’ populations. Since the relative importance of labor and capital incomes changes over the life cycle, countries’ differential demographic structures do not only create incentives for factor flows but also affect political decisions on factor mobility constraints.
In our model, emigration paves the way to safer FDI: It makes expropriation less attractive for the developing country, since it increases the wage rate and therefore also the wage drop induced by expropriation, while reducing the returns to expropriated capital. However, the industrialized country admits less immigrants as FDI increases, since then, less labor is needed in the home economy. Due to this particular interdependence of policies, migration and FDI are both constrained in equilibrium.
Next, we investigate whether the suggested interdependence of policies stands up to empirical scrutiny. We first estimate the relationship between emigration from developing countries and the perceived security of property rights of foreign investors in those countries, based on the “investment profile” index from the International Country Risk Guide (ICRG) datasets. This analysis is closely related to Harms and an de Meulen (2013), who also use the “investment profile” index to investigate expropriation risk. Second, we focus on the United States as an industrialized country to investigate how FDI flows to various developing countries relate to the restrictions on immigration from those countries. Several recent papers analyze actual immigration policy decisions instead of voters’ attitudes, see, e.g., Miguet (2008), Facchini and Steinhardt (2011) or Hainmueller and Hangartner (2013). Our empirical approach is to use the share of US green cards issued to natives of different developing countries as a measure of immigration restrictions.
Our findings are in line with our theoretical model: the perceived security of property rights increases with emigration. Emigration thus eases restrictions on FDI. On the contrary, also in line with our theoretical model, the share of green cards issued to natives from any given developing country decreases as FDI increases in the respective country.
2 A Theoretical Model of Expropriation Risk and Immigration Restrictions
This section theoretically models factor flows between an industrialized country and a developing country in a political economy framework, where the respective median voters’ preferences determine policies. An extension to a setting with more than two countries[6] would leave the main results unchanged. We explain the setup of the model in Section 2.1 and derive the equilibrium in Section 2.2.
2.1 Setup
We consider an industrialized country and a developing country, both populated by young and old individuals. Each young individual supplies one unit of labor, potentially in either country, while the old individuals are out of the labor force.[7] Each old individual in the industrialized country owns a given amount of capital
The size of the total population is normalized to one in both countries:
where the asterisk denotes the developing country’s variables. The old are in the majority in the industrialized country, while the opposite holds for the developing country, that is
In both countries a homogeneous good is produced with a Cobb–Douglas production function:
The size of the capital stock owned by the old generation in the industrialized country is
TFP in the industrialized country (A) exceeds TFP in the developing country. This results from a less favorable business climate (due to an inferior infrastructure, a higher regulatory burden, etc.). However, productivity in the developing country depends not only on these initial conditions but also on foreign investors’ capacity to cope with these conditions and on their technological expertise. Köse et al. (2010) argue that FDI goes along with transfers of technological expertise. Foreign takeovers have also been found to have positive effects on wage levels; see te Velde and Morrissey (2003) among others. We therefore assume that TFP
Defining M as labor migration from the developing to the industrialized country, factor prices are given by
in the industrialized country and the developing country, respectively.
Individuals’ utility is linear in consumption:
Whereas both FDI and migration affect consumption, immigration also causes a disutility d to all of the industrialized country’s citizens, proportional to the share of immigrants M. This disutility parameter captures potential welfare effects of immigration not accounted for in individual incomes in a tractable way. In the absence of such an assumption, immigration would not be constrained in equilibrium. However, despite large potential efficiency gains from liberal immigration policies, unrestricted migration flows are hardly observed.
Each country’s government sets policy to maximize the respective median voter’s utility. The developing country government decides whether to expropriate foreign capital. Expropriation refers to the withdrawal of the foreign capital stock, and, for simplicity, it is assumed to be always total. The developing country is thus subject to a classical time-inconsistency problem and would always expropriate if this did not entail any costs for its inhabitants. Then, no capital would flow there.
Since foreign investors lose control over invested capital as a consequence of expropriation, they will no longer provide their expertise. Hence, expropriated capital may still be used in production, but output is reduced since TFP drops to
The benefit from expropriation (the gross return to capital) is distributed equally among the developing country’s old and those young who have not emigrated. Each inhabitant of the developing country thus receives a transfer:
The developing country’s costs of expropriation do not affect both generations equally. Whereas the decline in output reduces the young generation’s wages, the old generation does not incur any cost from expropriation. Expropriation thus induces a distributional conflict along demographic lines.[9]
The government of the industrialized country decides on the number of admitted immigrants. Immigration to the industrialized country affects its citizens’ welfare in two ways. First, it alters factor prices. The young generation clearly suffers since wages decline. The old generation benefits from increasing capital returns on the part of capital invested at home k and suffers from decreasing returns on that part invested in the foreign developing country
Consumption levels are thus given by
and
We assume the following sequence of events. First, the industrialized country’s old allocate their capital to both countries, and at the same time, the industrialized country’s government determines the immigration quota.[10] Second, the developing country’s young migrate before third, the developing country’s government decides whether to expropriate the foreign-owned capital stock. Fourth, production and consumption take place. We solve the model by backward induction, starting with the expropriation decision.
2.2 Equilibrium Policy
We now determine equilibrium migration and FDI. We solve for the four equations determining the volume of individually optimal and politically determined factor flows, starting with the expropriation decision.
Note that high emigration from the developing country may change the identity of the median voter there from a young to an old individual, whereas the median voter in the industrialized country is always old. We therefore use the term young-median-voter equilibrium to refer to a situation where the majority in the developing country is young and the term old-median-voter equilibrium to refer to a situation where, due to high emigration, the majority in the developing country is old.
2.2.1 Non-expropriation Constraint
When deciding whether to expropriate, the developing country’s government faces given levels of capital inflows
We call the threshold value of migration for which there remain as many old as young individuals in the developing country
Using eq. [2], this can be written as
In eq. [3] we can identify three effects of capital inflows on the attractiveness of expropriation. The first one is a wage effect
Subtracting the return effect on both sides and inserting eq. [1] yield
Note that the sign of the term in squared brackets on the left-hand side is independent of the level of FDI,
A low
Solving for
Consequently, we can write the upper bound for capital inflows, the non-expropriation constraint, as
for the case of an old and a young median voter, respectively. We can calculate the derivative of the young median voter’s non-expropriation constraint with respect to emigration as
The sign of this derivative is ambiguous. Emigration has three effects on the non-expropriation constraint. First, wages increase and so does the wage effect from expropriation. Second, capital returns decrease. Both make expropriation less attractive. However, third, the number or recipients of a possible transfer decreases, making expropriation more attractive:
Recall that a larger
As we outline below, the suggested positive effect of emigration on the critical level of FDI is sufficient for a unique equilibrium to exist in the case of a young median voter in the developing country. It is an empirical question whether emigration actually eases expropriation risk and how this effect depends on the relative development level of the capital receiving country. Our empirical investigation in Section 3.1 suggests that emigration does in fact ease expropriation risk in developing countries. Moreover, once we restrict our sample to the least developed countries, the positive relationship disappears, as suggested by eq. [7].[11]
2.2.2 Emigration Constraint
Before the developing country government decides on expropriation, the developing country’s young take their migration decision for a given level of FDI and for a given immigration policy in the industrialized country. In the absence of any immigration restrictions they would migrate until wages in both countries are equal. This yields the emigration constraint:
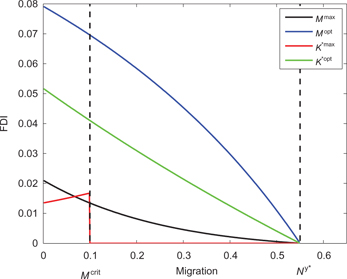
The emigration constraint is represented by the blue line in Figure 1. However, potential migrants have to obey the limit on immigration set by the industrialized country’s government, the immigration policy constraint
2.2.3 Immigration Policy Constraint
Immigration policy is set simultaneously to the investors’ allocation of capital. Immigration from the developing country raises the capital return on the part of capital invested in the industrialized country and decreases the capital return on the part invested in the developing country. Note that the foreign capital returns only accrue to the industrialized country’s investors if
Maximizing the indirect utility function of the median voter, who is always an old individual, while assuming non-expropriation yields the following first-order condition for immigration policy for every value of
with
and d denoting the nonmonetary disutility related to a marginal increase in immigration. Equation [9] illustrates that immigrants are admitted as long as the marginal gain from immigration,
The first-order condition can also be written as
For unrestricted migration
Even though we cannot solve explicitly for
With larger FDI, investors place a higher weight on foreign capital returns. These become large for low levels of migration. Therefore, chosen immigration is a declining function of FDI, given by the black line in Figure 1.
Again, whether this relationship is valid is an empirical question, which we investigate in the next section. For the United States at least, our empirical analysis supports this theoretical finding.
2.2.4 Investment Constraint
At the same time with the immigration policy decision, the industrialized country’s old allocate their capital to both countries. In the absence of the possibility of expropriation, the industrialized country’s investors would export the share of capital necessary to equalize capital returns in both countries. The level of FDI for which this investment constraint binds,
The difference in capital returns and thus the optimal level of FDI flows is lower the higher immigration:
The investment constraint is represented by the green line in Figure 1.
Actual FDI is given by the minimum of
If the median voter in the developing country is old, the non-expropriation constraint
Figure 1 shows the two policy equations and the equations for individually optimal migration and FDI for
2.2.5 Equilibrium
Our political economy model can be summarized as a game between the industrialized country’s investors and the industrialized country’s government, subject to the non-expropriation constraint. As
In an old-median-voter equilibrium, FDI is restricted to zero for any level of migration, and migration is thus determined by
Being based on
Migration and FDI in equilibrium (
In summary, different equilibria are possible, depending on the disutility parameter d. For any
3 Empirical Evidence
Our theoretical model assesses the interdependence of policies that restrain capital flows to developing countries and migration to industrialized countries. For a given set of sensible parameter values, the model predicts a negative effect of migration on expropriation risk (that is a positive effect on FDI) but a positive effect of FDI on immigration restrictions (a negative effect on migration). This section therefore investigates whether the effects predicted by our model are actually in line with empirically observed patterns of politically determined migration and FDI. To do this, we have to run two different regressions, one for some measure of expropriation risk and one for some measure of immigration restrictions.
3.1 Emigration and the Risk of Expropriation
This section investigates how the “investment profile” index from ICRG by the Political Risk Services Group (2008) is related to emigration. The “investment profile” index reflects ratings of the security of foreign investments. It consists of three subcomponents, namely risk of expropriation or contract viability, payment delays and barriers on the repatriation of profits, each with a minimum score of zero points (very high risk) and a maximum score of four points (very low risk). Among developing countries there is a high negative correlation between the actual number of outright expropriations and the “investment profile” index, as Harms and an de Meulen (2013) show.
We include information on 68 developing countries and 5 periods, 1984–85, 1986–90, 1991–95, 1996–2000 and 2001–05. Countries are selected according to the World Bank Income Classification. In each period, the sample includes only countries that do not belong to the group of high-income countries. Our panel is thus unbalanced.
As our key explanatory variable we use emigration rates, defined as emigrants to the six major Organisation for Economic Cooperation and Development (OECD) countries, that is Australia, Canada, France, Germany, the United Kingdom and the United States,[14] divided by the sum of residents and emigrants aged above 25 years from Defoort and Rogers (2008). Emigration rates are available every 5 years. To mitigate potential problems of reverse causality we run our regressions for the “investment profile” indices in 1984–85, 1986–90, etc. on the emigration rates in 1980, 1985, etc.
We further include variables measuring institutional quality as well as educational, economic and demographic variables. All of these are likely both to have an impact on expropriation risk and to be correlated with emigration. Summary statistics for all variables can be found in the Appendix. The control variables are measured in 5-year averages, except for our demographic variable, which, similarly to emigration rates, is measured in initial values.
Regarding institutional quality, we use another variable from the ICRG dataset, namely the “law and order” index, which measures the strength of the legal system. The law subcomponent is an assessment of the strength and impartiality of the legal system, while the order subcomponent is an assessment of popular observance of the law. Both subcomponents comprise zero (low quality) to three points (high quality). We expect this index to be positively correlated with the “investment profile” index since a strong and independent legal system can protect foreign investors’ property rights even if the executive is willing to expropriate. In a robustness check, we also include a measure of political repression, the “political rights” index by Freedom House (2009). It measures the degree of freedom in the electoral process, political pluralism and participation, and the functioning of government is rated on a scale of 1 (most free) to 7 (least free). Political repression reduces a government’s accountability and may thereby increase expropriation risk, see, e.g., Li and Resnick (2003) or Jensen (2003). However, among democracies, a re-election seeking government may find it worthwhile to enact redistributive expropriation, if this is in the voters’ interest, see, e.g., Wells (1998).
At the same time, bad institutional quality is likely to enhance emigration, and emigration may also have a repercussion on institutional quality: Emigration facilitates the spillover of foreign norms and values, and emigrants from countries with bad institutional quality may become politically active in order to change institutions in their home countries. Finally, Docquier et al. (2010) argue that the threat of skilled emigration may set elites under pressure to reform.
To measure education, we recur to the average years of schooling of individuals above 25 years from the Barro and Lee (2001) dataset. Skilled workers in developing countries are more likely to be employed by foreign firms, and, since foreign firms tend to pay higher wages to skilled workers, see, for instance, te Velde and Morrissey (2003) or Görg and Girma (2007), these are more likely to oppose emigration. At the same time, higher education levels facilitate labor emigration.
We further add several economic variables. In our baseline specification, we use the logarithm of real gross domestic product (GDP) per capita taken from the Penn World Table (2009). Economic well-being may affect expropriation risk in several ways. As Picht and Stüven (1991) argue, it may protect foreign firms from expropriation out of public discontent or even desperation. In turn, the state of the economy may affect profits in the private sector and, as in our theoretical model, thereby affect incentives for expropriation, see also Tomz and Wright (2008). At the same time, workers’ emigration decisions are clearly affected by the overall economic situation in their home country, whereas emigration and emigrants’ remittances (see Rapoport and Docquier 2006) have repercussions on home countries, too.
In a robustness check, we add countries’ real GDP growth, also taken from the Penn World Table (2009), as well as the logarithm of countries’ consumer price inflation rates, taken from the World Bank (2009). Since insecure property rights hamper growth and development, see, e.g., Hall and Jones (1999) or Rodrik, Subramanian, and Trebbi (2004), we use lagged values of GDP per capita and of GDP growth to mitigate reverse causality problems.
Finally, we include countries’ integration into international trade into our baseline specification. It is measured by the World Bank (2009) as the sum of exports and imports of goods and services relative to GDP,[15] again lagged to account for possible reverse causality. More open economies suffer higher losses from expropriating foreign investors if this triggers an economic isolation as in Cole and English (1991), Thomas and Worrall (1994), Aguiar, Amador, and Gopinath (2009) and Aguiar and Amador (2011). Meanwhile, emigration promotes trade, see, e.g., Felbermayr and Toubal (2012): Immigrants may build a bridge when it comes to cultural and linguistic boundaries between their home country and the country they emigrated to. Moreover, if migrants have home-biased preferences, this may promote imports from their home countries.
A last variable that we include is countries’ population share of persons aged 15–39 from the United Nations Population Division (2008). As in our theoretical model, younger individuals in developing countries are more likely to benefit from the presence of foreign-owned firms. This is because they may find work there and also gain higher wages than in domestically owned firms. The share of young workers also affects the local wage level and foreign investors’ capital returns and thereby the costs and benefits of expropriation. At the same time, younger individuals are more likely to migrate than older individuals.
Based on this set of control variables, we estimate the following equation:
where the indices i and t denote the country and the time period, respectively and the
Table 1 shows our regression results. The first two columns show the results of the OLS and fixed effects estimations using our baseline specification. The estimated effect of the emigration rate from the respective developing country is insignificant according to the baseline OLS regression, but it turns significant when country fixed effects are included to control for unobserved heterogeneity between countries. Ceteris paribus, the “investment profile” index is thus higher (and emigration risk is lower) in times of high emigration.
Regression results for the “investment profile” index.
| OLS, fixed effects, IV and dynamic panel estimation | ||||||||
| Investment profile | Baseline specification | Demographic structure | Additional controls | Alternative estimators | ||||
| OLS | Fixed effects | OLS | Fixed effects | OLS | Fixed effects | Fixed effects IV |
|
|
| Emigration rate | 2.305 | 17.160*** | 2.304* | 17.848*** | 1.017 | 18.039** | 21.470*** | 40.498*** |
| [1.384] | [5.743] | [1.382] | [5.528] | [1.388] | [6.896] | [6.793] | [13.631] | |
| Law and order | 0.397*** | 0.291** | 0.396*** | 0.323** | 0.223*** | 0.166 | 0.323*** | 0.500 |
| [0.099] | [0.123] | [0.098] | [0.128] | [0.084] | [0.117] | [0.114] | [0.301] | |
| Schooling | 0.124* | –0.067 | 0.122* | 0.122 | 0.128** | 0.032 | 0.137 | 0.850 |
| [0.069] | [0.209] | [0.067] | [0.237] | [0.060] | [0.160] | [0.218] | [0.943] | |
| GDP per capita (–1) | 0.110 | –0.478 | 0.098 | –0.521 | –0.083 | –0.066 | –0.483 | –2.994** |
| [0.211] | [0.552] | [0.219] | [0.582] | [0.177] | [0.526] | [0.400] | [1.272] | |
| Openness (–1) | 0.298 | 0.853 | 0.294 | 0.796 | 0.183 | 0.162 | 0.770 | 3.935** |
| [0.284] | [0.733] | [0.281] | [0.771] | [0.313] | [0.611] | [0.620] | [1.768] | |
| Young population share | 1.318 | –13.935 | –14.195* | –1.021 | ||||
| [3.749] | [9.975] | [7.451] | [30.518] | |||||
| Political repression | –0.217*** | –0.238*** | ||||||
| [0.059] | [0.084] | |||||||
| GDP growth (–1) | 0.104*** | 0.074** | ||||||
| [0.024] | [0.029] | |||||||
| Inflation | –0.320*** | –0.416*** | ||||||
| [0.082] | [0.121] | |||||||
| Investment profile (–1) | 0.218 | |||||||
| [0.168] | ||||||||
| Constant | 2.978* | 10.174** | 2.584 | 15.143** | 7.545*** | 8.575** | 14.726*** | |
| [1.527] | [4.459] | [1.745] | [5.899] | [1.274] | [4.179] | [4.156] | ||
| Hansen J test | [0.566] | |||||||
| AR(2) test | [0.400] | |||||||
| R 2 | 0.447 | 0.530 | 0.445 | 0.535 | 0.563 | 0.613 | ||
| Observations | 318 | 318 | 318 | 318 | 305 | 305 | 314 | 180 |
This result is in line with the prediction from our theoretical model, where the mechanism driving this effect was the following: If foreign capital is expropriated, the gross returns to capital are distributed among the country’s inhabitants. With higher emigration, there are fewer recipients, making expropriation more attractive. As a counter-effect, however, the distributed capital returns decline. Moreover, the withdrawal of foreign expertise triggers a wage drop in the face of expropriation, which is stronger the larger the wage rate and thus the larger the outflow of labor.
The significance of the estimated effect is unchanged by the inclusion of our indicator of developing countries’ demographic structure and of additional controls in the next four columns.
Since we cannot rule out that expropriation risk actually causes emigration and not vice versa, we carry out two additional robustness checks. First, we apply an instrumental variable (IV) estimator, using countries’ lagged emigration rates as an instrument for the contemporaneous ones. Second, to take account of the possibility that the “investment profile” index is persistent over time, we add its lagged values to our set of explanatory variables. In such a dynamic panel model, the fixed effects estimator is inconsistent, however. Therefore, we make use of the dynamic panel estimator by Arellano and Bond (1991), which first differences the left- and the right-hand sides of eq. [13], eliminating the country fixed effects. This generalized method of moments (GMM) estimator then uses lagged levels of the (potentially endogenous) explanatory variables as instruments for the first differenced ones.
The penultimate column shows the result of the static fixed effects IV estimation, while the last column presents the results of the dynamic panel estimation. In both estimations we include our main explanatory variables, that is the baseline set augmented by countries’ population share of persons aged 15–39. The relationship between emigration and expropriation risk predicted by our model also holds under this more sophisticated approach.
3.2 FDI and the Granting of Green Cards in the United States
This section investigates the second prediction of our theoretical model that industrialized countries tighten the restrictions on immigration from developing countries in the face of higher FDI in those countries. An (inverse) measure of immigration restrictions by country of origin is available in the United States: The US Department of Homeland Security (2010) provides information on the number of granted green cards by immigrants’ country of birth for the years 2001–2010. We use the share of total green cards granted to immigrants from the respective country as our dependent variable. Again, we adhere to the World Bank Income Classification to select the sample of countries. In each year, the sample includes only non-high-income countries, 60 in total.
Our key explanatory variable is the size of the US FDI positions in the 60 developing countries. It is taken from the US Bureau of Economic Analysis (2014) and measured in US dollars on a historical cost basis.
To rule out endogeneity problems that go along with omitting variables which are both related to US immigration restrictions and US FDI activity we add several controls. Immigration policies are primarily driven by voters’ attitudes, see, for instance, Facchini and Mayda (2010). Attitudes, in turn, are contingent both on voters’ and on immigrants’ characteristics. We fully control for any kind of US-specific variables in general and US-voter-specific variables in particular by using time dummies. Furthermore, we include developing country fixed effects to control for unobserved differences between developing countries or developing countries’ populations that are time invariant.
As controls, we include the US exports to and imports from the developing countries, taken from the US Department of Commerce, Bureau of the Census, Foreign Trade Division (2014), as a share of US GDP. Mundell (1957) and the models by Heckscher, Ohlin and Samuelson as well as Stolper and Samuelson suggest substitutability between trade and factor mobility, while the works by, e.g., Markusen (1983) and Wong (1986) extend the Heckscher–Ohlin–Samuelson framework to show that there can be complementarity between trade and factor flows.
We also use the number of workers with tertiary education in the various developing countries, recurring to the World Bank (2014). In the previous section, we already argued that education levels in developing countries are likely to be related to both FDI and migration. This clearly holds for the granting of green cards as well: Although there are several ways to obtain a green card, workers with advanced degrees are generally preferred.
Further characteristics of the developing countries, relating to their demographics, their economic well-being and the quality of their institutions, certainly determine the supply of migrants from those countries, but are less likely to determine demand, reflected by the number of granted green cards. Therefore, we only include such indicators in a robustness check.
There we use the size of the total population in the country of origin as a measure of the potential supply of green card applicants. Further, we use the share of the working-age population (aged 15–64). A larger relative number of young workers affect foreign investors’ capital returns and thus their investment decisions. At the same time, it increases labor market competition, which may lead young people to emigrate. As a macroeconomic variable we include real GDP per capita in constant 2005 dollars. Emigration is often the result of gloomy economic prospects. At the same time a country’s development affects capital returns of foreign investors. All those variables are taken from the World Bank (2014).
Furthermore, we include two variables from Freedom House (2009), the “political rights” index, see Section 3.1, and an (inverse) index of civil liberties. The latter measures the degree of freedom of expression and belief, associational and organizational rights and rule of law. A lack of political and civil freedom may lead people to leave their home countries. At the same time it affects the business climate foreign investors face. Descriptive statistics for all variables can be found in the Appendix.
We estimate the following regression equation:
where, again, the indices i and t denote immigrants’ country of origin and the time period, respectively, and the
Table 2 shows the regression results. The first two columns include only US exports and imports as a share of GDP and the number of workers with tertiary education in addition to US FDI in the respective country as explanatory variables. The third and fourth columns include the full set of developing country controls. We first estimate both the baseline and the augmented regression equation using OLS, then using country fixed effects.
Regression results for the granting of US green cards.
| OLS, fixed effects and dynamic panel estimation | |||||
| Share of green cards | Baseline specification | Additional controls | Dynamic panel estimation | ||
| OLS | Fixed effects | OLS | Fixed effects | Arellano–Bond GMM | |
| US FDI |
–0.639** | –1.243*** | –0.643** | –1.257*** | –1.835** |
| [0.308] | [0.366] | [0.311] | [0.366] | [0.743] | |
| US exports/GDP | 24.067*** | 18.902*** | 25.660*** | 19.150*** | 31.026*** |
| [5.512] | [4.564] | [5.775] | [5.220] | [5.917] | |
| US imports/GDP | –1.101 | –3.676 | –2.217 | –3.095 | –7.694 |
| [3.009] | [2.887] | [3.414] | [2.968] | [6.330] | |
| Educated workers1 | 0.001 | 0.182* | –0.217 | 0.189* | 0.365 |
| [0.042] | [0.096] | [0.397] | [0.099] | [0.249] | |
| Population (total)2 | 0.041 | –0.013 | |||
| [0.072] | [0.109] | ||||
| Working age population share | –0.008 | 0.015 | |||
| [0.035] | [0.033] | ||||
| GDP per capita1 | –0.028 | 0.318 | |||
| [0.106] | [0.424] | ||||
| Political repression3 | –0.073 | –0.043 | |||
| [0.127] | [0.045] | ||||
| Lack of civil liberties3 | 0.249 | –0.135 | |||
| [0.203] | [0.092] | ||||
| Share of green cards (–1) | –0.205 | ||||
| [0.270] | |||||
| Constant | 0.003 | 0.010*** | 0.002 | 0.003 | |
| [0.002] | [0.002] | [0.024] | [0.024] | ||
| Hansen J test | [0.357] | ||||
| AR(2) test | [0.313] | ||||
| R 2 | 0.875 | 0.500 | 0.880 | 0.503 | |
| Observations | 266 | 266 | 265 | 265 | 179 |
The estimated effect of the US direct investment in any developing country on the share of green cards issued to natives from that country is significant and negative even in the OLS regressions. Its statistical significance increases when unobserved heterogeneity between countries is accounted for. Ceteris paribus, the United States thus grants fewer green cards to natives from any particular country as it invests more in that country.
This is in line with the prediction of our theoretical model, where the mechanism driving this effect was the following: In capital-rich and relatively “old” host countries like the United States, immigration has a positive effect on domestic capital returns, while it negatively affects capital returns in the migration source country. The more capital from the United States is invested in that country, the more important becomes the latter effect, and the stronger the opposition to immigration from there.
This finding is robust to the inclusion of additional controls. The fact that the developing country variables are hardly significant suggests that the shares of green cards granted are actually demand and not supply driven.
According to Hainmueller and Hangartner (2013) and Markaki and Longhi (2013), immigration restrictions exhibit potentially negative autocorrelation as a result of saturation. Meanwhile, due to network effects (see, e.g., Docquier et al. 2014), the supply of green card applicants from a certain country may exhibit positive autocorrelation. Hence, we include the lagged share of green cards as an additional independent variable and employ the dynamic panel estimator introduced by Arellano and Bond (1991). As argued in the last section, by first differencing eq. [14], the fixed effects disappear and the lagged levels of the explanatory variables are taken as instruments for the first differenced ones. Results for this robustness checks are shown in the last column of Table 2. The US FDI is still estimated to have a significant effect on the share of green cards granted. The second prediction of our theoretical model, a tightening of immigration restrictions concerning developing countries in the face of higher FDI in developing countries, is thus also borne out by the data.
4 Conclusion
This contribution has shed light on the interdependence of politically induced barriers to factor flows, both empirically and theoretically. The novel feature of our theoretical approach is the modeling of the interplay of policies in limiting factor flows between industrialized and developing countries.
We have set up a one-period model of two countries with heterogeneous agents, young and old. Accounting for international demographic differences, we have assumed an old median voter in the industrialized country but a young median voter in the developing country.
In equilibrium, factor flows are politically restricted, leaving room for efficiency gains from removing mobility barriers. Relaxing immigration restrictions may also relax restrictions on FDI in the form of expropriation risk. On the contrary, improving foreign investors’ property rights in developing countries does not help developing countries’ natives in gaining access to industrialized countries’ labor markets. The latter finding may also be interpreted differently: Improving property rights does help developing countries in preventing a brain drain.
We subjected both these findings to empirical scrutiny. We used an index of the perceived security of foreign investors’ property rights as an inverse measure for expropriation risk in developing countries and investigated how this index is related to emigration rates. We found emigration to have a robust positive effect on perceived property rights, as expected from our theoretical model. For developing country policymakers (who may decide to expropriate foreign capital) emigration and FDI inflows thus seem to be complements.
To investigate the effect of FDI outflows on industrialized country immigration restrictions, we used the share of granted US green cards differentiated by nationality. We found FDI outflows to have a robust negative effect on the share of green cards issued to natives of the FDI destination countries. FDI and immigration thus seem to be substitutes for US policymakers, as in our theoretical model and as would be expected from a purely economic model.
References
Aguiar, M., and M. Amador. 2011. “Growth in the Shadow of Expropriation.” Quarterly Journal of Economics 126:651–97.10.3386/w15194Search in Google Scholar
Aguiar, M., M. Amador, and G. Gopinath. 2009. “Investment Cycles and Sovereign Debt Overhang.” Review of Economic Studies 76:1–31.10.3386/w13353Search in Google Scholar
Alesina, A., and E. La Ferrara. 2005. “Ethnic Diversity and Economic Performance.” Journal of Economic Literature 43:762–800.10.3386/w10313Search in Google Scholar
Alfaro, L., S. Kalemli-Ozcan, and V. Volosovych. 2008. “Why Doesn’t Capital Flow from Rich to Poor Countries? An Empirical Investigation.” Review of Economics and Statistics 90:347–68.10.3386/w11901Search in Google Scholar
Arellano, M., and S. R. Bond. 1991. “Some Tests of Specification for Panel Data: Monte Carlo Evidence and an Application to Employment Equations.” Review of Economic Studies 58:277–97.10.2307/2297968Search in Google Scholar
Azzimonti, M., and P.-D. G. Sarte. 2007. “Barriers to Foreign Direct Investment under Political Instability.” Economic Quarterly 93:287–315.Search in Google Scholar
Barro, R. J., and J.-W. Lee. 2001. “International Data on Educational Attainment: Updates and Implications.” Oxford Economic Papers 53:541–63.10.3386/w7911Search in Google Scholar
Benhabib, J. 1996. “On the Political Economy of Immigration.” European Economic Review 40:1737–43.10.1016/0014-2921(95)00122-0Search in Google Scholar
Brooks, R. 2003. “Population Aging and Global Capital Flows in a Parallel Universe.” IMF Staff Papers 50:200–21.10.5089/9781451857023.001Search in Google Scholar
Busse, M., and C. Hefeker. 2007. “Political Risk, Institutions and Foreign Direct Investment.” European Journal of Political Economy 23:397–415.10.1016/j.ejpoleco.2006.02.003Search in Google Scholar
Calahorrano, L., and O. Lorz. 2011. “Aging, Factor Returns and Immigration Policy.” Scottish Journal of Political Economy 58:589–606.10.1111/j.1467-9485.2011.00560.xSearch in Google Scholar
Cole, H. L., and W. B. English. 1991. “Expropriation and Direct Investment.” Journal of International Economics 30:201–27.10.1016/0022-1996(91)90019-3Search in Google Scholar
Defoort, C., and G. Rogers. 2008. “Long-Term Trends in International Migration: An Analysis of the Six Main Receiving Countries.” Population (English Edition) 63:285–317.10.3917/pope.802.0285Search in Google Scholar
Docquier, F., E. Lodigiani, H. Rapoport, and M. Schiff. 2010. “Emigration and the Quality of Home Country Institutions.” IRES discussion paper 2010–35.10.1596/1813-9450-5557Search in Google Scholar
Docquier, F., G. Peri, and I. Ruyssen. 2014. “The Cross-Country Determinants of Potential and Actual Migration.” International Migration Review 48:S37–S99.10.1142/9789814719902_0012Search in Google Scholar
Dolmas, J., and G. W. Huffman. 2004. “On the Political Economy of Immigration and Income Redistribution.” International Economic Review 45:1129–68.10.1111/j.0020-6598.2004.00300.xSearch in Google Scholar
Eaton, J., and M. Gersovitz. 1984. “A Theory of Expropriation and Deviations from Perfect Capital Mobility.” Economic Journal 94:16–40.10.3386/w0972Search in Google Scholar
Facchini, G., and A. M. Mayda. 2008. “From Individual Attitudes towards Migrants to Migration Policy Outcomes: Theory and Evidence.” Economic Policy 23:651–713.10.1002/9781444307238.ch2Search in Google Scholar
Facchini, G., and A. M. Mayda. 2010. “What Drives Immigration Policy? Evidence Based on a Survey of Governments’ Officials.” In Migration and Culture, edited by G. Epstein and I. Gang, 605–48. Bingley, UK: Emerald.10.1108/S1574-8715(2010)0000008031Search in Google Scholar
Facchini, G., and M. F. Steinhardt. 2011. “What Drives US Immigration Policy? Evidence from Congressional Roll Call Votes.” Journal of Public Economics 95:734–43.10.2139/ssrn.1803433Search in Google Scholar
Felbermayr, G. J., and F. Toubal. 2012. “Revisiting the Trade-Migration Nexus: Evidence from New OECD Data.” World Development 40:928–37.10.1016/j.worlddev.2011.11.016Search in Google Scholar
Freedom House. 2009. Freedom in the World Survey.Search in Google Scholar
Görg, H., and S. Girma. 2007. “Evaluating the Foreign Ownership Wage Premium Using a Difference-in-Differences Matching Approach.” Journal of International Economics 72:97–112.10.1016/j.jinteco.2006.07.006Search in Google Scholar
Hainmueller, J., and D. Hangartner. 2013. “Who Gets a Swiss Passport? A Natural Experiment in Immigrant Discrimination.” American Political Science Review 107:159–87.10.1017/S0003055412000494Search in Google Scholar
Hall, R. E., and C. I. Jones. 1999. “Why Do Some Countries Produce So Much More Output per Worker than Others?.” Quarterly Journal of Economics 114:83–116.10.3386/w6564Search in Google Scholar
Harms, P., and P. an de Meulen. 2012. “The Demographics of Expropriation Risk.” Journal of Population Economics 25:809–32.10.1007/s00148-011-0375-7Search in Google Scholar
Harms, P., and P. an de Meulen. 2013. “Demographic Structure and the Security of Property Rights: The Role of Development and Democracy.” European Journal of Political Economy 29:73–89.10.1016/j.ejpoleco.2012.08.001Search in Google Scholar
Hillman, A. L. 2002. “Immigration and Intergenerational Transfers.” In Economic Policy for Aging Societies, edited by H. Siebert, 213–26. Dordrecht and Boston: Kluwer Academic Publishers.10.1007/978-3-662-42582-4_16Search in Google Scholar
INGENUE. 2001. “INGENUE: A Multi-regional Computable General Equilibrium Overlapping Generations Model.” Unpublished manuscript.Search in Google Scholar
Jensen, N. 2003. “Democratic Governance and Multinational Corporations: Political Regimes and Inflows of Foreign Direct Investment.” International Organization 57:587–616.10.1017/S0020818303573040Search in Google Scholar
Köse, M. A., E. Prasad, K. Rogoff, and S.-J. Wei. 2010. “Financial Globalization and Economic Policies.” In Handbook of Development Economics, edited by D. Rodrik and M. R. Rosenzweig, 4283–359. North Holland: Elsevier B.V.10.1016/B978-0-444-52944-2.00003-3Search in Google Scholar
Li, Q., and A. Resnick. 2003. “Reversal of Fortunes: Democratic Institutions and Foreign Direct Investment Inflows to Developing Countries.” International Organization 57:175–211.10.1017/S0020818303571077Search in Google Scholar
Lucas, R. E. 1990. “Why Doesn’t Capital Flow from Rich to Poor Countries?” American Economic Review 80:92–6.Search in Google Scholar
Markaki, Y., and S Longhi. 2013. “What Determines Attitudes to Immigration in European Countries? An Analysis at the Regional Level.” Migration Studies 1:311–37.10.1093/migration/mnt015Search in Google Scholar
Markusen, J. R. 1983. “Factor Movements and Commodity Trade as Complements.” Journal of International Economics 14:341–56.10.1142/9789811222962_0015Search in Google Scholar
Mazza, I., and F. van Winden. 1996. “A Political Economic Analysis of Labor Migration and Income Redistribution.” Public Choice 88:333–63.10.1007/BF00153237Search in Google Scholar
Miguet, F. 2008. “Voting About Immigration Policy: What Does the Swiss Experience Tell Us?” European Journal of Political Economy 24:628–41.10.1016/j.ejpoleco.2008.06.005Search in Google Scholar
Mundell, R. A. 1957. “International Trade and Factor Mobility.” American Economic Review 47:321–35.Search in Google Scholar
Office of Immigration Statistics. US Department of Homeland Security 2010. 2010 Yearbook of Immigration Statistics.Search in Google Scholar
Ortega, F. 2010. “Immigration, Citizenship, and the Size of Government.” The B.E. Journal of Economic Analysis & Policy 10. (Art. 26) http://www.degruyter.com/view/j/bejeap.2010.10.1/bejeap.2010.10.1.2324/bejeap.2010.10.1.2324.xmlSearch in Google Scholar
Picht, H., and V. Stüven. 1991. “Expropriation of Foreign Direct Investment: Empirical Evidence and Implications for the Debt Crisis.” Public Choice 69:19–38.10.1007/BF00123852Search in Google Scholar
Political Risk Services Group. 2008. International Country Risk Guide. New York: Political Risk Services.Search in Google Scholar
PWT. 2009. “Penn World Table 6.2.” Center for International Comparisons, University of Pennsylvania.Search in Google Scholar
Rapoport, H., and F. Docquier. 2006. “The Economics of Migrants’ Remittances.” Handbook of the Economics of Giving, Altruism and Reciprocity 2:1135–98.10.2139/ssrn.690144Search in Google Scholar
Rodrik, D., A. Subramanian, and F. Trebbi. 2004. “Institutions Rule: The Primacy of Institutions Over Geography and Integration in Economic Development.” Journal of Economic Growth 9:131–65.10.3386/w9305Search in Google Scholar
te Velde, D. W., and O.Morrissey. 2003. “Do Workers in Africa Get a Wage Premium if Employed in Firms Owned by Foreigners?” Journal of African Economies 12:41–73.10.1093/jae/12.1.41Search in Google Scholar
Thomas, J., and T Worrall. 1994. “Foreign Direct Investment and the Risk of Expropriation.” Review of Economic Studies 61:81–108.10.2307/2297878Search in Google Scholar
Tomz, M., and M. L. J. Wright. 2010. “Sovereign Theft: Theory and Evidence about Sovereign Default and Expropriation.” In The Natural Resources Trap: Private Investment without Public Commitment. edited by W. Hogan and F. Sturzenegger. Cambridge, MA: MIT Press.10.7551/mitpress/9780262013796.003.0004Search in Google Scholar
US Bureau of Economic Analysis. 2014. “Balance of Payments and Direct Investment Position Data.” U.S. direct investment abroad, U.S. direct investment position abroad on a historical-cost basis.Search in Google Scholar
US Department of Commerce, Bureau of the Census, Foreign Trade Division. 2014. “Exports, Imports and Trade Balance by Country.” US Department of Commerce.Search in Google Scholar
United Nations Population Division. 2001. “Replacement Migration: Is It a Solution to Declining and Ageing Populations?” United Nations Population Division.Search in Google Scholar
United Nations Population Division. 2008. “World Population Prospects: The 2008 Revision Population Database.” United Nations Population Division.Search in Google Scholar
Wells, L. T. 1998. “God and Fair Competition: Does the Foreign Direct Investor Face Still Other Risks in Emerging Markets?” In Managing International Political Risk, edited by T. H. Moran, 15–43. Malden, MA: Blackwell Publishers.Search in Google Scholar
Wong, K. 1986. “Are International Trade and Factor Mobility Substitutes?” Journal of International Economics 21:25–43.10.1016/0022-1996(86)90003-6Search in Google Scholar
World Bank. 2009. World Development Indicators Database 2009. Washington, DC: The World Bank.Search in Google Scholar
World Bank. 2014. World Development Indicators Database 2014. Washington, DC: The World Bank.Search in Google Scholar
Appendix
Emigration and the risk of expropriation: country list.
| Algeria, Argentina, Bangladesh, Bolivia, Botswana, Brazil, Bulgaria, Cameroon, Chile, Colombia, Costa Rica, Czech Republic, Democratic Republic of Congo, Dominican Republic, Ecuador, Egypt, El Salvador, Ethiopia, Gambia, Ghana, Greece, Guatemala, Haiti, Honduras, Hungary, India, Indonesia, Islamic Republic of Iran, Ireland, Israel, Jamaica, Jordan, Kenya, Liberia, Malawi, Malaysia, Mali, Mexico, Mozambique, Nicaragua, Niger, Pakistan, Panama, Papua New Guinea, Paraguay, People’s Republic of China, Peru, Philippines, Poland, Portugal, Republic of Congo, Romania, Russia, Senegal, Sierra Leone, Slovak Republic, Slovenia, South Africa, Spain, Sri Lanka, Sudan, Syrian Arab Republic, Thailand, Togo, Trinidad and Tobago, Tunisia, Turkey, Uganda, Uruguay, Venezuela, Zambia, Zimbabwe |
Emigration and the risk of expropriation: summary statistics.
| Variable | Mean | Overall std. dev. | Min. | Max. | Between-country std. dev. | No. of observations |
| Emigration rate1 | 2.91 | 5.69 | 0.02 | 43.68 | 5.95 | 473 |
| GDP growth (–1)1 | 1.09 | 4.45 | –30.60 | 24.95 | 3.11 | 463 |
| GDP per capita (–1) | 7.95 | 0.90 | 5.56 | 9.69 | 0.91 | 472 |
| Inflation | 2.33 | 1.31 | –0.84 | 7.99 | 0.96 | 450 |
| Investment profile | 6.29 | 2.00 | 1.33 | 11.81 | 1.40 | 417 |
| Law and order | 3.09 | 1.20 | 0.57 | 6 | 1.04 | 417 |
| Openness (–1) | 0.66 | 0.34 | 0.11 | 2.05 | 0.35 | 481 |
| Political repression | 4.19 | 1.93 | 1 | 7 | 1.79 | 485 |
| Schooling | 4.22 | 2.34 | 0.37 | 10.52 | 2.50 | 365 |
| Young population share1 | 39.07 | 2.74 | 34.16 | 49.01 | 2.55 | 496 |
FDI and the granting of green cards: country list.
| Albania, Algeria, Argentina, Armenia, Azerbaijan, Belarus, Bolivia, Bosnia-Herzegovina, Brazil, Bulgaria, Cambodia, Chile, Colombia, Costa Rica, Croatia, Cuba, Czech Republic, Dominican Republic, Ecuador, Egypt, Estonia, Georgia, Guatemala, Guyana, India, Indonesia, Islamic Republic of Iran, Jordan, Kazakhstan, Latvia, Lebanon, Macedonia, Madagascar, Mauritius, Mexico, Montenegro, Morocco, Namibia, Nicaragua, Niger, Pakistan, Panama, Paraguay, Peru, Philippines, Poland, Romania, Russia, Saudi Arabia, Serbia and Montenegro, Slovakia, South Africa, Sri Lanka, Syrian Arab Republic, Thailand, Trinidad and Tobago, Tunisia, Turkey, Uruguay, Venezuela |
FDI and the granting of green cards: summary statistics.
| Variable | Mean | Overall std. dev. | Min. | Max. | Between-country std. dev. | No. of observations |
| GDP per capita | 4,661.05 | 8,460.48 | 118.64 | 51,001.54 | 8,792.01 | 1,088 |
| Lack of civil liberties | 3.96 | 1.60 | 1 | 7 | 1.60 | 1,137 |
| Political repression | 4.16 | 1.99 | 1 | 7 | 1.96 | 1,137 |
| Educated workers3 | 7.02 | 23.99 | 0 | 234 | 28.80 | 290 |
| Population (total)1 | 39.58 | 126.77 | 1.02 | 1337.71 | 124.50 | 1,127 |
| Share of green cards2 | 0.72 | 1.86 | 0 | 20.66 | 1.80 | 1,131 |
| US FDI | 3,259.38 | 9,899.26 | –1,344 | 91,046 | 8,443.55 | 916 |
| US exports/GDP4 | 214.90 | 967.60 | 0.02 | 10,941.40 | 936.90 | 1,126 |
| US imports/GDP4 | 468.30 | 2,160.20 | 0 | 24,398 | 2,065.80 | 1,126 |
| Working age population share |
60.26 | 6.66 | 47.59 | 73.51 | 6.64 | 1,107 |
©2015 by De Gruyter
Articles in the same Issue
- Frontmatter
- Advances
- Turf and Illegal Drug Market Competition between Gangs
- Do Environmental Regulations Increase Bilateral Trade Flows?
- A Macroeconomic Model of Imperfect Competition with Patent Licensing
- Contributions
- Heterogeneous Effects of Informational Nudges on Pro-social Behavior
- Limiting Profit Shifting in a Model with Heterogeneous Firm Productivity
- Public Education, Accountability, and Yardstick Competition in a Federal System
- Social Status, Conspicuous Consumption Levies, and Distortionary Taxation
- Optimal Regulation of Invasive Species Long-Range Spread: A General Equilibrium Approach
- Cooperation or Competition? A Field Experiment on Non-monetary Learning Incentives
- Geographic Mobility and the Costs of Job Loss
- Supply Chain Control: A Theory of Vertical Integration
- Lexicographic Voting: Holding Parties Accountable in the Presence of Downsian Competition
- Topics
- The Transmission of Education across Generations: Evidence from Australia
- Tying to Foreclose in Two-Sided Markets
- Smoking within the Household: Spousal Peer Effects and Children’s Health Implications
- The Dynamics of Offshoring and Institutions
- Long-Run Effects of Catholic Schooling on Wages
- The Interdependence of Immigration Restrictions and Expropriation Risk
- The Effects of Extensive and Intensive Margins of FDI on Domestic Employment: Microeconomic Evidence from Italy
- Are You There God? It’s Me, a College Student: Religious Beliefs and Higher Education