Lung adenocarcinoma-specific three-integrin signature contributes to poor outcomes by metastasis and immune escape pathways
-
Yizhe Wang
 and
Chunlei Zheng
and
Chunlei Zheng

ABSTRACT
Background:
Inhibitors targeting integrins (ITGs) are applied as a novel strategy for cancers including lung cancer; however, the heterogeneity of ITG subunits might explain why ITG-targeted inhibitors only show limited efficacy for a small group of lung cancer patients.
Materials and methods:
RNA-Seq data of lung adenocarcinoma (LUAD) and lung squamous cell carcinoma (LUSC) patients were obtained from the TCGA database. Cox regression analysis was performed to construct the prognostic signature and generate the nomogram combined with pathologic stages (pStage). GEO datasets were used for verification. The related biological functions were analyzed by Gene Set Enrichment Analysis (GSEA) software and the TIMER database.
Results:
By Cox regression analysis of 30 ITG subunits, ITG subunit alpha 5 (ITGA5), ITG subunit alpha 6 (ITGA6), and ITG subunit alpha L (ITGAL) were identified as the prognostic factors in LUAD, which were included in the construction of a LUAD-specific 3-ITG signature. Following the calculation of risk score (RS) of each patient based on 3-ITG signature, patients with high RS in LUAD were found to exhibit worse prognosis, especially in early stage. Nomogram combined with RS and pStage could predict the prognosis of LUAD patients accurately. Mechanism exploration by GSEA showed that metastasis-related microenvironmental pathways were significantly enriched in the high-RS group. An elevated expression of ITGA5 was mainly associated with the promotion of cell migration and invasion, while the high expression of ITGAL had a strong positive correlation with the capability of recognizing and killing cancer cells.
Conclusions:
Three-ITG signature could improve the prediction ability combined with pStage in LUAD and might contribute to poor prognosis by metastasis and immune escape-related pathways.
INTRODUCTION
Integrins (ITGs), including 18 different α subunits and 8 β subunits, play an important role in the development and homeostasis of non-small-cell lung carcinoma (NCLC);[1-4] however, there is obvious heterogeneity in ITG subunits playing a crucial role in different subtypes of lung cancer. Furthermore, inhibitors targeting ITGs have attracted much attention as a new strategy for various types of tumors,[5] and several ongoing and completed clinical trials of cilengitide, the inhibitor targeting ITGs αvβ3 and αvβ5, showed its good effects in many types of tumors,[6] except NSCLC. The heterogeneity of expression and distinctly different biological roles of different ITG subunits in lung cancer might be one of the reasons leading to the different results obtained in these Phase I/II clinical studies.
In this study, by evaluating the relationship between the expression of ITG family genes and prognosis of NSCLC patients, we established the 3-ITG prognostic prediction signature and developed a nomogram combined with pathologic stages (pStage) to predict the prognosis of lung adenocarcinoma (LUAD) patients more precisely. Furthermore, biological pathway analysis indicated that mechanisms led to the poor prognosis of high-risk score (RS) LUAD patients. The present study significantly enhances the current understanding of ITG family genes in the prognosis prediction of LUAD patients and helps in preferential population screening for ITG-targeted therapy.
MATERIALS AND METHODS
Data collection and processing
RNA-Seq Gene sequencing data of TCGA (LUAD and lung squamous cell carcinoma [LUSC], version 20160128) were downloaded from the University of California, Santa Cruz (UCSC) Xena Database,[7] which was developed by UCSC computational genomics Laboratory. It included the mRNA expression profiles of 585 LUAD patients and 550 LUSC patients and had been normalized by Fragments Per Kilobase (FPKM) already. Through the “clusterProfiler” and “org.Hs.eg.db” packages in R, the Ensembl ID was converted to gene official symbols. The ITG subunits starting with the ITG of Homo sapiens were screened and 33 results were obtained (Table S1). Among these genes, three genes (“ITGAB2-AS1”, “ITGA6-AS1” and “ITGA9-AS1”) were noncoding RNAs and were excluded.
The survival data and phenotype information of these patients were also obtained from UCSC Xena Database. Overall survival (OS), which was defined as time from registration to death as a result of any cause, was the primary end point. Complete data of clinical pathology parameters and non-missing gene expression values were screened into subsequent analysis (Table 1). Missing values and ambiguous information, such as Tx, Nx, and Mx, were excluded when analyzed. Somatic mutations (SNPs and small INDELs) were also obtained from UCSC Xena database. The samples with any mutations in epidermal growth factor receptor (EGFR) or Kirsten rat sarcoma viral oncogene homolog (KRAS) or V-raf murine sarcoma viral oncogene homolog B1 (BRAF) or Tumor Protein P53 (TP53), regardless of the presence or not of a known driver of oncomutation, was identified as the sample with the corresponding specific gene mutation.
Microarray dataset GSE68465 used for verification was downloaded from the Gene Expression Omnibus (GEO) database (http://www.ncbi.nlm.nih.gov/geo/). This dataset contains gene expression and survival of LUAD patients from a multi-site, blinded validation study with complete clinicopathologic parameters of 439 cases.[8] The “Series Matrix File(s)” were downloaded and the expression profile matrix and clinicopathologic parameters were extracted. According to the platform of GPL96, the probes corresponded to gene official symbols by “hgu133a.db” package in R. When it comes to one gene corresponding to different probes, the average value was taken to get the unique expression value of that gene in every sample.
Clinicopathologic parameters of patients in the TCGA database
| Characteristics | Number (proportion, %) | |||
|---|---|---|---|---|
| LUAD (n = 513) | LUSC (n = 493) | |||
| Age (years) | <65 | 238 (46.4) | <68 | 234 (47.5) |
| ≥65 | 275 (53.6) | ≥68 | 259 (52.5) | |
| Gender | Male | 237 (46.2) | Male | 365 (74.0) |
| Female | 276 (53.8) | Female | 128 (26.0) | |
| T stage | T1 | 171 (33.3) | T1 | 114 (23.1) |
| T2 | 275 (53.6) | T2 | 286 (58.0) | |
| T3–T4 | 64 (12.5) | T3–T4 | 93 (18.9) | |
| Tx | 3 (0.06) | Tx | 0 (0.0) | |
| N stage | N0 | 336 (65.5) | N0 | 316 (64.1) |
| N1–N3 | 165 (32.2) | N1–N3 | 172 (34.9) | |
| Nx | 12 (2.3) | Nx | 5 (1.0) | |
| M stage | M0 | 347 (67.6) | M0 | 407 (82.6) |
| M1 | 24 (4.7) | M1 | 9 (1.8) | |
| Mx | 142 (27.7) | Mx | 77 (15.6) | |
| pStage | I | 281 (54.8) | I | 241 (48.9) |
| II | 119 (23.2) | II | 158 (32.0) | |
| III or IV | 105 (20.5) | III or IV | 90 (18.3) | |
| Not reported | 8 (1.6) | Not reported | 4 (0.8) | |
| EGFR status# | Mutant | 75 (14.6) | – – | – – |
| Wild type | 438 (85.4) | – – | – – | |
| KRAS status# | Mutant | 333 (64.9) | – – | – – |
| Wild type | 180 (35.1) | – – | – – | |
| BRAF status# | Mutant | 40 (7.8) | – – | – – |
| Wild type | 473 (92.2) | – – | – – | |
| TP53 status# | Mutant | 258 (50.3) | – – | – – |
| Wild type | 255 (49.7) | – – | – – | |
Construction of ITG signature model based on COX regression analysis
The “glmnet” package in R was used to perform the COX regression analysis.[9] To screen the prognostic factors for LUAD and LUSC, all ITG genes were subjected to univariate COX regression analysis and the genes with P < 0.05 were chosen for multivariate COX regression analysis. The genes with P < 0.05 were identified as the independent prognostic factors. Then, based on the weighted gene expression value of the independent prognostic factors selected above, the RS was calculated by the following formula:
“Exp” indicates the expression level of ITG and “β” indicates the regression coefficient obtained by multivariate COX regression analysis.
The best cutoff value of RS was calculated by X-tile software (version 3.6.1),[10] and patients were divided into high-RS group and low-RS group according to the cutoff value. Kaplan–Meier method was performed to show the correlation between different groups and survival, and the log-rank test was used to analyze the differences between groups by the package “survival” in R.
Establishment and validation of nomogram prognostic prediction model
The nomogram prognostic prediction model involving important parameters of clinicopathologic characteristics was established, and calibration curves were used to evaluate the 1-, 3- or 5-year performance of this model by the “rms” package. C-index of this model was calculated with “boot” package, and receiver operating characteristic (ROC) analysis was also performed to estimate the accuracy of the nomogram for different time points’ survival prediction using the “survival ROC” package of R.
Biological function analysis
To explore the biological function, Gene Set Enrichment Analysis (GSEA) was performed with the GMT file (c2.KEGG.v6.2 and h.all.v7.1) gene set to obtain the biological processes downloaded from GSEA website (http://www. broad.mit.edu/gsea/) according to the manufacturer’s specifications.[11] Normalized enrichment score (NES) >1.5 and P < 0.05 were defined as the significant enrichment pathways.
Immune infiltration analysis
TIMER (https://cistrome.shinyapps.io/timer/), a database designed for analyzing immune cell infiltrates in cancers,[12] was used to estimate tumor immune infiltration in immune cells. Differences in selected ITGs’ (ITG subunit alpha 5 [ITGA5], ITG subunit alpha 6 [ITGA6], and ITG subunit alpha L [ITGAL]) expression levels in immune cells (CD4/CD8 T cells and dendritic cells) of LUAD were compared in the “Gene” section on the web page. The association between the expression of ITGAL and the infiltration degree of particular immune cell subsets was analyzed by TIMER in the “Correlation” section, without correlation-adjusted criteria.
Statistical analyses
All statistical analyses in the whole study were performed using R software (v3.6.3). Wilcoxon test was used to compare the expression level of genes between tumor and normal tissues. Relationship between RS and clinicopathologic parameters was analyzed by chi-square test with the package “stats” in R. Pearson correlation was utilized to identify the relationship between immunologic markers and 3-ITGs. P < 0.05 was defined as statistically significant.
RESULTS
Differential expression of ITGs in lung cancer patients
To investigate the role of ITG family genes in lung cancer, we analyzed the expression of all 30 ITGs in tumor tissues and normal tissues in LUAD and LUSC, respectively, using TCGA database. The expression of multiple ITGs was significantly different both in LUAD and LUSC (Figure 1A). In detail, ITG subunit alpha 2 (ITGA2), ITGA5, ITGA6, ITG subunit alpha 11 (ITGA11), ITG subunit alpha V (ITGAV), integrin subunit beta 1 binding protein 1 (ITGB1BP1), integrin subunit beta 1 binding protein 2 (ITGB1BP2), integrin subunit beta 3 binding protein (ITGB3BP), integrin subunit beta 4 (ITGB4), integrin subunit beta 5 (ITGB5) and integrin subunit beta 8 (ITGB8) were significantly more highly expressed in LUSC than in normal tissues (Figure 1B), while most ITGs were significantly expressed to a greater extent in normal tissues than LUAD, except for ITGA11, ITGA2, ITGAV, ITGB1BP1, ITGBIBP2, ITGB3BP3, ITGB4, ITGB5, integrin subunit beta 7 (ITGB7) and ITGB8 (Figure 1C), indicating that different subunits were involved in the development of particular lung cancer types.

The expression pattern of integrin family genes of NSCLC patients in TCGA. (A) Heatmap of the differential expression of integrins between NSCLC and adjacent noncancerous tissues. Boxplot of the differential expression of integrins between (B) LUSC or (C) LUAD and adjacent normal tissues.
Construction of LUAD-specific 3-ITG prognostic RS signature
To identify the key ITGs affecting prognosis, we performed univariate and multivariate Cox regression analyses. By univariate Cox regression analysis, six prognosis-related ITG candidates, including ITGA2, ITGA5, ITGA6, ITGAL, ITGB1 and ITGB4, were identified as prognosis-related genes in LUAD, while ITGB6 was the only ITG subunit that could serve as a prognostic factor in LUSC (P < 0.05; Table 2).
Univariate Cox regression analysis of integrins and overall survival in LUAD and LUSC
| Characteristics | LUAD | LUSC | |||||
|---|---|---|---|---|---|---|---|
| HR | 95% CI | P | HR | 95% CI | P | ||
| ITGA1 | 1.044 | 0.863–1.262 | 0.658 | 1.225 | 0.966–1.553 | 0.094 | |
| ITGA10 | 1.010 | 0.776–1.315 | 0.940 | 1.281 | 0.798–2.054 | 0.304 | |
| ITGA11 | 1.082 | 0.955–1.226 | 0.217 | 1.026 | 0.907–1.159 | 0.681 | |
| ITGA2 | 1.004 | 1.000–1.101 | 0.024 | * | 0.977 | 0.855–1.1 17 | 0.738 |
| ITGA2B | 0.841 | 0.576–1.225 | 0.366 | 0.972 | 0.655–1.440 | 0.886 | |
| ITGA3 | 1.060 | 0.921–1.218 | 0.417 | 1.075 | 0,953–1.307 | 0.063 | |
| ITGA4 | 0.983 | 0.932–1.014 | 0.237 | 1.142 | 0.940–1.387 | 0.181 | |
| ITGA5 | 1.253 | 1.086–1.444 | 0.002 | ** | 1.024 | 0.862–1.217 | 0.783 |
| ITGA6 | 1.282 | 1.138–1.442 | 0.000 | *** | 1.048 | 0.932–1.177 | 0.432 |
| ITGA7 | 0.873 | 0.684–1.113 | 0.274 | 1.217 | 0.962–1.537 | 0.101 | |
| ITGA8 | 0.952 | 0.625–1.104 | 0.113 | 1.178 | 0.961–1.443 | 0.115 | |
| ITGA9 | 0.989 | 0.966–1.021 | 0.156 | 1.087 | 0.895–1.321 | 0.400 | |
| ITGAD | 0.511 | 0.246–1.058 | 0.071 | 0.865 | 0.447–1.669 | 0.665 | |
| ITGAE | 0.862 | 0.649–1.144 | 0.306 | 0.913 | 0.689–1.211 | 0.529 | |
| ITGAL | 0.792 | 0.676–0.928 | 0.004 | ** | 1.000 | 0.871–1.146 | 0.995 |
| ITGAM | 0.879 | 0.762–1.013 | 0.077 | 1.114 | 0.969–1.280 | 0.126 | |
| ITGAV | 1.142 | 0.972–1.339 | 0.105 | 0.986 | 0.834–1.166 | 0.871 | |
| ITGAX | 0.951 | 0.930–1.092 | 0.124 | 1.089 | 0.937–1.264 | 0.266 | |
| ITGB1 | 1.245 | 1.081–1.355 | 0.020 | ** | 0.952 | 0.641–1.203 | 0.517 |
| ITGB1BP1 | 1.038 | 0.748–1.440 | 0.822 | 0.879 | 0.634–1.218 | 0.440 | |
| ITGB1BP2 | 0.692 | 0.386–1.239 | 0.216 | 0.931 | 0.538–1.612 | 0.799 | |
| ITGB2 | 0.925 | 0.822–1.040 | 0.196 | 1.681 | 0.492–5.732 | 0.407 | |
| ITGB3 | 0.979 | 0.821–1.166 | 0.808 | 1.040 | 0.923–1.173 | 0.518 | |
| ITGB3BP | 0.961 | 0.735–1.256 | 0.773 | 1.220 | 0.924–1.610 | 0.161 | |
| ITGB4 | 1.195 | 1.075–1.328 | 0.001 | *** | 0.843 | 0.617–1.151 | 0.283 |
| ITGB5 | 1.148 | 0.938–1.404 | 0.180 | 1.047 | 0.928–1.181 | 0.455 | |
| ITGB6 | 0.996 | 0.881–1.127 | 0.952 | 1.16 | 1.015–1.326 | 0.029* | |
| ITGB7 | 1.392 | 0.998–1.686 | 0.051 | 1.023 | 0.991–1.236 | 0.417 | |
| ITGB8 | 1.037 | 0.917–1.172 | 0.559 | 1.037 | 0.813–1.323 | 0.768 | |
| ITGBL1 | 0.904 | 0.775–1.054 | 0.199 | 0.940 | 0.814–1.085 | 0.399 |
The subsequent multivariate Cox regression analysis result showed that ITGA5 and ITGA6 were the prognostic risk factors, whereas ITGAL was a prognostic protective factor (Figure 2A). Then, according to the expression of ITGA5, ITGA6 and ITGAL, as well as their corresponding coefficients, the 3-ITG signature for prognostic prediction was constructed. The RS for LUAD patients was calculated as follows:
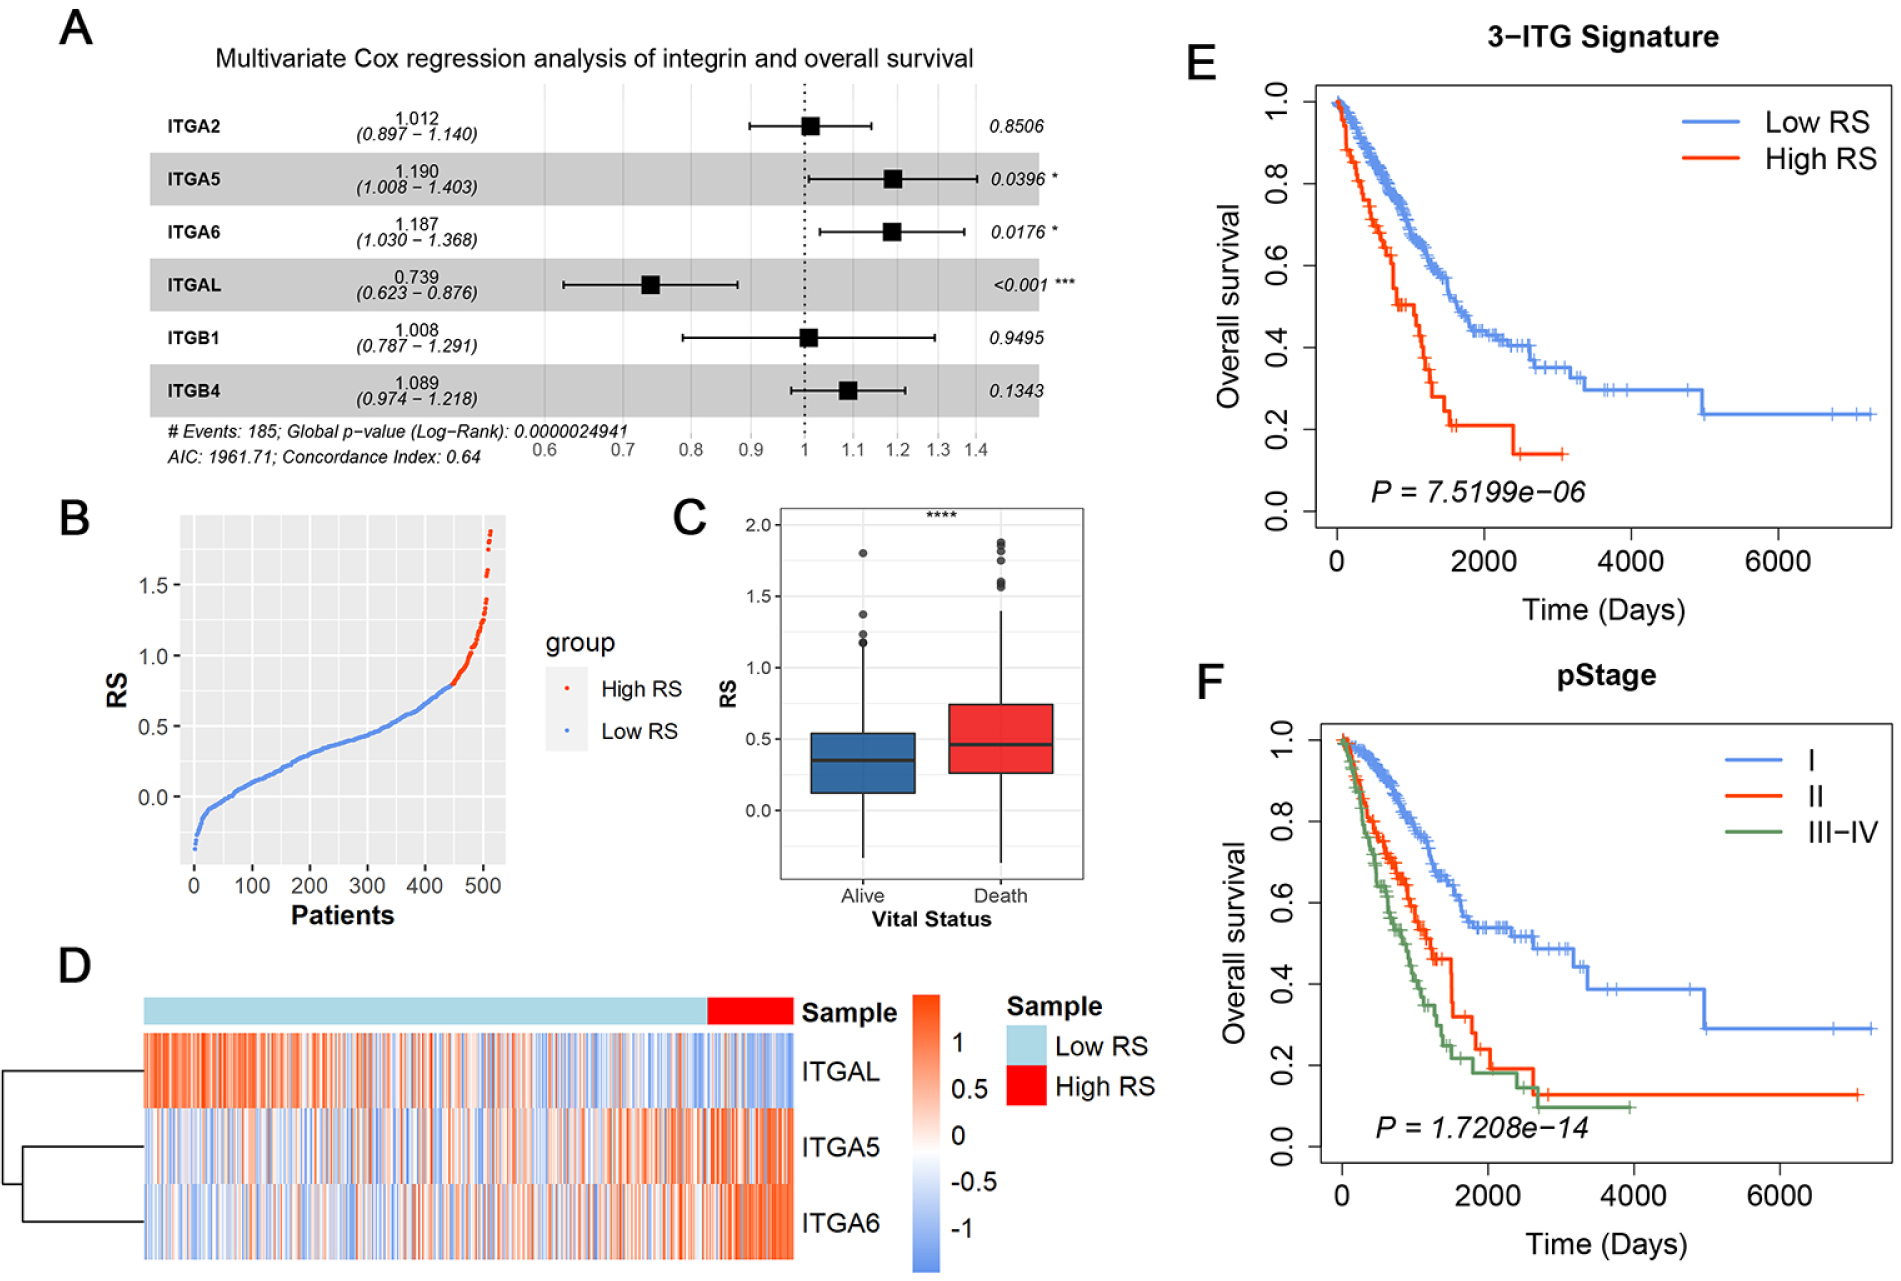
The construction of 3-ITG prognostic signature. (A) Multivariate Cox regression analysis of six robust integrins. (B) The distribution of RS of patients in TCGA. (C) The boxplot of RS between alive and dead patients. (D) Heatmap for the expression of integrins in the 3-ITG signature. Kaplan–Meier (KM) curve of overall survival probability based on the (E) RS or (F) pathologic stages in LUAD.
The RS of each sample in TCGA-LUAD was calculated accordingly. After identification of 4.4 as the best cutoff value of RS using X-tile software according to the survival event probability, all samples were divided into a high-RS group and a low-RS group. Figure 2B illustrates the RS distribution of each patient; Figure 2C shows the RS distribution between those in the surviving group and in the death group.
Furthermore, the Kaplan–Meier analysis showed that patients in the high-RS group presented a remarkably shorter OS than those in the low-RS group (hazard ratio [HR] = 2.18, 95% confidence interval [CI] = 1.54–3.09, P < 0.001; Figure 2D). Besides this, the differential survival outcomes among various pStages showed that only pStage was a prognostic RF (Figures 2E and S1).
The prognostic prediction efficiency of ITGB6 was also assessed in LUSC, but both Kaplan–Meier analysis results (Figure S2A) and ROC curve (Figure S2D) criteria were unsatisfactory. Instead, the classical pStage (Figure S2B) and T stage (Figure S2C) were found as being suitable for prediction and better prognosis, indicating that ITGs were not the predominant molecules of LUSC.
Establishment of the prognostic predictive nomogram model based on 3-ITG signature in LUAD
To further evaluate the combination prognostic predictive efficiency of 3-ITG signature and pStage, a nomogram model based on these two predictive factors was established (Figure 3A) with a C-index of 0.704 (95% CI = 0.662-0.746) determined by internal verification. The calibration curve and the actual observation showed certain consistency at different time points (1, 3 and 5 years) (Figure 3B-D). Moreover, the predictive ability of prognostic value presented by ROC curves showed a satisfactory improvement of up to 4%–6% compared with classical grouping methods (Figure 3E-G), especially in terms of 1-year risk prediction. Taken together, these data suggested that the introduction of RS combined with the current pStage was a better indicator than the use of classic staging for predicting the OS of LUAD patients.

Construction and identification of nomogram model 3-ITG signature combined with pathologic stages. (A) Nomogram for overall survival probability predicting. Calibration plots for (B) 1-year, (C) 3-year and (D) 5-year survival probabilities of the nomograms. Receiver operating characteristic (ROC) curves of nomogram model, 3-ITG signature, or pathologic stage individual for (E) 1-year, (F) 3-year and (G) 5-year survival probabilities by.
Stratification analysis of prognostic prediction of 3-ITG signature on clinicopathologic parameters
Although other clinicopathologic parameters were not included in the construction of the nomogram, the relationships between RS and these parameters were analyzed by chi-square testing. The results showed that a high RS was positively associated with T stage (P = 0.008) and N stage (P = 0.021; Table 3), suggesting that RS-based 3-ITG signature may result in poor prognosis by promoting proliferation and metastasis in LUAD.
The correlation between RS and clinicopathologic parameters
| Characteristics | Total | Low RS, n (%) | High RS, n (%) | P | |
|---|---|---|---|---|---|
| Total | 513 | 445 (86.7) | 68 (13.3) | ||
| Gender | Male | 237 | 201 (84.8) | 36 (15.2) | 0.231 |
| Female | 276 | 244 (88.4) | 32 (11.6) | ||
| Age (years) | <65 | 238 | 207 (87.0) | 31 (13.0) | 0.886 |
| ≥65 | 275 | 238 (86.5) | 37 (13.5) | ||
| T stage | T1 | 171 | 160 (93.6) | 11 (6.4) | 0.008** |
| T2 | 275 | 231 (84.0) | 44 (16.0) | ||
| T3–T4 | 64 | 51 (79.7) | 13 (20.3) | ||
| Tx | 3 | 3 (100.0) | 0 (0.0) | ||
| N stage | N0 | 336 | 299 (89.0) | 37 (11.0) | 0.021* |
| N1–N3 | 165 | 134 (81.2) | 31 (18.8) | ||
| Nx | 12 | 0 (100.0) | 12 (0.0) | ||
| M stage | M0 | 347 | 295 (85.0) | 52 (15.0) | 0.054 |
| M1 | 24 | 19 (79.2) | 5 (20.8) | ||
| Mx | 142 | 131 (92.3) | 11 (7.7) | ||
| EGFR mutant | Yes | 75 | 65 (86.7) | 10 (13.3) | 0.983 |
| No | 438 | 380 (86.8) | 58 (13.2) | ||
| BRAF mutant | Yes | 40 | 36 (34.7) | 4 (5.3) | 0.527 |
| No | 473 | 409 (86.5) | 64 (13.5) | ||
| KRAS mutant | Yes | 333 | 294 (88.3) | 39 (11.7) | 0.161 |
| No | 180 | 151 (83.9) | 29 (16.1) | ||
| TP53 mutant | Yes | 258 | 218 (84.5) | 40 (15.5) | 0.131 |
| No | 255 | 227 (89.0) | 28 (11.0) |
Further survival analysis of clinicopathologic parameters’ stratification was also performed. The survival time of patients with high RS was significantly shorter than that of patients with low RS in Stage I LUAD (Figure 4A), while no significant difference was seen in Stage II (Figure 4B) or stages III and IV (Figure 4C). Similarly, the 3-ITG signature performed better in T2 (Figure 4E), N0 (Figure 4G), and M0 (Figure 4I) stages. These results suggested that use of the 3-ITG signature tended to be able to predict the prognosis accurately in the early stage.

Kaplan–Meier curves of overall survival probability based on the RS in LUAD with different stages: (A) pStage I, (B) pStage II, (C) pStage III–IV, (D) T1 stage, (E) T2 stage, (F) T3–T4 stage, (G) N0 stage, (H) N1 stage, (I) M0 stage, (J) M1 stage.
Gene mutation plays a central role in diverse diseases.[13] We also performed survival analysis on gene mutation stratification of TP53, KRAS, EGFR and BRAF. Independent of the absence or presence of KRAS mutation, the OS of high-RS patients was shorter than that of low-RS patients, indicating that no relationship existed between KRAS mutant status and ITG signature (Figure S3A, B); however, ITGs signature exhibited different prognostic prediction effects in patients with different mutant statuses of TP53, EGFR and BRAF. In the population of patients with TP53 mutant genes (Figure S3C), EGFR wild type (WT) (Figure S3F) and BRAF WT (Figure S3H), high-RS patients had a significantly worse prognosis than low-RS patients; whereas for patients with TP53 WT (Figure S3D), EGFR mutant (Figure S3E) or BRAF mutant (Figure S3G), the predictive function of 3-ITG signature disappeared, indicating that the 3-ITG signature played a critical role in prognostic prediction under the special background of specific tumor mutations.
Taken together, high RS according to 3-ITG signature was a risk prognostic factor, especially in patients with Stage I, demonstrating that 3-ITG RS signature might be an early optical biomarker for predicting prognosis of LUAD patients.
External validation in GEO datasets for LUAD-specific 3-ITG prognostic signature and nomogram model based on 3-ITG signature and pStage
To assess the prognostic prediction ability of the 3-ITG prognostic signature in LUAD, the GSE68465 dataset with microarray data of 439 patients with LUAD was selected as the validation dataset (Table 4). The RS of each LUAD sample based on the expression value of three ITGs (“ITGA5”, “ITGA6” and “ITGAL”) was calculated according to 3-ITG signature formula. All samples were divided into high-RS group and low-RS group according to the best cutoff value (Figure 5A). The expressions of ITGA5 and ITGA6 were upregulated in patients with a high score, while there tended to be low expression of ITGAL in LUAD patients with a high score (Figure 5B). The Kaplan–Meier curve further confirmed that survival of the high-RS group was significantly shorter than that of low-RS group (HR = 1.89, 95% CI = 1.35–2.64, P < 0.001; Figure 5C). Besides, the use of pStage was efficacious in prediction of the OS by Kaplan–Meier analysis (Figure 5D).
Clinicopathologic parameters of patients in the GSE68465 database
| Characteristics | Number (proportion, %) | |
|---|---|---|
| LUAD (n = 439) | ||
| Age (years) | <65 | 212 (48.3) |
| ≥65 | 227 (51.7) | |
| Gender | Male | 221 (50.3) |
| Female | 218 (49.7) | |
| T stage | T1 | 149 (33.9) |
| T2 | 251 (57.2) | |
| T3 | 28 (6.4) | |
| T4 | 11 (2.5) | |
| N stage | N0 | 299 (68.1) |
| N1 | 87 (19.8) | |
| N2 | 53 (12.1) | |
| pStage | I | 114 (26.0) |
| II | 257 (58.5) | |
| III | 68 (15.5) | |

External validation of nomogram model in GSE68465. (A) The distribution of RS. (B) The boxplot of RS between alive and dead patients. (C) Heatmap for the expression of three integrins. (D) Kaplan–Meier curve for 3-ITG signature (top) and pStage (bottom). The calibration plots of nomogram model for (E) 1-year, (F) 3-year, and (G) 5-year survival probabilities. ROC curves of nomogram model and pathologic stage or RS individually for (H) 1-year, (I) 3-year, and (J) 5-year survival probabilities.
Next, GSE68465 datasets were also utilized to validate the nomogram model based on 3-ITG signature and pStage. By external verification, C-index of this nomogram model was 0.671 (95% CI = 0.636–0.707) and the calibration curve almost overlapped the plot of real observations, in particular, it overlapped the 5-year prediction (Figure 5E-G). The ROC curve could be used to further evaluate the prediction capacity of survival using RS combined with pStage or individual data at different times. Prognostic prediction by the nomogram model of combination was more efficacious than each individual method for either 1, 3, or 5 years, with all scores improved to greater than 0.7 (Figure 5H-J). All these results indicated that the nomogram model based on 3-ITG signature and pStage could predict the prognosis of LUAD patients well, which is an applicable supplement for classical staging methods.
Biological pathway enrichment of patients with high RS in LUAD
To reveal the possible mechanisms of high RS according to 3-ITG signature associated with a poor prognosis, we performed GSEA analysis using the KEGG and HALLMARK pathway sets on LUAD both in TCGA and GSE68465 datasets (Table S2). Compared with the low-RS LUAD group, the high-RS group exhibited comprehensive enrichment of 11 pathways (NES > 1.5, P < 0.05) in both datasets of patients with high RS, and Figure 6A and B shows six pathways in which the NES was over 2.0 in one of the datasets, including the pathways related to cell adhesion and migration capability (such as “ECM_RECEPTOR_INTERACTION”, “APICAL_JUNCTION” and “EPITHELIAL_MESENCHYMAL_TRANSITION”), resistance in hypoxic conditions (“HYPOXIA”), proliferation and differentiation (“TGF_BETA_SIGNALING”), angiogenesis (“ANGIOGENESIS”), and others (“SMALL_CELL_LUNG_CANCER”, “PATHWAYS_IN_CANCER” and “ARRHYTHMOGENIC_RIGHT_VENTRICULAR_CARDIOMYOPATHY_ARVC”). Therefore, the complex mechanisms for poor prognosis of high-RS group strongly suggested differential function and the combined effect of three individual ITGs in the signature.

Functional enrichment analysis by GSEA and identification of individual gene function. Functional enrichment pathways in patients with high risk score in (A) TCGA and (B) GSE68465. Kaplan–Meier curve for verification of survival by the expression of (C) ITGA5, (D) ITGA6, and (E) ITGAL in LUAD patients in TCGA. Functional enrichment pathways in patients with high expression of (F) ITGA5 in TCGA, (G) ITGA5 in GSE68465, (H) ITGAL in TCGA, and (I) ITGAL in GSE68465.
We next ascertained the potential function of three ITGs in malignant biological properties, respectively. Firstly, all three ITGs were found to be prognostic for OS both in TCGA (Figure 6C-E) and GSE68465 (Figure S4A) to some extent. Besides, patients with a high expression of ITGA5 or ITGA6 had a shorter OS, while patients with a high expression of ITGAL had better prognosis. According to the best cutoff value of each molecule, the datasets were further divided into a high-expression group and a low-expression group, where upon GSEA was performed. The results showed that 14 pathways were enriched in high-ITGA5 expression groups (Figure 6F, G) and 33 pathways in high-ITGAL expression groups (Figure 6H, I), while only one common pathway was enriched in high-ITGA6 expression groups (Figure S4B, C). Surprisingly, the enrichment results exhibited distinct biological characteristics. Pathways enriched in high-ITGA5 expression group were mostly related to the function of cell migration and invasion facilitating metastasis (i.e., “ECM_RECEPTOR_INTERACTION”, “APICAL_JUNCTION”, “EPITHELIAL_MESENCHYMAL_TRANSITION”, “HYPOXIA”, “FOCAL_ADHESION”, “REGULATION_OF_ACTIN_CYTOSKELETON”), while pathways enriched in high-ITGAL expression group were mostly associated with immune cell recognition and killing (i.e., “T_CELL_RECEPTOR_SIGNALING_PATHWAY”, “COMPLEMENT”, “IL2_STAT5_SIGNALING”, “CHEMOKINE_SIGNALING_PATHWAY”, “INFLAMMATORY_RESPONSE”, “NATURAL_KILLER_CELL_MEDIATED_CYTOTOXICITY”). These results indicated that high-ITGA5 expression groups had a poorer prognosis owing to the increased ability of metastasis, while an elevated activation of inflammatory/immune cells might be the reason for those in high-ITGAL groups having a better prognosis.
Recently, accumulating evidence demonstrates that ITGs are emerging as important regulators of immune cell signaling.[14,15] Thus, it is important to identify which subunits of ITG correlated with poor prognosis were mainly involved in the immune mechanism of LUAD. By analyzing the expression level of three ITGs of 3-ITG in immune cells associated with the recognition of tumor, it was found that only ITGAL had a strong correlation with a correlation coefficient (Cor) >0.5 and P < 0.05 (Figure 7A–C). This finding was consistent with the results of GSEA analysis in high-ITGAL groups. Furthermore, we ascertained the relevance between expression of ITGAL and representative biomarkers of immune cells (Table 5). ITGAL showed a strong positive correlation with genes related to immune surveillance and recognition (Figure 7D), especially with CD3E and CD2 of CD4+ T cells (Cor > 0.8).

Comprehensive analysis of tumor-infiltrating immune cells in LUAD. Expression levels of (A) ITGA5, (B) ITGA6, and (C) ITGAL in CD4+ T cells, CD8+ T cells, and dendritic cells. (D) Scatterplots of correlations between ITGAL expression and gene markers of T cells.
The correlation between expression of ITGAL and biomarkers in immune cells
| Description | Gene markers | Pearson correlation coefficient | P |
|---|---|---|---|
| CD4+ T cell | CD3D | 0.752 | *** |
| CD3E | 0.870 | *** | |
| CD2 | 0.855 | *** | |
| CD8+ T cell | CD8A | 0.713 | *** |
| CD8B | 0.604 | *** | |
| Dendritic cell | HLA-DPB1 | 0.705 | *** |
| HLA-DQB1 | 0.545 | *** | |
| HLA-DRA | 0.640 | *** | |
| HLA-DPA1 | 0.685 | *** | |
| CD11c (ITGAX) | 0.773 | *** | |
| T-cell exhaustion | PD-1 (PDCD1) | 0.743 | *** |
| CTLA4 | 0.759 | *** | |
| LAG3 | 0.654 | *** | |
| TIM-3 (HAVCR2) | 0.686 | *** |
Taken together, these results suggest that in the 3-ITG signature, ITGA5 and ITGA6 mostly govern cell adhesion (as reported) and promote proliferation or phenotypic transformation of LUAD, while reduction of ITGAL helps the tumor cells to escape immune control. Finally, three ITGs operate together and lead to the poor prognosis of patients with high RS according to 3-ITG signature.
DISCUSSION
It was found in the current study that the key ITGs between LUAD and LUSC were significantly different. In LUAD, we identified 3-ITG signature leading to poor prognosis of LUAD by multiple mechanisms and established a LUAD-specific 3-ITG signature-based model to improve the prognostic predictive ability of classic clinical staging; however, in LUSC, only ITGB6 could affect the prognosis, indicating that the ITG family may not be the most important gene family. These results demonstrated the significant pathologic heterogeneity of ITGs in NSCLC and highlighted the importance of the use of a more detailed ITG signature in improving the accuracy of prognosis prediction of lung cancer.
In recent years, signatures focusing on genes with specific characteristics or belonging to the same family have been considered as a potential tool for personalized medicine. For example, hypoxia-related prognostic signatures were emerged to find suitable patients for targeted therapy of hypoxia-inducible factors.[16,17] The immune signature identified novel targets and was exploited for immunotherapies to predict the benefit of immunotherapeutic drugs.[18-20] Currently, noncoding RNA is also being reported as an effective cancer biomarker;[21] these signatures provided clues for both precise individual clinical treatment and drug development and also provided the basis for the inclusion and exclusion criteria of the population for clinical trials of new targeted drugs. In the present study, we focused on the ITG family, which is considered as one of the important families for cellular biological behaviors;[22,23] however, our results demonstrated that only ITGA5, ITGA6, and ITGAL were the prognostic factors in LUAD. We then constructed the ITG-related prognostic signature in LUAD patients including these three genes for the first time. External verification further confirmed that the 3-ITG signature combined with pStage could improve the prognostic prediction of LUAD, providing clues for its potential clinical application. Our findings also indicated that the high-RS LUAD patients would obtain more benefit on survival from more active and early treatments.
As transmembrane cell surface receptors, ITGs are critically positioned for cellular–extracellular interactions and play important roles in cancer cell invasion and signaling transduction required for metastasis.[24] Consistent with the well-known functions of ITGs, our pathway enrichment analysis found that high-RS groups defined by the 3-ITG signature were significantly enriched in multiple pathways related to malignant biological properties, such as cell adhesion, immune infiltration, angiogenesis, hypoxia rescue, and so on. Notably, patients with high ITGA5 expression showed significant enrichment of pathways promoting cell migration and invasion, while only one pathway related to the presence of a tumor was commonly enriched in patients with ITGA6 expression; however, the high expression of ITGA6 could be used to predict a poor outcome by Kaplan–Meier analysis (Figures 6D and S4A), indicating that ITGA6 is an indispensable biomarker in prediction of the prognosis of LUAD patients with somewhat important biological pathways not included in HALLMARK or KEGG pathway databases, which warrants further investigation. Moreover, an important hallmark of tumor cells is their ability to evade immune recognition,[25] which depends greatly on the cross-talk of regulators on the tumor surface, and ITGs are emerging as important regulators of immune cell signaling.[14] ITGAL, also called CD11a, binds to ITG β2 (CD18) to construct lymphocyte function-associated antigen-1, which is a key T-cell ITG of leukocyte-specific ITGs regulating T-cell activation and migration.[26] Our enrichment results implied that the high expression of ITGAL could increase the capability of recognizing and killing cancer cells, while a low expression of ITGAL leads to poor prognosis because of immune escape.
ITG antagonists were shown to prevent ITG signaling and suppress cancer metastasis in preclinical studies.[27] Several clinical trials on ITG-targeting drugs are ongoing and preliminary results[28–30] are available; however, the effects of ITG inhibitors in lung cancer still remain to be determined. The present study indicated that the 3-ITG signature had a remarkable predictive significance in early stage, and inhibitors targeting these three ITGs might have a better therapeutic effect for patients with high RS. Besides, ITGAL deserves more attention because it might be a crucial juncture at which a tumor could evade recognition and for the killing of immune cells in LUAD, and might be a potentially sensitive biomarker for immunotherapy. Our 3-ITG signature may facilitate the identification of the LUAD patients who may benefit from ITG-targeting drugs and guides the selection of corresponding inhibitors targeting the specific ITG.
Source of Funding
-
Thanks for the funding from the National Natural Science Foundation of China (Grant No. 81972197, No. 81472193), the Key Research and Development Program of Liaoning Province (Grant No. 2018225060), the Natural Science Foundation of Liaoning Province (Grant No. 2019-ZD-777), the Technological Special Project of Liaoning Province of China (Grant No. 2019020176-JH1/103), the Science and Technology Plan Project of Liaoning Province (Grant No. 2013225585), and the Science and Technology Plan Project of Shenyang City (Grant No. 19-112-4-099).
Conflicts of Interest
-
The authors have no conflicts of interest to declare.
REFERENCES
1. Hynes RO. Integrins: bidirectional, allosteric signaling machines. Cell 2002;110:673-87.10.1016/S0092-8674(02)00971-6Search in Google Scholar
2. Hong SK, Lee H, Kwon OS, Song NY, Lee HJ, Kang S, et al. Large-scale pharmacogenomics based drug discovery for ITGB3 dependent chemoresistance in mesenchymal lung cancer. Mol Cancer. 2018;17:175.10.1186/s12943-018-0924-8Search in Google Scholar PubMed PubMed Central
3. Kanda R, Kawahara A, Watari K, Murakami Y, Sonoda K, Maeda M, et al. Erlotinib resistance in lung cancer cells mediated by integrin beta1/Src/Akt-driven bypass signaling. Cancer Res. 2013;73:6243-53.10.1158/0008-5472.CAN-12-4502Search in Google Scholar PubMed
4. Ju L, Zhou C, Li W, Yan L. Integrin beta1 over-expression associates with resistance to tyrosine kinase inhibitor gefitinib in non-small cell lung cancer. J Cell Biochem. 2010;111:1565-74.10.1002/jcb.22888Search in Google Scholar PubMed
5. Desgrosellier JS, Cheresh DA. Integrins in cancer: biological implications and therapeutic opportunities. Nat Rev Cancer 2010;10:9-22.10.1038/nrc2748Search in Google Scholar PubMed PubMed Central
6. Scaringi C, Minniti G, Caporello P, Enrici RM. Integrin inhibitor cilengitide for the treatment of glioblastoma: a brief overview of current clinical results. Anticancer Res 2012;32:4213-23.Search in Google Scholar
7. Goldman MJ, Craft B, Hastie M, Repečka K, McDade F, Kamath A, et al. Visualizing and interpreting cancer genomics data via the Xena platform. Nat Biotechnol 2020;38:675-8.10.1038/s41587-020-0546-8Search in Google Scholar PubMed PubMed Central
8. Shedden K, Taylor JM, Enkemann SA, Tsao MS, Yeatman TJ, Gerald WL, et al. Gene expression-based survival prediction in lung adenocarcinoma: a multi-site, blinded validation study. Nat Med 2008;14:822-7.10.1038/nm.1790Search in Google Scholar PubMed PubMed Central
9. Friedman J, Hastie T, Tibshirani R. Regularization paths for generalized linear models via coordinate descent. J Stat Softw 2010;33:1-22.10.18637/jss.v033.i01Search in Google Scholar
10. Camp RL, Dolled-Filhart M, Rimm DL. X-tile: a new bio-informatics tool for biomarker assessment and outcome-based cut-point optimization. Clin Cancer Res 2004;10:7252-9.10.1158/1078-0432.CCR-04-0713Search in Google Scholar PubMed
11. Mootha VK, Lindgren CM, Eriksson KF, Surbramanian A, Sihag S, Lehar J, et al. PGC-1alpha-responsive genes involved in oxidative phosphorylation are coordinately downregulated in human diabetes. Nat Genet 2003;34:267-73.10.1038/ng1180Search in Google Scholar PubMed
12. Li T, Fan J, Wang B, Traugh N, Chen Q, Liu JS, et al. TIMER: A web server for comprehensive analysis of tumor-infiltrating immune cells. Cancer Res 2017;77:e108-10.10.1158/0008-5472.CAN-17-0307Search in Google Scholar PubMed PubMed Central
13. Yıldız E, Türkmen FM. Factor V Leiden mutation frequency and geographical distribution in Turkish population. J Transl Int Med. 2020 Dec 31;8:268-27310.2478/jtim-2020-0040Search in Google Scholar PubMed PubMed Central
14. Nolte MA, Margadant C. Activation and suppression of hematopoietic integrins in hemostasis and immunity. Blood 2020;135:7-16.10.1182/blood.2019003336Search in Google Scholar PubMed
15. Nolte M, Margadant C. Controlling immunity and inflammation through integrin-dependent regulation of tgf-beta. Trends Cell Biol 2020;30:49-59.10.1016/j.tcb.2019.10.002Search in Google Scholar PubMed
16. Yang L, Roberts D, Takhar M, Erho N, Bibby BAS, Thiruthaneeswaran N, et al. Development and validation of a 28-gene hypoxia-related prognostic signature for localized prostate cancer. EBioMedicine 2018;31:182-9.10.1016/j.ebiom.2018.04.019Search in Google Scholar PubMed PubMed Central
17. Bhandari V, Hoey C, Liu LY, Lalonde E, Ray J, Livingstone J, et al. Molecular landmarks of tumor hypoxia across cancer types. Nat Genet 2019;51:308-18.10.1038/s41588-018-0318-2Search in Google Scholar PubMed
18. Kim J, Park JY, Shin SJ, Lim BJ, Go H. Neo-Fs Index: A novel immunohistochemical biomarker panel predicts survival and response to anti-angiogenetic agents in clear cell renal cell carcinoma. Cancers (Basel) 2021;13:1199.10.3390/cancers13061199Search in Google Scholar PubMed PubMed Central
19. Zhang K, Xu C, Liu S, Jiang Y, Zhao X, Ma S, et al. The diagnostic and immunotherapeutic value of cd248 in renal cell carcinoma. Front Oncol 2021;11:644612.10.3389/fonc.2021.644612Search in Google Scholar PubMed PubMed Central
20. Bareche Y, Pommey S, Carneiro M, Buisseret L, Cousineau I, Thebault P, et al. High-dimensional analysis of the adenosine pathway in high-grade serous ovarian cancer. J Immunother Cancer 2021;9:e001965.10.1136/jitc-2020-001965Search in Google Scholar PubMed PubMed Central
21. Mohamed AA, Omar AAA, El-Awady RR, Hassan SMA, Eitah WMS, Ahmed R, et al. MiR-155 and MiR-665 role as potential non-invasive biomarkers for hepatocellular carcinoma in egyptian patients with chronic hepatitis c virus infection. J Transl Int Med. 2020 May 9;8:32-40.10.2478/jtim-2020-0006Search in Google Scholar PubMed PubMed Central
22. Hoshino A, Costa-Silva B, Shen TL, Rodrigues G, Hashimoto A, Mark MT, et al. Tumour exosome integrins determine organotropic metastasis. Nature 2015;527:329-35.10.1038/nature15756Search in Google Scholar
23. Paolillo M, Schinelli S. Integrins and exosomes, a dangerous liaison in cancer progression. Cancers (Basel) 2017;9:95.10.3390/cancers9080095Search in Google Scholar
24. Hamidi H, Ivaska J. Every step of the way: integrins in cancer progression and metastasis. Nat Rev Cancer 2018;18:533-48.10.1038/s41568-018-0038-zSearch in Google Scholar
25. Xu J, Zhang J, Wang J. The application of traditional Chinese medicine against the tumor immune escape. J Transl Int Med. 2020 Dec 31;8:203-4.10.2478/jtim-2020-0032Search in Google Scholar
26. Walling BL, Kim M. LFA-1 in T cell migration and differentiation. Front Immunol 2018;9:952.10.3389/fimmu.2018.00952Search in Google Scholar
27. Ellert-Miklaszewska A, Poleszak K, Pasierbinska M, Kaminska B. Integrin signaling in glioma pathogenesis: from biology to therapy. Int J Mol Sci 2020;21:888.10.3390/ijms21030888Search in Google Scholar
28. O’Day S, Pavlick A, Loquai C, Lawson D, Gutzmer R, Richards J, et al. A randomised, phase II study of intetumumab, an anti-alphav-integrin mAb, alone and with dacarbazine in stage IV melanoma. Br J Cancer 2011;105:346-52.10.1038/bjc.2011.183Search in Google Scholar
29. Mahalingam B, Van Agthoven JF, Xiong JP, Alonso JL, Adair BD, Rui X, et al. Atomic basis for the species-specific inhibition of alphaV integrins by monoclonal antibody 17E6 is revealed by the crystal structure of alphaVbeta3 ectodomain-17E6 Fab complex. J Biol Chem 2014;289:13801-9.10.1074/jbc.M113.546929Search in Google Scholar
30. Mitjans F, Meyer T, Fittschen C, Goodman S, Jonczyk A, Marshall JF, et al. In vivo therapy of malignant melanoma by means of antagonists of alphav integrins. Int J Cancer 2000;87:716-2310.1002/1097-0215(20000901)87:5<716::AID-IJC14>3.0.CO;2-RSearch in Google Scholar
How to cite this article: Wang Y, Hou K, Jin Y, Bao B, Tang S, Qi J, et al. Lung adenocarcinoma-specific three-integrin signature contributes to poor outcomes by metastasis and immune escape pathways. J Transl Intern Med 2021; 9: 249-63.
© 2021 Yizhe Wang et al., published by Sciendo
This work is licensed under the Creative Commons Attribution-NonCommercial-NoDerivatives 3.0 License.
Articles in the same Issue
- Editorial
- Translational research in anti-pancreatic fibrosis drug discovery and development
- Dawning precision treatment for gastric cancer: The latest biomarkers
- Commentary
- Can gamma entrainment of the brain rhythms prevent or alleviate Alzheimer’s disease?
- Review
- The challenges and optimization of cell-based therapy for cardiovascular disease
- New insights of epigenetics in vascular and cellular senescence
- Original Article
- Lung adenocarcinoma-specific three-integrin signature contributes to poor outcomes by metastasis and immune escape pathways
- Relationship between homocysteine levels and post-stroke cognitive impairment in female and male population: from a prospective multicenter study
- Assessment of 17 clinically available renal biomarkers to predict acute kidney injury in critically ill patients
- Elevated resting heart rates are a risk factor for mortality among patients with coronavirus disease 2019 in Wuhan, China
- Lipid-related protein NECTIN2 is an important marker in the progression of carotid atherosclerosis: An intersection of clinical and basic studies
- Effect of local anti-vascular endothelial growth factor therapy to prevent the formation of stenosis in outflow vein in arteriovenous fistula
- Case Report
- Hyperoxaluria: An early diagnosis will allow a timely combined renal and liver transplantations to avoid irreversible damages to all other organs