Reducing epistemic and model uncertainty in ionic inter-diffusion chronology: A 3D observation and dynamic modeling approach using olivine from Piton de la Fournaise, La Réunion
-
Fiona K. Couperthwaite
 ,
Daniel J. Morgan
,
Daniel J. Morgan

Abstract
Modeling of ionic diffusion in natural crystals has been developed over the last three decades to calculate timescales of geological processes. As the number of studies and the size of data sets have expanded, improvements in the precision of the general technique are needed to resolve temporal patterns that would otherwise be masked by large uncertainties. This contribution examines fundamental aspects of timescale calculation uncertainty using Mg-Fe zonation in olivine crystals from a Piton de la Fournaise oceanite erupted in 2002 CE. First, we quantitatively consider the role of geometric uncertainty in data sets from the perspectives of sectioning angle, crystal shape, and crystal agglomeration. Second, we assess how crystal growth and changing boundary conditions during diffusion pose problems for simplistic, 1D, diffusion-only modeling.
An initial database of 104 timescales (7–45 days) was generated using typical, 1D, isothermal diffusion-only methods for profiles taken from 30 compositionally and texturally zoned crystals of olivine. This simplistic modeling yields poor model fits and imprecise timescales; prior to this work, we would have rejected >60% of these data. Universal-stage measurements of crystal boundary angles and three-dimensional (3D) X‑ray microcomputed tomography observations of crystal shape address geometric uncertainties. U-stage measurements show that, contrary to expectations of random sectioning, most boundaries modeled initially were close to the ideal sectioning plane. Assessment of crystal morphology from 2D thin sections suggests olivine crystals are dominantly euhedral; however, 3D imaging reveals that they are significantly subhedral and often exist as agglomerates, an observation that underscores both the potential for diverse crystal interactions through time in the magma (Wieser et al. 2019) and out-of-plane effects capable of influencing calculations of diffusion profiles.
Refinements to timescale determination can be made using a dynamic 1D modeling code to resolve growth and changing boundary effects simultaneous with diffusion. We incorporated temperature-dependent crystal growth rates (both linear growth and quadratically increasing, with a peak growth rate ~1.9 ×10⁻¹¹ ms–1) and temperature-dependent boundary conditions (controlled using a cooling rate of –0.5 ± 0.1 °C/h) to remodel 13 timescales, resulting in significantly improved fits of the diffusion model to the initial data, better agreement between different faces of the same crystal, and less scatter within the whole data set.The use of 3D imaging and the inclusion of changing boundary conditions and crystal growth for diffusion calculations will enable more robust conclusions to be drawn from similar data in the future. Accurately retrieving timescale information from these crystals expands the pool of data available and reduces sampling bias toward “well-behaved” crystals.
Introduction
Understanding of magmatic plumbing systems has been advanced in recent years by investigation of individual crystal histories using quantitative diffusion chronology (Costa and Dungan 2005; Morgan et al. 2006; Kahl et al. 2011; Charlier et al. 2012; Shea et al. 2015a; Hartley et al. 2016; Pankhurst et al. 2018b; Ruth et al. 2018; Petrone et al. 2018; Mutch et al. 2019). The essential observations underpinning these studies are that chemical disequilibria within natural crystals are often partially relaxed toward full equilibrium: a homogeneous distribution of elements (Fig. 1a). Timescales are calculated by modeling a diffusion profile that fits the observed profile (Costa and Morgan 2010).

A frequently encountered limitation of simple ionic diffusion modeling applied to natural crystals. (a) Schematic showing relaxation of an initial chemical disequilibria profile (blue) as a function of time (t1–3) within one phase, by diffusion (black lines). Any interaction with external boundaries will result in a change of profile shape. Any change in thermal condition through time will result in an error in calculated duration should a constant temperature be assumed. (b) Example of a compositional profile (RU0701_3_G4) extracted from a zoned crystal. (c) The best-fit simple diffusion model (red) does not match the measured profile nearer the core due to enhanced curvature of the profile (i) nor at the crystal rim (ii) due to an inversion point in the profile gradient. Due to these poor fits, this crystal would traditionally no longer be considered for inclusion in a timescale database. Poor-fitting profiles represent an important source of potential bias.
Knowledge of ionic diffusivity in mineral lattices is gained from laboratory experiments (e.g., Buening and Buseck 1973; Chakraborty et al. 1994; Lesher 2010). These diffusivity measurements contain inherent uncertainty, which can be propagated to modeled results from natural data. Although experiments are designed to control environmental conditions and geometric relationships (Costa et al. 2008; Brady and Cherniak 2010; Chakraborty 2010; Dohmen and Milke 2010), it cannot be assumed that nature is so well-behaved, i.e., disequilibrium conditions may be prevalent across the system and subhedral, aggregated crystals may be present. Variations in intensive parameters such as temperature, pressure (Blundy and Cashman 2008), composition (Dohmen and Chakraborty 2007a, 2007b; Dohmen et al. 2007), and the geometric relationships of crystals (single crystals vs. aggregates, euhedral vs. subhedral) are central to how igneous rocks are formed (Welsch et al. 2013; Shea et al. 2015a). Application of experimental results to natural systems, while assuming these parameters are invariant, will likely lead to inaccuracies.
This contribution aims to improve the utility of diffusion chronology in natural rocks by investigating the effects of three common sources of analytical and epistemic uncertainty in natural systems: (1) sectioning angle, (2) 3D crystal shape, and (3) crystal growth and changing boundary conditions. We use Fe-Mg inter-diffusion in natural olivine as our case study, as it has a well-constrained and understood diffusion coefficient (Dohmen and Chakraborty 2007a, 2007b; Dohmen et al. 2007; Costa et al. 2008; Kahl et al. 2013; Bouvet de Maisonneuve et al. 2016; Lynn et al. 2017) and because basalt petrogenesis is relatively simple. The types of improvements we discuss, however, are equally applicable in other minerals and more complex igneous systems.
We constructed a data set of core-rim composition profiles using traditional methods (see Fig. 1b). From these profiles, a diffusion chronometry data set was generated whereby a single temperature is input into a 1D diffusion model, and solutions were corrected for anisotropy (Costa and Chakraborty 2004; Kahl et al. 2011; Hartley et al. 2016; Morgado et al. 2017; Pankhurst et al. 2018b) (Fig. 1c). We then made observations using a universal stage, X‑ray microcomputed tomography (XMT), and a modeling program that can accommodate dynamic boundary and temperature conditions. Uncertainties within the chronometry data set are then defined and corrected by applying more advanced methods of observation and the advanced model.
We assess the influence of sectioning angle, crystal shape, and crystal growth, and changing boundary conditions at both a crystal scale and at a population scale. This work is complementary to the theoretical study of geometrical uncertainties and their effects on the accuracy of timescales demonstrated in Shea et al. (2015a). While Shea et al. (2015b) discriminated between growth and diffusion within a classic skeletal olivine crystal, further validation requires diffusion-based studies that aim to retrieve timescales from a wider pool of natural crystals. The studied olivines are at a late stage of crystal formation, the timing of the chemical profiles occurring after post-textural ripening to their observed form.
Sampling and geological setting
Piton de la Fournaise (PdlF) is a basaltic shield volcano forming the south-eastern portion of La Réunion, one of the Mascarene Islands that lie ~800 km off the coast of Madagascar (Longpré et al. 2006; Lénat et al. 2012) (see Fig. 2). There have been multiple eruptions in nearly all decades since historical records began in 1640 (Global Volcanism Program). Recent eruptions have occurred in 1990, 1991, 1992, 1998–2010, and 2014–present. The recent activity is mainly confined to the central caldera—Enclos Fouqué—and from the northeast and southeast rift zones (Lénat et al. 2012).
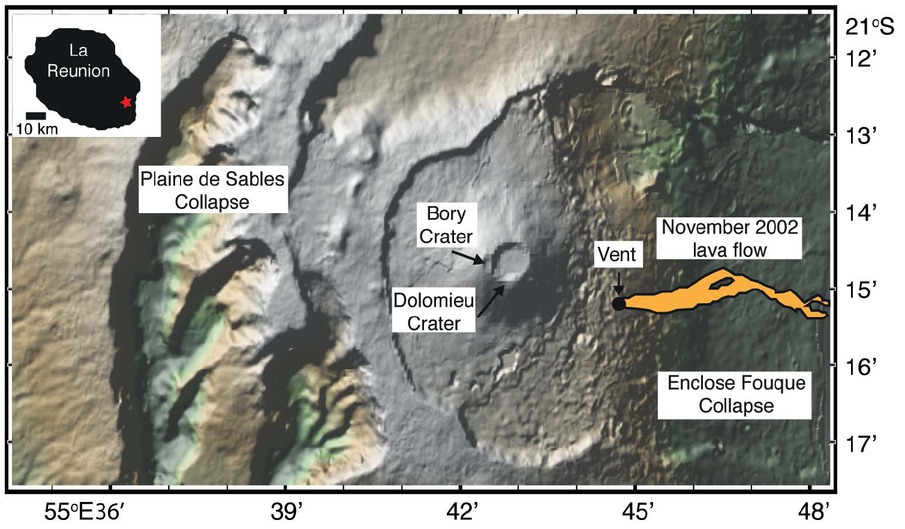
Location map of the 2002 lava flow at Piton de la Fournaise using GeoMapp App. A red star (on the inset map) and black dot indicate the vents location and the central caldera and progressive collapse structures are indicated by the annotations and map shading as per Longpré et al. (2006) and Servadio et al. (2013).
The November 2002 eruption (Fig. 2) occurred on the eastern flank as a lava flow (Longpré et al. 2006). The eruptive period is divided by Longpré et al. (2006) into five eruptive episodes defined by periods of inflation/deflation at the summit and the flanks and increased or decreased seismicity related to dike injection within the eastern flank (Longpré et al. 2006). The lava flow is comprised of oceanite [a term first introduced by Lacroix 1923 from Peltier et al. (2009)] and formally defined by Boivin and Bachèlery (2009).
We sampled the 2002 lava flow from a road-side outcrop at Lat. –21.13136S, Long. 55.48424E at 223 feet elevation. This lava contains abundant 2–3 mm olivine crystals. The sample collected is denoted “RU0701” throughout the paper, and whole-rock geochemical information for this sample, including major-element composition, was reported in Peters et al. (2016).
Initial methods
Sample preparation and characterization
Three thin sections were cut to 48 mm ×26 mm ×35 μm, ground, and polished with colloidal silica to give sufficiently defect-free finish suitable for electron-backscatter diffraction (EBSD) analysis, as in Lloyd (1987). Within each thin section (RU0701_1-3), we refer to an individual olivine crystal using a letter and use a number to refer to a unique compositional profile extracted from that crystal for the modeling, for example RU0701_1_A1. A scan of each thin section is included in Online Material[1] Data A. Mineralogical modal abundance was calculated using “JMicroVision” as applied to scanning electron microscope images in addition to visual assessment of olivine shape made in both 2D and 3D. A core (diameter = 1.5 cm, length = 10 cm) was taken from the bulk-rock sample using a drill corer at the University of Leeds, in preparation for X‑ray microcomputed tomography scanning.
Scanning electron microscope and electron probe microanalysis
Backscattered electron (BSE) images of thin sections were collected for textural assessment and for composition calibration using a FEI Quanta 650 Field Emission Gun-Environmental Scanning Electron Microscope (SEM) at the University of Leeds. The imaging was conducted using a focused spot size and an accelerating voltage of 20 kV. An Oxford Instruments electron backscatter diffraction system using a hkl Systems Nordlys detector was used to gather crystallographic orientation data from the portions of olivine used for compositional profiling. These data were reduced using Oxford Instruments Channel 5 software to a single set of Euler angle rotations per grain, and an in-house MS Excel worksheet was used to transform these into a set of a-, b-, and c-axis orientations relative to the EBSD analytical plane (i.e., the thin section plane). Compositional rim-to-core traverses from the olivine grains were measured using a JEOL JXA8230 electron probe microanalyzer (EPMA) equipped with five wavelength-dispersive spectrometers (WDS) at the University of Leeds. A focused beam was used to extract a profile perpendicular to the crystal edge at 5–10 μm intervals. The broadest diffusion margin of the crystals measured is ~80 μm.
Multiple analyses were conducted to build the full data set, using slightly different beam conditions (15–20 kV and 30–50 nA) and on-peak count times (30–60 s for Ni and Mn; 30–40 s for Si, Fe, Al, and Mg; and 20–30 s for Cr). Higher energy and currents were used together with shorter count times and resulted in similar precision, as calculated using data from secondary standards from each run. Analyses that recorded totals outside 98 to 101.1 wt% were rejected. Microbeam reference materials distributed by the Smithsonian Institute, Washington, D.C. (Jarosewich et al. 1980) were used as primary standards, whose details along with detection limits determined in this study are reported in Online Material[1] Data A.
The San Carlos olivine standard NMNH 111312-44 was used to calculate external accuracy and reproducibility of olivine composition via analyses at the start, end, and within the analytical session. The Fo content of the San Carlos olivine was reproducible within-analytical-session precisions of 2σ = 0.07–0.14 mol% (n = 66 over the course of the study). Internal olivine standards used were Springwater (USNM 2566) and Geo2 (see Pankhurst et al. 2016). Analyses of groundmass minerals were conducted alongside suitable matrix-matched standards, as detailed in Online Material[1] Data A.
Initial modeling
Thermometry and oxygen fugacity. For mafic magmas, it is common to utilize olivine-melt thermometry (Putirka 2008) to determine crystallization temperatures. In the absence of preserved homogeneous glass, we retrieved bulk compositions of the microcrystalline groundmass (Geiger et al. 2016). A quantitative mapping, raster matrix method was used to collect the compositional data, using the Probe for EPMA software (Donovan et al. 2012) and further refined using Surfer Software.
Grids of the groundmass were scanned using WDS, after which a matrix correction was applied to the data on a pixel-by-pixel basis, mimicking beam defocusing (Morgan and London 1996). The raster matrix method has the advantage of analyzing large areas without the beam attenuation and spectrometer viewing angle problems associated with using wide-area defocusing (Reed 2005). The MgO content (in wt%) derived from the raster matrix was input into the Helz and Thornber (1987) liquid-only thermometer. This thermometer has been widely implemented to investigate the thermometry of PdlF lavas in previous studies, e.g., Clague and Denlinger (1994); Famin et al. (2009); Bureau et al. (1998); and Boivin and Bachèlery (2009). Uncertainties presented in this study incorporate both the internal uncertainty of ±10 °C inherent to the thermometer as well as the MgO variability obtained via the groundmass analysis. Quantitative groundmass maps and calculation of their uncertainty can be found in Online Material[1] Data A. We set the oxygen fugacity at the NNO+1 buffer. A detailed explanation of this choice is included in Online Material[1] Data B.
Timescale calculations. Profiles of grayscale values from BSE images were extracted perpendicular to the crystal edges using Image J (Schneider et al. 2012), illustrated in Figure 1b. The grayscale values were calibrated to the major element compositions (Costa and Morgan 2010) obtained from analyses of the same olivine crystal using the EPMA. Best-fit diffusion profiles were then modeled for these profiles using the same numerical methods as previous work by Hartley et al. (2016), Pankhurst et al. (2018b), and Couperthwaite et al. (2020). A demonstration and explanation of the methods of the simple diffusion model used are supplied in Online Material[1] Data C.
Initial results
Olivine composition and textures in two dimensions
Whole-rock (XRF) compositional data for RU0701 (Online Material[1] Data A), plots in the range for an ultra-mafic/basaltic (SiO2 wt% < 45%) rock with a high MgO content (23.5 wt%), consistent with the petrographic identification as oceanite [8–28 wt% MgO, Lacroix (1936)]. The large olivine crystals that are the main focus of this study appear as mostly euhedral, occasionally embayed, crystals up to 2–3 mm in size, at ~25% modal abundance. There are ~300–400 olivines in each thin section. They are contained within a finer-grained groundmass (~50–80 μm) made up of clinopyroxene (40%), olivine (10%), plagioclase feldspar (50%), and spinel (5%) (see Fig. 3), and often contain plagioclase inclusions in their margins. Olivine ~40–200 μm in size is also present (Fig. 3), much smaller than the population of large crystals.

BSE images representing the range of crystal textures observed in this study. (a) A large, euhedral olivine (ol) agglomerate with homogeneous BSE response except for relatively narrow zonation at the edges and surrounded by a microlitic groundmass (b) microlitic groundmass containing olivine (ol), plagioclase (plag), clinopyroxene (cpx), and oxides (ox). (c) A smaller, olivine crystal, or section through a large crystals’ terminus exhibits broadly zoned margin, and also surrounded by microlitic groundmass (d) the rim of a large, euhedral olivine showing a narrow, diffused zone.
The large olivines have core compositions of Fo84 [Fo = 100·(Mg/Mg+Fe+Ni+Mn)], consistent with previous olivine measurements for RU0701 (Füri et al. 2011), and Fo rim compositions ranging from Fo75–65 (normal zonation) with what is recognizable as diffused zones typically ~80 μm thick (Fig. 3). The olivine rims are similar to the groundmass olivine composition (~Fo65).
External modeling parameters and timescale uncertainties
A temperature of 1126 °C (±10 °C) was calculated using the average MgO (5.55 MgO wt%) of four quantitative groundmass maps (values range between 4.9 and 6.5 ± 0.5 wt% MgO; Online Material[1] Data A). This estimated temperature is in good agreement with that used by Boivin and Bachèlery (2009), who calculated temperatures usually between 1110–1150 °C (and up to 1172 °C, with an interquartile range of 33 °C) for various eruptions from 1977 to 1998. We set the fO2 at NNO+1 log units.
The initial condition was defined using the core composition Fo84, with a variation in the boundary condition inferred from the rim composition between Fo75–65 depending on the profile being modeled. The average uncertainty of each calculated timescale is 0.38 log units (1σ), calculated considering the uncertainty on temperature, activation energy, and the pre-exponential factor that relates to crystal structure, jump frequency, and distance (Dohmen and Chakraborty 2007a, 2007b; Dohmen et al. 2007).
Initial Fe-Mg diffusion timescales
Diffusion timescales (n = 104) were calculated for Fe-Mg inter-diffusion in the large, zoned olivine crystals (n = 30). One profile was extracted from each available face of a single crystal and/or was taken along each diffusion direction (relative to crystallographic orientations) within a crystal. An example of a diffusion model fit to a crystal compositional profile is shown in Figure 1c (further profiles are shown in Online Material[1] Data A). Our diffusion model best-fits can be grouped into three types:
39 profiles that show a very good fit with simple modeling and can be simply explained by diffusion with a fixed boundary condition and no crystal growth;
5 profiles that show a poor fit to the simple model, indicated by an enhanced curvature of the diffusion profile away from the core, relative to the simple model; and
a further 60 profiles that appear to be affected by enhanced curvature (as in 2) and a point of inflection in the profile gradient toward the rim. An example of types 2 and 3 are illustrated in Figure 1c.
All initial modeling accounts for diffusion anisotropy and compositional dependence using the diffusivity data of Dohmen et al. (2007) and Dohmen and Chakraborty (2007a, 2007b). The majority of calculated timescales range from 7 to 45 days (Fig. 4). Outliers (4% of the data set) reach 60–104 days. These longer timescales do not appear to have any relationship with the composition of cores or rims or crystal size. Of particular note is the scatter among the timescales both between crystals and within crystals (Fig. 4), i.e., even accounting for anisotropy and composition dependence. Individual crystals do not consistently correct to a singular diffusion timescale.

Scatter among calculated diffusion timescales is observed both within a single crystal and between crystals (n = 30). All timescales are calculated using AUTODIFF and are corrected for anisotropy. The average uncertainty is 0.38 log units (1σ). If all results corrected to a single timescale that has geological meaning—a common hypothesis—all bars would be of equal height. Black dashed lines separate crystals from different thin sections.
Initial discussion
Scatter within the diffusion timescale data set
Scatter between and within crystals could at least partly be due to each individual crystal petrogenesis. It cannot be assumed that the diffusion clock in each crystal was set synchronously and so it is not expected that they should form a timescale “event,” as has often previously been inferred in prior diffusion studies. Since each profile is already corrected for anisotropy, the scatter within crystals is therefore likely to be attributable to sectioning effects, simultaneous crystal growth, and changing boundary condition effects and out-of-plane-diffusion effects (Shea et al. 2015a), as discussed in the following sections.
Sectioning angle
The ideal crystal sections to study for retrieval of accurate diffusion timescales are those that cut through the center of a crystal and also perpendicular to at least one crystal face [and therefore also perpendicular to the diffusion front (Pearce 1984)]. Thin sections cut such that crystals are not sectioned in this way (giving shallow sections) will lead to an apparent lengthening of the observed profiles (Costa and Chakraborty 2004; Costa et al. 2008; Costa and Morgan 2010; Shea et al. 2015a), which is an assumption that is often not explicitly declared or corrected for. This artificial lengthening contributes to an epistemic uncertainty on the timescale introducing a stretch factor to the traverses, most often inducing positive scatter into the timescale data set.
Choosing the narrowest profile within a crystal should be favored to minimize this source of error (Costa et al. 2003, 2008; Costa and Dungan 2005; Costa and Morgan 2010; Shea et al. 2015a). In practice, however, this is not always possible. Crystals picked from tephra and set in grain mounts are often fragmented, and sometimes only one crystal margin is observed, so no relative comparisons can be made. Features such as melt and mineral inclusions, cracks, polishing defects, sub-grain boundaries, or embayments in the crystal considered may further limit options for extracting a profile.
Pearce (1984) calculated the probability of obtaining an ideal cut section of a crystal for the study of zoned crystals. The probability of a section to be within 40% of the center of a crystal that is also within 10° of perpendicular to any one of the three major faces would be around ~20%. This implies a significant proportion of sections are likely to not meet these criteria and be affected by off-center or shallow sectioning. Better representation may be expected, however, when considering larger crystals with a narrower rim thickness, akin to the PdlF olivines in this study. Since sectioning effects are rarely measured and incorporated into diffusion data sets [e.g., Martin et al. (2008) via U-stage measurements] this factor clearly carries some potential as a source of uncertainty.
3D texture
Out-of-plane features that may influence the development of diffusive chemical profiles include proximity to other crystals or vesicles, or low-angle adjacent crystal faces removed during the thin section process where cuts are quite off center and almost graze a face. Crystal morphology may lead to isolated and apparently distinct crystals in thin section that in reality are connected to parts of the same crystal (Welsch et al. 2013). Such crystals might be separately analyzed, and therefore be over-represented in a subsequent data set. Without 3D context, these scenarios represent another source of epistemic error at the scale of single-crystal histories that deserves consideration, which is becoming more widely adopted as a focus for research (e.g., Jerram et al. 2018).
Simultaneous crystal growth and changing boundary conditions with diffusion
Profiles with an enhanced curvature of the diffusion profile away from the crystal core, relative to the simple model, and that also exhibit an inflection point in the profile gradient near the crystal rim (e.g., that in Fig. 1c) are suspected of being affected by crystal growth and/or changing boundary conditions simultaneous with diffusion. These profiles would normally be rejected from further consideration as they do not meet quality control criteria for the degree of match. For instance, the rejection rate would be ~60% for this data set (Online Material[1] Data A). These profiles, however, contain valuable information with regards to the environment in which they resided, i.e., a change in ambient conditions. Their rejection, therefore, constitutes a bias, whose impact on both the chronometry and petrographic interpretation is typically ignored. This study attempts to recover this information through dynamic modeling.
Advanced methods
Calculating shallow sectioning effects
The stretching of a compositional profile due to shallow sectioning, as illustrated in Figure 5, can be corrected for using the following equation (Costa and Morgan 2010);

Schematic diagram adapted from Costa and Morgan (2010) illustrating the effects of shallow sectioning (thick horizontal black line is sectioning plane) of a chemically zoned crystal (concentric rectangles). The part of the crystal to the left will display a stretch effect three times the true length of the gradient that diffusion is acting across. The part of the crystal to the right has also been stretched but to a lesser extent. The narrowest profiles that also are at a maximum distance from corners and as such are at least affected by are indicated by red arrows. Arrow (i) serves to illustrate that the boundary conditions affecting the measured profile are not captured by the 2D plane of the section; these are lost to the saw and grinder. Arrow (ii) serves to illustrate the proximity to a corner that can amplify out-of-plane effects on measured profiles.
where lm is the measured traverse length, lt is the true traverse length, and the angle θ is the angle between the crystal boundary and the normal to the sectioning plane—the “hade” (Costa and Morgan 2010). We measure this angle using a Universal Stage (U-Stage), the operation of which is described in Kile (2009). The shallower the cut, and hence the larger the value of θ, the more significant the stretch factor on the timescale.
The large size of the olivine grains we used for this study relative to the diffusion scale means that sections could be considerably off center without varying the crystal face intersection angles. Stretch factors were calculated for our data set using the angles measured with the U-stage. At a population level, this serves to highlight how shallow sectioning combined with traditional in-section-plane diffusivities would affect the PdlF diffusion data set overall, and therefore, the possible effects on other data sets. These measurements were repeated to assess uncertainty. Much of the U-stage data set was also re-measured independently by F.K.C. and D.J.M.; the results were found to be reproducible within ±5° by different operators. The stretch factor, stretched timescales, and timescale shift to be applied to timescales modeled by diffusion (that are uncorrected for shallow sectioning) for a range of angles between the minimum and maximum of those measured from this data set can be found in Online Material[1] Data A.
Understanding crystal shape using X‑ray microtomography
Detailed methodology of the XMT analytical procedure can be found in Online Material[1] Data B. Crystals and their textural context were observed in situ in 3D within a rock core using the XMT 3D imaging. We use image segmentation software to segment the olivine crystals from the groundmass within the images produced. To capture, examine in detail, and quantify the shape of the larger (2–3 mm) olivine crystals, several image segmentation methods were tested. Ten slices evenly distributed through the image stack were selected and imaged olivine belonging to large crystals was manually digitized from each slice. The advantage of scrolling above and below the slice (using a z-stack of the image) allowed us to denote olivine as belonging to a large crystal or not, even if the slice intersected only a small area and would otherwise be indistinguishable from groundmass olivine.
“K-means clustering,” “watershed,” and “trainable weka” segmentation modules were applied to these same slices within Image J. K-means clustering partitions a data set into k-groups (clusters). The plugin performs pixel-based segmentation based only on clusters discovered within the image (Wagstaff et al. 2001). The watershed segmentation method considers the input image as a topographic surface, with the brightness of each point representing its height. The entire relief is flooded, and dams or barriers are formed where similar pixels are found, with all similar points forming a catchment basin (Soille and Vincent 1990). The trainable weka segmentation methods combine machine learning algorithms with image processing, assigning areas of interest to “classes” forming the training data set (Arganda-Carreras et al. 2017). The classifier uses a random forest algorithm and decision trees to ultimately classify the selection (Breiman 2001; Hastie et al. 2008).
The brightness and texture of the pixels that make up the olivine are exploited for each segmentation method. Each method was optimized using the 2D slices with manually segmented olivine to choose the best method to be applied to the entire stack. In each case, the result is a binary image that approximates the location of olivine belonging to large crystals. Figure 6 illustrates the good agreement between the percentage area of olivine using all three 3D segmentation methods compared to the percentage area of olivine within the raw 2D slices. We chose to apply the Trainable Weka Segmentation method across the 3D stacks, as this method enabled full automation of each step in the methodology.

The percentage area of an olivine manually segmented from raw, XMT images compared with the percentage area of olivine segmented from these using “k-means cluster” (green), watershed (blue), and trainable weka (red) segmentation methods. There are 10 data points for each method, each from one slice evenly spaced throughout the stack of images comprising the segmented olivine. The high r2 value indicates that the image analysis techniques are acceptable to apply to slices between those manually segmented, and so are able to efficiently generate 3D binary stacks of “olivine” and “not olivine” and reveal 3D crystal shapes.
Dynamic modeling of crystal growth, changing boundary conditions, and diffusion
To evaluate the potential changes that occur during crystal growth with simultaneous diffusion, we consider two scenarios: (1) that the crystal may grow, and that the outside boundary condition is mobile in space as crystallization proceeds, and (2) that the equilibrium composition of the olivine is changing as crystallization proceeds, due to melt evolution.
In these cases, the growth of a crystal and the change in equilibrium value are driven by changes in magma temperature and the degree of crystallization that this affords. Because diffusivity is a strong function of temperature, we must also consider: (1) that the diffusivity will be controlled by temperature, which will decrease during cooling and crystallization, and (2) the thermal effects on oxygen fugacity.
To constrain this series of processes, we chose to model diffusion over the crystallization path of the system as a function of temperature, to obtain the equilibrium olivine values at any given temperature, which can be applied as a boundary condition. By specifying a cooling rate applied to the sample, this can be expected to control the evolution of the external melt composition with time and control the diffusivity as a function of time. What the diffusion modeling requires is a precise starting melt composition, which can be modeled using software such as Petrolog3 (Danyushevsky and Plechov 2011) or MELTS (Ghiorso and Sack 1995; Asimow and Ghiorso 1998). We used Petrolog3 to determine the initial melt composition prior to olivine rim growth and groundmass formation. We extracted variable amounts of Fo84 olivine from the whole-rock composition and assessed olivine-melt equilibrium. We then project crystallization of this melt considering the phases present in the observed assemblages (with the exception of orthopyroxene, which is present in low abundances in the Petrolog3 models). A detailed methodology is described in Online Material[1] Data B.
Thermodynamic modeling using Petrolog3. Olivine in the models typically crystallizes through the interval Fo84–79, but more evolved olivine is not present; it is replaced in the models by orthopyroxene, which crystallizes at the level of a few percent. This is distinct from what we see in the specimens, where no orthopyroxene is observed, and olivine rims exhibit compositions down to Fo65 or less (indicated by brighter BSE pixels at the very rim, below the spatial resolution of the EPMA). We suspect this represents a limitation in the modeling vs. nature; either the nucleation of orthopyroxene is somehow suppressed in the natural samples or that the crystals are so small as to be visually unidentifiable from olivine within the fine-grained groundmass. Regardless, orthopyroxene does not form overgrowths on olivine in RU0701, and as such there is no evidence to support its inclusion across the petrogenetic interval of interest. Therefore, we excluded orthopyroxene from the Petrolog3 modeling, restricting the assemblage to olivine, plagioclase, clinopyroxene, and oxide. Olivine crystals in natural samples were able to exchange via diffusion with an adjacent, more-evolved melt that equilibrate with Fo65, since fractionation to a cumulate has not occurred.
Figure 7 shows how crystallization behavior changes with temperature in the model. This curve is parameterized for use in a diffusion model—each stretch of cotectic is fitted with a third-order polynomial with R2 > 0.99, which is used within that temperature range to determine the equilibrium olivine composition for any given temperature. Note that at temperatures below 1117 °C, olivine does not crystallize within the model, and the values reflect the equilibrium due to exchange with an evolved ambient melt and a Kd for olivine of 0.303.

Evolution of olivine equilibrium composition over the temperature range 1250–950 °C modeled using Petrolog3. The modeling conditions used are as follows: olivine-melt equilibria (Beattie 1993); plagioclase-melt equilibria (Danyushevsky 2001); clinopyroxene-melt equilibria (Danyushevsky 2001); opx-melt equilibria (Beattie 1993); and magnetite-melt equilibria (Ariskin et al. 1993). Pressure and buffers: at 2 kbar, QFM buffer, at 1 atm, QFM+2. Calculation step; 0.01% crystallization.
Dynamic diffusion modeling. The modeling was conducted using a simple, iterative one-dimensional finite difference model, whose logic follows that shown in Figure 8. In this manner, the model allows for tracking the liquidus and an evolving melt, allowing the temperature to control both the composition, the diffusivity, and the absolute oxygen fugacity (via a buffer), much as it would during the cooling of the magma.

Flow chart of the one-dimensional dynamic diffusion models.
Advanced results
Sectioning effects
Our analysis of sectioning effects shows a large frequency of sections cut within angles 10° of vertical and a smaller frequency of the very shallow angles (where the crystal edge is sectioned up to 30° to the vertical; Fig. 9). These angles correspond to timescale shortening between 0–2.5 and 33.3% relative. The average angle measured from vertical (the “sectioning” angle) for the PdlF data set is 8.9° and would require an average shift of ~2.5% applied to the timescale data set (0.011 log units), which is low, relative to other sources of uncertainty. A full list of measured angles and the corresponding shift on individual timescales is included in Online Material[1] Data A.

The frequency of angles measured using a Universal Stage (U-Stage) between crystal boundary and the plane normal to the sectioning plane. Each data point (n = 104) is a measurement from where a diffusion profile was extracted. The red lines bracket points that would require a correction of <10% and <20% due to shallow sectioning effects.
Quantification of 3D crystal shapes
3D renders of four olivine crystals or crystal aggregates are shown in Figure 10. A further 25 crystals are provided in Online Material[1] Data A. Assessment of these images reveals that only 25% of the crystals could be considered euhedral; 68% are subhedral, and 7% are anhedral. Furthermore, only 25% are individual crystals and the remainder are present as crystal agglomerates. These agglomerates are generally crystallographically aligned (see Fig. 10e). Nearly all the crystals are polyhedral, apart from two that are tabular shaped; 19% are rounded nodules, and 13% of the agglomerates show parallel organization or hierarchy as described by (Welsch et al. 2013).

Composite images of four olivine clusters digitally segmented from the XMT data using “Image J” and AVISO. Each cluster (a–d) is shown from 4 different orientations. (e) An “idealized” theoretical olivine crystal used in various studies, e. g., Shea et al. (2015a) compared against an olivine cluster imaged using XMT. Miller indices denote matching faces and black lines highlight crystal face edges. The (001) face is not present in any of the Piton de la Fournaise olivine, and it is rare that olivine exists as solitary crystals.
Crystal growth and changing boundary condition incorporated into diffusion timescales
Using the initial melt composition from Petrolog3 (see Fig. 7), we ran several diffusion models (as described in Fig. 8) to assess the effects of changing boundary conditions and crystal growth on diffusion timescales. The results of each are described in the following sections.
Modeling sequence 1: Changing boundary condition (no growth). Modeling was initially conducted for a starting temperature of 1126 °C, at NNO+1, for various cooling rates. This generates a sequence of diffusion curves with geometries as shown in Figure 11. The profiles follow proportionally similar trajectories through temperature and time, are self-similar and display typical proportionality for diffusion profiles, i.e., where cooling rates quadruple, the diffusion width decreases by a factor of two.

Sequence of diffusion curves generated using the dynamic modeling code investigates different cooling rates. A series of cooling rates were applied to generate a changing boundary condition within the model over the cooling range 1127–967 °C. No crystal growth is incorporated into these curves. A natural olivine diffusion profile (RU0701_A_1) is overlain in black (labeled “measured”). The dynamic models show a poor fit to the raw crystal data; the natural profile does not result from varying the cooling rate in isolation.
Modeling sequence 2: Changing boundary condition with growth. Modeling was also conducted for a starting temperature of 1126 °C, at NNO+1, for a single cooling rate of –1 °C/h, combined with various growth rates. This generates a sequence of diffusion curves with geometries as shown in Figure 12; the addition of growth stretches the profiles, as would be expected. As growth is considered here to be linear in time, and diffusion is reducing exponentially due to linear cooling in time, the profiles are decoupled and are not self-similar. The highest growth rates are in effect recording a dominance of the liquidus surface, which is not completely smooth, and which has been subjected to a variable degree of diffusional smoothing with distance.

Sequence of diffusion curves generated using the dynamic modeling code investigating changing growth rate. A series of crystal growth rates were applied within the model. The boundary condition is fixed at a single value. A natural olivine diffusion profile (RU0701_A_1) is overlain in black. The dynamic models show a poor fit to the raw crystal data; the natural profile does not result from varying the growth rate in isolation.
Modeling sequence 3: Fitting a specific case. Due to the dynamic interplay of parameters, an initial profile was considered for detailed investigation using these diffusion and growth models. The fitting was performed iteratively by changing the relative magnitude of cooling rates and growth rates to gradually improve the fit for a particular traverse. To allow for an appreciation of both the similarity and difference between the curves in Figures 11 and 12 and real data, we superpose a profile onto these curves (labeled “measured”).
These figures show that natural data are significantly divergent from both cases studied, though growth allows us to fit the broader rim. A particular feature of the natural curve is that it has a gradual concave curvature, while the diffusion-only curves are convex. Such concavity is consistent with increasing growth rates; this can be seen on Figure 12, as the best fit seems consistent with high growth rates at the rim, but with lower growth rates near the core. Crystals, therefore, seem to have experienced a late-stage, accelerating rim growth. This was considered by applying a temperature-dependent growth across a temperature range such that:
where G is the growth rate, G0 the half-growth rate at Gmin, T0 is the start temperature and Tmin is a nominal finish temperature. This produces a gradually increasing growth rate following a parabolic curve. By adjusting the parameters of cooling rate and the parameter G0, above, we can attempt to emulate the curvature on the natural profile.
Model solutions can attain quite good agreement with the natural data using this method (Fig. 13). Slight deviations near the core may suggest a degree of two-step history, with some degree of diffusion prior to surface emplacement, although to explicitly fit this is hard to justify. Scenarios involving the departure of an individual crystal from the single-cooling trend for a period of time are not difficult to imagine in nature, yet we adhere to the cooling and growth rates expected from the system scale observations summarized by the model (Fig. 7).

An example of how using the dynamic modeling code and adjusting the parameters of cooling rate and growth rate can return a good fit between the model and the natural crystal data (RU0701_1_A1). The 13 re-modeled profiles (including this one) are consistent with an average cooling rate of –0.5 °C/h (±0.1 °C/h) and an average growth rate of ~1.9 × 10⁻¹¹ ms–1, over the cooling range 1127–967 °C. The diffusion timescale for this dynamically modeled profile is 12 days, reduced from 20 days.
Extension to the broader Piton de la Fournaise data set. Using the dynamic methods, we re-modeled 13 profiles from the RU0701 data set. We selected profiles that exhibited a poor fit when initially modeled at a single temperature of 1126 °C and fixed boundary condition.
By incorporating a cooling rate and a growth rate guided by the expected behavior of the cooling magma (Fig. 7) the model produced results that are in good agreement with the natural profiles. Six of these profiles from two crystals (RU0701_2_G and RU0701_2_I) are shown in Figure 14. The remaining six re-modeled profiles are included in Online Material[1] Data A. All of the re-modeled profiles are consistent with an average cooling rate of –0.5 °C/h (±0.1 °C) and an average growth rate of ~1.9 × 10⁻¹¹ ms–1, over the cooling range 1127–967 °C. These models translate to new diffusion timescales of, on average, 13 days (with a minimum timescale of 10 days and a maximum timescale of 17 days).
![Figure 14 Applying the dynamic diffusion modeling code and adjusting the parameters of cooling rate and growth rate shows we can acquire a good fit between the model and the natural crystal data across many profiles of the PdlF data set. We show a further 6 of the 13 re modeled profiles above. The initial diffusion timescales ranged from 11–31 days. Dynamically modeled profiles shown here were each fit using a global cooling rate [–0.5 °C/h (±0.1 °C)] and an average peak growth rate of ~1.9 × 10⁻¹¹ ms–1. The diffusion timescales reduce to 11–17 days.](/document/doi/10.2138/am-2021-7296CCBY/asset/graphic/j_am-2021-7296CCBY_fig_014.jpg)
Applying the dynamic diffusion modeling code and adjusting the parameters of cooling rate and growth rate shows we can acquire a good fit between the model and the natural crystal data across many profiles of the PdlF data set. We show a further 6 of the 13 re modeled profiles above. The initial diffusion timescales ranged from 11–31 days. Dynamically modeled profiles shown here were each fit using a global cooling rate [–0.5 °C/h (±0.1 °C)] and an average peak growth rate of ~1.9 × 10⁻¹¹ ms–1. The diffusion timescales reduce to 11–17 days.
The textural evidence, profile shapes at the crystal rims, and short diffusion timescales indicate that the diffusion rims are late-stage and most likely related to lava flow cooling. As an external check on the viability of our re-modeled timescales, we would expect the lava flow cooling time and the re-modeled diffusion timescales to be similar. We can use the following equation to calculate the cooling time of the lava flow:
where t is the time in seconds, A is the thickness of the lava flow in meters, and K is the thermal diffusivity of a basalt (Hon et al. 1994). This simple lava flow cooling rate calculation (with a lava flow thickness of 2–3 m) gives cooling rates of 9–19 days. The independent line of cooling rate calculation agrees with the remodeled diffusion timescales using the models that incorporate cooling rate (and thereby changing boundary condition) and crystal growth rate, and so lends confidence to our approach.
Advanced discussion
It is reasonable to consider that the diffusion “clock” in each crystal can be set at different times yet stop at effectively the same time (on eruption). Scatter within crystals due to natural variation, that if understood and placed into broader petrological context, can lead to detailed understanding of magmatic and/or volcanic phenomena (e.g., Pankhurst et al. 2018b). Diffusion timescale scatter between crystals could, however, also occur even if diffusion clocks are set simultaneously if complicating factors such as proximity to other crystals, exposure to different melts, mineral grains, or vesicles blocking diffusion have persisted for a significant fraction of time and if simplistic modeling is applied. Scatter within individual crystals could reflect limitations on the quality of modeling and/or be due to real complications such as crystal growth, changing boundary conditions, sectioning effects, and 3D crystal geometry.
Shallow sectioning effects
There is limited control for ideal alignment of crystals during the preparation of grain mounts, and effectively no control in the case of thin sections. But in contrast to the expected bias toward shallow angles (Pearce 1984), our data set largely consists of boundaries with relatively small deviations (<10°) from being ideally sectioned. As a consequence, accounting for the measured sectioning angle has a relatively limited effect of reducing the timescales from mostly 7–45 days (outliers between 60–104 days) to 6–44 days (outliers between 62–82 days; Fig. 15).

Comparison between timescales calculated with and without measured sectioning angle by U-stage. Note: these timescale shifts do not consider the effects of a shift in diffusivity. (a) Timescales uncorrected for shallow sectioning with the population of timescales ranging from 7–45 days with outliers between 60–104 days. (b) Timescales corrected for shallow sectioning with a population of timescales ranging from 6–44 days with outliers between 62–82 days. The corrected timescales show an overall shortening compared to the corrected timescales.
Since the combined uncertainty of binary Fe-Mg inter-diffusion in olivine due to temperature, activation energy, and D0 is 0.34–0.38 log units, an average 0.011 log shift toward longer timescales cannot be considered critical at a population level, for olivine grains of this large size relative to their narrow diffusion width.
Overall, the relatively low occurrence of significantly shallow sectioning angles within the RU0701 data set is likely due to the unconscious selection of crystal slices and faces analyzed combined with the large relative difference in crystal size to profile length. Even when trying to remove bias, unworkable crystal slices do not make the initial selection. Sectioning angle uncertainty is likely to become more important in small data sets and in circumstances where context is lacking or where only one crystal margin can be considered.
Understanding crystal shape
Shea et al. (2015a) conducted a comparison between 1D, 2D, and 3D diffusion modeling of timescales from slices based on theoretical polyhedral, spherical, and cuboid shapes. They found that timescale distributions vary depending on the crystal faces present and the angles between the faces. These authors also showed that the difference between measured/calculated to real timescales can be especially variable where diffusion fronts from adjacent crystal faces converge, i.e., where profiles are extracted nearer corners. This results in a longer apparent profile and therefore an apparent longer timescale when modeled. These zones are a common feature of polyhedral crystal slices (a common natural crystal shape) where faces meet at <180°.
We considered the Piton crystal form, as the rounding of crystal faces will enhance the effect of merging diffusion fronts and the arrangement of crystals. We also considered if grains were single crystals or present as aggregates, and how these came together, whether by syneusis (Schwindinger and Anderson 1989) or paired nucleation. Diffusion timescales may be affected by a “pre-history” of individual parts, a change in boundary conditions that coincide with their coming together.
An observation made possible here due to the 3D data is the absence of an (001) face; the theoretical olivine shape used in the study of Shea et al. (2015a) does have an (001) face. Furthermore, the 3D data demonstrate that the olivine crystals do not conform to an “ideal” solitary crystal morphology. An initial comparison of a slice through the polyhedral olivine shape used by Shea et al. (2015a) and a slice through a 3D rendered natural crystal at the same orientation is sufficient to illustrate that the natural crystal is not perfectly euhedral and that additional faces are present within crystals (Fig. 16). In this case, a timescale calculation is unlikely to suffer much uncertainty due to the relatively narrow margins and wide areas from which to choose a profile away from corners. But without 3D data, this view would only be intersected by chance, and in the cases of smaller crystals with broader margins even subtle departures from an ideal shape will magnify the geometric uncertainties when studying natural crystals. Further work, and more comprehensive natural 3D data, is required to better link the value gained from using generalized synthetic crystal shapes with applications across various settings.

A comparison of (a) a slice through a synthetic olivine crystal generated using olivine shape matlab code from Shea et al. (2015a) and (b) slice through a natural Piton de la Fournaise crystal (from an SEM backscattered electron image) at the same orientation. Red ellipses highlight extra faces that are present in the synthetic crystal but not in the natural crystal, and the red and yellow lines in b highlight where two crystal faces are present in the natural crystal, whereas only one is present in the synthetic. The natural crystal also has embayments. (c) An olivine imaged in 3D and segmented from the groundmass using Image J and AVISO.
The XMT data set shows that natural crystals have added morphological complexity that may interact with diffused zones to a greater extent than has been considered in previous studies where only idealized morphologies have been investigated. It is clear that the effects of euhedrality and arrangement of the crystal agglomerates need to be more fully quantified to understand how crystal shape uncertainties may affect calculated diffusion times-cales. Uncertainty on calculated diffusion timescales would likely increase, yet placing “hard” numbers on this effect is difficult to establish since we used a polychromatic beam prior to method developments that attempt to address the inherent problems in deriving quantitative attenuation data using polychromatic beams (Pankhurst et al. 2014, 2018b, 2018c).
Fully quantitative 3D composition data throughout olivine crystals, which at this stage of research is still only possible using a monochromatic X‑ray beams, is needed to address these questions. Current work strives to develop a 3D method that uses polychromatic beams, is rapid, chemically quantitative, and able to resolve high-frequency gradients such as in crystal margins, with the same confidence as 2D imaging. At present, the 3D data provides the important observations that this natural crystal population is strongly affected by crystal rounding and is mostly present as crystal agglomerates.
Simultaneous crystal growth and changing boundary conditions
Each of the 13 dynamically modeled profiles were remodeled with a global cooling rate, and as the magma cools, the boundary condition continuously shifts, with simultaneous crystal growth. The cooling rate used for each profile (–0.5 ± 0.1 °C/h) is consistent with diffusion related to quenching and lava flow cooling and inferred from textural observations (an average peak growth rate of ~1.9 × 10⁻¹¹ ms–1 was applied to each profile). Most profiles (11 of 13 profiles) were re-modeled using an accelerating growth rate, rather than a linear growth rate, as the growth rate seems also to be a function of temperature and has to be increasing with continued cooling in most cases, based on the profile shapes.
Although the profiles show an apparent increased diffusion length due to crystal growth and changing boundary conditions effects, our advanced models accommodate how diffusion speed slows as the lava flow cools, and so the diffusion timescales do not become significantly shorter nor is the scatter of the data set significantly reduced. As a result of reducing epistemic uncertainty, there is an attendant increase in confidence that the scatter reflects real variation in crystal histories. This is corroborated by the observation of different final rim compositions (between Fo72 and Fo60): even though the crystals reflect a common cooling environment, the details of their final experiences were controlled locally by the availability of melt and other considerations, including pore space. This appears to be particularly important in the case of samples from lava flows where post-eruption cooling must be considered in petrogenetic interpretations, which could, in turn, free models of deeper magmatic plumbing system structure and dynamics from this frequently observed complexity. Cheng et al. (2020) suggest that it can be possible to create simple diffusion curves (as seen within our samples) as a result of changing boundary conditions due to flow dynamics if there is sufficient residence time for complex zoning patterns to evolve into simple zoning—we do not consider this to be the case for these PdlF olivines.
Implications
Uncertainty of individual diffusion timescales can be considerably reduced using a combination of three-dimensional observation and dynamic forward modeling that includes an assessment of growth and changing boundary conditions. The quantification of the sources of uncertainty upon the RU0701 data set allows us to better understand how they, and by extension, their corrections, affect timescale distributions and interpretation. The results have implications for the design of crystal diffusion studies, which we recommend should explicitly consider sectioning angle, 3D geometries, crystal growth, or changing boundary condition corrections on reported timescales. A re-appraisal of modeling assumptions, as demonstrated here, may significantly improve both the quality and quantity of data recovered from a suite of crystals. It follows that increased data set size per investment in resources, as well as increased confidence in timescale outputs, will have value as kinetic and kinematic views of magmatic processes improve toward full physical history reconstruction (e.g., Pankhurst et al. 2018b).
Our case study demonstrates that agreement can be found between the timescales of cooling at the scale of a lava flow and the range exhibited by the individual crystals it contains. This result would not have been possible without the need to consider dynamic modeling as a solution to poorly fitting initial profiles to simplistic diffusion models. The system-scale information required, such as intensive parameters and a model of melt evolution with cooling, in turn, provide a framework to better contextualize the variations observed in final rim composition and timescales. The consistently high-quality fits between raw data and models using a common cooling history and growth rate lead us to frame new questions regarding the variation of rim compositions and other details, which will be addressed in a subsequent contribution. It also provides a demonstration that the cooling regime within a lava flow can be obtained on the crystal scale, which likely holds value in understanding more complex flow settings.
The value in improving the quality of diffusion timescale data sets is expected to provide a better return on data-gathering investment, including observations at the population scale that are based on larger and more complete data sets and increase the detail and therefore utility of interpretations.
Funding statement: F.K.C. and D.J.M. acknowledge NERC Studentship number 1367441 for supporting this work. M.J.P. acknowledges an AXA Research Fund Fellowship that supported part of this work. Sample collection was made possible by the National Geographic Society (NGS 8330-07). XMT scanning was funded through UK-NERC grants NE/M013561/1 and NE/N018575/1.
Acknowledgments
We thank the reviewers and editor for their constructive comments and the handling of the manuscript. We thank T. Shea for the helpful discussions and use of the theoretical olivine shape MATLAB code. J.W. Williams and R. Walshaw are thanked for their assistance with sample preparation and the analytical facilities at the University of Leeds. R. Clark and A. Booth are thanked for providing valuable writing time to enable the preparation of this work for publication. L. Courtois and S. Nonni are thanked for assistance with XMT scanning.
References cited
Albarède, F., Luais, B., and Fitton, G. (1997) The geochemical regimes of Piton de la Fournaise volcano (Réunion) during the last 530 000 years. Journal of Petrology, 38(2), 171–201.10.1093/petroj/38.2.171Search in Google Scholar
Arganda-Carreras, I., Kaynig, V., Rueden, C., Eliceiri, K.W., Schindelin, J., Cardona, A., and Seung, H.S. (2017) Trainable Weka Segmentation: A machine learning tool for microscopy pixel classification. Bioinformatics, 33, 2424–2426.10.1093/bioinformatics/btx180Search in Google Scholar
Ariskin, A.A., Frenkel, M.Y., Barmina, G. S., and Nielsen, R.L. (1993) COGMAGMAT: A fortran program to model magma differentiation processes. Computers and Geosciences, 19, 115–1170.10.1016/0098-3004(93)90020-6Search in Google Scholar
Asimow, P.D., and Ghiorso, M.S. (1998) Algorithmic modifications extending MELTS to calculate subsolidus phase relations. American Mineralogist, 83, 1127–1131.10.2138/am-1998-9-1022Search in Google Scholar
Beattie, P. (1993) Olivine-melt and orthopyroxene-melt equilibria. Contributions to Mineralogy and Petrology, 115, 103–111.10.1007/BF00712982Search in Google Scholar
Blundy, J., and Cashman, K. (2008) Petrologic reconstruction of magmatic system variables and processes. Reviews in Mineralogy and Geochemistry, 69(1), 179–239.10.1515/9781501508486-007Search in Google Scholar
Boivin, P., and Bachèlery, P. (2009) Petrology of 1977 to 1998 eruptions of Piton de la Fournaise, La Réunion Island. Journal of Volcanology and Geothermal Research, 184(1–2), 109–125.10.1016/j.jvolgeores.2009.01.012Search in Google Scholar
Bouvet de Maisonneuve, C., Costa, F., Huber, C., Vonlanthen, P., Bachmann, O., and Dungan, M.A. (2016) How do olivines record magmatic events? Insights from major and trace element zoning. Contributions to Mineralogy and Petrology, 171(6), 1–20.10.1007/s00410-016-1264-6Search in Google Scholar
Brady, J.B., and Cherniak, D.J. (2010) Diffusion in minerals: An overview of published experimental diffusion data. Reviews in Mineralogy and Geochemistry, 72(1), 899–920.10.2138/rmg.2010.72.20Search in Google Scholar
Breiman, L. (2001) Random forests. Machine Learning, 1–33.Search in Google Scholar
Buades, A., Coll, B., and Morel, J.-M. (2011) Non-local means denoising. Image Processing Online. https://doi.org/10.5201/ipol.2011.bcm_nlm10.5201/ipol.2011.bcm_nlmSearch in Google Scholar
Buening, D.K., and Buseck, P.R. (1973) Fe-Mg lattice diffusion in olivine. Journal of Geophysical Research, 78(29), 6852–6862.10.1029/JB078i029p06852Search in Google Scholar
Bureau, H., Pineau, F., Métrich, N., Semet, M., and Javoy, M. (1998) A melt and fluid inclusion study of the gas phase at Piton de la Fournaise volcano (Réunion Island). Chemical Geology, 147, 115–130.10.1016/S0009-2541(97)00176-9Search in Google Scholar
Chakraborty, S. (2010) Diffusion coefficients in olivine, wadsleyite and ringwoodite. Reviews in Mineralogy and Geochemistry, 72(1), 603–639.10.2138/rmg.2010.72.13Search in Google Scholar
Chakraborty, S., Farver, J.R., Yund, R.A., and Rubie, D.C. (1994) Mg tracer diffusion in synthetic forsterite and San Carlos olivine as a function of PT and fO2. Physics and Chemistry of Minerals, 21, 489–500.10.1007/BF00203923Search in Google Scholar
Charlier, B.L.A., Morgan, D.J., Wilson, C.J.N., Wooden, J.L., Allan, A.S.R., and Baker, J.A. (2012) Lithium concentration gradients in feldspar and quartz record the final minutes of magma ascent in an explosive supereruption. Earth and Planetary Science Letters, 319-320, 218–227.10.1016/j.epsl.2011.12.016Search in Google Scholar
Cheng, L., Costa, F. and Bergantz, G. (2020) Linking fluid dynamics and olivine crystal scale zoning during simulated magma instrusion. Contributions to Mineralogy and Petrology, 175, 53.10.1007/s00410-020-01691-3Search in Google Scholar
Clague, D.A., and Denlinger, R.P. (1994) Role of olivine cumulates in destabilizing the flanks of Hawaiian volcanoes. Bulletin of Volcanology, 56(6–7), 425–434.10.1007/BF00302824Search in Google Scholar
Costa, F., and Chakraborty, S. (2004) Decadal time gaps between mafic intrusion and silicic eruption obtained from chemical zoning patterns in olivine. Earth and Planetary Science Letters, 227(3–4), 517–530.10.1016/j.epsl.2004.08.011Search in Google Scholar
Costa, F., and Dungan, M. (2005) Short time scales of magmatic assimilation from diffusion modeling of multiple elements in olivine. Geology, 33(10), 837.10.1130/G21675.1Search in Google Scholar
Costa, F., and Morgan, D. (2010) Time constraints from chemical equilibration in magmatic crystals. In A. Dosseto, S.P. Turner, and J.A. Van Orman, Eds., Timescales of Magmatic Processes: From core to atmosphere, 1st ed., 125–129. Blackwell Publishing Ltd.10.1002/9781444328509.ch7Search in Google Scholar
Costa, F., Chakraborty, S., and Dohmen, R. (2003) Diffusion coupling between trace and major elements and a model for calculation of magma residence times using plagioclase. Geochimica et Cosmochimica Acta, 67(12), 2189–2200.10.1016/S0016-7037(02)01345-5Search in Google Scholar
Costa, F., Dohmen, R., and Chakraborty, S. (2008) Time scales of magmatic processes from modeling the zoning patterns of crystals. Reviews in Mineralogy and Geochemistry, 69(1), 545–594.10.1515/9781501508486-015Search in Google Scholar
Couperthwaite, F.K., Thordarson, T., Morgan, D.J., Harvey, J., and Wilson, M. (2020) Diffusion timescales of magmatic processes in the Moinui lava eruption at Mauna Loa, Hawai`i, as inferred from bimodal olivine populations. Journal of Petrology, 61, 10.1093/petrology/egaa058.10.1093/petrology/egaa058Search in Google Scholar
Danyushevsky, L.V. (2001) The effects of small amounts of H2O on crystallisation of mid-ocean ridge and backarc basin magmas. Journal of Volcanology and Geothermal Research, 110, 265–280.10.1016/S0377-0273(01)00213-XSearch in Google Scholar
Danyushevsky, L.V., and Plechov, P. (2011) Petrolog3: Integrated software for modeling crystallization processes. Geochemistry, Geophysics, Geosystems, 12(7).10.1029/2011GC003516Search in Google Scholar
Darbon, J., Cunha, D., Chan, T.F., Osher, S., and Jensen, G.J. (2008) Fast nonlocal filtering applied to electron cryomicroscopy. Proceedings of the 5th IEEE International Symposium on Biomedical Imaging: From Nano to Macro, 1331–1334.10.1109/ISBI.2008.4541250Search in Google Scholar
Dohmen, R., and Chakraborty, S. (2007a) Fe-Mg diffusion in olivine II: Point defect chemistry, change of diffusion mechanisms and a model for calculation of diffusion coefficients in natural olivine. Physics and Chemistry of Minerals, 34(6), 409–430.10.1007/s00269-007-0158-6Search in Google Scholar
Dohmen, R., and Chakraborty, S. (2007b) Fe-Mg diffusion in olivine II: Point defect chemistry, change of diffusion mechanisms and a model for calculation of diffusion coefficients in natural olivine. Erratum. Physics and Chemistry of Minerals, 34, 597–598.10.1007/s00269-007-0185-310.1007/s00269-007-0185-3Search in Google Scholar
Dohmen, R., and Milke, R. (2010) Diffusion in polycrystalline materials: Grain boundaries, mathematical models, and experimental data. Reviews in Mineralogy and Geochemistry, 72(1), 921–970.10.2138/rmg.2010.72.21Search in Google Scholar
Dohmen, R., Becker, H.-W., and Chakraborty, S. (2007) Fe-Mg diffusion in olivine I: Experimental determination between 700 and 1200 °C as a function of composition, crystal orientation and oxygen fugacity. Physics and Chemistry of Minerals, 34(6), 389–407.10.1007/s00269-007-0157-7Search in Google Scholar
Donovan, J., Kremser, D., and Fournelle, J. (2012) Probe for EPMA: Acquisition automation and analysis. Probe Software Inc.Search in Google Scholar
Famin, V., Welsch, B., Okumura, S., Bachèlery, P., and Nakashima, S. (2009) Three differentiation stages of a single magma at Piton de la Fournaise volcano (Reunion hot spot). Geochemistry, Geophysics, Geosystems, 10(1), Q01007.10.1029/2008GC002015Search in Google Scholar
Füri, E., Hilton, D.R., Murton, B.J., Hémond, C., Dyment, J., and Day, J.M.D. (2011) Helium isotope variations between Réunion Island and the Central Indian Ridge (17–21 S): New evidence for ridge-hotspot interaction. Journal of Geophysical Reearch: Solid Earth, 116(B2).10.1029/2010JB007609Search in Google Scholar
Geiger, H., Mattson, T., Deegan, F.M., Troll, V.R., Burchardt, S., Gudmundsson, O., Tryggvason, A., Krumbholz, M., and Harris, C. (2016) Magma plumbing for the 2014–2015 Holuhrun eruption, Iceland. Geochemistry, Geophysics, Geosystems, 17, 2825–2834.10.1002/2016GC006317Search in Google Scholar
Ghiorso, M.S., and Sack, R.O. (1995) Chemical mass transfer in magmatic processes. IV. A revised and internally consistent thermodynamic model for the interpolation and extrapolation fo liquid-solid equilibria in magmatic systems at elevated temperatures and pressures. Contributions to Mineralogy and Petrology, 119, 197–212.10.1007/BF00307281Search in Google Scholar
Hartley, M.E., Morgan, D.J., Maclennan, J., Edmonds, M., and Thordarson, T. (2016) Tracking timescales of short-term precursors to large basaltic fissure eruptions through Fe-Mg diffusion in olivine. Earth and Planetary Science Letters, 439, 58–70.10.1016/j.epsl.2016.01.018Search in Google Scholar
Hastie, T., Tibshirani, R., and Friedman, J. (2008) The Elements of Statistical Learning: Data mining, inference and prediction, 2nd ed. Springer.10.1007/978-0-387-84858-7Search in Google Scholar
Helz, R.T., and Thornber, C.R. (1987) Geothermometry of Kilauea Iki lava lake, Hawaii. Bulletin of Volcanology, 651–668.10.1007/BF01080357Search in Google Scholar
Hon, K., Kauahikaua, J., Denlinguer, R., and Mackay, K. (1994) Emplacement and inflation of pahoehoe sheet flows: Observations and measurements of active lava flows on Kilauea Volcano, Hawaii. Geological Society of America Bulletin, 106(3), 351–370.10.1130/0016-7606(1994)106<0351:EAIOPS>2.3.CO;2Search in Google Scholar
Huebner, J., and Sato, M. (1970) The oxygen fugacity-temperature relationships of manganese oxide and nickel oxide buffers. American Mineralogist, 55, 934–952.Search in Google Scholar
Jarosewich, E., Nalen, J.A., and Norberg, J.A. (1980) Reference standards for electron microprobe analysis. Geostandards Newsletter, 4, 43–47.10.1111/j.1751-908X.1980.tb00273.xSearch in Google Scholar
Jerram, D.A., Dobson, K.J., Morgan, D.J., and Pankhurst, M.J. (2018) The petrogenesis of magmatic systems: Using igneous textures to understand magmatic processes. Volcanic and Igneous Plumbing Systems. Elsevier.10.1016/B978-0-12-809749-6.00008-XSearch in Google Scholar
Kahl, M., Chakraborty, S., Costa, F., and Pompilio, M. (2011) Dynamic plumbing system beneath volcanoes revealed by kinetic modeling and the connection to monitoring data: An exmaple from Mt. Etna. Earth and Planetary Science Letters, 308, 11–22.10.1016/j.epsl.2011.05.008Search in Google Scholar
Kahl, M., Chakraborty, S., Costa, F., Pompilio, M., Liuzzo, M., and Viccaro, M. (2013) Compositionally zoned crystals and real-time degassing data reveal changes in magma transfer dynamics during the 2006 summit eruptive episodes of Mt. Etna. Bulletin of Volcanology, 75(2), 692.10.1007/s00445-013-0692-7Search in Google Scholar
Kile, D. (2009) The universal stage: The past, present, and future of a mineralogical research instrument. Geochemical News, 1–21.Search in Google Scholar
Lacroix, A. (1912) Les laves du volcan actif de la Réunion. C. R. Acad. Sci. Paris T154. 251–257.Search in Google Scholar
Lacroix, A.F.A. (1936) Le volcan actif de l’ile de la Réunion et ses produits. Gauthier-Villars, Paris, 1–297.Search in Google Scholar
Lénat, J.-F., Bachèlery, P., and Merle, O. (2012) Anatomy of Piton de la Fournaise volcano (La Réunion, Indian Ocean). Bulletin of Volcanology, 74(9), 1945–1961.10.1007/s00445-012-0640-ySearch in Google Scholar
Lesher, C.E. (2010) Self-diffusion in silicate melts: Theory, observations and applications to magmatic systems. Reviews in Mineralogy and Geochemistry, 72(1), 269–309.10.1515/9781501508394-008Search in Google Scholar
Lloyd, G.E. (1987) Atomic number and crystallographic contrast images with the SEM: A review of backscattered electron techniques. Mineralogical Magazine, 51(359), 3–19.10.1180/minmag.1987.051.359.02Search in Google Scholar
Longpré, M.-A., Staudacher, T., and Stix, J. (2006) The November 2002 eruption at Piton de la Fournaise volcano, La Réunion Island: Ground deformation, seismicity, and pit crater collapse. Bulletin of Volcanology, 69(5), 511–525.10.1007/s00445-006-0087-0Search in Google Scholar
Lynn, K.J., Garcia, M.O., Shea, T., Costa, F., and Swanson, D.A. (2017) Timescales of mixing and storage for Keanakāko‘i Tephra magmas (1500–1820 C.E.), Kīlauea Volcano, Hawai‘ i. Contributions to Mineralogy and Petrology, 172(9).10.1007/s00410-017-1395-4Search in Google Scholar
Martin, V.M., Morgan, D.J., Jerram, D.A., Caddick, M. J., Prior, D.J., and Davidson, J.P. (2008) Bang! Month-scale eruption triggering at Santorini volcano. Science, 321(5893), 1178.10.1126/science.1159584Search in Google Scholar PubMed
Morgado, E., Parada, M.A., Morgan, D.J., Gutiérrez, F., Castruccio, A., and Contreras, C. (2017) Transient shallow reservoirs beneath small eruptive centres: Constraints from Mg-Fe interdiffusion in olivine. Journal of Volcanology and Geothermal Research, 347, 327–33610.1016/j.jvolgeores.2017.10.002Search in Google Scholar
Morgan, D.J., Blake, S., Rogers, N.W., De Vivo, B., Rolandi, G., and Davidson, J.P. (2006) Magma chamber recharge at Vesuvius in the century prior to the eruption of A.D. 79. Geology, 34(10), 845.10.1130/G22604.1Search in Google Scholar
Morgan, G.B., and London, D. (1996) Optimizing the electron microprobe analysis of hydrous alkali aluminosilicate glasses. American Mineralogist, 81, 1176–1185.10.2138/am-1996-9-1016Search in Google Scholar
Mutch, E.J.F., Maclennan, J., Shorttle, O., Edmonds, M., and Rudge, J.F. (2019) Rapid transcrustal magma movement under Iceland. Nature Geoscience, 12, 569–574.10.1038/s41561-019-0376-9Search in Google Scholar
Pankhurst, M.J., Dobson, K.J., Morgan, D.J., Loughlin, S.C., Thordarson, T., Lee, P.D., and Courtois, L. (2014) Monitoring the magmas fuelling volcanic eruptions in near-real-time using X‑ray micro-computed tomography. Journal of Petrology, 55, 671–684.10.1093/petrology/egt079Search in Google Scholar
Pankhurst, M.J., Walshaw, R., and Morgan, D.J. (2016) Major element chemical heterogeneity in Geo2 olivine microbeam reference material: a spacial approach to quantifying heterogeneity in primary reference materials. Geostandards and Geoanalytical Research, 41, 85–91.10.1111/ggr.12134Search in Google Scholar
Pankhurst, M.J., Fowler, R., Courtois, L., Nonni, S., Zuddas, F., Atwood, R.C., Davis, G.R., and Lee, P.D. (2018a) Enabling three-dimensional densitometric measurements using laboratory source X‑ray micro-computed tomography. SoftwareX, 7, 115–121.10.1016/j.softx.2018.03.004Search in Google Scholar
Pankhurst, M.J., Morgan, D.J., Thordarson, T., and Loughlin, S.C. (2018b) Magmatic crystal records in time, space, and process, causatively linked with volcanic unrest. Earth and Planetary Science Letters, 493, 231–241.10.1016/j.epsl.2018.04.025Search in Google Scholar
Pankhurst, M.J., Vo, N.T., Butcher, A.R., Long, H., Wang, H., Nonni, S., Harvey, J., Gudfinnsson, G., Fowler, R., Atwood, R., Walshaw, R., and Lee, P. (2018c) Quantitative measurement of olivine composition in three dimensions using helical-scan X‑ray-microtomography. American Mineralogist, 103, 1800–1811.10.2138/am-2018-6419Search in Google Scholar
Pearce, T.H. (1984) The analysis of zoning in magmatic crystals with emphasis on olivine. Contributions to Mineralogy and Petrology, 86(2), 149–154.10.1007/BF00381841Search in Google Scholar
Peltier, A., Bachèlery, P., and Staudacher, T. (2009) Magma transport and storage at Piton de La Fournaise (La Réunion) between 1972 and 2007: A review of geophysical and geochemical data. Journal of Volcanology and Geothermal Research, 184(1–2), 93–108.10.1016/j.jvolgeores.2008.12.008Search in Google Scholar
Peters, B.J., Day, J.M.D., and Taylor, L.A. (2016) Early mantle heterogeneities in the Réunion hotspot source inferred from highly siderophile elements in cumulate xenoliths. Earth and Planetary Science Letters, 448, 150–160.10.1016/j.epsl.2016.05.015Search in Google Scholar
Petrone, C.M., Braschi, E., Francalanci, L., Casalini, M., and Tommasini, S. (2018) Rapid mixing and short storage timescale in the magma dynamics of a steady-state volcano. Earth and Planetary Science Letters, 492, 206–221.10.1016/j.epsl.2018.03.055Search in Google Scholar
Putirka, K.D. (2008) Thermometers and barometers for volcanic systems. Reviews in Mineralogy and Geochemistry, 69(1), 61–120.10.1515/9781501508486-004Search in Google Scholar
Reed, S.J.B. (2005) Electron Microprobe Analysis and Scanning Electron Microscopy in Geology, 2nd ed. Cambridge University Press.10.1017/CBO9780511610561Search in Google Scholar
Rhodes, J.M., and Vollinger, M.J. (2005) Ferric/ferrous ratios in 1984 Mauna Loa lavas: A contribution to understanding the oxidation state of Hawaiian magmas. Contributions to Mineralogy and Petrology, 149(6), 666–674.10.1007/s00410-005-0662-ySearch in Google Scholar
Ruth, D.C.S., Costa F., Bouvet de Maisonneve, C., Franco, L., Cortés, J.A., and Calder, E.S. (2018) Crystal melt inclusion timescales reveal the evolution of magma migration before eruption. Nature Communications, 9, 2657.10.1038/s41467-018-05086-8Search in Google Scholar PubMed PubMed Central
Schneider, C.A., Rasband, W.S., and Eliceiri, K.W. (2012) NIH Image to ImageJ: 25 years of image analysis. Nature Methods. Nature Publishing Group, 9(7), 671–675.10.1038/nmeth.2089Search in Google Scholar PubMed PubMed Central
Schwindinger, K.R., and Anderson, A.T. Jr. (1989) Synneusis of Kilauea Iki olivines. Contributions to Mineralogy and Petrology, 103(2), 187–198.10.1007/BF00378504Search in Google Scholar
Servadio, Z., Villeneuve, N., and Bachelery, P. (2013) Automatic mapping of the lava flows at Piton de la Fournaise volcano, by combining thermal data in near and visible infrared. Remote Sensing - Applications. Boris Escalante.10.5772/37685Search in Google Scholar
Shea, T., Costa, F., Krimer, D., and Hammer, J.E. (2015a) Accuracy of timescales retrieved from diffusion modeling in olivine: A 3D perspective. American Mineralogist, 100(10), 2026–2042.10.2138/am-2015-5163Search in Google Scholar
Shea, T., Lynn, K.J., and Garcia, M.O. (2015b) Cracking the olivine zoning code: Distinguishing between crystal growth and diffusion. Geology, 43(10), 935–938.10.1130/G37082.1Search in Google Scholar
Soille, P., and Vincent, M. (1990) Determining watersheds in digital pictures via flooding simulations. Society of Photo-Optical Instrumentation Engineers, Proceedings Volume, 1360, 240–250.Search in Google Scholar
Wagstaff, K., Cardie, C., Rogers, S., and Schroedl, S. (2001) Constrained K-means clustering with background knowledge. Proceedings of the Eighteenth International Conference on Machine Learning, 577–584.Search in Google Scholar
Welsch, B., Faure, F., Famin, V., Baronnet, A., and Bachelery, P. (2013) Dendritic crystallization: A single process for all the textures of olivine in basalts? Journal of Petrology, 54(3), 539–574.10.1093/petrology/egs077Search in Google Scholar
Wieser, P.E., Vukmanovic, Z., Kilian, R., Ringe, E., Holness, M.B., Maclennan, J., and Edmonds, M. (2019) To sink, swim, twin or nucleate: A critical appraisal of crystal aggregation processes. Geology, 47, 948–952.10.1130/G46660.1Search in Google Scholar
© 2021 Walter de Gruyter GmbH, Berlin/Boston
This work is licensed under the Creative Commons Attribution 4.0 International License.
Articles in the same Issue
- An evolutionary system of mineralogy. Part III: Primary chondrule mineralogy (4566 to 4561 Ma)
- Raman spectroscopy study of manganese oxides: Layer structures
- Raman signatures of the distortion and stability of MgCO3 to 75 GPa
- Competitive adsorption geometries for the arsenate As(V) and phosphate P(V) oxyanions on magnetite surfaces: Experiments and theory
- Probing the transformation paths from aluminum (oxy)hydroxides (boehmite, bayerite, and gibbsite) to metastable alumina: A view from high-resolution 27Al MAS NMR
- Crystal structures of K-cymrite and kokchetavite from single-crystal X-ray diffraction
- Fluid source and metal precipitation mechanism of sediment-hosted Chang’an orogenic gold deposit, SW China: Constraints from sulfide texture, trace element, S, Pb, and He-Ar isotopes and calcite C-O isotopes
- Iron isotope fractionation in reduced hydrothermal gold deposits: A case study of the Wulong gold deposit, Liaodong Peninsula, East China
- Tungsten mineralization during the evolution of a magmatic-hydrothermal system: Mineralogical evidence from the Xihuashan rare-metal granite in South China
- Crystallization and melt extraction of a garnet-bearing charnockite from South China: Constraints from petrography, geochemistry, mineral thermometry, and rhyolite-MELTS modeling
- Reducing epistemic and model uncertainty in ionic inter-diffusion chronology: A 3D observation and dynamic modeling approach using olivine from Piton de la Fournaise, La Réunion
- Memorial of James Joseph Papike (1937–2020)
- Erratum