Non-Contributory Benefits in Germany – An Analysis Using Generational Accounting
-
Sebastian Schultis
 and
Sebastian Stramka
and
Sebastian Stramka
Sebastian Schultis andSebastian Stramka are Research Associates at the Research Centre for Generational Contracts and Academic Lecturers at the Institute for Public Finance and Social Policy at the Albert-Ludwigs-University of Freiburg, Germany.

Abstract
This paper delves into the intricacies of Germany’s social security system, focusing on the intergenerational distribution of non-contributory benefits and reform possibilities for achieving fiscal sustainability. Utilizing the framework of generational accounting, the study reveals an implicit debt of 45.3 percent of Germany’s GDP in the long run based on benefits that are not tied to prior contributions, such as non-insurance benefits within social insurance and supplementary state benefits. Based on an analysis of four refinancing scenarios, we conclude that addressing this deficit requires a constant increase of 2.6 percent in total government revenue or a reduction in non-insurance benefits of 4.1 percent for all social security benefits. These adjustments, as well as the resulting intergenerational distribution of burdens, depend on the timing of the respective reforms. While sustainability reforms generally place a burden on all current generations, one-time, permanent adjustments lead to an equalization of burdens, whereas year-specific adjustments place heavier burdens on future generations than on current ones. The paper notes potential policy implications and highlights the impact of selected refinancing reforms on intergenerational burden distribution, inviting further research on this topic.
Zusammenfassung
Dieser Beitrag befasst sich mit den Feinheiten des deutschen Sozialversicherungssystems und konzentriert sich dabei auf die intergenerative Verteilung beitragsfremder Leistungen sowie möglicher Reformen zur Erzielung fiskalischer Nachhaltigkeit. Mithilfe der Methode der Generationenbilanzierung wird in Bezug auf beitragsfremde Leistungen, bestehend aus versicherungsfremden Leistungen der Sozialversicherungen sowie staatlichen Leistungen, eine langfristige implizite Verschuldung in Höhe von 45,3 Prozent des BIP ermittelt. Durch die Analyse von vier Refinanzierungsszenarien kommen wir zu dem Schluss, dass die Beseitigung dieses Defizits eine konstante Erhöhung der gesamten Staatseinnahmen um 2,6 Prozent oder eine Reduzierung der versicherungsfremden Leistungen um 4,1 Prozent aller Sozialversicherungsleistungen erfordert. Im Allgemeinen belasten solche Nachhaltigkeitsreformen alle heute lebenden Generationen. Ihr Ausmaß sowie die sich daraus ergebende intergenerative Lastenverteilung sind jedoch zeitabhängig. Einmalige Anpassungen bewirken einen intergenerativen Belastungsausgleich, während jahresspezifische Anpassungen zukünftige Generationen stärker belasten als gegenwärtige. Unsere Ergebnisse zeigen mögliche politische Implikationen auf, verdeutlichen die Auswirkungen ausgewählter Refinanzierungsreformen auf die intergenerative Lastenverteilung und bilden eine Grundlage für zukünftige Forschungsarbeiten zu diesem Thema.
1 Introduction
The German social security system serves as a central tool through which the public sector fulfils a wide array of vital responsibilities towards citizens. This system is designed to address social risks such as old age, reduced earning capacity and illness. The economic challenges to fiscal policy posed by ongoing demographic change have been extensively discussed (cf. Werding/Hofmann 2008; Hagist et al. 2009). A fiscal policy of debt-financed spending theoretically allows these economic challenges to be overcome; however, in a dynamic-efficient situation, where the interest rate on public debt exceeds the growth rate of the economy, such a policy cannot be pursued indefinitely as this leads to an unsustainable accumulation of debt. In addition, increasingly higher risk premiums (Andersen 2020; Werding 2021) and interest rate risks (GCEE 2019) exacerbate this unsustainability. These economic constraints are politically recognized through the European Community Treaty and the German debt brake – measures showcasing that policymakers have responded to the debate on public debt by defining rules for fiscal policy. From an economic perspective, these rules can be seen as a positive sign for the state’s credit rating on the capital market (GCEE 2019). However, these debt restrictions only account for explicit debt and do not consider future payment obligations. The short-term perspective of the federal budget plan – created according to these fiscal rules – reveals the myopic nature of fiscal policy, which does not consider such implicit debt. Since public debt cannot be increased indefinitely, implicit debt generates a need to balance fiscal policy for current and future generations. In addition to this long-term intergenerational balancing act, the inherent redistribution of the social security system across current generations also needs to be addressed when seeking fiscal sustainability. It is therefore important to examine the intergenerational distribution of cash flows between the government and individuals and to what extent fiscal sustainability can be achieved.
To address this issue, various studies have focused on developing indicators and measuring fiscal sustainability (cf. Benz/Fetzer 2006; Andersen 2020; Werding 2021), both for the total state budget and for specific institutions, such as social long-term care insurance (LTC) and statutory pension insurance (SPI; cf. Bahnsen/Raffelhüschen 2019; Seuffert 2022). In contrast, this paper examines the fiscal sustainability and redistributive effects of social benefits, which extend across all social insurance schemes in the form of non-insurance benefits. Since social benefits in Germany can, in accordance with the German Social Code (Sozialgesetzbuch, SGB), be granted either by a social insurance or the state, to assess the fiscal sustainability status of all social benefits not covered by contributions, these state social benefits are also included in this analysis. As it examines only part of total government revenue and expenditure, conclusions can be drawn about non-contributory benefits, but not about overall fiscal sustainability.
This approach has several advantages as policy implications across different social insurance branches and the sustainable design of non-contributory benefits can be derived from it. Unlike prior studies, this paper analyses the benefits granted for services, which are understood as a task for society, irrespective of the specific subsystem. This approach also facilitates a depiction of the intergenerational effects of altering such benefits. A sustainable design of non-contributory benefits also extends to broader societal responsibilities that are not exclusive to social insurance, thereby relieving the funding situation of the social insurance schemes. This analysis builds on the framework of generational accounting, a well-supported instrument for making statements about intergenerational distributions and the fiscal sustainability of public finances (cf. Auerbach et al. 1991, 1992, 1994). Thus, this paper contributes to existing research concerning generational accounting while also introducing a long-term intergenerational dimension to the ongoing discourse about necessary social security reforms.
The following section offers a categorization of Germany’s social benefits. The methodological approach and four scenarios to achieve sustainability within non-contributory benefits are described subsequently. The results section presents the intergenerational distribution of non-contributory benefits and age-specific burdens, which are discussed in the conclusion.
2 German Social Security Benefits
The primary objective of the German social security system is to ensure a dignified standard of living for German residents by addressing social risks such as longevity, illness, unemployment and death (cf. §§ 1 I, 4 II SGB I). This system comprises five distinct social insurance branches, along with benefits provided by the state itself. The latter are financed directly from the state budget and include benefits such as parental leave allowance or basic social security. The five social insurance schemes – SPI, LTC, social health insurance (SHI), unemployment insurance (UI) and statutory accident insurance (SAI) – provide benefits such as an old-age pension, medical assistance during illness and unemployment benefits to counteract social risks. These are financed primarily by contributions and, in some cases, by a federal subsidy.
Based on their financing, social insurance benefits can be divided into insurance and non-insurance benefits; this does not mean that a given benefit, such as old-age pensions, is entirely attributable to one of these categories, but rather that a benefit may be partially non-insurance- and partially insurance-affiliated. Following the insurance principle, a benefit needs to be based on equivalent contributions to be considered an insurance benefit. Consequently, every benefit of social insurance is to be regarded as an insurance benefit to the extent that it is matched by equivalent contribution payments. Determining such equivalent contributions, especially when contributors and beneficiaries differ, is a frequently discussed challenge (cf. Schmähl 2003; Reimann 2007). Mackscheidt and Maier-Rigaud (2020) propose using the level of federal subsidies as an approximation to address this problem. For the SHI, these subsidies specifically cover non-insurance benefits, while in other social insurance schemes they address the insurance-specific deficit. These deficits exist because parts of the social insurance benefits fulfil tasks for society as a whole and are therefore not compensated by equivalent contributions (cf. § 213 III SGB VI; Rürup 2004). Since insurance benefits must be matched by equivalent contributions to follow the insurance principle, social insurance benefits are to be assessed as non-insurance benefits to the amount of the respective federal subsidy. Thus, social insurance benefits are to be evaluated as insurance benefits to the extent that they are financed through contributions, and as non-insurance benefits to the extent that they are covered by federal subsidies.
The social security system also includes benefits that are directly attributable to the state budget. Since these benefits are not linked to specific contribution payments, they are guided by the welfare principle, which mandates state support for all eligible residents through benefits in kind or in cash. Therefore, benefits based on this principle are referred to as supplementary state social benefits in this paper. A further guiding principle is the principle of provision, and specifically its subset, the principle of alimentation, which applies to civil servants. The principle of provision obligates the state to support individuals who have provided special service to society, like war victims or civil servants. Since these services can be considered economically as non-monetary contributions, benefits based on this principle are excluded from the analysis. As a synthesis of the considerations made, three central concepts of benefits emerge. Supplementary state social benefits (referred to as ‘state benefits’) and non-insurance benefits both describe benefits that are not matched by directly attributable contribution payments and are granted by the state itself or by a social insurance, respectively. The term non-contributory benefits covers the totality of these two concepts and does not distinguish between the origins of the respective benefits.
3 Methodology, Data and Assumptions
3.1 Methods
To examine non-contributory benefits and their induced burden, this paper builds on the framework of generational accounting, developed by Auerbach et al. (1991, 1992, 1994). Comparable to the approach of the Federal Ministry of Finance (2024a) and the Fiscal Sustainability Report of the European Commission (2022), generational accounting enables long-term analyses of fiscal sustainability. However, generational accounting differs from the other approaches by allocating the entire micro-data basis age-specifically, which allows for an examination at the individual level. Nevertheless, the European Commission’s (2022) understanding of fiscal sustainability and the generational accounting approach are essentially identical: fiscal policy is considered sustainable if the intertemporal government budget constraint in equation (1) is met. Therefore, fiscal sustainability can only exist if explicitly reported public debt ( ) is covered by the present value of aggregated net cash flows (
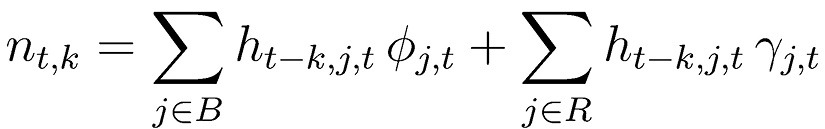
 ) from current and future generations.[1] denotes the present value, as of year t, of payments to the state minus transfers received by a generation born in year k. The first summation in equation (1)[2] represents aggregated net cash flows from generations alive in year t, while the second covers those from future generations.
 (1)
(1)
Generational accounting has already been critically scrutinized in the literature. Certain limitations – e.g. the question of whether the neoclassical assumption of a long-term binding budget constraint is valid – have emerged. In the context of this analysis, however, the choice of an acceptable level of long-term debt caused by non-contributory benefits would be arbitrary. Hence, the sustainability indicators should be understood as a benchmark rather than a forecast. Further theoretical and empirical limitations are present in the literature, which mainly focuses on a lack of intragenerational consideration (Williamson/Rhodes 2011), individuals’ myopic planning horizons and high parameter dependency (Haveman 1994; Raffelhüschen 1999). Nevertheless, generational accounting can be a suitable instrument for measuring intergenerational distribution and fiscal sustainability if these shortcomings are recognized and the results are checked for their sensitivity (Feist/Raffelhüschen 2000; Williamson/Rhodes 2011).
The intergenerational distribution of government revenue and spending results from present and future age-specific income and expenditure flows. Following the methodology proposed by Raffelhüschen (1999) and Bonin (2001), these cash flows are determined by using the aggregates  of the national accounts in the base year 2022 (Federal Statistical Office 2024). Therein, index j refers to an element of the national accounts, with government revenue (expenditure) representing positive (negative) aggregates. All aggregates are allocated to the population on an age-, gender- and nationality-specific basis using micro-data records.[3] Similar to the aggregates
  , per capita cash flows for the base year
  are also positive for government revenue and negative for government expenditure. k represents the birth year of a cohort, so that 2022–k corresponds to the age of an individual in this cohort in 2022. j refers to an element of the national accounts. Unless more precise forecasts are available, these per capita cash flows are extrapolated into the future using an annual productivity growth rate (g). Multiplying by the projected population and subsequently summing it across all living cohorts results in the future aggregates of government revenue and expenditure (
 ). These aggregates are used to determine the level of non-insurance and state benefits and the corresponding sustainability indicators; this approach enables an assessment of the fiscal sustainability of particular social insurance branches as well as an examination of state and non-insurance benefits in terms of their intergenerational distribution.
For the allocation of aggregates to non-insurance or state benefits, all revenue and expenditure cash flows listed in the national accounts are assigned to distinct sets. The elements of subset  are all cash flows that represent direct payments by individuals to the national budget. Similarly, the subset
  lists all cash flows that are contributions by individuals to the social insurance z. The set R summarizes these subsets (i.e.
  ). The set of all government benefits B is divided into multiple subsets (
 ). Set
  comprises all benefits that are neither state benefits nor benefits from any social insurance. Set
  contains all state benefits, while set
  contains all benefits from the social insurance z. For both sets R and B, an element only specifies the designation of the corresponding cash flow but not its amount.
Because there is a lack of statistical data allowing for an accurate determination of the amount of non-insurance benefits (Raffelhüschen et al. 2011; ASFGP 2016), the share of non-insurance benefits of each of the five social insurance branches is determined at an aggregated level. Following the approach proposed by Mackscheidt and Maier-Rigaud (2020), the aggregated value of the federal subsidy in a given year is used as an approximation to determine the share to which benefits granted by social insurance are regarded as non-insurance benefits in that year. The federal subsidy  is defined by the institutional affiliation of a benefit j to social insurance z, so that the index z depends on the benefit j. The share of this subsidy within the total revenue of that social insurance – consisting of the sum of all aggregated contribution payments (
 ) and the corresponding subsidy – is the proportion
  to which each of its benefits represents a non-insurance benefit (equation (2)).[4] Consequently, all expenditure of all social insurance branches is included in the calculation with their respective proportions. In contrast, state benefits (i.e.
  ) are considered in their full amount. This procedure allows conclusions to be drawn regarding possible implicit debt attributable to non-insurance benefits.
 (2)
(2)
On the revenue side, following the budget principle of universality, all elements corresponding to revenues that accrue directly to the state budget (i.e.  ) are treated equally. These revenues are used to finance both state benefits and federal subsidies, thereby ultimately financing non-insurance benefits as well. Since contribution payments to social insurance justify insurance benefits, the corresponding elements – contained in subset
  – are omitted from the financing of non-contributory benefits. The proportion
  , defined in equation (3), indicates the extent to which each revenue cash flow contributes to financing non-contributory benefits.
 (3)
(3)
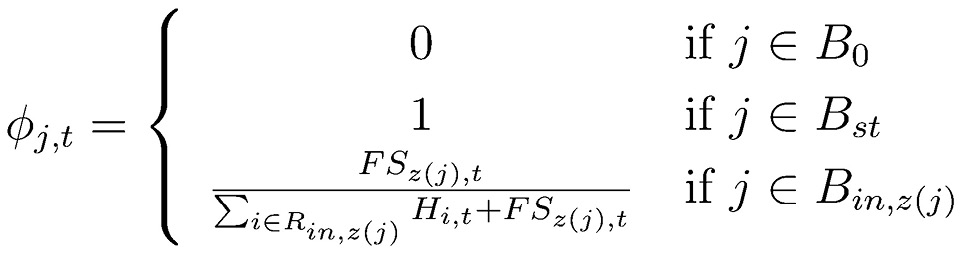
For all elements within the set  ,
,  is determined using two fractions. The first fraction gives the ratio of the sum of all non-contributory benefits to total government and social insurance expenditure. Since both sums are formed over the same set B, the difference is only due to the factor
  , which weights all items i that are not non-contributory benefits in the numerator by zero. As not all revenue items are used to finance non-contributory benefits, the revenue items allocated for financing these benefits must be scaled up. This ensures that the ratio of scaled revenue to total revenue corresponds to the share of non-contributory benefits in total expenditure. The second fraction in equation (3) achieves this scaling by representing the ratio of total government revenue – including social insurance contributions – to revenue used to finance non-contributory benefits. By adjusting the first fraction upwards, this process ensures the ratio of revenue used to finance non-contributory benefits to total revenue corresponds to the ratio of non-contributory expenditure to total expenditure; this in turn transfers any potential deficits within the social insurance schemes (cf. Bahnsen/Raffelhüschen 2019) proportionately to non-contributory benefits. For all elements within
  , the proportion
  equals zero, as contribution payments are not considered.
In line with the methodology of Raffelhüschen (1999) and Hagist (2013), the calculation of per capita net payments related to non-contributory benefits is given in equation (4). Here,  represents the average cash flow between an individual of cohort k and the state in year t regarding element j.[5] These cash flows are weighted with
  and
and  respectively.
 (4)
(4)
The resulting net cash flows  denote the payments to the state regarding non-contributory benefits minus non-contributory benefits received by an average individual of cohort k in year t. The development of future per capita net cash flows (
 ) is subject to the corresponding year-specific share values
  and
and  as well as the status quo assumption.[6] On the basis of these per capita net cash flows, equation (5) determines the present value of aggregated net cash flows () of cohort k, taking the cohort size (
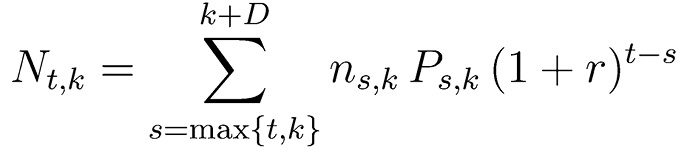
 ) into account.
 (5)
(5)
 forms the basis for two central indicators of generational accounting. Firstly, generational accounts (
 ) can be derived by adjusting for the population (equation (6)). They reflect the present value of net payments of an average individual from cohort k in year t over their remaining life cycle. Secondly,
  is used to calculate the implicit debt (
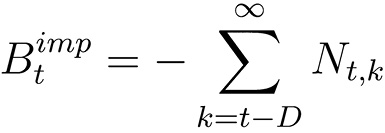
 ), which expresses the present value of all future payment obligations that are not funded by future revenues. Since government spending is expressed with negative aggregated net cash flows (
 ),
),  is expressed by the negative sum of the aggregate net cash flows of all cohorts (equation (7)).
 (6)
(6)
 (7)
(7)
For fiscal policy to be sustainable – i.e. to hold the intertemporal budget constraint (equation (1)) in balance – there must be either an explicit asset ( ) to cover implicit debt (
 ), or an implicit asset (
 ) to refinance explicit debt (
 ); formally described as
  . Since this analysis focuses exclusively on non-contributory benefits and an allocation of the existing explicit debt to non-contributory and contribution-based benefits would be arbitrary,
  is assumed. Fiscal sustainability of non-contributory benefits is therefore defined by the absence of any implicit debt.
3.2 Data and Assumptions
The generational accounting calculations are based on a population projection that extends over a period of 300 years using the data and assumptions from the ‘moderate scenario’ (G2-L2-W2) of the 15th coordinated population projection provided by the Federal Statistical Office (2022). The modelling of fiscal policy framework conditions considers growth assumptions and tax estimates for the period from 2023 to 2028, as provided by the Federal Ministry of Finance (2024b) and the Joint Economic Forecast (2024). The development of federal subsidies is modelled in accordance with legal regulations, if already determined. The average per capita cash flows ( ), are determined primarily based on data from the Federal Statistical Office (2024). The year 2022 serves as the base year. Additionally, all social benefits in place until July 2024 or benefits that have already been established as future transfers through implemented reforms are considered. In cases where the duration of a specific benefit is uncertain, the status quo assumption that its per capita cash flows (
 ) will persist unchanged into the future is maintained. However, as the demographic structure develops, aggregated payments – and consequently the share of non-insurance benefits (
 ) – adjust even under an unchanged policy framework. Behavioural changes and resulting feedback effects are not modelled, which can be criticized since the government would react to progressively growing liabilities (Haveman 1994; Diamond 1996). However, according to Raffelhüschen (1999), the results of generational accounting represent an attempt to make statements about current fiscal policy, reflecting myopic policymakers who tend to postpone reforms; these results should therefore not be misunderstood as a prediction of the future. The age-, gender- and nationality-specific cash flows (
 ) in the base year are calculated based on micro-data sets from the Federal Statistical Office (2021) and the German Institute for Economic Research (2023). These allow for a breakdown of individual benefits based on gender, age and nationality. To address the intragenerational shortcomings of generational accounting pointed out by Williamson and Rhodes (2011), these population characteristics are taken into account without losing the intergenerational focus of the analysis. This information is supplemented with data from German Pension Insurance (2023), which provides even more precise divisions.
The cash flows ( ) typically remain constant over time. However, given the fact that laws passed since the base year will change
  for certain years, they are adjusted and thus differ for different values of t. In cases where the development of a specific per capita cash flow is uncertain, it remains unchanged. To model future cash flows and to allow for comparisons with previous publications, an annual productivity growth rate (g) of 1.5 percent and an annual real interest rate (r) of 3.0 percent are assumed. These two parameters are central and much-discussed as a sufficiently high growth rate can counteract a demographically negative situation. The implications of a persistent negative interest-growth differential are discussed by Blanchard (2019), Andersen (2020) and Werding (2021). In addition, the choice of interest rate requires careful consideration. Haveman (1994) points out that the assumption of an interest rate that combines several key economic concepts can be problematic: (1) it combines opportunity costs and uncertainty regarding future payments and (2) a constant interest rate assumes that all generations have the same risk aversion at every moment in their life cycle (cf. Raffelhüschen 1999; Bonin 2001). Therefore, the results are tested for their sensitivity to r and g.
3.3 Sustainable Funding Scenarios
If the governing parties were to extend their commitment to achieving sustainable finances, this would create solidarity within social benefits. Moreover, it would promote intergenerational solidarity, as implicit debt means inequality between current and future generations (Bonin 2001; Hagist 2013). Recognizing the trade-off between these generations, the intergenerational distribution of burdens can be examined by creating a fiscally sustainable situation. Based on the assumption that the explicit debt of non-contributory benefits is zero, fiscal sustainability implies a situation in which no implicit debt arises from future payment obligations (Wimmesberger/Seuffert 2024).[7]
In order to prevent the accumulation of implicit debt, revenue or expenditure cash flows are usually adjusted in generational accounting (cf. Raffelhüschen 1999). To avoid an arbitrary selection of cash flows, all cash flows within a subset are adjusted. This means that either elements of  or elements of
  and are affected. Since reducing state benefits also impacts basic security, thereby lowering subsistence levels, scenarios adjusting state benefits are excluded from the analysis due to political feasibility. All scenarios can further be differentiated in terms of their timing so that they cause either one-time or year-specific adjustments. The former break the cost-by-cause principle in a year-specific view by creating overburdened cohorts in low-implicit debt years and underburdened cohorts in high-implicit debt years; this also leads to intertemporal burden equalization. To avoid this, scenarios with year-specific deficit compensations where individuals are annually burdened to the extent necessary to cover the implicit debt they incur are implemented. Thus, four distinct refinancing scenarios arise.
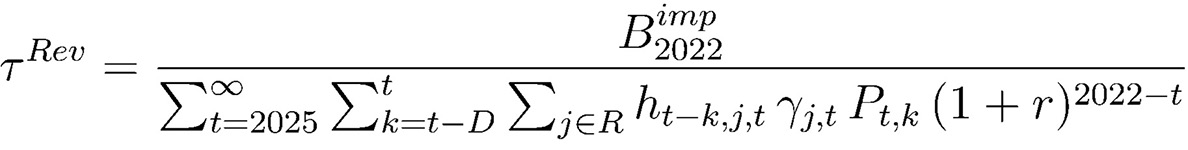
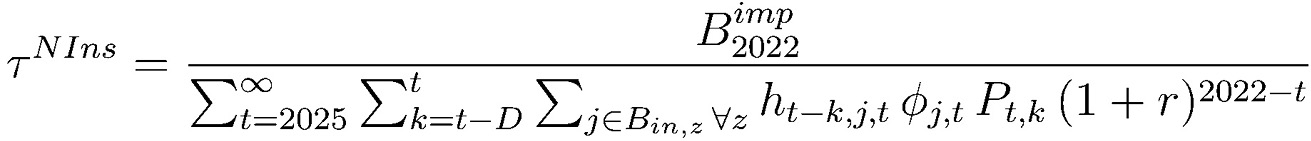
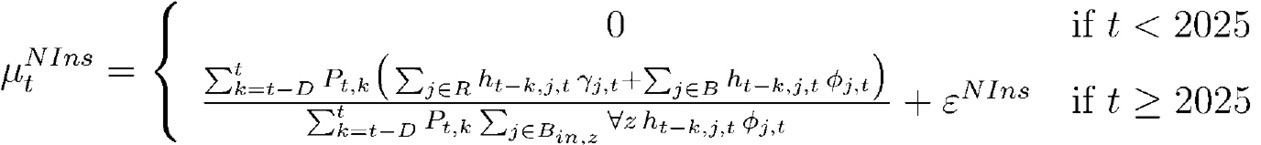
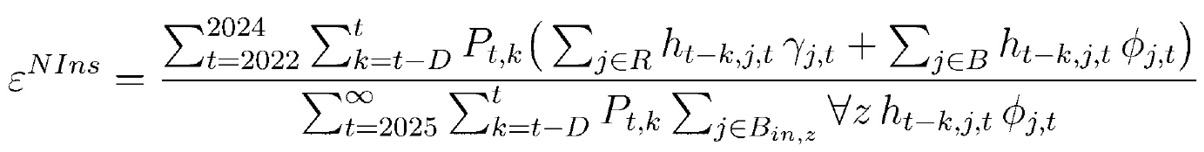
Constant Revenue Adjustment. In this scenario  , implicit debt is refinanced by increasing all government revenue, excluding social insurance contributions and new explicit debt. Following Raffelhüschen (1999) and Bonin (2001), implicit debt is divided across the present value of all revenue from 2025 onwards to compute the necessary revenue adjustment rate
  (equation (8)). Multiplying the second term in equation (4)[8] by the time-constant adjustment factor (
 ) yields per capita net cash flows (
 ), which combined with equations (5) and (7) generate an implicit debt of zero.
 (8)
(8)
Constant Non-Insurance Benefits Adjustment. The  scenario is similar to the
  scenario, but instead of increasing revenues, non-insurance benefits are adjusted to achieve fiscal sustainability. Since all benefits from social insurance contain a non-insurance component, all benefits are adjusted proportionally. The implicit debt is divided across the present value of non-insurance benefits from 2025 onwards to yield the time-constant adjustment rate (
 ). The resulting adjustment factor (
 ) multiplied with all non-insurance benefits (
 ) in equation (4) yields the fiscally sustainable per capita net cash flows (
 ).
).
 (9)
(9)
Given the distinction between non-insurance and state benefits, two noteworthy effects occur: (1) non-insurance benefits generate long-term surpluses, covering the implicit debt linked to state benefits and therefore leading to cross-financing; (2) the reduction in non-insurance benefits potentially places individuals previously above the subsistence level into the state benefits recipients category, prompting additional state benefits. This unmodelled feedback effect yields an optimistic minimum reduction for covering the implicit debt.
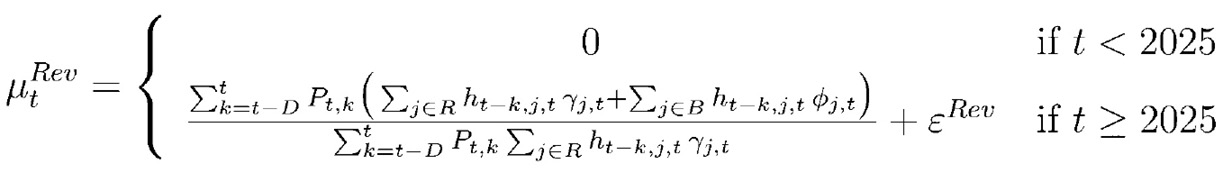
Year-Specific Revenue Adjustment. In scenario  , implicit debt is refinanced by a year-specific adjustment of government revenues. As in
  , this excludes social insurance contributions and explicit debt accumulation. This scenario’s year-specific relative increase in revenues (
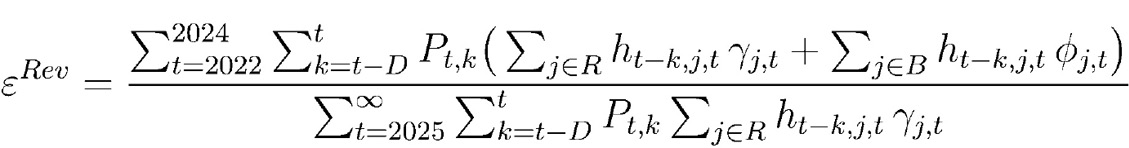
 ) is calculated by taking the difference between yearly non-contributory benefits and the corresponding revenues and dividing it by these revenues themselves (equation (10)). The implicit debt, arising from the base year until the reform takes effect, is divided equally among all future years, increasing the previously determined adjustment rate by
  (equation (11)). Multiplying the time-dependent factor (
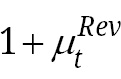 ) with government revenue in equation (4) yields sustainable per capita net cash flows (
 ), which prevent the creation of implicit debt.
 (10)
(10)
 (11)
(11)
Year-Specific Non-Insurance Benefits Adjustment. The scenario  is a logical continuation of
  and
and  . Non-insurance benefits are adjusted on an annual basis to generate fiscal sustainability. The calculation matches that of , only changing the denominator (equation (12) and (13)). The adjustment factor (
 ) is multiplied by all non-insurance benefits in equation (4) to generate the sustainable per capita net cash flows of this scenario (
 ). As examined in
  , both the cross-financing of state benefits by non-insurance benefits and a possible shift from social insurance benefit recipients to recipients of state benefits also occurs here.
 (12)
(12)
 (13)
(13)
4 Results
4.1 Composition of Non-Insurance Benefits
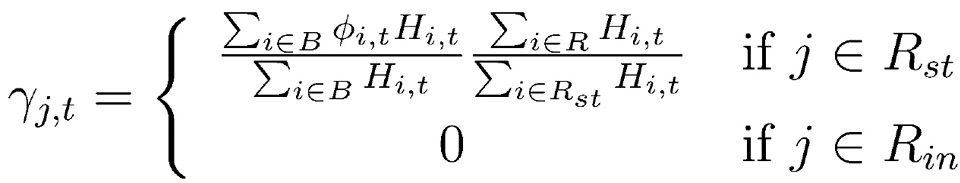
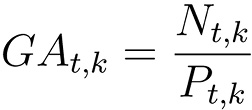
The share of non-insurance benefits  , where
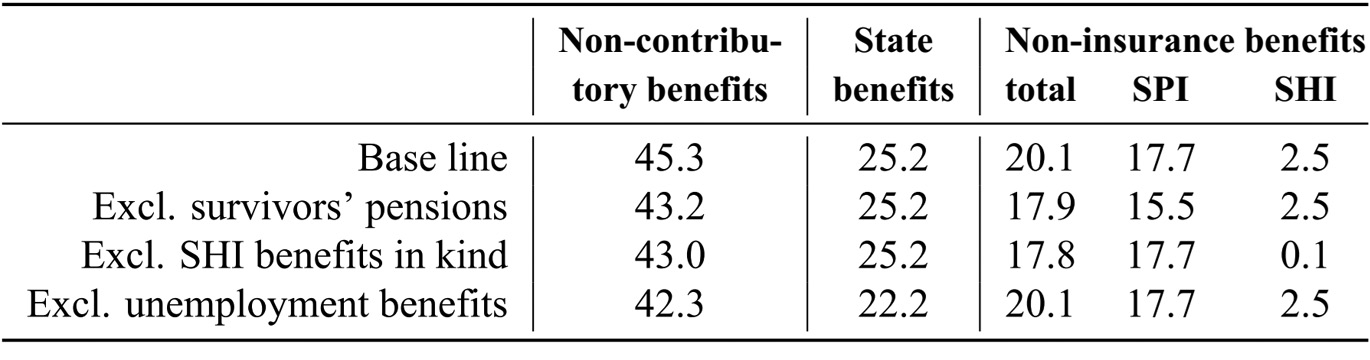
  , was calculated for every social insurance z and year t. These shares indicate the percentage to which expenditure items of the respective insurance are non-insurance-related. Table 1 lists these for the five social insurance branches.
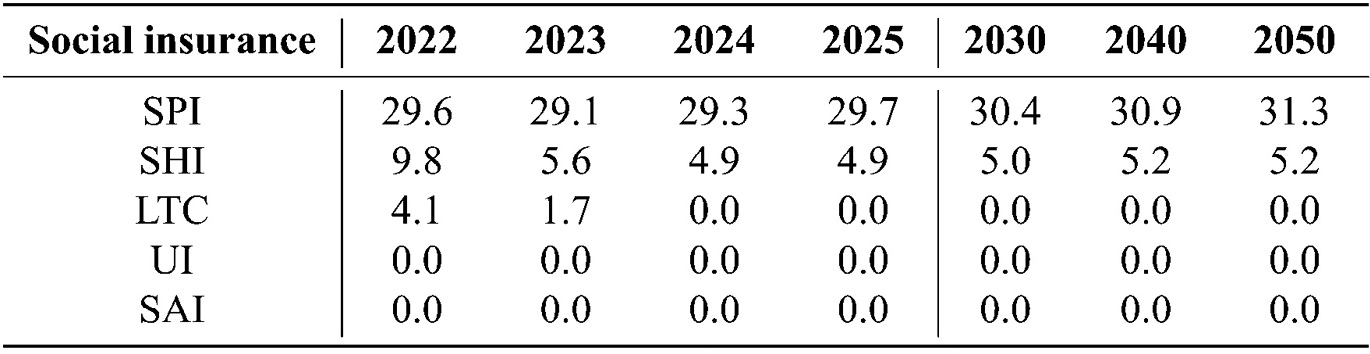
Percentage shares of non-insurance benefits
Source: Authors’ calculations.
The share of the federal subsidy for the SPI in terms of its total revenue is 29.6 percent in the base year and increases slightly in the long run. Using the same method for 2017 yields a share of 30.0 percent, aligning with earlier estimations by Raffelhüschen et al. (2011) and the Association of German Pension Insurance Institutions (2004), which supports the validity of this methodology. The increase in this share primarily results from the institutional structure of the SPI, coupled with demographically induced workforce reduction, causing the growth of federal subsidies to outpace that of contributions (cf. Seuffert 2022). In 2021, the federal government decided to increase the subsidy to the SHI once for 2022 with the Health Care Expansion Act (GVWG). Assuming it is reduced to its original value (around 14.5 billion euros) in subsequent years, the share of non-insurance benefits within the SHI will remain constant at around 5.2 percent.
The proportion in the LTC shows a downward trend in the short run, caused by the fact that it received one-time federal subsidies of one billion euros in October 2021 and 2.2 billion euros in April and December 2022 due to the COVID-19 pandemic. Assuming these subsidies are non-recurring, the share will return to a level of 0 percent in 2024. Since the revenue of UI and SAI does not include federal subsidies, none of their benefits are assessed as non-insurance-related.
Annual age-specific cash flows in the base year
Source: Authors’ calculations based on data from the Federal Statistical Office (2021), German Institute for Economic Research (2023) and German Pension Insurance (2023).
4.2 Indicators for Sustainability and Intergenerational Distribution
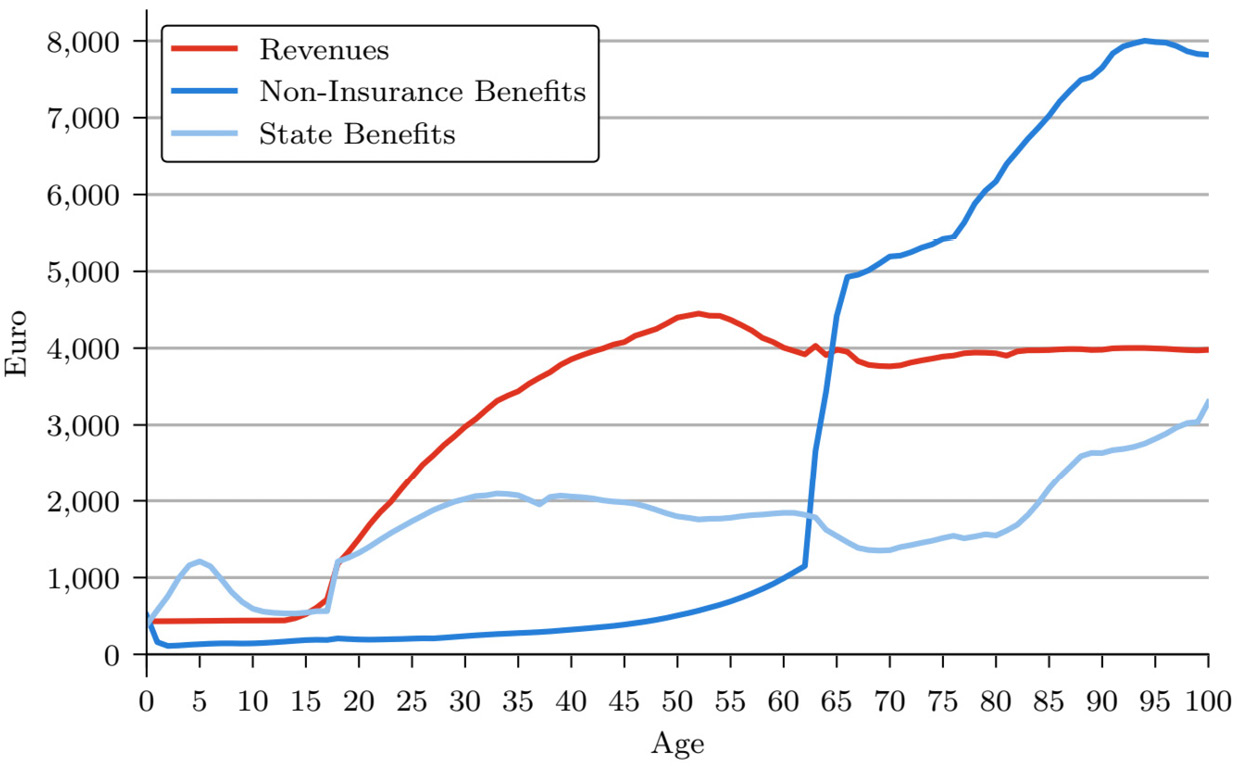
As an indicator of intergenerational burden distribution, the average per capita cash flows between individuals and the government are shown in Figure 1 for the base year.
The course of the revenue plot allows for a subdivision into three age classes: minors, working-age individuals and retirement-age individuals. Consistent with the results of Bach et al. (2016) and Beznoska (2022), this course is due to the limited tax burden faced by the young population. When individuals reach the age of majority and employment, their average payments to the government increase due to the age distribution of income, with peak earnings typically between ages 45 and 60 (cf. Bach et al. 2016). Since many personal taxes are linked to income, these age cohorts predominantly contribute to the financing of non-contributory benefits. The age-specific distribution of state benefits is relatively even. Only the peaks relating to the education allowance and supplementary child benefits, parental benefits between the ages of 30 and 40 and social assistance and basic security in old age are noteworthy. The latter is, in line with Ruland (2018), justified by the lower average pension entitlements of women aged 83 and above compared to men of this age to secure their subsistence minimum according to §§ 27–40 SGB XII. Furthermore, this increase can be explained by the assistance for those who otherwise cannot afford outpatient or inpatient care in old age (§§ 61–66a SGB XII). In contrast, non-insurance benefits are distributed considerably more unevenly because many benefits from social insurance are increasingly claimed after the age of 65 due to deteriorating health, while the non-insurance benefits that accrue to individuals of working age (e.g., survivors’ pensions) are not related to their own health status. Figure 1 suggests that if the level of per capita non-contributory benefits remains unchanged in the future and demographic ageing results in more individuals in older age cohorts, total government expenditure on non-contributory benefits may rise accordingly.
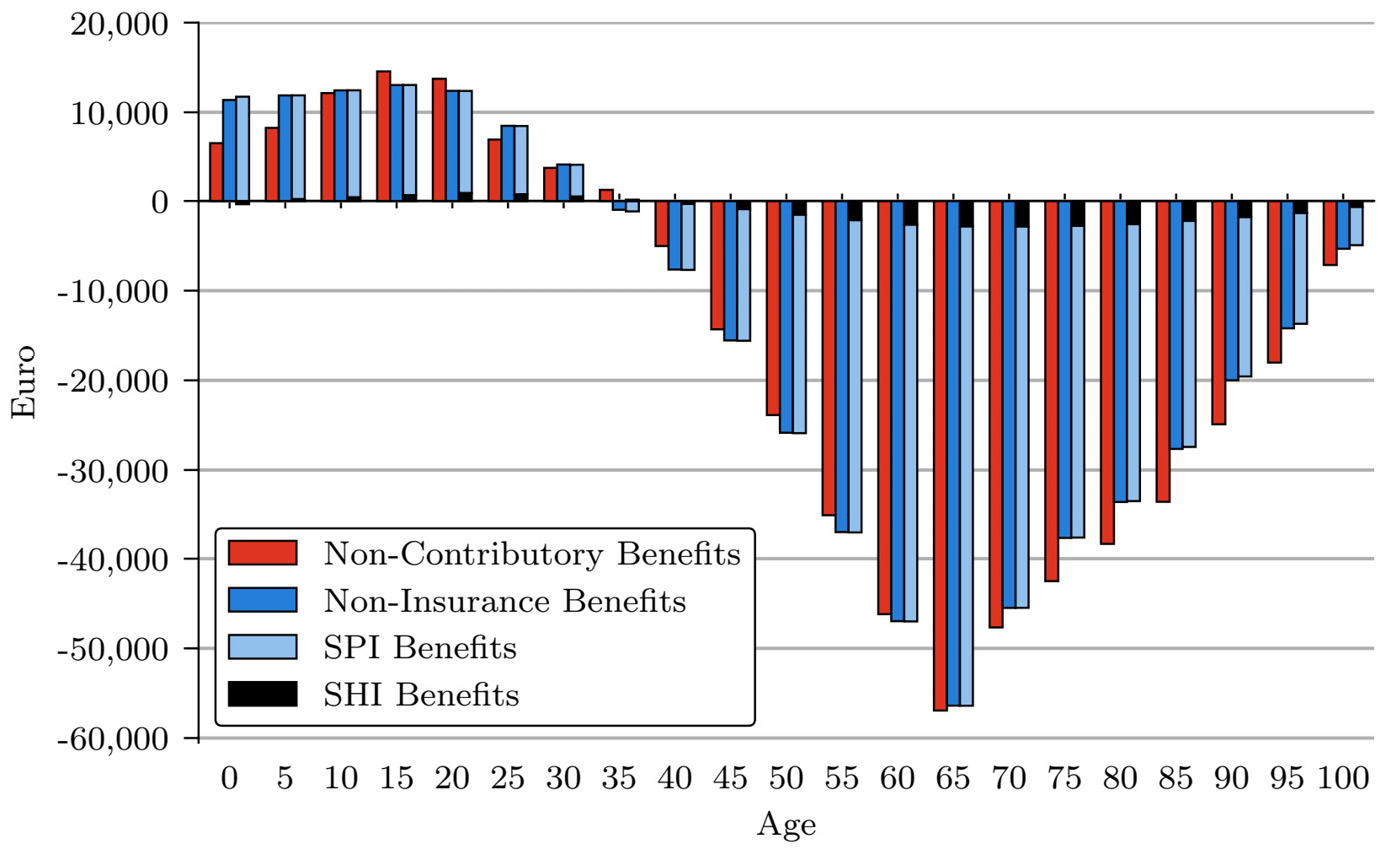
Generational accounts for different types of benefits
Source: Authors’ calculations.
Figure 2 shows the generational accounts regarding all non-contributory (red) and all non-insurance benefits (blue), as well as the isolated accounts for non-insurance benefits from the SPI (light blue) and SHI (black).[9] This also includes their respective refinancing payments. Positive (negative) accounts represent a greater (smaller) financial obligation from payments to be made than benefits received. The red bars display the present value of net cash flows related to state and non-insurance benefits that a single average individual of each age cohort faces for the rest of their life cycle. In contrast, the blue bars represent the non-insurance benefits and their respective payments only. The present value analysis of generational accounting adopts a purely forward-looking perspective, incorporating only cash flows that occur today and in the future. Since different age cohorts do not share the same remaining lifespan, their generational accounts are not comparable. Nevertheless, a comparison of generational accounts from different scenarios within the same age cohort is valid.
The difference between the generational accounts of non-contributory and of non-insurance benefits is exactly equal to the difference between the accounts concerning state benefits and corresponding refinancing payments. This overall slight difference indicates that state benefits have a smaller impact on generational accounts compared to non-insurance benefits; this is primarily due to their more evenly age-specific distribution (cf. Figure 1). In contrast, non-insurance benefits exhibit a greater time gap between payments and benefits, which does not tend to balance out in each period. Both types of accounts follow the usual course of generational accounts (cf. Hagist 2013), splitting the individuals into two groups. Young generations with positive generational accounts contribute more in present value terms over the rest of their life cycle than they receive in non-contributory benefits, and generations from the age of 36 with negative generational accounts gain from the current design of non-contributory benefits. The separation of non-insurance benefits into SPI and SHI benefits reveals that (1) the main part of the intergenerational distribution is due to the distribution of SPI benefits, and (2) in accordance with the shares in Table 1, the non-insurance benefits consist almost entirely of SPI and SHI benefits.
Implicit debt in percentage of GDP for different cases
Source: Authors’ calculations.
Another key indicator of intergenerational burden distribution is the implicit debt, which enables an analysis considering generations that have not yet been born. Table 2 displays this implicit debt due to all non-contributory, state and non-insurance benefits as well as SPI and SHI benefits. If current social policies persist, non-contributory benefits result in an implicit debt of 45.3 percent of GDP, consisting of 25.2 percentage points from state benefits and 20.1 percentage points from non-insurance benefits. Moreover, three cases are presented in which certain types of benefits were excluded to emphasize the rigidity of the results. The exclusion of survivors’ pensions reduces the implicit debt within the SPI by 2.2 percentage points, while the exclusion of benefits in kind from the SHI reveals that its (unsustainable) benefits are almost entirely attributable to benefits in kind.
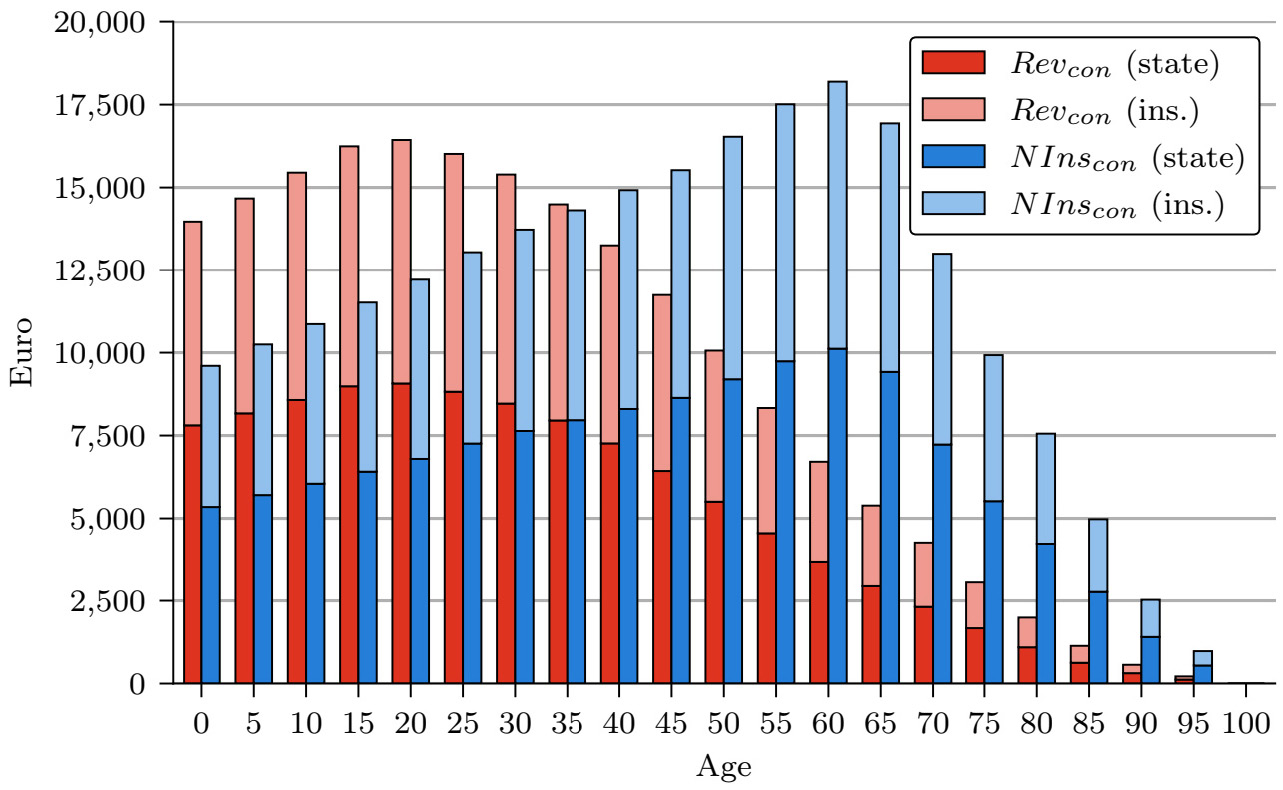
Present value of age-specific burden in different refinancing scenarios
Source: Authors’ calculations.
4.3 Implications of Various Funding Scenarios
To address the implicit debt, today’s social policies could be adapted as outlined in the presented scenarios. These scenarios should not be understood as realistic possible courses of action but rather as a method to enable comparative assessment of different policy options, which highlights the main challenges policymakers would face when attempting to achieve sustainable public finances. Figure 3 displays the age-specific burden resulting from the scenarios  (red) and
  (blue), subdivided according to the burden of financing state benefits (dark colours) and non-insurance benefits (light colours). The burdens are determined as the difference between the generational accounts with adjusted per capita net cash flows by
  or
or  and the generational accounts in the status quo. Scenario
  overall imposes a notable burden on younger working-age generations, which diminishes with increasing age for two reasons: a shorter remaining life cycle leads to reduced exposure to higher payments, and the temporal gap to the age at which non-contributory benefits surpass annual payments decreases. In this scenario, total government revenues are increased by about 2.6 percent in relation to the status quo.
In the  scenario, an adjustment of non-insurance benefits generates the intergenerational burdens represented by the blue bars in Figure 3. Non-insurance benefits would have to be cut by 4.1 percent of all – insurance and non-insurance – expenditure from social insurance schemes. Compared with the
  scenario, this places less of a burden on generations at a young age and instead mainly affects generations around the age of 60. This is due to the age distribution of annual non-insurance benefits. Since individuals over the age of 65 are the main beneficiaries of such benefits, a reduction means lower per capita benefits for these cohorts, and thus lower expected benefits for generations close to and within this age group in the present value analysis. Although the state benefits have almost no impact on the generational accounts – seen in the small difference of the generational accounts for non-contributory and non-insurance benefits in Figure 2 – the burden generated by their sustainable financing in both scenarios is of roughly the same magnitude as the burden caused by the sustainable financing of non-insurance benefits. The distribution of the burden between the financing of state and non-insurance benefits thus roughly follows the distribution of implicit debt (Table 2).
Considering legal framework conditions, reducing non-insurance benefits could potentially push some recipients into basic social security, which leads to cost privatization. This cost privatization describes a shift of the burden to primarily former beneficiaries with higher income who do not qualify for means-tested state benefits. As these individuals face the full extent of the cuts without compensation by state benefits, financial responsibility is effectively transferred from the collective system to private individuals. In contrast, low-income recipients of non-insurance benefits may receive additional support through state benefits, which aligns with the subsidiarity principle of basic social security and creates an opportunity for vertically equitable refinancing.
The burdens in the  and
and  scenarios are not directly dependent on year-specific deficits and surpluses. The
  and
and  scenarios consider these year-specific values so that the burden imposed on all individuals each year exclusively depends on the implicit debt generated in that year. Figure 4 depicts the year-specific percentage adjustments of revenue and non-insurance benefits of the four scenarios in relation to the status quo. To make these quotas comparable, they do not refer to non-contributory-related revenues or non-insurance benefits but to total government revenue and total social insurance expenditure, respectively. The red (blue) line in Figure 4 represents the year-specific adjustment of revenues (non-insurance benefits)[10] necessary to cover any resulting implicit debt. These percentages grow until 2055 as the baby boomer generations exceed the ages of 65 and 75, which is accompanied by a significant increase in annual non-contributory benefits (cf. Figure 1). After 2055 the rise in these quotas is driven by the subsequent cohorts, which, despite being smaller, have on average a notably higher life expectancy. This results in a substantial number of individuals reaching advanced ages of 75 and above, thereby increasing benefits and driving the adjustment rates upwards. Around 2070 to 2090, the quotas stabilize, before gradually declining due to reduced expenditures, while revenues remain constant as the children of today’s and near-future immigrants reach peak tax-paying ages around 50, easing the financing burden (cf. Figure 1). Until 2052, individuals are burdened more each year by the reform (light red) than in the scenario. In the same way, the year-specific ratios of the
  scenario are initially lower than those of the (light blue) scenario. Hence, generations are less burdened in year-specific terms up to 2054 from the
  scenario compared to the scenario, reversing afterwards.
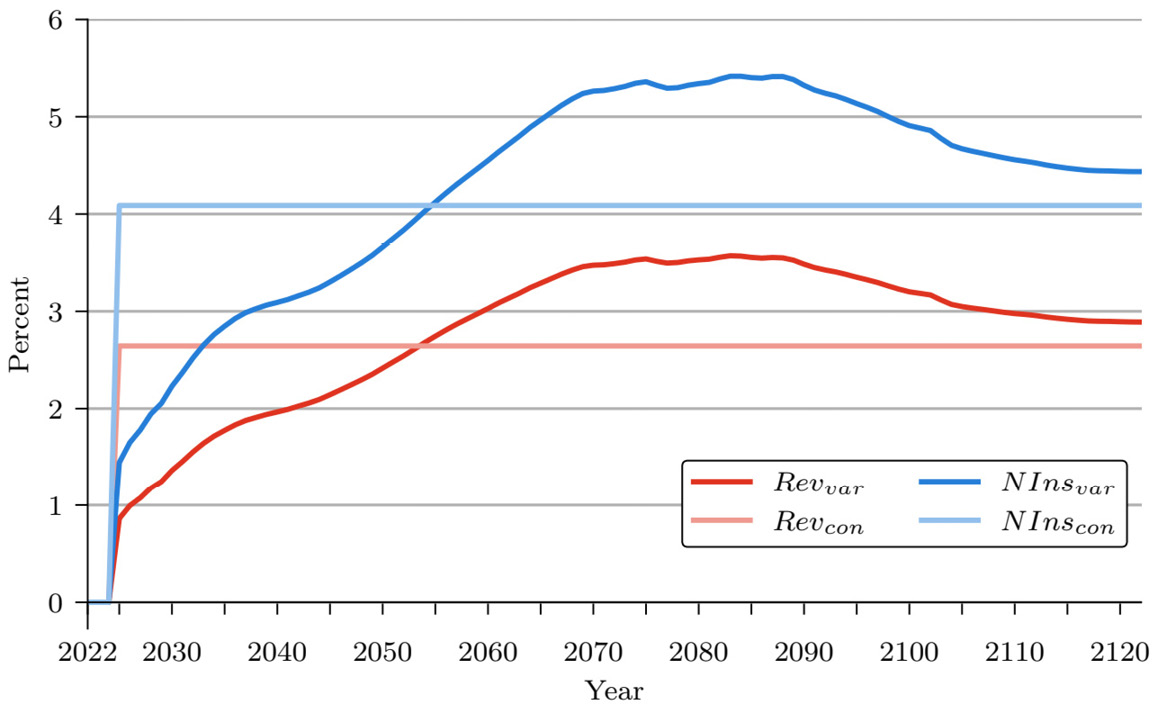
Changes in revenue and non-insurance benefits in relation to status quo
Source: Authors’ calculations.
5 Sensitivity Analysis
The sensitivity analysis in generational accounting generally addresses the uncertainties surrounding the assumed parameters for productivity growth g and the real interest rate r, along with their significance in determining the magnitude of the results. However, the values assumed for r and g are less relevant than the relative distance between them (Fetzer 2006) as long as r > g holds; this is because generational accounting usually follows the reasoning of Andersen (2020) and Werding (2021) for an economy with a dynamic-efficient growth path. The relative distance is calculated according to equation (14).
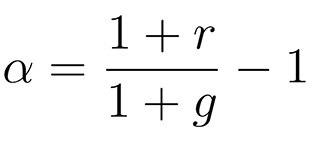 (14)
(14)
The given parameterization of r = 0.03 and g = 0.015 results in  = 1.48 percent in the base line scenario. All scenarios – i.e. the base line scenario without policy adjustments and the four scenarios with policy adjustments – are each recalculated twice. In the first case, a large relative distance of
  = 2.46 percent is assumed, corresponding to r = 0.04 and g ≈ 0.015, for example. In the second case, a small relative distance of
  = 0.49 percent is chosen, which corresponds, for example, to the combination of r = 0.02 and g ≈ 0.015.
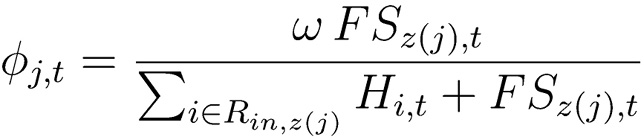
To address the uncertainty that arises from estimating the unknown true amount of non-insurance benefits, two approaches were taken. First, a comparison was made with estimates from previous studies, revealing that the calculated percentages for non-insurance benefits fall within a comparable range. Second, the impact of potential over- and underestimations on the distribution of intergenerational burdens can be analysed by modifying equation (2) with respect to  . In equation (15),
  allows investigation of this misestimation. The sensitivity analysis assumes a uniform bias of 10 percent across all social insurance schemes (
 and
and  ), while in the base line scenario
  equals 1.0.
 (15)
(15)
The level of implicit debt is strongly influenced by the magnitude of (Table 3). Specifically, a smaller  leads to higher debt levels, which is consistent with the findings from Benz and Fetzer (2006) and Manthei (2021). However, this impact is not reflected in the adjustment ratios. Regardless of whether a large or small relative distance between r and g is chosen, the refinancing ratios exhibit minimal changes; this is because even if implicit debt increases (decreases) in present value due to lower (higher) discounting, the corresponding reference variable of the respective scenario moves in the same direction since it is likewise affected by the discounting. If there is a 10 percent overestimation or underestimation compared to the base line scenario, the implicit debt and the adjustment rates change in all scenarios studied only slightly. For the year-specific adjustment ratios, this observation applies in both the short (
 and
and  ) and long run (
 and
and  ). Therefore, the sensitivity analysis demonstrates that, ceteris paribus, the methodology utilized ensures the preservation of the qualitative conclusions.
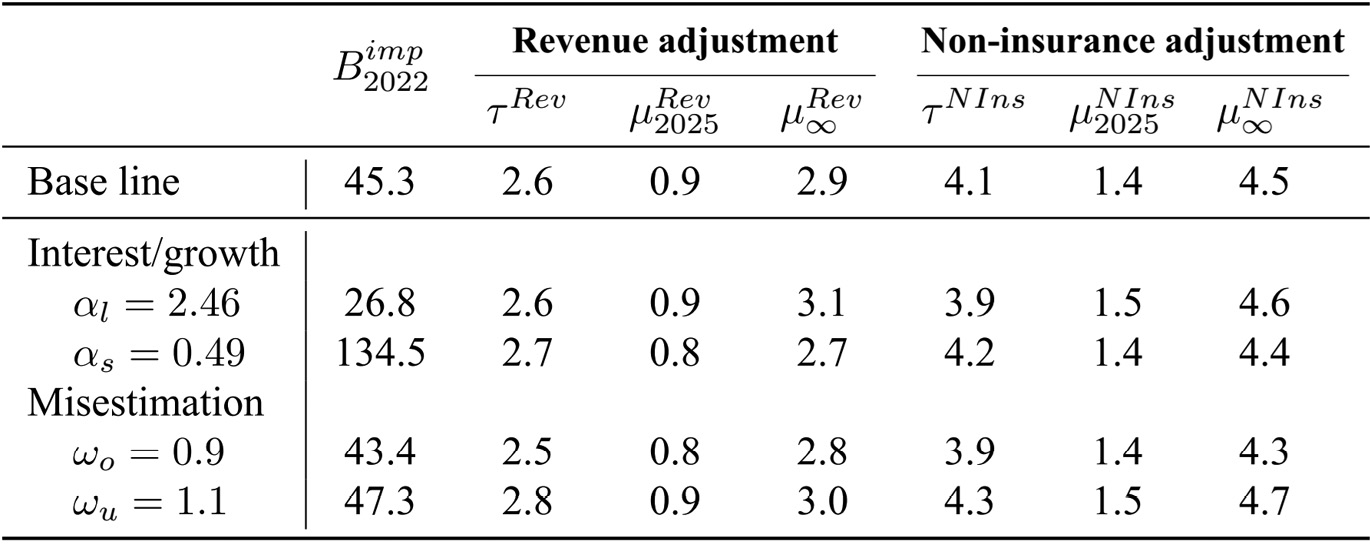
Sensitivity in regard to and in percentages for all scenarios
Source: Authors’ calculations.
6 Conclusion
Examining the intergenerational distribution of non-contributory benefits reveals notable differences in net receipts, primarily influenced by non-insurance benefits that predominantly favour generations over 65. In contrast, state benefits are distributed more evenly across generations and account for only a minor fraction of non-contributory benefits. Maintaining the current level of state and non-insurance benefits will result in an implicit debt of 45.3 percent of GDP in the long run. If the government aims to achieve sustainable finances, it should consider this implicit debt. Neglecting this responsibility shifts the burden to forthcoming taxpayers, requiring them to address the deficit through increased taxes or reduced non-contributory benefits.
Four scenarios were examined and revealed that an extra 2.6 percent of total government revenues is required from 2025 onwards to cover this implicit debt. As an alternative, benefits can be cut by 4.1 percent. Since constant adjustments fail to consider the timing of the implicit debt, they lead to an equalization of the burden over time, placing a greater burden on current and near-future generations than they themselves contribute to the implicit debt. Year-specific adjustment scenarios, considering the respective financing situation, highlight the challenge of financing non-contributory benefits as the baby boomer generations age. The four policy adjustments studied here additionally indicate that current generations will always be burdened if debt financing is avoided from 2025 onward. Comparing revenue and non-insurance adjustments, decreased non-insurance benefits predominantly impact financially resilient individuals around the age of 65, while revenue increases tend to affect younger individuals who have yet to make most of their payments. Thus, non-insurance benefit reductions predominantly address those receiving benefits without prior adequate contributions, while burden distribution in cases of revenue increases is primarily based on tax-paying capacity. To structure reforms as one-time or year-specific adjustments influence the distribution of burdens across present and future generations. The former generally place a heavier burden on current generations, while year-specific adjustments shift the weight toward future generations. Regardless of the path policymakers take to achieve fiscal sustainability, there is always an incentive to break fiscal sustainability again in the future in order to gain votes. Therefore, an institutional and legal framework is also required that enables “political sustainability” (Galasso/Profeta 2004) and thus ensures that consolidation is maintained in the long term.
Reforms aimed at reaching fiscal sustainability impose costs on current generations, thus creating two fundamental challenges: (1) Today’s generations, especially older cohorts, may have little incentive to support fiscal sustainability reforms, as they would disproportionately bear the burden of such measures. While year-specific reform approaches might mitigate this resistance by distributing the impact more gradually compared to time-constant reforms, another factor to consider is intergenerational altruism. Baby boomer generations, despite currently holding significantly more electoral power than younger generations, may be more inclined to support sustainability-enhancing reforms if they recognize the potential advantages for their children and grandchildren. This dynamic could shift the political landscape toward a more favourable stance on reforms, as not only the younger cohorts but also parents and grandparents with vested interests in their descendants’ well-being might advocate for measures that relieve future generations at their own expense. (2) Even if policymakers were to successfully implement such a reform, future political leaders and voters might still be tempted to reverse these measures for short-term gains, breaking the sustainable fiscal stance. However, this incentive to undermine reforms diminishes as the population structure stabilizes. As demographic conditions improve and society reaches a state with a more balanced age distribution and fewer fluctuations in birth rates, the pressure from older generations to unwind these reforms could also lessen. Beyond the edge case scenarios presented, targeted refinements to specific benefits, such as adjusted exemption thresholds or stricter eligibility criteria, and their impact on intergenerational distribution and fiscal sustainability offer possibilities for future research.
About the author
Sebastian Schultis and Sebastian Stramka are Research Associates at the Research Centre for Generational Contracts and Academic Lecturers at the Institute for Public Finance and Social Policy at the Albert-Ludwigs-University of Freiburg, Germany.
Acknowledgement
We would like to thank Prof. Dr. Bernd Raffelhüschen, Dr. Stefan Seuffert and Karen Rudolph for their helpful comments and suggestions. We would also like to thank the two anonymous reviewers whose comments helped to significantly improve this article.
References
Andersen, Torben M. (2020): “Fiscal sustainability and low government borrowing rates”, CESifo Forum 21: 31–34.Search in Google Scholar
ASFGP, Academic Service of the Federal German Parliament (2016): Nicht beitragsgedeckte versicherungsfremde Leistungen der gesetzlichen Rentenversicherung als Ausdruck des Solidarprinzips, Ausarbeitung WD 6 – 3000-085/16.Search in Google Scholar
Association of German Pension Insurance Institutions (2004): “Bericht der Bundesregierung zur Entwicklung der nicht beitragsgedeckten Leistungen und der Bundesleistungen an die Rentenversicherung vom 13. August 2004”, Deutsche Rentenversicherung 2004 (10): 569–583.Search in Google Scholar
Auerbach, Alan; Gokhale, Jagadeesh; Kotlikoff, Laurence J. (1991): “Generational accounts: a meaningful alternative to deficit accounting”, Tax Policy and the Economy 5: 55–110.10.1086/tpe.5.20061801Search in Google Scholar
Auerbach, Alan; Gokhale, Jagadeesh; Kotlikoff, Laurence J. (1992): “Generational accounting: A new approach to understanding the effects of fiscal policy on saving”, The Scandinavian Journal of Economics 94 (2): 303–318.10.2307/3440455Search in Google Scholar
Auerbach, Alan; Gokhale, Jagadeesh; Kotlikoff, Laurence J. (1994): “Generational accounting: a meaningful way to evaluate fiscal policy”, Journal of Economic Perspectives 8 (1): 73–94.10.1257/jep.8.1.73Search in Google Scholar
Bach, Stefan; Beznoska, Martin; Steiner, Viktor (2016): Wer trägt die Steuerlast in Deutschland? Verteilungswirkungen des deutschen Steuer- und Transfersystems, 114. DIW Berlin.Search in Google Scholar
Bahnsen, Lewe; Raffelhüschen, Bernd (2019): “Zur Reform der Pflegeversicherung: Eine Generationenbilanz”, ifo Schnelldienst 72 (1): 29–35.Search in Google Scholar
Benz, Ulrich; Fetzer, Stefan (2006): “Indicators for measuring fiscal sustainability: a comparison of the OECD method and generational accounting”, FinanzArchiv/Public Finance Analysis 62 (3): 367–391.10.1628/001522106X153428Search in Google Scholar
Beznoska, Martin (2022): Die Altersverteilung von Steuern, Abgaben und staatlichen Leistungen: Methodik und Analyse-Dokumentation zum Online-Tool, IW-Report.Search in Google Scholar
Blanchard, Oliver J. (2019): “Public debt and low interest rates”, American Economic Review 109 (4): 1197–1229.10.1257/aer.109.4.1197Search in Google Scholar
Bonin, Holger (2001): Generational Accounting: Theory and Application. Springer Science & Business Media, Heidelberg.10.1007/978-3-662-04595-4_8Search in Google Scholar
Diamond, Peter (1996): “Generational accounts and generational balance: An assessment”, National Tax Journal 49 (4): 597–607.10.1086/NTJ41789229Search in Google Scholar
European Commission (2022): Fiscal Sustainability Report 2021, European Economy 4/2022.Search in Google Scholar
Federal Ministry of Finance (2024a): Tragfähigkeitsbericht 2024 – Sechster Bericht zur Tragfähigkeit der öffentlichen Finanzen, Berlin.Search in Google Scholar
Federal Ministry of Finance (2024b): Ergebnis der 166. Sitzung des Arbeitskreises “Steuerschätzungen”, Berlin.Search in Google Scholar
Federal Statistical Office (2021): Einkommens- und Verbrauchsstichprobe 2018, Wiesbaden.Search in Google Scholar
Federal Statistical Office (2022): Bevölkerung Deutschlands bis 2070 – Annahmen und Ergebnisse der 15. koordinierten Bevölkerungsvorausberechnung, Wiesbaden.Search in Google Scholar
Federal Statistical Office (2024): Volkswirtschaftliche Gesamtrechnungen – Inlandsproduktberechnung – Detaillierte Jahresergebnisse 2023, Fachserie 18, Reihe 1.4, Wiesbaden.Search in Google Scholar
Feist, Karen; Raffelhüschen, Bernd (2000): “Möglichkeiten und Grenzen der Generationenbilanzierung”, Wirtschaftsdienst 80 (7): 440–448.Search in Google Scholar
Fetzer, Stefan (2006): Zur nachhaltigen Finanzierung des gesetzlichen Gesundheitssystems, in: Bert Rürup (ed.): Sozialökonomische Schriften 28, Peter Lang, Bern.10.3726/b13664Search in Google Scholar
Galasso, Vincenzo; Profeta, Paola (2004): “Lessons for an ageing society: the political sustainability of social security systems”, Economic Policy 19 (38): 64–115.10.1111/j.1468-0327.2004.00119.xSearch in Google Scholar
GCEE, German Council of Economic Experts (2019): Den Strukturwandel meistern, Jahresgutachten 2019/20.Search in Google Scholar
German Institute for Economic Research (2023): Sozio-oekonomisches Panel, Version 38. Data covering 1984–2021.Search in Google Scholar
German Pension Insurance (2023): Rentenversicherung in Zeitreihen: Ausgabe Oktober 2023, DRV-Schriften Band 22, Berlin.Search in Google Scholar
Hagist, Christian (2013): “Die Methode der Generationenbilanzierung, Messung intergenerativer Verteilung und fiskalischer Nachhaltigkeit”, Wirtschaftswissenschaftliches Studium 42: 279–385.10.15358/0340-1650_2013_7_379Search in Google Scholar
Hagist, Christian; Moog, Stefan; Raffelhüschen, Bernd; Vatter, Johannes (2009): “Public debt and demography – an international comparison using generational accounting”, CESifo DICE Report 7 (4): 29–36.Search in Google Scholar
Haveman, Robert (1994): “Should generational accounts replace public budgets and deficits?”, Journal of Economic Perspectives 8 (1): 95–111.10.1257/jep.8.1.95Search in Google Scholar
Joint Economic Forecast (2024): Deutsche Wirtschaft kränkelt – Reform der Schuldenbremse kein Allheilmittel, Dienstleistungsauftrag des Bundesministeriums für Wirtschaft und Energie.Search in Google Scholar
Mackscheidt, Klaus; Maier-Rigaud, Remi (2020): Die Grenzen der beitragsorientierten Sozialversicherungen: Grundsatzüberlegungen zum Verhältnis von Beitrags- und Steuerfinanzierung. Technical Report. FiFo Discussion Paper.Search in Google Scholar
Manthei, Gerrit (2021): “Recent German migration laws: A contribution to fiscal sustainability”, German Politics 30 (2): 170–188.10.1080/09644008.2020.1752678Search in Google Scholar
Raffelhüschen, Bernd (1999): Generational accounting: method, data, and limitations, European Economy, Reports and Studies, No. 6: 17–28.Search in Google Scholar
Raffelhüschen, Bernd; Moog, Stefan; Vatter, Johannes (2011): Fehlfinanzierung in der deutschen Sozialversicherung, Initiative Neue Soziale Marktwirtschaft, Freiburg.Search in Google Scholar
Reimann, Axel (2007): “Zur Finanzierung der gesetzlichen Rentenversicherung durch Beiträge und Staatszuschüsse”, in: Ulrich Becker, Franz-Xaver Kaufmann, Baron von Maydell, Winfried Schmähl and Hans F. Zacher (eds.): Alterssicherung in Deutschland. Festschrift für Franz Ruland zum 65. Geburtstag. 399–421, Nomos, Baden-Baden.Search in Google Scholar
Ruland, Franz (2018): “Die Rentenpolitik vor schwierigen Entscheidungen – der Koalitionsvertrag und die rentenpolitischen Notwendigkeiten”, Deutsche Rentenversicherung 2018 (1): 1–21.Search in Google Scholar
Rürup, Bert (2004) “Vom Bundeszuschuss zum Bundesbeitrag in der gesetzlichen Rentenversicherung”, Deutsche Rentenversicherung 2004 (10): 586–591.Search in Google Scholar
Schmähl, Winfried (2003): “Senkung der Lohnnebenkosten in Deutschland – Optionen und Potentiale”, Sozialer Fortschritt 52 (4): 83–90.Search in Google Scholar
Seuffert, Stefan (2022): Anwartschaftsbasierte Projektion der gesetzlichen Rentenversicherung in der Generationenbilanzierung, Nomos, Baden-Baden.10.5771/9783748914280Search in Google Scholar
Werding, Martin (2021): Fiscal Sustainability and Low Interest Rates: A Note, CESifo.10.2139/ssrn.3774668Search in Google Scholar
Werding, Martin; Hofmann, Herbert (2008): Projektionen zur langfristigen Tragfähigkeit der öffentlichen Finanzen, ifo Beiträge zur Wirtschaftsforschung, No. 30.Search in Google Scholar
Williamson, John; Rhodes, Anna (2011): “A critical assessment of generational accounting and its contribution to the generational equity debate”, International Journal of Ageing and Later Life 6 (1): 33–57.10.3384/ijal.1652-8670.116133Search in Google Scholar
Wimmesberger, Florian M.; Seuffert, Stefan (2024): “Myopic fiscal policy during the COVID-19 pandemic and its intergenerational burden”, German Politics 33 (1): 68–85.10.1080/09644008.2022.2056594Search in Google Scholar
© 2024 bei den Autorinnen und Autoren, publiziert von Walter de Gruyter GmbH, Berlin/Boston
Dieses Werk ist lizensiert unter einer Creative Commons Namensnennung 4.0 International Lizenz.
Articles in the same Issue
- Frontmatter
- Non-Contributory Benefits in Germany – An Analysis Using Generational Accounting
- Der Zugang zu nicht etablierten, innovativen Behandlungsmethoden aus Perspektive des Medizinstrafrechts und des Rechts der gesetzlichen Krankenversicherung (SGB V)
- Kommen meine Kassenbeiträge bei meinem chronisch kranken Kind an?