
A switch from homogeneous mixed-valent to trivalent cerium in the solid solutions CeNi1–x Pd x Zn
-
Theresa Block


Abstract
CeNiZn and α-CePdZn (both ZrNiAl type, hexagonal space group P6‾2m) form a complete range of solid solutions CeNi1–x Pd x Zn. Samples were synthesized with steps of x = 0.1 or 0.05 from the pure elements by induction-melting. The structure of CeNi0.59(1)Pd0.41Zn was refined from single crystal X-ray diffractometer data: a = 727.61(8), c = 396.75(4) pm, wR2 = 0.0301, 297 F 2 values and 17 variables. Both the 1a and 2d transition metal sites show Ni/Pd mixing. The cell volume decreases from α-CePdZn to CeNiZn in a discontinuous manner. This is directly related to a change in the cerium magnetic ground state. The properties change from Curie-Weiss paramagnetic α-CePdZn to homogeneous mixed valence in CeNiZn. The magnetic susceptibility data of the intermediate-valence representatives could be fitted with the Sales-Wohlleben interconfiguration-fluctuation model.
1 Introduction
Among the intermetallic cerium compounds, the families with the general compositions CeT 2 X 2 and CeTX (T = electron-rich transition metal; X = element of the 3rd, 4th or 5th main group) have intensively been studied with many hundred representatives listed in the Pearson data base. 1 Most of the CeT 2 X 2 phases 2 , 3 , 4 , 5 , 6 crystallize with the ThCr2Si2 or CaBe2Ge2-type structures, while the equiatomic CeTX phases 2 , 7 , 8 , 9 in majority adopt the hexagonal ZrNiAl or the orthorhombic TiNiSi type. All of these types are so-called basic structure types for rare earth intermetallics.
The main interest in these cerium intermetallics focuses on the cerium valence and its influence on the magnetic and transport properties (correlated electron systems). Cerium can adopt two pure, different valence states: diamagnetic Ce4+ with closed-shell [Xe] configuration and paramagnetic Ce3+ with [Xe]4f 1 configuration. In addition, depending on the element combination (i.e., in many cases on the electronegativity differences) and on the structure type, static or dynamic intermediate cerium valence can occur. These different electronic configurations lead to a manifold of physical properties like Kondo compounds, antiferromagnetic and ferromagnetic ordering, valence fluctuation, heavy fermion compounds, superconductivity or non-Fermi liquid systems. Especially the representatives with valence instabilities have attracted broad attention. Remarkable examples are CeNi2Si2, 10 , 11 , 12 CeRhSn 13 and CeRuSn. 14 , 15
The magnetic properties of the CeT 2 X 2 and CeTX phases can effectively be manipulated by substitution on the cerium as well as on the T and X sites. Therefore, diverse solid solutions have thoroughly been studied. Some remarkable examples are: (i) the solid solutions Ce1–x La x Pd2Si2 16 and Ce1–x La x TiGe 17 for studying the cerium spin dilution (decrease of the Néel temperature with increasing lanthanum content), (ii) changes of the valence electron count (VEC) in CeRh2−x Ru x Si2 (switch from antiferromagnetic CeRu2Si2 to heavy fermion behavior (γ ≈ 600 mJ mol−1 K−2) for the x = 0.8 and 1.0 samples) 18 and CeRh1–x Pd x In (change from an unstable 4f configuration in CeRhIn to localized 4f moments in CePdIn) 19 and (iii) substitution of the X component in CeRu2Si2−x Ge x (transition from spin fluctuations in CeRh2Si2 to ferromagnetism in CeRu2Ge2) 20 and CeAuGe1–x Sn x (switch from ferro- to antiferromagnetic ordering). 21
In the course of systematic studies of solid solutions for the CeTX phases, 21 , 22 , 23 , 24 , 25 , 26 we turned to the CeTZn phases. Representatives are known with Ni, 27 , 28 , 29 , 30 Cu, 31 , 32 Rh, 33 Pd, 27 , 34 , 35 Pt 36 , 37 , 38 , 39 and Au. 28 Besides the structure refinements, the CeTZn phases were thoroughly investigated with respect to their magnetic and transport properties. α-CePdZn (T N = 1.3 K), β-CePdZn (T N = 2.7 K), 30 , 35 CePtZn (T N = 1.7 K) and CeAuZn (T N = 1.7 K) 37 , 38 , 39 order antiferromagnetically at very low temperatures. In contrast, CeNiZn 28 shows intermediate cerium valence while cerium in CeRhZn 33 is almost tetravalent. Hydrogenation induces a valence change in CeNiZn towards a stable trivalent state; however, there is no magnetic ordering down to 1.8 K. 29
Herein we report on the solid solutions CeNi1−x Pd x Zn in order to study the change from homogeneous mixed-valent CeNiZn to paramagnetic a-CePdZn.
2 Experimental
2.1 Synthesis
The solid solutions CeNi1−x Pd x Zn were prepared using high purity metals as starting materials: cerium ingots (Smart Elements, 99.99 %), nickel wire (Alfa Aesar, 99.95 %), palladium powder (Agosi, 99.99 %) and zinc granules (Merck, 99.9 %). The moisture sensitive cerium pieces were kept in a Schlenk tube under dry argon. The argon (Westfalen, 99.998 %) was purified over titanium sponge (T = 870 K), silica gel, and molecular sieves. Samples were prepared in x = 0.1 or 0.05 steps. The four elements were weighed in the respective atomic ratios (total masses between 250 and 300 mg) and arc-welded 40 in small tantalum ampoules under an argon pressure of ca. 800 mbar. The ampoules were subsequently placed in the water-cooled sample chamber 41 of an induction furnace (Hüttinger Elektronik, Freiburg, Typ TIG 1.5/300). The annealing sequence for the quaternary samples was based on the one previously used for α-CePdZn. 35 The individual ampoules were first rapidly heated to 1,573 K and kept at that temperature for 5 min. The temperature was then decreased at a rate of ca. 20 K min−1 to 973 K and the tubes were annealed at that temperature for further 3–6 h followed by quenching (turning off the power supply). All samples were separated mechanically from the reaction containers. No reaction with the crucible material was evident.
For increasing the crystallinity and the homogeneity of the samples, the product powders were ground to fine powders, pressed to pellets (∅ 6 mm), sealed in evacuated silica ampoules and annealed at T = 873 K for two weeks. The samples are all stable in air. They have metallic luster while ground powders are dark grey.
2.2 X-ray diffraction
The basic sample characterization proceeded through X-ray powder diffraction. The samples were carefully ground to fine powders under a protective layer of dry (sodium wire) cyclohexane and then placed on a thin X-ray amorphous tape (Scotch® Magic™ tape 810) that was fixed to a brass sample holder used for the Guinier camera: Enraf-Nonius FR552 camera, Fujifilm image plate system, BAS-1800 analyzer. The camera was equipped with a source of CuKα1 radiation, and α-quartz (a = 491.30, c = 540.46 pm) was used as an internal standard. The hexagonal lattice parameters (Table 1) were obtained from least-squares refinements of the experimental 2θ values. Correct indexing of the patterns was ensured by comparison of the experimental patterns with calculated ones using the Lazy Pulverix routine. 42 The course of the cell volumes is presented in Figure 1. Within the solid solution we observe almost Vegard-type behavior between CeNiZn 27 , 28 , 29 , 30 and α-CePdZn. 27 , 34 , 35 The discontinuities are discussed in the crystal chemical chapter (vide infra).
Refined lattice parameters for the compounds of the solid solution CeNi1−x Pd x Zn based on Guinier powder data. Standard deviations are given in parentheses.
| Compound | a/pm | c/pm | V/nm3 | Reference |
|---|---|---|---|---|
| CeNiZn | 713.3(3) | 388.7(1) | 0.1713 | 28 |
| CeNiZna | 714.17(7) | 388.36(10) | 0.1716 | 28 |
| CeNiZn | 713.6(1) | 388.57(8) | 0.1714 | This work |
| CeNi0.95Pd0.05Zn | 715.1(3) | 389.9(2) | 0.1727 | This work |
| CeNi0.9Pd0.1Zn | 717.3(3) | 390.5(1) | 0.1740 | This work |
| CeNi0.85Pd0.15Zn | 719.7(3) | 392.6(2) | 0.1761 | This work |
| CeNi0.8Pd0.2Zn | 721.3(3) | 392.8(1) | 0.1770 | This work |
| CeNi0.75Pd0.25Zn | 722.5(3) | 393.3(1) | 0.1778 | This work |
| CeNi0.7Pd0.3Zn | 724.7(3) | 395.1(1) | 0.1797 | This work |
| CeNi0.65Pd0.35Zn | 727.2(4) | 396.4(1) | 0.1815 | This work |
| CeNi0.6Pd0.4Zn | 727.8(1) | 396.88(7) | 0.1821 | This work |
| CeNi0.59(1)Pd0.41Zna | 727.61(8) | 396.75(4) | 0.1819 | This work |
| CeNi0.5Pd0.5Zn | 729.9(4) | 397.7(2) | 0.1835 | This work |
| CeNi0.4Pd0.6Zn | 733.2(2) | 399.11(8) | 0.1858 | This work |
| CeNi0.3Pd0.7Zn | 734.5(4) | 399.8(1) | 0.1868 | This work |
| CeNi0.2Pd0.8Zn | 736.5(2) | 400.8(1) | 0.1883 | This work |
| CeNi0.1Pd0.9Zn | 738.3(4) | 400.8(2) | 0.1892 | This work |
| α-CePdZn | 740.7(2) | 402.1(1) | 0.1911 | This work |
| α-CePdZna | 739.76(7) | 401.71(10) | 0.1904 | 35 |
| α-CePdZn | 740.4(1) | 402.18(5) | 0.1909 | 35 |
-
aSingle-crystal data.
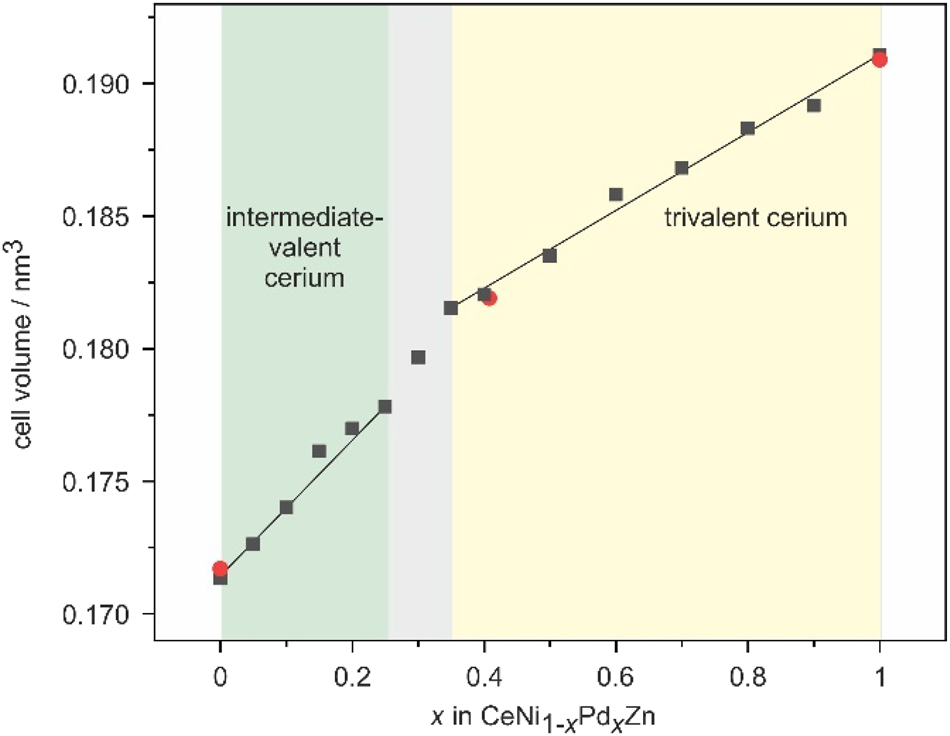
Course of the cell volume (Table 1) of the solid solutions CeNi1–x Pd x Zn. Single crystal data is marked by red dots. The straight lines serve as a guide to the eye.
Single crystals were selected under an optical microscope from a carefully crushed sample with the starting composition CeNi0.7Pd0.3Zn. The crystals were fastened to quartz fibers using beeswax. Their quality was tested by Laue photographs on a Buerger camera (white molybdenum radiation, image plate technique, Fujifilm, BAS-1800). A complete data set was collected at room temperature on a STOE IPDS-II diffractometer (graphite-monochromatized MoKα radiation; oscillation mode). A numerical absorption correction was applied. Details about the data collection and the structure refinement are listed in Table 2.
Crystal data and structure refinement parameters for CeNi0.59(1)Pd0.41Zn of the solid solution CeNi1−x
Pd
x
Zn, ZrNiAl type, space group P
| Empirical formula | CeNi0.59(1)Pd0.41Zn |
| Formula weight/g mol−1 | 283.7 |
| Lattice parameters (single-crystal data) | |
| a/pm | 727.61(8) |
| c/pm | 396.75(4) |
| Cell volume/nm3 | 0.1819 |
| Calculated density/g cm−3 | 7.77 |
| Crystal size/µm3 | 20 × 30 × 70 |
| Transmission (min; max) | 0.312; 0.618 |
| Absorption coefficient/mm−1 | 35.4 |
| Detector distance/mm | 70 |
| Exposure time/min | 15 |
| ω range; increment/deg | 0–180; 1 |
| Integration param. (A; B; EMS) | 14.0; −1.0; 0.030 |
| F(000)/e | 370 |
| θ range/deg | 3.23–33.31 |
| Range in hkl | ±11; ±10; ±6 |
| Total no. reflections | 2,201 |
| Independent reflections; R int | 297; 0.0333 |
| Reflections with I ≥ 3σ(I); R σ | 285; 0.0116 |
| Data; parameters | 297; 17 |
| Goodness-of-fit on F 2 | 1.07 |
| R1; wR2 for I ≥ 3σ(I) | 0.0141; 0.0292 |
| R1; wR2 for all data | 0.0162; 0.0301 |
| Flack parameter | −0.01(5) |
| Extinction coefficient | 159(12) |
| Largest diff. peak; hole/e Å−3 | +0.66; −0.66 |
2.3 Structure refinement
The data set showed a hexagonal lattice and no additional systematic extinctions. In agreement with our earlier studies on α-CePdZn, 35 space group P6‾2m was found to be correct. The atomic parameters were deduced with the charge-flipping algorithm 43 implemented in Superflip 44 and the structure was refined on F 2 with the Jana2020 software package, 45 , 46 with anisotropic displacement parameters for all atoms. The transition metal atoms occupy the Wyckoff sites 1a and 2d. Since nickel (28e) and palladium (46e) differ by 18 electrons, the occupancy parameters can reliably be refined. For the present crystal we observed Ni/Pd mixing on both sites and these occupancies were refined as a least-squares variable in the final cycles, leading to the composition CeNi0.59(1)Pd0.41Zn for the studied single crystal. Refinement of the correct absolute structure was ensured through calculation of the Flack parameter. 47 , 48 , 49 The final difference Fourier synthesis of this data set was contourless. The refined atomic and displacement parameters and the interatomic distances are summarized in Tables 3 and 4.
Atomic coordinates, anisotropic and equivalent isotropic displacement parameters (/ pm2) for CeNi0.59(1)Pd0.41Zn of the solid solution CeNi1−x
Pd
x
Zn, ZrNiAl type, space group P
| Atom | Site | x | y | z | U 11 | U 22 | U 33 | U 12 | U eq |
|---|---|---|---|---|---|---|---|---|---|
| Ce | 3f | 0.41305(5) | 0 | 0 | 119(1) | 117(2) | 130(2) | 58(1) | 122(1) |
| M1 | 1a | 0 | 0 | 0 | 134(5) | U 11 | 139(7) | 67(3) | 136(4) |
| M2 | 2d | 2/3 | 1/3 | 1/2 | 143(3) | U 11 | 117(4) | 71(2) | 134(3) |
| Zn | 3g | 0.76525(12) | 0 | 1/2 | 149(3) | 141(4) | 152(4) | 70(2) | 148(3) |
-
M1 = 0.658(18)Ni1 + 0.342Pd1; M2 = 0.558(12)Ni2 + 0.442Pd2.
Interatomic distances (/ pm) for CeNiZn, 28 CeNi0.59(1)Pd0.41Zn and α-CePdZn. 35 All distances of the first coordination spheres are listed. Standard deviations are equal or smaller than 0.1 pm.
| CeNiZn | CeNi0.59(1)Pd0.41Zn | α-CePdZn | |||||||||
|---|---|---|---|---|---|---|---|---|---|---|---|
| Ce: | 4 | Ni2 | 289.5 | Ce: | 4 | M2 | 295.8 | Ce: | 4 | Pd2 | 300.7 |
| 1 | Ni1 | 296.6 | 1 | M1 | 300.5 | 1 | Pd1 | 304.5 | |||
| 2 | Zn | 315.9 | 2 | Zn | 324.1 | 2 | Zn | 328.2 | |||
| 4 | Zn | 322.7 | 4 | Zn | 327.9 | 4 | Zn | 332.5 | |||
| 4 | Ce | 371.5 | 4 | Ce | 380.0 | 4 | Ce | 387.3 | |||
| 2 | Ce | 388.7 | 2 | Ce | 396.8 | 2 | Ce | 402.2 | |||
| Ni1: | 6 | Zn | 256.7 | M1: | 6 | Zn | 261.8 | Pd1: | 6 | Zn | 267.6 |
| 3 | Ce | 296.6 | 3 | Ce | 300.5 | 3 | Ce | 304.5 | |||
| Ni2: | 3 | Zn | 279.5 | M2: | 3 | Zn | 285.3 | Pd2: | 3 | Zn | 288.4 |
| 6 | Ce | 289.5 | 6 | Ce | 295.8 | 6 | Ce | 300.7 | |||
| Zn: | 2 | Ni1 | 256.7 | Zn: | 2 | M1 | 261.8 | Zn: | 2 | Pd1 | 267.6 |
| 2 | Ni2 | 279.5 | 2 | M2 | 285.3 | 2 | Pd2 | 288.4 | |||
| 2 | Zn | 290.4 | 2 | Zn | 295.9 | 2 | Zn | 305.8 | |||
| 2 | Ce | 315.9 | 2 | Ce | 324.1 | 2 | Ce | 328.2 | |||
| 4 | Ce | 322.7 | 4 | Ce | 327.9 | 4 | Ce | 332.5 | |||
CCDC 2448822 contains the supplementary crystallographic data for this paper. These data can be obtained free of charge from The Cambridge Crystallographic Data Centre via www.ccdc.cam.ac.uk/data_request/cif.
2.4 EDX data
The CeNi0.59(1)Pd0.41Zn single crystal was analysed by EDX, using a Zeiss EVO® MA10 scanning electron microscope which was operated in variable pressure mode (60 Pa). CeO2, Ni, Pd and Zn served as standards. The microanalyses were conducted with the ZAF correction algorithm (Z = atomic number, A = absorption, F = fluorescence) in combination with fixed X-ray intensity values for the energies of the respective standards, the so-called standard-free analyses. The EDX analysis (34 ± 2 at% Ce: 17 ± 2 at% Ni: 17 ± 2 at% Pd: 32 ± 2 at% Zn) confirmed the compositions refined from the single crystal X-ray data of 33.3:19.7:13.7:33.3. The irregular crystal surface accounts for the small deviations. No impurity elements were detected (as a check for a potential reaction with the crucible material tantalum).
2.5 Susceptibility measurements
Polycrystalline samples of the solid solutions CeNi1–x Pd x Zn (x = 0, 0.05, 0.1, 0.15, 0.2, 0.25, 0.3, 0.4, 0.5, …, 1) were filled in polypropylene capsules and attached to a sample holder rod of the Dynacool PPMS (physical property measurement system) by Quantum design. They were investigated using the VSM (vibrating sample magnetometer) option in the temperature range of 2–300 K and at external magnetic fields up to 90 kOe (1 kOe = 7.96 × 10⁴ A m−1). Fitting and plotting the data was done with OriginPro 2024 50 and the graphical editing with the program CorelDraw 2017. 51
3 Crystal chemistry
The ternary intermetallic zinc compounds CeNiZn 27 , 28 , 29 , 30 and α-CePdZn 27 , 34 , 35 crystallize with the ZrNiAl-type structure, 52 , 53 , 54 space group P6‾2m. They form a continuous set of solid solutions CeNi1−x Pd x Zn. Although both phases crystallize with the same structure type, they have a different magnetic ground state. The cerium atoms in CeNiZn are in a homogeneous mixed-valent state, 28 , 29 while α-CePdZn 27 , 34 , 35 shows a stable [Xe]4f 1 state, i.e., trivalent cerium. The cell volumes of the two boarder phases are thus governed by (i) the cerium valence (smaller intermediate-valent vs larger trivalent cerium) and (ii) the covalent radii 55 of 115 pm for nickel and 128 pm for palladium.
The course of the unit cell parameters within the solid solutions CeNi1−x Pd x Zn is evident from Table 1. We observe an almost continuous increase of the a (3.8 %) and c (3.5 %) lattice parameter from CeNiZn to α-CePdZn. The x dependence of the cell volume is shown in Figure 1. From α-CePdZn to CeNi0.65Pd0.35Zn we observe an almost linear decrease of the cell volume. The decrease is also linear from CeNi0.75Pd0.25Zn to CeNiZn, however, with a larger slope. These different ranges are directly related to the physical properties (vide infra), i.e., the trivalent regime from α-CePdZn to CeNi0.65Pd0.35Zn and the intermediate-valent one from CeNi0.75Pd0.25Zn to CeNiZn. Comparable cell volume dependencies have been observed for the isotypic solid solutions CeNi1–x Pd x In 56 and CeRh1–x Pd x In. 19
A projection of the CeNi0.59(1)Pd0.41Zn structure is shown in Figure 2. The basic building units are two types of trigonal prisms that are filled by the transition metal (T) atoms. Both T sites show nickel/palladium mixing with a slightly higher nickel content on Wyckoff position 1a. The T1 site (1a, Ni0.66(2)Pd0.34) has trigonal-prismatic zinc coordination and the rectangular faces of the prisms are capped by three cerium atoms, leading to coordination number 9. Also, the T2 site (2d, Ni0.56(1)Pd0.44) is trigonal-prismatically coordinated. Here, the prism is built by cerium atoms and capped by zinc atoms. The projection shows the connectivity pattern of the two prismatic types. The T2@Ce6 prisms are condensed via common edges, forming six-membered rings. These rings are condensed via the triangular faces in c direction, forming tubes that extend in c direction. These tubes are filled by strands of face-sharing T1@Zn6 prisms. The two prism types are shifted with respect to each other by half the translation period c, thus enabling the capping of the rectangular prism sites.
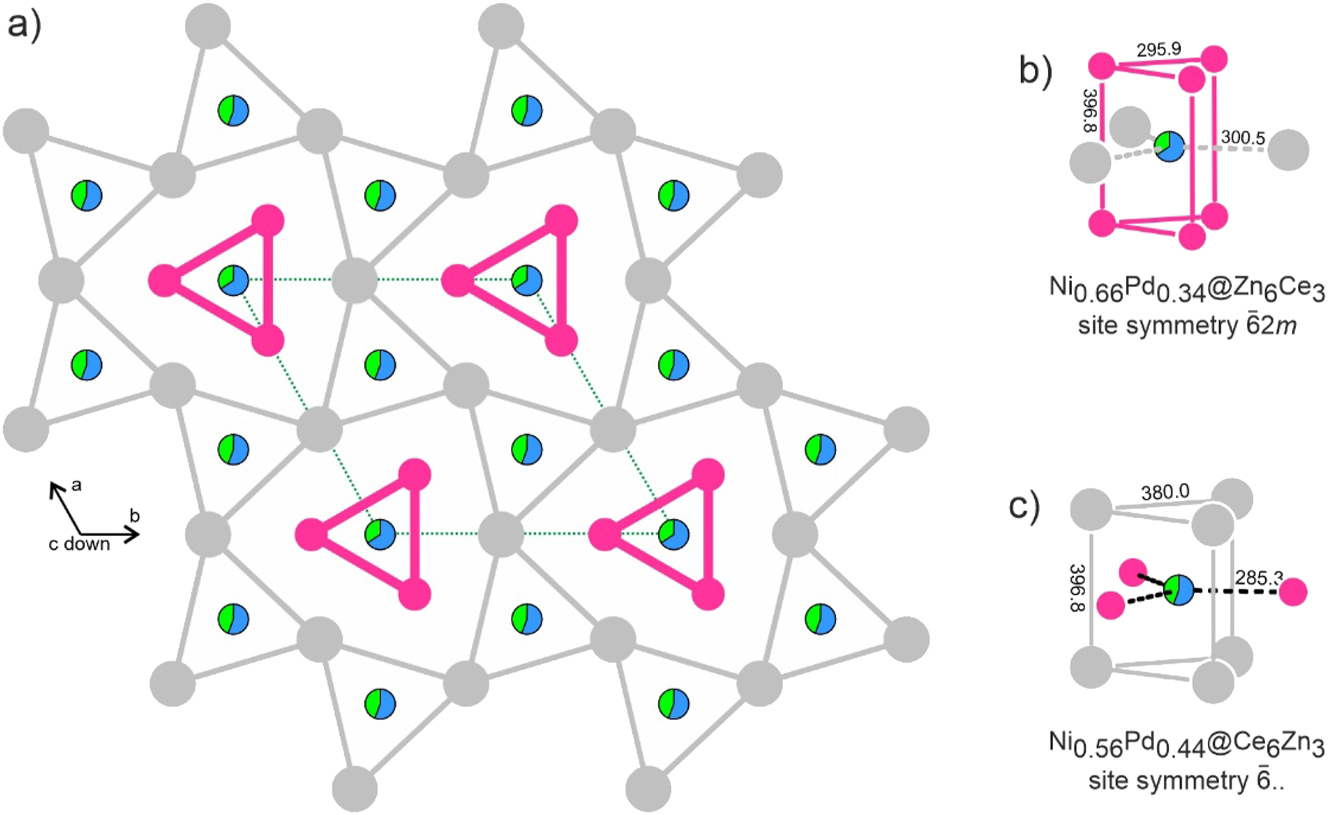
The crystal structure of CeNi0.59(1)Pd0.41Zn. Cerium and zinc atoms are drawn as medium grey and magenta circles; the mixed occupied sites are drawn as segments in blue (nickel) and green (palladium). (a) Projection along the c axis with emphasis on the trigonal-prismatic building units. The two prism types are shifted by c/2 with respect to each other as is emphasized by thin and thick lines. (b) and (c) Coordination of the two crystallographically independent Ni/Pd mixed sites. Relevant interatomic distances (/ pm) and the site symmetries are indicated.
Table 4 lists the interatomic distances in CeNiZn, CeNi0.59(1)Pd0.41Zn and a-CePdZn. Similar to the continuous increase of the unit cell volume (Table 1) within the solid solutions, the interatomic distances follow the same trend. For further crystal chemical details on ZrNiAl-type CeTX phases we refer to our previous review article. 7
We now turn to the cerium substructures of CeNiZn, CeNi0.59(1)Pd0.41Zn and α-CePdZn. Within the ab plane, each cerium atom has four shorter Ce–Ce distances to the neighboring triangles and two slightly longer ones along the c axis. All these Ce–Ce distances are distinctly longer than the Hill limit 57 , 58 of ca. 340 pm, which discriminates between superconducting and magnetically ordered (f electron localization) intermetallic cerium compounds. In his original work, 57 Hill relied this limit only on 19 compounds and this was extended in the work of Koelling 59 to 33 compounds. In a recent work, Miyahara et al. 58 studied more than 700 intermetallic cerium compounds with respect to their Ce–Ce distances and magnetic ordering temperatures. It turned out that the shortest average Ce–Ce distance amounts to approximately 416.1 pm. Intermediate-valent cerium compounds occur in the entire range from 300 to 450 pm; however, as expected, with an accumulation towards the shorter distances, where increased hybridization between the 4f cerium electrons and the Ni/Pd d electrons is observed. Thus, the Ce–Ce distances alone are not the decisive criterion for formation of an intermediate-valent cerium intermetallic compound. The members of the present solid solutions fit approximately in the middle of the Miyahara plot.
4 Magnetic properties
Magnetic susceptibility measurements were performed on all samples. The motivation of this investigation was to study the valence transition from intermediate-valent CeNiZn to trivalent α-CePdZn as a function of the nickel content within the solid solutions CeNi1−x Pd x Zn. A common feature of the results of all susceptibility measurements was the absence of long-range magnetic order down to 2 K.
In the following we discuss the course of the susceptibility behavior with increasing nickel content. For α-CePdZn and small amounts of nickel within the CeNi1−x Pd x Zn samples, a nearly linear increase of χ −1 with increasing temperature can be observed (Figure 3, bottom). A higher nickel content raises the absolute values of χ −1 and causes a higher deviation of the linear progression at low temperatures. Up to the sample composition CeNi0.65Pd0.35Zn, the linear part of the inverse susceptibilities could be fitted with a modified Curie-Weiss law (Figure 3, bottom). The resulting fitting parameters are listed in Table 5. The susceptibility behavior of the new α-CePdZn sample is similar to the literature data. 35 The addition of nickel to the solid solution CeNi1−x Pd x Zn up to the composition CeNi0.65Pd0.35Zn does not alter the cerium valence, since the effective magnetic moment stays almost constant in these samples. The experimental magnetic moments are close to the free ion value of 2.54 µB for Ce3+. 60 In the same range we observe a decrease of the paramagnetic Curie temperature (Table 5).
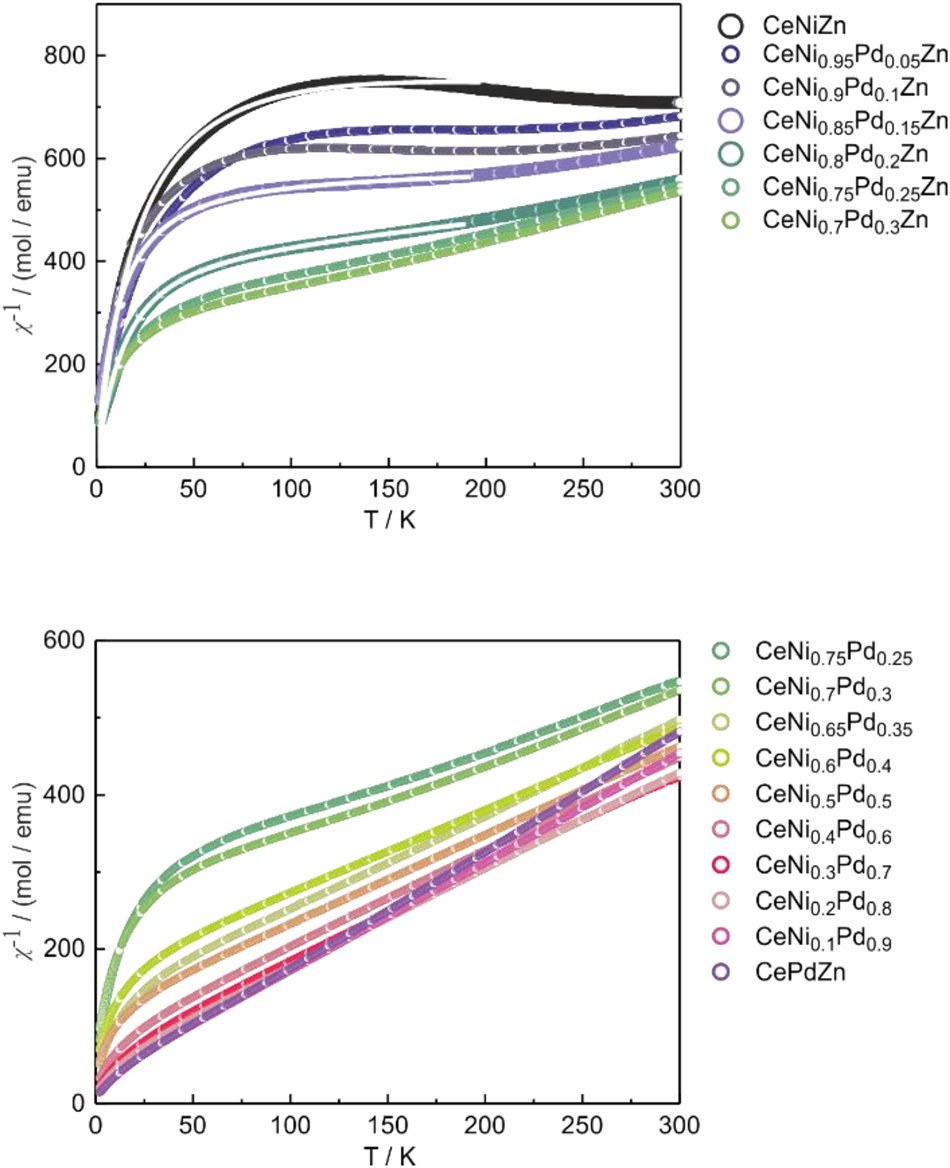
Inverse magnetic susceptibility of several samples of the solid solution CeNi1–x Pd x Zn in the temperature range of 2–300 K. The white lines in the upper plot show the fit using the ICF model. The circles are shown in larger sizes in order to guide the eye. The bottom plot shows the samples with trivalent cerium. CeNi0.75Pd0.25Zn and CeNi0.7Pd0.3Zn are shown in both plots because they represent the breaking point between ICF and Curie-Weiss behavior.
Magnetic properties of CeNi1–x Pd x Zn: effective magnetic moment µ eff, paramagnetic Curie temperature θ P, experimental saturation magnetization µ sat, temperature independent contribution χ 0. The theoretical magnetic moment of Ce3+ is µ eff = 2.54 µB, the maximal saturation magnetization is µ sat = 2.14 µB.
| Compound | µ eff/µB | θ P/K | χ 0/emu mol−1 | µ sat/µB per f.u. |
|---|---|---|---|---|
| CeNiZn | – | – | 1.49(1)·10−3 | 0.06(1) |
| CeNi0.95Pd0.05Zn | – | – | – | 0.07(1) |
| CeNi0.9Pd0.1Zn | – | – | – | 0.05(1) |
| CeNi0.85Pd0.15Zn | – | – | 1.44(1)·10−3 | 0.05(1) |
| CeNi0.8Pd0.2Zn | – | – | 1.44(1)·10−3 | 0.08(1) |
| CeNi0.75Pd0.25Zn | – | – | – | 0.10(1) |
| CeNi0.7Pd0.3Zn | – | – | – | 0.09(1) |
| CeNi0.65Pd0.35Zn | 2.43(1) | −86.7(1) | 9.96(1)·10−5 | 0.18(1) |
| CeNi0.6Pd0.4Zn | 2.76(1) | −158.1(1) | −3.39(1)·10−5 | 0.14(1) |
| CeNi0.5Pd0.5Zn | 2.61(1) | −99.6(1) | 2.01(1)·10−5 | 0.26(1) |
| CeNi0.4Pd0.6Zn | 2.45(1) | −56.6(1) | 1.15(1)·10−4 | 0.31(1) |
| CeNi0.3Pd0.7Zn | 2.42(1) | −39.8(1) | 1.88(1)·10−4 | 0.42(1) |
| CeNi0.2Pd0.8Zn | 2.41(1) | −30.9(1) | 1.39(1)·10−4 | 0.55(1) |
| CeNi0.1Pd0.9Zn | 2.41(1) | −24.3(1) | −4.03(1)·10−5 | 0.65(1) |
| CePdZn | 2.38(1) | −20.9(1) | −1.27(1)·10−4 | 0.67(1) |
| CePdZn 35 | 2.42(1) | −39.6(1) | – | 0.4(1)a |
-
aAt 80 kOe and 5 K.
The samples of compositions CeNi0.75Pd0.25Zn and CeNi0.7Pd0.3Zn do not give reasonable results that follow the Curie-Weiss law. They are in the intermediate range of composition, where the cerium atoms switch from trivalent to homogeneous mixed-valent, and probably exhibit a more complex magnetic domain structure.
With a further increase of the nickel content, we observe a drastic variation in χ −1 (Figure 3, top). The deviation at low temperature becomes larger and the slope at higher temperatures becomes smaller, reaching a plateau. For CeNiZn, χ −1 even slightly decreases again, comparable to the results of original work. 28 This behavior does not follow the Curie-Weiss law, since the temperature-induced valence change from trivalent to intermediate-valent cerium must also be considered. This is done using the ICF (inter-configuration fluctuation) model developed by Sales and Wohlleben. 61 The underlying formulæ are documented in the original work and have also been applied for the intermediate-valent cerium-based solid solutions CeRh1−x Ru x Sn, 23 CeRu1−x Ni x Al, 62 CeRu1−x Ni x Sn 25 and CeRh1−x Pd x Sn. 26 For further details we refer to these publications.
The susceptibility data of the CeNi0.8Pd0.2Zn, CeNi0.85Pd0.15Zn and CeNiZn samples were fitted with the Sales-Wohlleben model. The fitted functions are shown as white lines in the plot of the temperature dependence of the reciprocal magnetic susceptibility in the upper part of Figure 3 (top) and the fitting parameters are summarized in Table 6. The amount of stable trivalent cerium in CeNiZn had to be fixed in the fitting procedure in order to prevent too large correlations. The CeNi0.9Pd0.1Zn and CeNi0.95Pd0.05Zn samples slightly deviated from the expected course of χ −1, probably due to clustering of different magnetic domains. From the Sales-Wohlleben fits, the temperature-dependent Ce valency could be calculated (Figure 4). With decreasing nickel content, the cerium valence tends towards the trivalent state.
Magnetic properties of CeNi1–x Pd x Zn: temperature-independent contribution χ 0, energy difference between the ground states of Ce3+ and Ce4+ E kb, spin fluctuation temperature T f, amount of not fluctuating Ce3+ n.
| Compound | χ 0/emu mol−1 | E kb | T f | n |
|---|---|---|---|---|
| CeNiZn | 1.49(1) × 10−3 | 5,874(74) | 2,248(27) | 2.98 × 10⁻² |
| CeNi0.85Pd0.15Zn | 1.44(1) × 10−3 | 835(25) | 623(23) | 2.20(1) × 10−2 |
| CeNi0.8Pd0.2Zn | 1.44(1) × 10−3 | 744(3) | 627(10) | 3.88(1) × 10−2 |
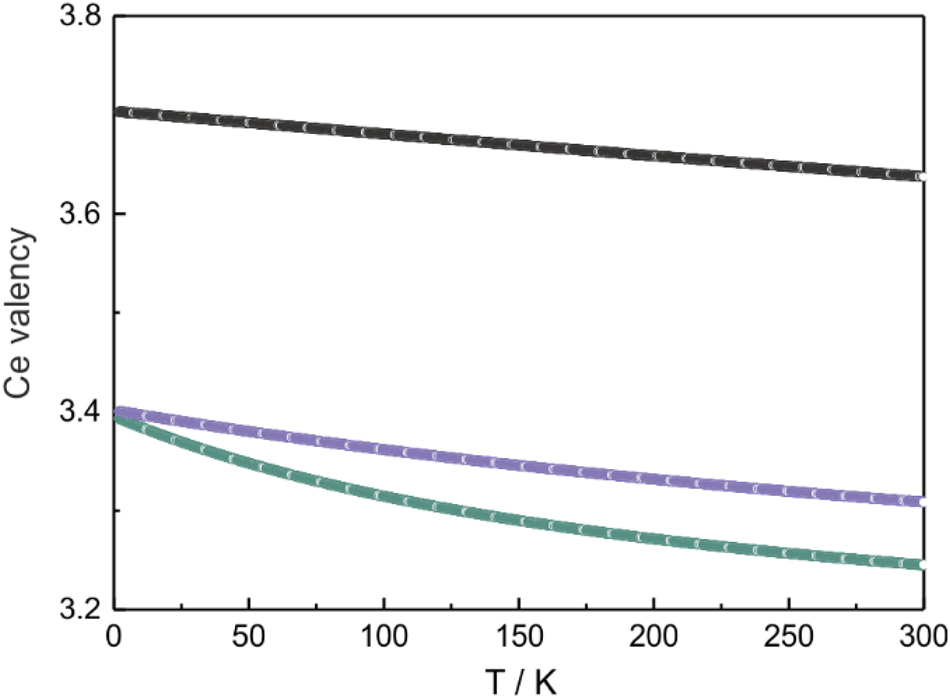
Temperature-dependent valency of cerium in the compounds CeNiZn (black), CeNi0.85Pd0.15Zn (violet) and CeNi0.8Pd0.2Zn (green).
Finally, we point to the magnetization behavior of the CeNi1−x Pd x Zn samples. The 2 K magnetization isotherms are summarized in Figure 5. The value of the saturation magnetization (the numerical values are listed in Table 5) decreases with increasing nickel content as expected for the change from a paramagnetic trivalent to a homogeneous mixed-valence system. The obtained saturation magnetizations are all distinctly lower than the theoretical value of 2.14 µB per Ce atom according to g × J. 60
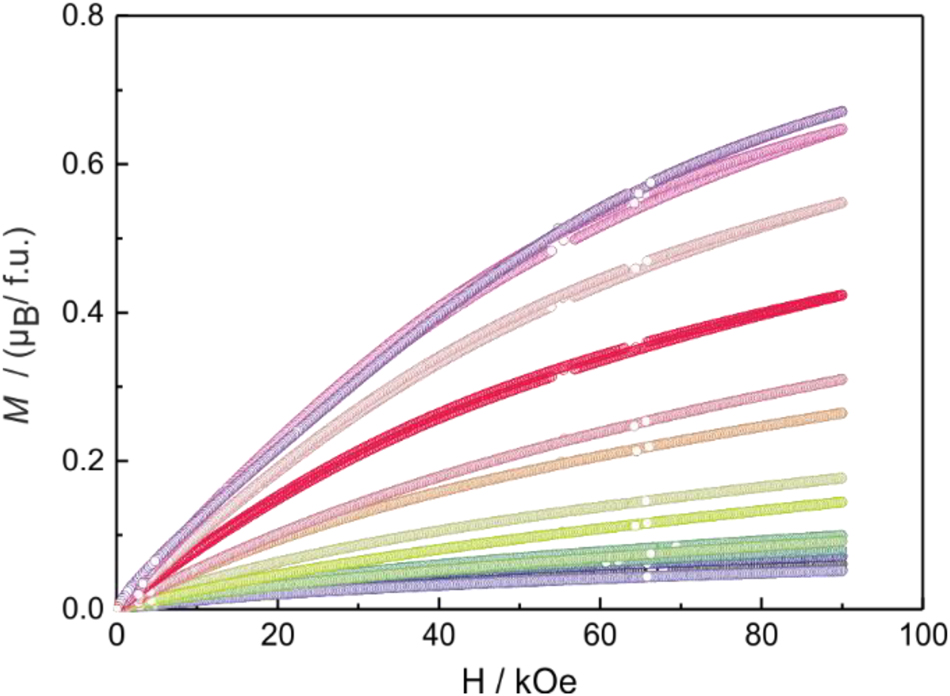
2 K magnetization isotherms of samples of the solid solutions CeNi1–x Pd x Zn between 0 and 90 kOe. The color codes of the different samples are the same as in Figure 3.
Summing up, all samples of the solid solutions CeNi1−x Pd x Zn crystallize with the hexagonal ZrNiAl-type structure with one crystallographic cerium site. The magnetic susceptibility data show a change from a 4f 1 configuration for Curie-Weiss-paramagnetic α-CePdZn to a homogeneous mixed valence 63 , 64 , 65 in CeNiZn. Thus, the cerium atoms in the homogeneous mixed-valence regime transfer higher electron density to the [Ni1−x Pd x ] δ− substructure.
Acknowledgments
We thank M.Sc. C. Paulsen for the EDX analyses.
-
Research ethics: Not applicable.
-
Informed consent: Not applicable.
-
Author contribution: All authors have accepted responsibility for the entire content of this submitted manuscript and approved the submission.
-
Use of Large Language Models, AI and Machine Learning Tools: Not relevant. Our group is able to think and act independently.
-
Conflict of interest: The authors declare no conflicts of interest regarding this article.
-
Research funding: This research was funded by Universität Münster and Deutsche Forschungsgemeinschaft (INST 211/1034-1).
-
Data availability: Data is available from the corresponding author on well-founded request.
References
1. Villars, P.; Cenzual, K., Eds. Pearson’s Crystal Data: Crystal Structure Database for Inorganic Compounds (release 2023/24); ASM International®: Materials Park, Ohio, USA, 2023.Search in Google Scholar
2. Szytuła, A.; Leciejewicz, J. Handbook of Crystal Structures and Magnetic Properties of Rare Earth Intermetallics; CRC Press: Boca Raton, 1994.Search in Google Scholar
3. Palstra, T. T. M.; Menovsky, A. A.; Nieuwenhuys, G. J.; Mydosh, J. A. J. Magn. Magn. Mater. 1986, 54–57, 435–436. https://doi.org/10.1016/0304-8853(86)90654-2.Search in Google Scholar
4. Endstra, T.; Nieuwenhuys, G. J.; Palstra, T. T. M.; Mydosh, J. A. Phys. Rev. B 1993, 48, 9595–9605. https://doi.org/10.1103/physrevb.48.9595.Search in Google Scholar PubMed
5. Shatruk, M. J. Solid State Chem. 2019, 272, 198–209. https://doi.org/10.1016/j.jssc.2019.02.012.Search in Google Scholar
6. Lai, Y.; Chan, J. Y.; Baumbach, R. E. Sci. Adv. 2022, 8, eabp8264. https://doi.org/10.1126/sciadv.abp8264.Search in Google Scholar PubMed PubMed Central
7. Pöttgen, R.; Chevalier, B. Z. Naturforsch. 2015, 70b, 289–304.10.1515/znb-2015-0018Search in Google Scholar
8. Pöttgen, R.; Janka, O.; Chevalier, B. Z. Naturforsch. 2016, 71b, 165–191.10.1515/znb-2016-0013Search in Google Scholar
9. Janka, O.; Niehaus, O.; Pöttgen, R.; Chevalier, B. Z. Naturforsch. 2016, 71b, 737–764.10.1515/znb-2016-0101Search in Google Scholar
10. Mimura, K.; Okabayashi, Y.; Mizohata, H.; Sakiyama, D.; Sakai, O.; Huo, D.; Sakurai, J.; Taguchi, Y.; Ichikawa, K.; Aita, O. Surf. Rev. Lett. 2002, 9, 1035–1039.10.1142/S0218625X02003305Search in Google Scholar
11. Garg, K. B.; Singhal, R. K.; Fanfoni, M.; Marcelli, A.; Bianconi, A.; Chandra, U.; Chauhan, H. S.; Rao, K. V. R. Phys. B 1990, 163, 581–583. https://doi.org/10.1016/0921-4526(90)90275-y.Search in Google Scholar
12. Koterlyn, M.; Shcherba, I.; Yasnitskii, R.; Koterlyn, G. J. Alloys Compd. 2007, 442, 176–179. https://doi.org/10.1016/j.jallcom.2006.08.353.Search in Google Scholar
13. Ślebarski, A. J. Low Temp. Phys. 2007, 147, 147–164. https://doi.org/10.1007/s10909-007-9306-0.Search in Google Scholar
14. Riecken, J. F.; Hermes, W.; Chevalier, B.; Hoffmann, R.-D.; Schappacher, F. M.; Pöttgen, R. Z. Anorg. Allg. Chem. 2007, 633, 1094–1099. https://doi.org/10.1002/zaac.200700066.Search in Google Scholar
15. Feyerherm, R.; Dudzik, E.; Prokeš, K.; Mydosh, J. A.; Huang, Y.-K.; Pöttgen, R. Phys. Rev. B 2014, 90, 041104. https://doi.org/10.1103/physrevb.90.041104.Search in Google Scholar
16. Sampathkumaran, E. V.; Nakazawa, Y.; Ishikawa, M.; Vijayaraghavan, R. Phys. Rev. B 1989, 40, 11452–11455. https://doi.org/10.1103/physrevb.40.11452.Search in Google Scholar PubMed
17. Sereni, J. G.; Berisso, M. G.; Canales, N. C.; Deppe, M.; Geibel, C. Phys. Status Solidi B 2010, 247, 707–709. https://doi.org/10.1002/pssb.200983029.Search in Google Scholar
18. Lloret, B.; Chevalier, B.; Buffat, B.; Etourneau, J.; Quezel, S.; Lamharrar, A.; Rossat-Mignot, J.; Calemczuk, R.; Bonjour, E. J. Magn. Magn. Mater. 1987, 64, 85–87.10.1016/0304-8853(87)90530-0Search in Google Scholar
19. Brück, E.; Nakotte, H.; Bakker, K.; de Boer, F. R.; de Châtel, P. F.; Li, J.-Y.; Kuang, J. P.; Yang, F.-M. J. Alloys Compd. 1993, 200, 79–86.10.1016/0925-8388(93)90475-3Search in Google Scholar
20. Umarji, A. M.; Godart, C.; Gupta, L. C.; Vijayaraghavan, R. Pramana – J. Phys. 1986, 27, 321–329. https://doi.org/10.1007/bf02846346.Search in Google Scholar
21. Reimann, M. K.; Pröbsting, W.; Koldemir, A.; Palms, J.; Pöttgen, R. Z. Naturforsch. 2023, 78b, 549–556.10.1515/znb-2023-0073Search in Google Scholar
22. Rayaprol, S.; Heying, B.; Pöttgen, R. Z. Naturforsch. 2006, 61b, 495–502.10.1515/znb-2006-0501Search in Google Scholar
23. Niehaus, O.; Abdala, P. M.; Riecken, J. F.; Winter, F.; Chevalier, B.; Pöttgen, R. Z. Naturforsch. 2013, 68b, 960–970.10.5560/znb.2013-3176Search in Google Scholar
24. Niehaus, O.; Chevalier, B.; Abdala, P. M.; Winter, F.; Pöttgen, R. Z. Naturforsch. 2013, 68b, 1279–1287.10.5560/znb.2013-3257Search in Google Scholar
25. Niehaus, O.; Abdala, P. M.; Touzani, R. S.; Fokwa, B. P. T.; Pöttgen, R. Solid State Sci. 2015, 40, 36–43.10.1016/j.solidstatesciences.2014.12.007Search in Google Scholar
26. Niehaus, O.; Abdala, P. M.; Pöttgen, R. Z. Naturforsch. 2015, 70b, 253–264.10.1515/znb-2015-0003Search in Google Scholar
27. Iandelli, A. J. Alloys Compd. 1992, 182, 87–90. https://doi.org/10.1016/0925-8388(92)90577-v.Search in Google Scholar
28. Hermes, W.; Mishra, R.; Rodewald, U. C.; Pöttgen, R. Z. Naturforsch. 2008, 63b, 537–542.10.1515/znb-2008-0510Search in Google Scholar
29. Tencé, S.; Heying, B.; Janka, O.; Pöttgen, R.; Chevalier, B. J. Alloys Compd. 2017, 724, 515–519.10.1016/j.jallcom.2017.07.038Search in Google Scholar
30. Oomi, G.; Eto, T.; Okada, T.; Uwatoko, Y. Phys. B 2018, 536, 293–296. https://doi.org/10.1016/j.physb.2017.10.044.Search in Google Scholar
31. Fornasini, M. L.; Iandelli, A.; Merlo, F.; Pani, M. Intermetallics 2000, 8, 239–246. https://doi.org/10.1016/s0966-9795(99)00111-9.Search in Google Scholar
32. Pavlyuk, V.; Prochwicz, W.; Solokha, P.; Zelinska, O.; Marciniak, B.; Różycka-Sokołowska, E. J. Alloys Compd. 2006, 407, 226–231. https://doi.org/10.1016/j.jallcom.2005.06.057.Search in Google Scholar
33. Hermes, W.; Al Alam, A. F.; Matar, S. F.; Pöttgen, R. Solid State Sci. 2008, 10, 1895–1904. https://doi.org/10.1016/j.solidstatesciences.2008.04.003.Search in Google Scholar
34. Mishra, T.; Heymann, G.; Huppertz, H.; Pöttgen, R. Intermetallics 2012, 20, 110–114. https://doi.org/10.1016/j.intermet.2011.08.012.Search in Google Scholar
35. Hermes, W.; Mishra, R.; Müller, H.; Johrendt, D.; Pöttgen, R. Z. Anorg. Allg. Chem. 2009, 635, 660–666.10.1002/zaac.200900054Search in Google Scholar
36. Mishra, R.; Hermes, W.; Pöttgen, R. Z. Naturforsch. 2007, 62b, 1581–1584.10.1515/znb-2007-1217Search in Google Scholar
37. Dhar, S. K.; Kulkarni, R.; Hidaka, H.; Toda, Y.; Kotegawa, H.; Kobayashi, T. C.; Manfrinetti, P.; Provino, A. J. Phys.: Condens. Matter 2009, 21, 156001. https://doi.org/10.1088/0953-8984/21/15/156001.Search in Google Scholar
38. Harriger, L.; Disseler, S. M.; Gunasekera, J.; Rodriguez-Rivera, J.; Pixley, J.; Manfrinetti, P.; Dhar, S. K.; Singh, D. K. Phys. Rev. B 2017, 95, 041102. https://doi.org/10.1103/physrevb.95.041102.Search in Google Scholar
39. Dhar, S. K.; Aoki, Y.; Suemitsu, B.; Miyazaki, R.; Provino, A.; Manfrinetti, P. J. Appl. Phys. 2014, 115, 17E113. https://doi.org/10.1063/1.4862378.Search in Google Scholar
40. Pöttgen, R.; Gulden, T.; Simon, A. GIT Labor-Fachz. 1999, 43, 133–136.Search in Google Scholar
41. Kußmann, D.; Hoffmann, R.-D.; Pöttgen, R. Z. Anorg. Allg. Chem. 1998, 624, 1727–1735.10.1002/(SICI)1521-3749(1998110)624:11<1727::AID-ZAAC1727>3.3.CO;2-SSearch in Google Scholar
42. Yvon, K.; Jeitschko, W.; Parthé, E. J. Appl. Crystallogr. 1977, 10, 73–74.10.1107/S0021889877012898Search in Google Scholar
43. Palatinus, L. Acta Crystallogr. 2013, B69, 1–16.10.1107/S0108768112051361Search in Google Scholar
44. Palatinus, L.; Chapuis, G. J. Appl. Crystallogr. 2007, 40, 786–790. https://doi.org/10.1107/s0021889807029238.Search in Google Scholar
45. Petříček, V.; Dušek, M.; Palatinus, L. Z. Kristallogr. 2014, 229, 345–352.10.1515/zkri-2014-1737Search in Google Scholar
46. Petříček, V.; Palatinus, L.; Plášil, J.; Dušek, M. Z. Kristallogr. 2023, 238, 271–282.10.1515/zkri-2023-0005Search in Google Scholar
47. Flack, H. D.; Bernadinelli, G. Acta Crystallogr. 1999, A55, 908–915.10.1107/S0108767399004262Search in Google Scholar PubMed
48. Flack, H. D.; Bernadinelli, G. J. Appl. Crystallogr. 2000, 33, 1143–1148.10.1107/S0021889800007184Search in Google Scholar
49. Parsons, S.; Flack, H. D.; Wagner, T. Acta Crystallogr. 2013, B69, 249–259.10.1107/S2052519213010014Search in Google Scholar PubMed PubMed Central
50. OriginPro 2024 (version 10.1.0.170); OriginLab Corporation: Northampton, Massachusetts, USA, 2024.Search in Google Scholar
51. CorelDRAW Graphics Suite 2017 (version 19.0.0.328); Corel Corporation: Ottawa, Ontario, Canada, 2017.Search in Google Scholar
52. Krypyakevich, P. I.; Markiv, V. Y.; Melnyk, E. V. Dopov. Akad. Nauk. Ukr. RSR, Ser. A 1967, 750–753.Search in Google Scholar
53. Dwight, A. E.; Mueller, M. H.; Conner, R. A.Jr.; Downey, J. W.; Knott, H. Trans. Met. Soc. AIME 1968, 242, 2075–2080.Search in Google Scholar
54. Zumdick, M. F.; Hoffmann, R.-D.; Pöttgen, R. Z. Naturforsch. 1999, 54b, 45–53.10.1515/znb-1999-0111Search in Google Scholar
55. Emsley, J. The Elements; Oxford University Press: Oxford, 1999.Search in Google Scholar
56. Klicpera, M.; Javorský, P.; Šantavá, E. J. Phys.: Condens. Matter 2013, 25, 245501.10.1088/0953-8984/25/24/245501Search in Google Scholar PubMed
57. Hill, H. H. The Early Actinides: The Periodic System’s f Electron Transition Metal Series. In Plutonium 1970 and Other Actinides; Miner, W., Ed.; The Metallurgical Society of the AIME: New York, 1970; pp. 2–19.Search in Google Scholar
58. Miyahara, J.; Shirakawa, N.; Setoguchi, Y.; Tsubota, M.; Kuroiwa, K.; Kitagawa, J. J. Supercond. Nov. Magn. 2018, 31, 3559–3564. https://doi.org/10.1007/s10948-018-4624-9.Search in Google Scholar
59. Koelling, D. D. Phys. B 1985, 130, 135–137. https://doi.org/10.1016/0378-4363(85)90204-9.Search in Google Scholar
60. Lueken, H. Magnetochemie; Teubner: Stuttgart, 1999.10.1007/978-3-322-80118-0Search in Google Scholar
61. Sales, B. C.; Wohlleben, D. K. Phys. Rev. Lett. 1975, 35, 1240–1244. https://doi.org/10.1103/physrevlett.35.1240.Search in Google Scholar
62. Niehaus, O.; Rodewald, U. C.; Abdala, P. M.; Touzani, R. S.; Fokwa, B. P. T.; Janka, O. Inorg. Chem. 2014, 53, 2471–2480. https://doi.org/10.1021/ic402414f.Search in Google Scholar PubMed
63. Robin, M. B.; Day, P. Adv. Inorg. Chem. Radiochem. 1968, 10, 247–422.10.1016/S0065-2792(08)60179-XSearch in Google Scholar
64. Batlogg, B.; Kaldis, E.; Schlegel, A.; von Schulthess, G.; Wachter, P. Solid State Commun. 1976, 19, 673–676. https://doi.org/10.1016/0038-1098(76)91102-9.Search in Google Scholar
65. Batlogg, B.; Kaldis, E.; Wachter, P. J. Magn. Magn. Mater. 1976, 3, 96–98. https://doi.org/10.1016/0304-8853(76)90018-4.Search in Google Scholar
© 2025 Walter de Gruyter GmbH, Berlin/Boston
Articles in the same Issue
- Frontmatter
- In this issue
- Research Articles
- Molecular and electronic structures of molecules and ions with a linear chain of four carbon atoms: polyyne or cumulene?
- A new cobalt(II) coordination polymer: electrocatalytic hydrogen evolution reaction and electrochemical sensing of ascorbic acid in glassy carbon electrodes
- A switch from homogeneous mixed-valent to trivalent cerium in the solid solutions CeNi1–x Pd x Zn
- The metal-rich phosphide β-ZrCr6P4 with β-UCr6P4-type structure
- Palladium-coordinated Al4 butterfly clusters in the palladium-rich aluminides RE 4Pd11Al8 (RE = Y, Sm, Gd–Lu)
- Attempts to crystallize salts of thiocyameluric acid C6N7S3H3 and the crystal structure of the first hydrogen thiocyamelurate [Sr(H2O)6][HC6N7S3]
- Deriving the Goldschmidt-like tolerance factors for solids: a simplified polyhedral approach