Hydrogen Sulfide Gas Sensor Based on Copper/Graphene Oxide Composite Film-Coated Tapered Single-Mode Fibre Interferometer
-
Jiahao Yu
 und
Wenlin Feng
und
Wenlin Feng

Abstract
A hydrogen sulfide (H2S) gas sensor based on copper (Cu) nanoparticle deposited graphene oxide (GO) composite membrane with two waist-enlarged tapers is proposed. Three segments of the single-mode fibres (SMFs) are sequentially fused to obtain two waist-enlarged bitapers of Mach–Zehnder interferometer (MZI). When the light of a broadband light source transmits through the first bitaper, some light enters the fiber cladding; the lights of core mode and cladding mode are coupled at the second taper and an MZI is successfully fabricated. The copper/graphene oxide (Cu/GO) composite sensing film is coated on the surface of the second SMF, and the effective refractive index of the coating is changed when the sensitive film adsorbs the target gas. The correlation between the gas concentration and the wavelength shift is achieved and the H2S can be measured effectively. The results show that a uniform Cu/GO film is successfully coated on the surface of the fiber, and when the thickness of the sensitive film is about 1.2 μm, the sensor has a sensitivity of 4.42 pm/ppm and a good linearity and selectivity for H2S in the range of 0–60 ppm, and the limit of detection is 2.79 ppm. The response time and recovery time are approximately 31 and 48 s, respectively. The sensor has the advantages of small volume, low cost, simple structure, and easy manufacture and so on, which is suitable for on-line monitoring of H2S.
1 Introduction
Hydrogen sulfide (H2S) is a colourless, acidic and highly toxic gas. H2S gas not only seriously threatens human health, but also causes serious corrosion to metal equipment. The explosion limit of H2S is 4.3 %∼46 % [1]. It burns with a blue flame and produces sulphurdioxide gas, which is harmful to human eyes and lungs [2], [3]. In a low concentration H2S environment, local irritation of the eyes and respiratory tract is obvious. While in the high concentration environment, it manifests as symptoms of the central nervous system and asphyxia [4]. In order to avoid H2S poisoning, effective protective measures must be adopted, so the monitoring of trace H2S is very important. At present, the common methods for monitoring H2S gas are as follows: electrochemical analysis [5], gas chromatography [6], heater-type sensor [7]. However, some of them are expensive, and others are liable to cause secondary hazards because they are electrified. Therefore, a novel gas-detection method based on sensitive materials and optical fiber sensing is proposed in recent years [8], [9]. Among the sensitive materials, graphene oxide (GO) has excellent adsorption properties because of its large specific surface area and abundant oxygen-containing functional groups [10], [11], [12], [13], [14]. In optical fibre sensors, Mach–Zehnder interferometric (MZI) sensors have many applications in liquid refractive index, curvature, strain, temperature and gas sensing. Interestingly, by adjusting the parameters of the fusing machine, the fibre taper can be obtained by pushing or stretching the coupling point of the fibres, and then obtain the inter-mode interference. The single-mode fibres (SMFs) were fused at both ends of photonic crystal fibres (PCFs) and the formed fibre tapers between PCF and SMF, constructed MZI structure [15]. An all-fibre Mach–Zehnder high temperature and high sensitivity temperature sensor were produced based on two SMFs series connection with thick cones [16]. The SMF with tapered tapers was fused at both ends of the PCF, and H2S sensors were fabricated based on the graphene sensitive film on the PCF surface, and the sensitivity of the sensors was improved by depositing copper (Cu) nanoparticles on the graphene film [17]. Considering that Cu can enhance the adsorption of H2S [17], a novel optical fibre bitaper H2S sensor based on the Cu deposited GO was constructed in this work. Two enlarged bitapers of optical fibres were fabricated by three-segment SMF. The copper/graphene oxide (Cu/GO) composite sensitive film was coated on the SMF surface to make the interferometer sensitive to H2S. The concentration of H2S was measured by detecting the regular movement of interference trough. The sensitivity, selectivity and response-recovery characteristics of the sensor are also studied, and the results are discussed.
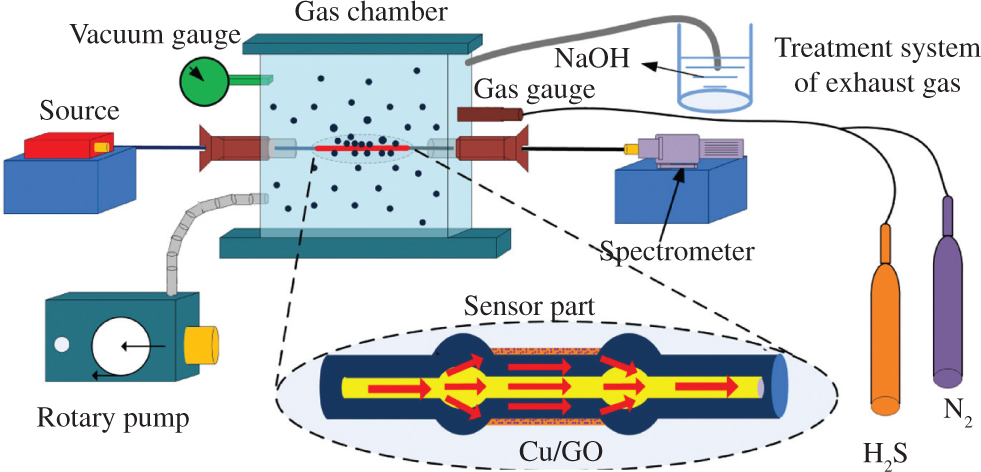
Schematic diagram of the experimental setup.
2 Theoretical Method
The experimental gas sensing setup is shown in Figure 1. The fibre optic sensor was fixed inside the gas chamber with the inlet and outlet of the gas. The rotary pump was used to evacuate the gas chamber, the nitrogen gas was used for purging the chamber to get the reference signal and NaOH was used to treat the exhaust gas of the chamber. The proposed structure of MZI gas sensor is shown in the inset of Figure 1, which consists of three SMFs and two enlarged fibre bitapers. Two segments of SMF are directly spliced to form enlarged bitaper, and the SMF in the middle of the bitapers is the sensing region. After the light in the core passes through the first fibre taper, one part enters the core and the other part enters the cladding. The core mode and different order cladding modes have different effective refractive indexes. Through the transmission of the light in the interference arm, the difference of the optical paths between the modes is emerged. When light propagates to the second fibre taper, the light of the fundamental mode and that of the cladding mode are coupled and the interference comes into being.
The intensity of output light of the MZI gas sensor can be expressed as [18],
where Icor and Icla are the intensities of the core and cladding modes, respectively. Δφ is the phase difference between core and cladding modes.
where λm is the monitoring wavelength, L is the length of the SMF sensing section, and
The length (L) of the sensing region is 50 mm. When the sensing film coated on the cladding surface absorbs the target gas, the refractive index of the film will change and then the effective refractive index of the cladding will also vary, while the refractive index of the core remains unchanged. Therefore, with the change of the effective refractive index of the cladding, the mth-order wavelength of the interference dip will shift [20]. The amount of variation of the mth-order wavelength of the interference dip can be expressed as,
From (4), when the effective refractive index of the cladding increases, the (
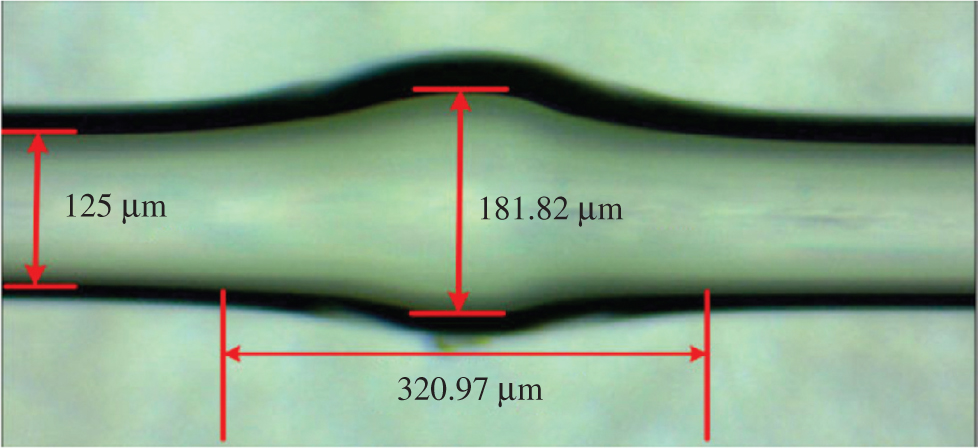
Diagram of spliced region.
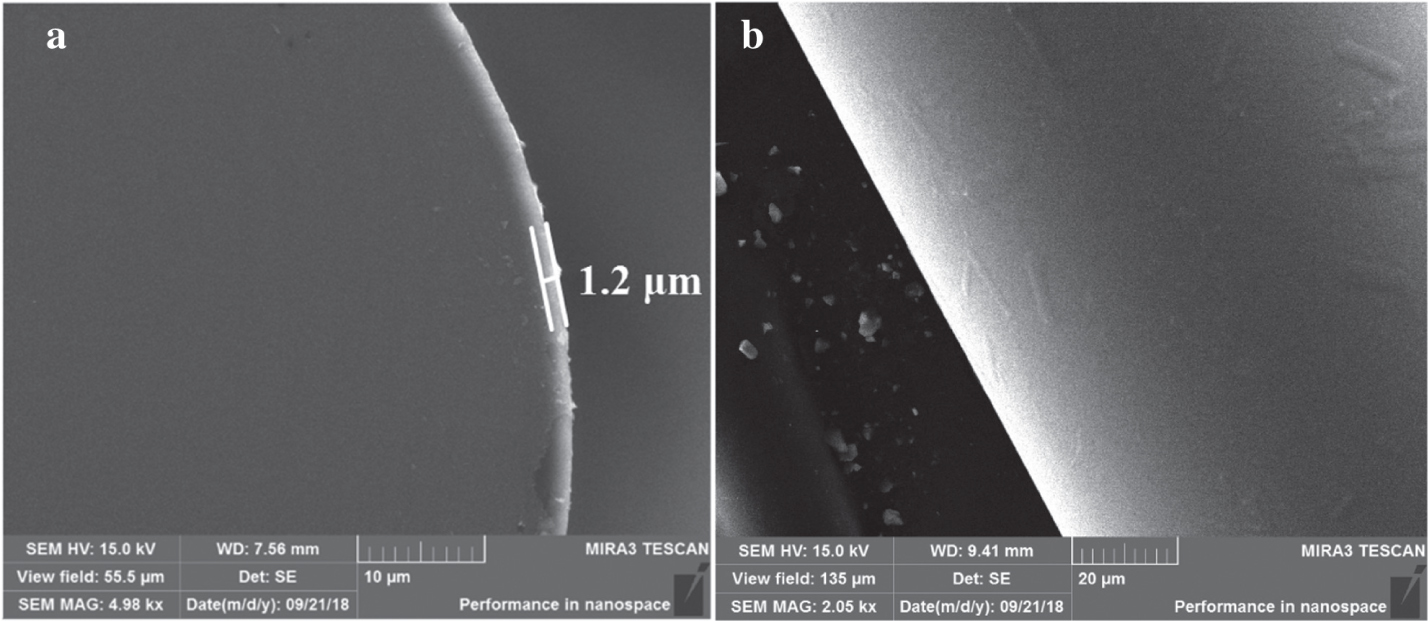
Scanning electron miscroscopy images of (a) the cross section and (b) the side surface of single-mode fibres after coating.
3 Experiment
3.1 Preparation of Bitapers
All the fibres used in this experiment are the standard SMFs (Thorlabs, Newton, NJ, USA) with a cladding diameter of 125 ± 0.7 μm and a core diameter of 10.4 ± 0.8 μm. ASE light source (C+L band, Kangguan, China), spectrum analyzer (AQ6370D, Yokogava, Shanghai, Japan), and the automatic optical fibre fusion machine (S178C, Furukawa, Tokyo, Japan) were used to evaluate the performance of sensors. The nano-copper (particle size of 10 nm, Aladdin, Shanghai, China), dispersion solution of graphene oxide (GO, 2 mg/ml, Nanjing Pioneer Nanometer, Nanjing, China) were also used with no further purification. The spliced procedure parameters are set as follows: first discharge start strength +100, first discharge end strength +100, second discharge start strength +40, second discharge end strength +40, clean discharge time of +200 ms, pre-fusion time of +260 ms, first discharge time of +1000 ms, second discharge time of +2000 ms, back start time of +1000 ms and advanced distance of +250 μm.
An enlarged fibre taper between two SMFs is shown in Figure 2. The length of the taper is about 320.97 μm, and the maximum diameter of the taper is about 181.82 μm. The experiment finds that the free spectrum range decreases and the interference fringes increase when the length of SMF sensing arm increases from 20 to 100 mm. Here, 50 mm sensing arm is taken because the interference spectrum period is obvious, and the fringe extinction ratio reaches more than 10 dB, which fully meets the measurement standard.
3.2 Preparation of Cu/GO Composite
The GO dispersions (1 mg/ml) were prepared by Hummer method [21]. Some 4 ml nano-Cu (3.2 g/l, 10 nm) were dispersed in 20 ml GO dispersions with ultrasound. The temperature of the ultrasonic process was controlled below 4 °C for 30 min. Ultrasound process is sealed and kept away from light.
3.3 Fabrication of the Sensor
The SMF of 70 mm was sheared with stripping plier and the coating was removed and cleaned with ethanol. The sheared SMF was dipped in the Cu/GO solution for 10 min. Cu/GO coated optical fibre was put into the refrigerator for 30 min to freeze the sensing film. Then it was dried for 26 h by the freeze-dryer (FD-1C-50, Shanghai Bilang Instruments Co., Ltd.). The tapers were formed by two times of optical fibre fusion, and the sensing element was obtained.
4 Results and Discussion
4.1 Scanning Electron Microscopy Analysis
An SEM image of the cross-section of SMF is shown in Figure 3a. The thickness of the composite film is about 1.2 μm. From Figure 3b, it can be seen clearly that a uniform Cu/GO sensing film is successfully coated on the surface of the optical fibre.
4.2 Raman Spectrum of Cu/GO
Raman spectroscopy is one of the effective ways to characterise carbon (C) nanomaterials. The Raman D and G peaks of GO are at 1338 and 1583 cm−1, respectively (Fig. 4). The D peak represents the defects and amorphous structure at the edge of GO, and the G peak represents the ordered sp2 bond. The calculated intensity ratio ID/IG = 1.01, which indicates that the sensing film is multilayer GO [22].
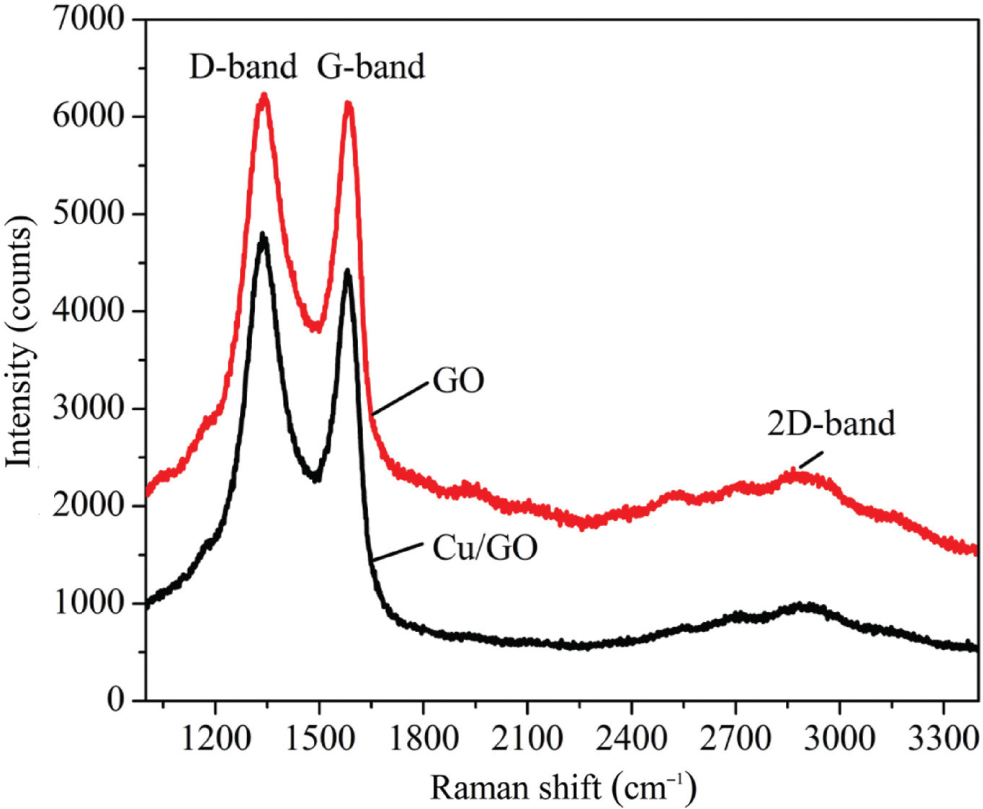
Raman spectra of graphene oxide (GO).
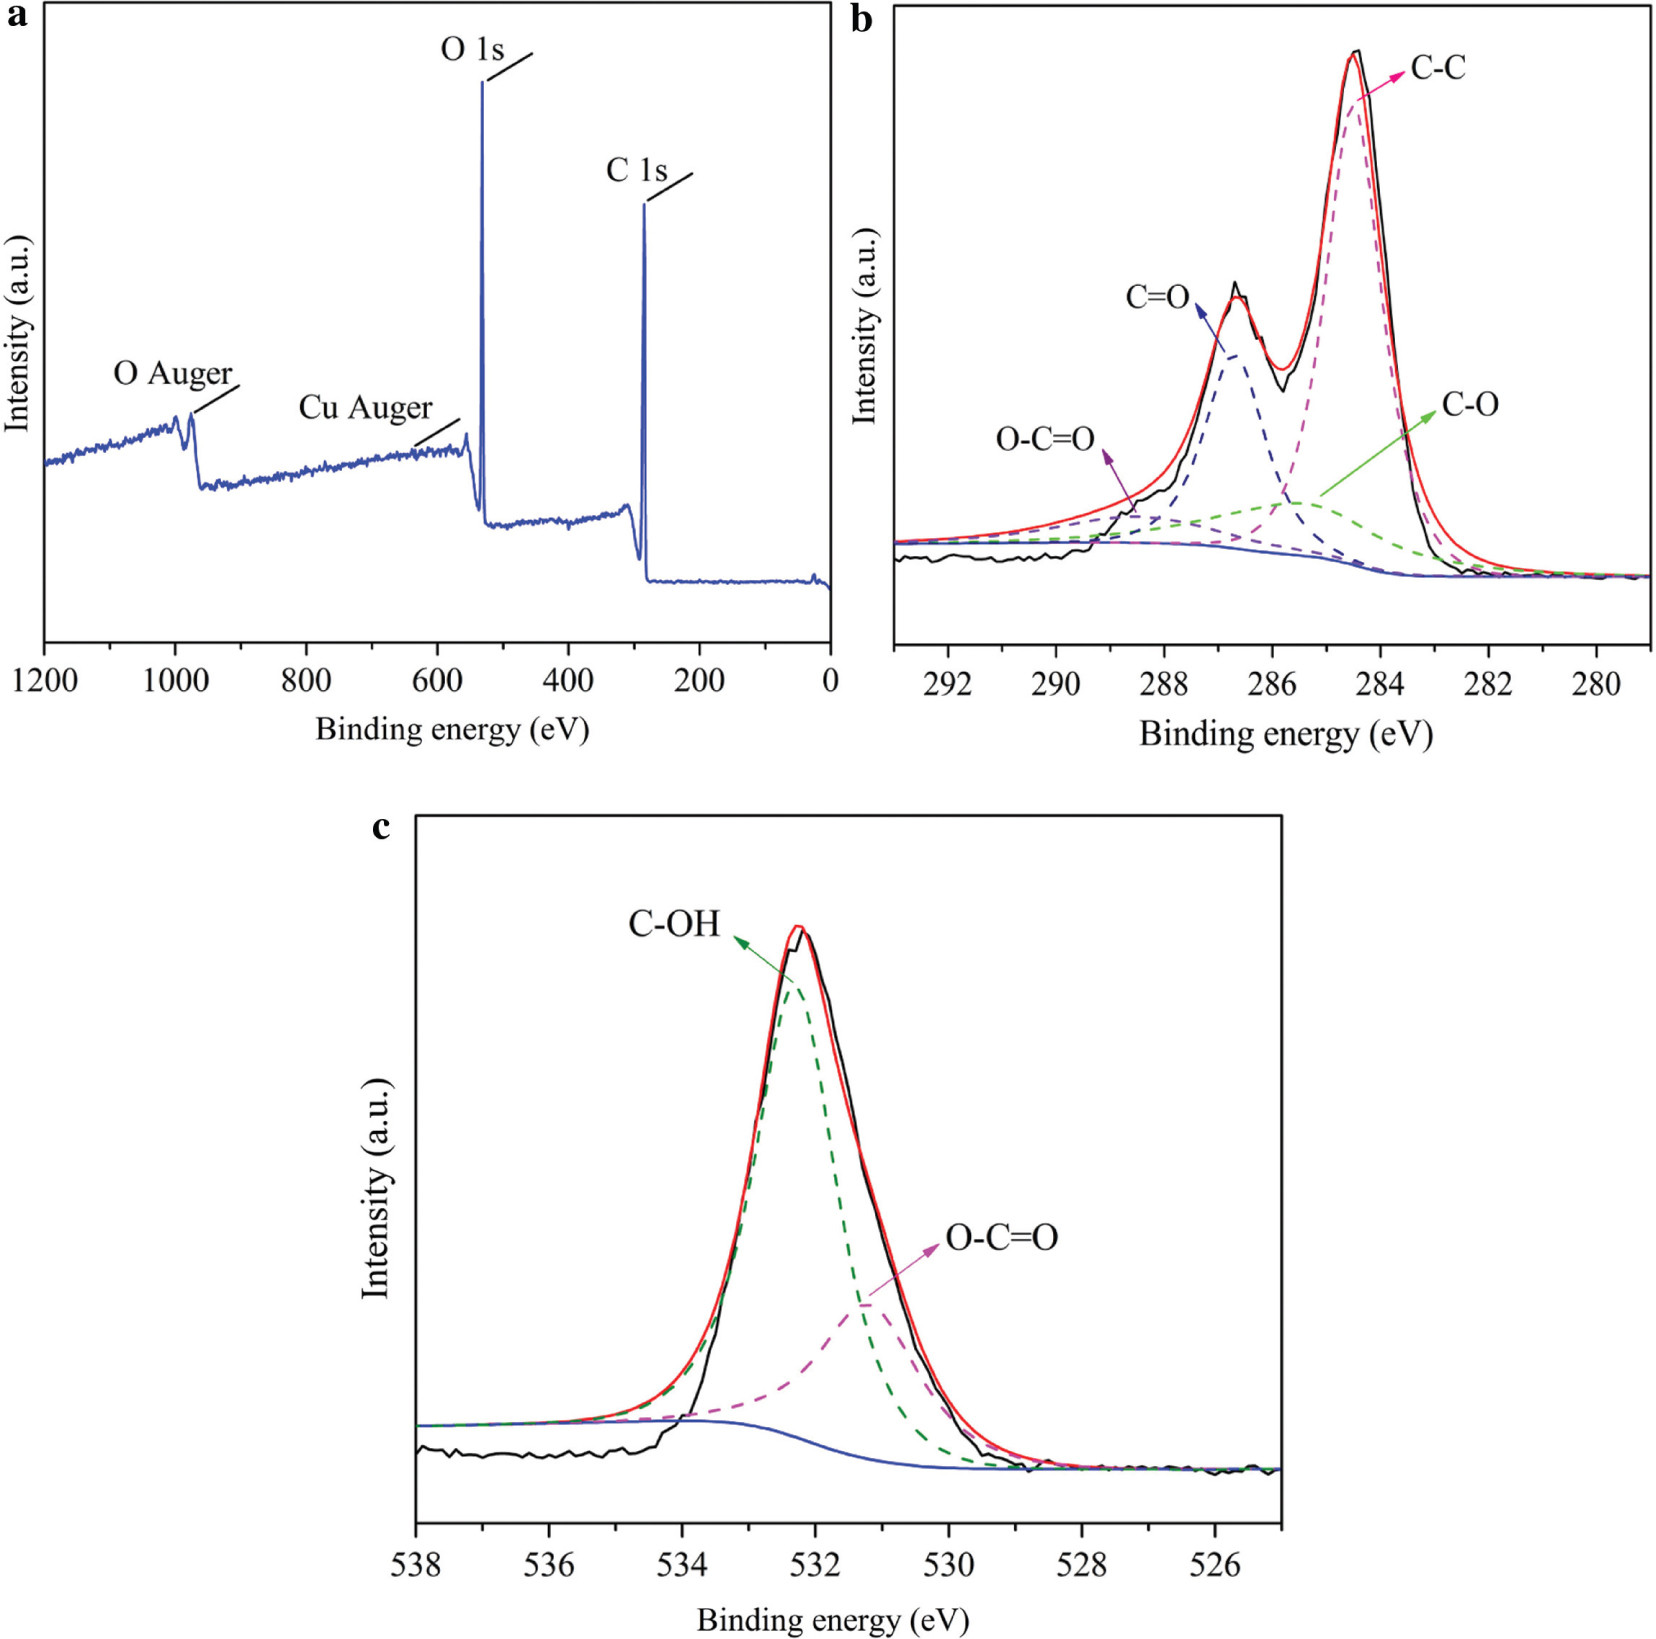
(a) X-ray photoelectronspectroscopy (XPS) image of copper/graphene oxide (Cu/GO) membrane, (b) high-resolution XPS scan of the C 1s, (c) high-resolution XPS scan of the O1s.
4.3 X-ray Photoelectron Spectroscopy (XPS) Analysis
The XPS of the Cu/GO composite is shown in Figure 5a. It can be found that the composite film contains only C, O and Cu elements, no other elements are detected. C 1s, O 1s, Cu Auger and O Auger are 284, 532, 647.5 and 974.3 eV, respectively. Figure 5b is the C 1s spectra of GO, it consists of four parts: C–C of 284.1 eV, C–O of 286.2 eV, C=O of 287.5 eV and O–C=O of 289.0 eV. Figure 5c is the O 1s spectrum of GO. 531.1 and 532.4 eV are corresponding to the O–C=O and C–OH, respectively. XPS results indicate that GO contains hydroxyl, epoxy, carbonyl and carboxyl groups.
4.4 Gas Sensitivity
The H2S gases of 5, 10, 20, 30, 40, 50 and 60 ppm are prepared respectively. The prepared MZI gas sensor is used to measure different concentrations of H2S. The transmission spectra without target gas are show in Figure 6a.
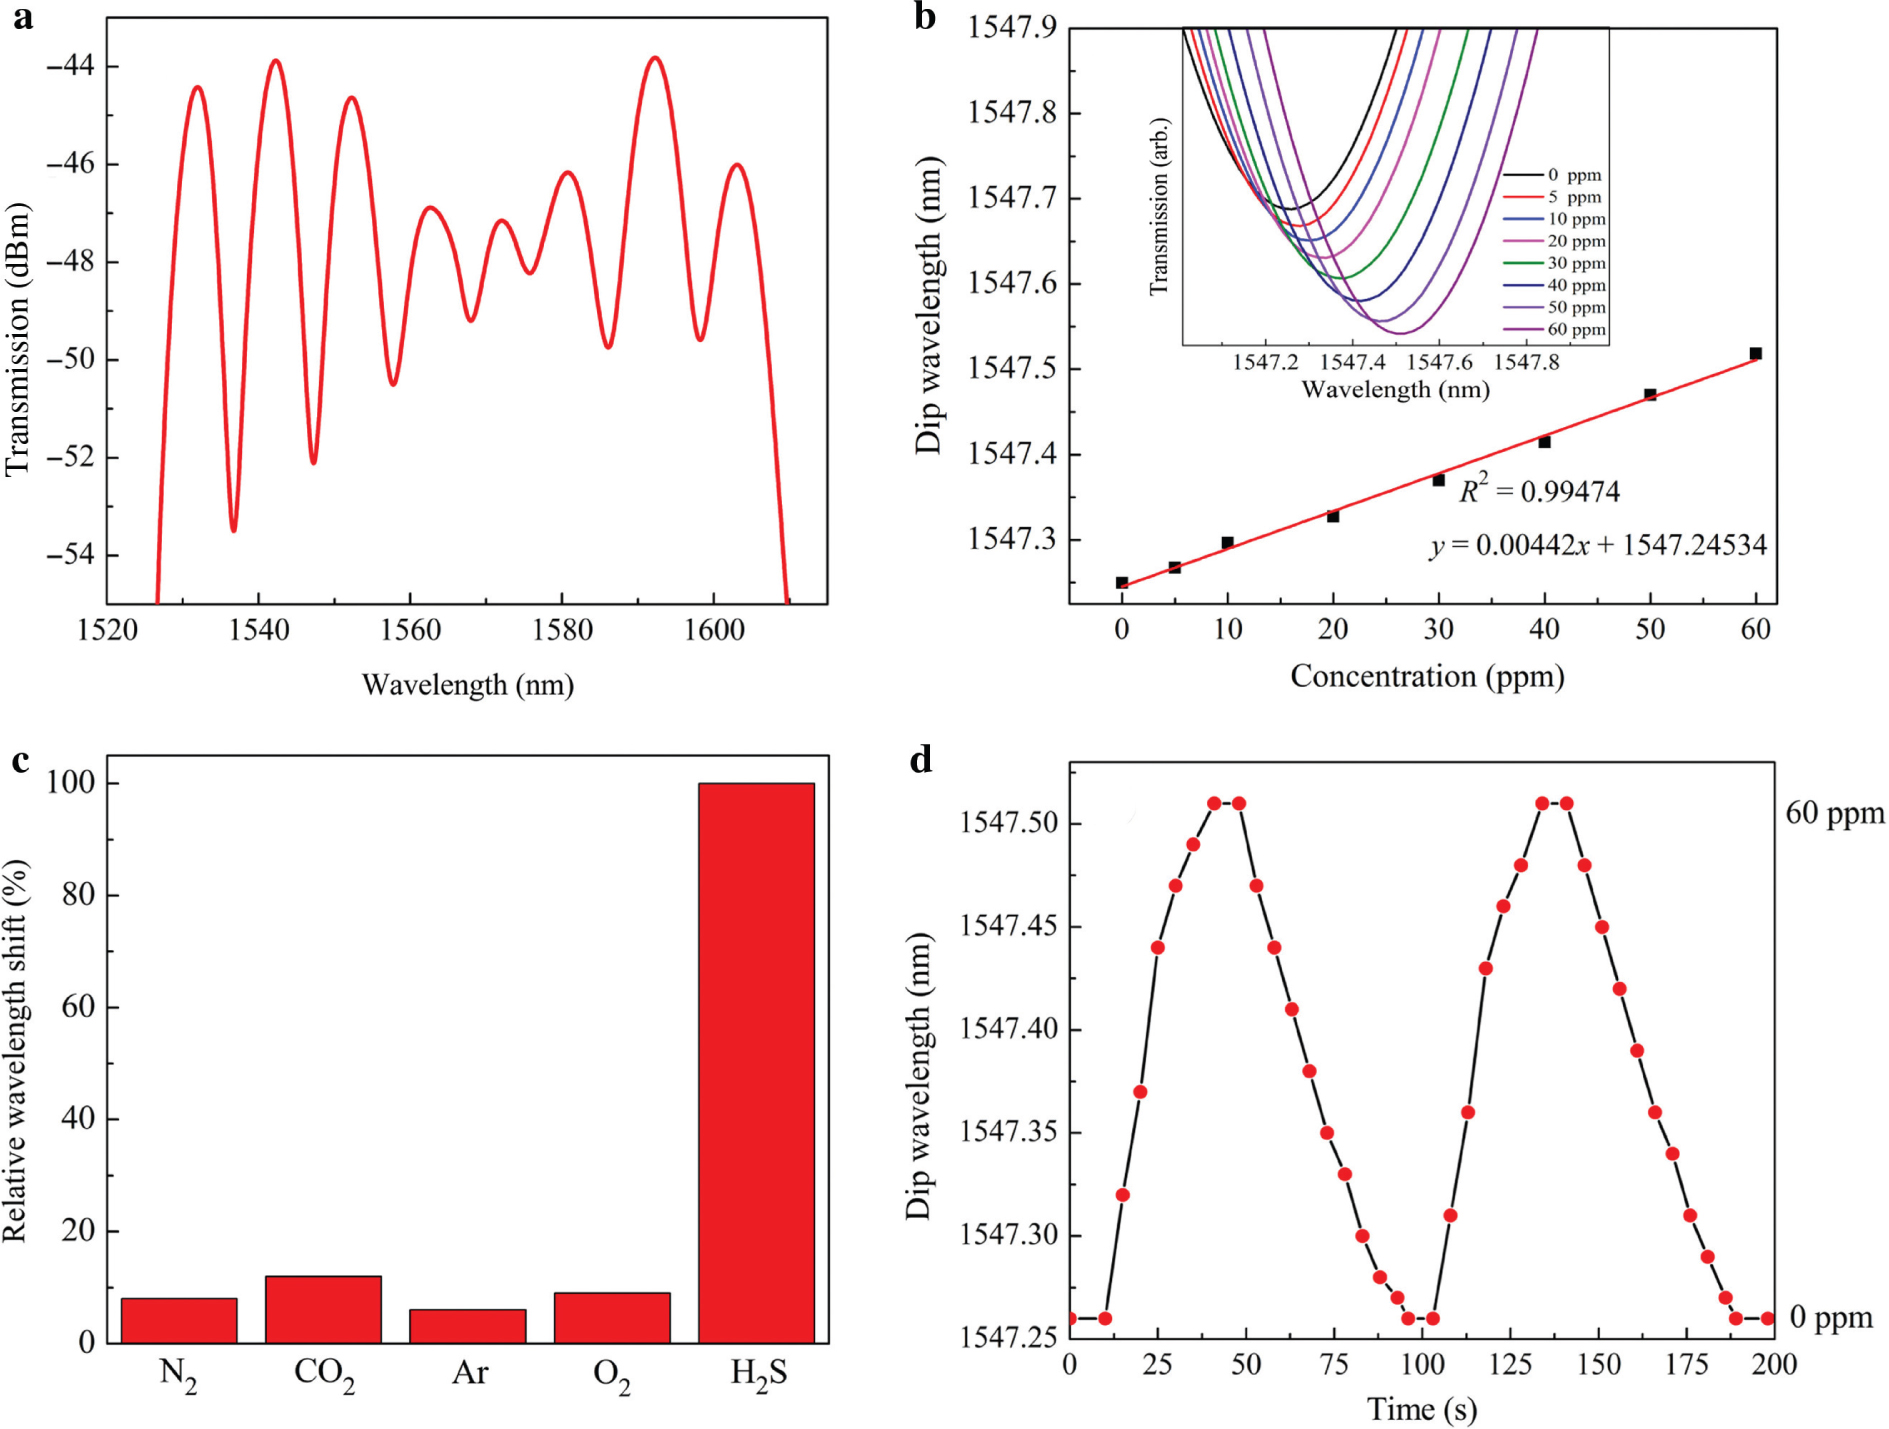
(a) Transmission spectra of Mach–Zehnder interferometer coated with Cu/GO film. (b) Wavelength shift upon the concentration of hydrogen sulfide (H2S) and spectral response of the sensor in various concentrations of H2S. (c) The values of selectivity for nitrogen, carbon dioxide, argon, oxygen and H2S. (d) Dynamic responses of H2S gas sensor.
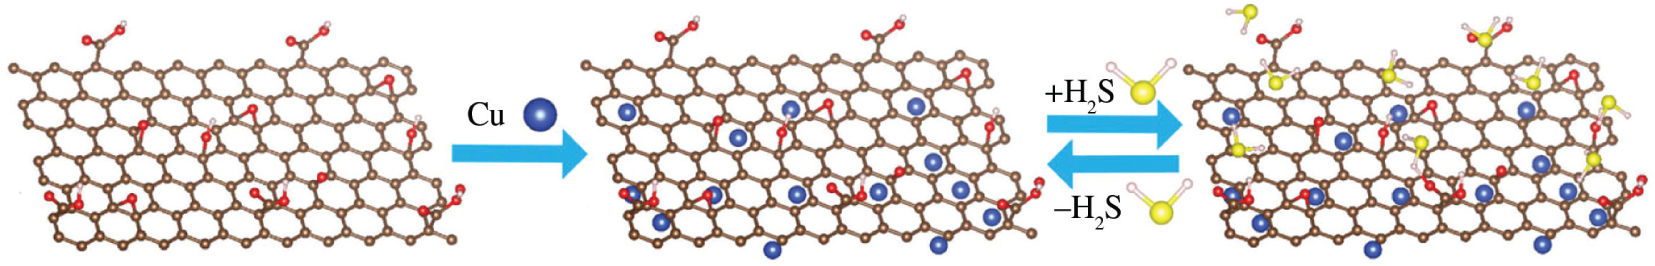
Schematic diagram of sensing mechanism.
The dip wavelength at 1547 nm was selected as the monitoring site, and the deviation of the dip was observed in the range of 0–60 ppm H2S gas concentration. As shown in Figure 6b, with the increase of H2S concentration, the transmission spectra show obvious red shift. The film in the sensing region adsorbs H2S gas molecules, reduces the refractive index of the cladding and increases the difference between the effective refractive indices of the core and the cladding, and makes the central wavelength red shift, which is consistent with the analysis of (4). In the range of 0–60 ppm H2S gas concentration, the offsets around 1547 nm at the different gas concentrations are linearly fitted. The linearity is 0.99474, and the sensitivity of the sensor is 4.42 pm/ppm. The detection limit (LOD) of the sensor can be calculated according to the method in literature [23], [24], that is LOD = 3σ/K, in which σ (0.00411 nm) is the standard deviation for the wavelength of sensing system in the absence of H2S and K (0.00442 nm/ppm) represents the slope of the fitting curve, and the LOD of this sensor (2.79 ppm) is obtained. Figure 6c is the gas selectivity of the sensor. It has high selectivity for H2S by immersing N2, CO2, Ar, O2 and H2S with the same concentration. Figure 6d is the recovery-response time curve of the sensor. Its response and recovery time are about 31 and about 48 s, respectively.
The schematic diagram of H2S sensing mechanism is given in Figure 7. As seen in Figure 7, Cu nanoparticles are entrapped into the GO matrix. The first interaction between sensitive film and the analyte (here, H2S gas) occurs on the GO matrix. The oxygen-containing groups, such as carboxyl and hydroxyl groups, and the defective sites of GO, can be the adsorption sites for H2S molecules [25], which will increase the refractive index of Cu/GO and then the wavelength will be red shift in the spectra. Moreover, Cu nanoparticles can enhance the adsorption properties of sensitive membranes to H2S molecules. The reason is that Cu nanoparticles readily donate electron to GO and form Cu+ or Cu2+, and the Cu ions bind H2S gas easily and produce Cu2S or CuS [see (5)], this reaction also increases the refractive index and enhances the wavelength red shift [7].
5 Conclusion
A H2S Mach–Zehnder gas sensor with two waist-enlarged tapers based on Cu/GO composite membrane was proposed. The experimental results indicate that the interference dips show a red shift with the increase of H2S concentration in the range of 0–60 ppm. The sensitivity of the sensor is 4.42 pm/ppm, and the LOD of this sensor is 2.79 ppm. The response time and recovery time are about 31 and 48 s, respectively. There is a good linear relationship between H2S concentration and wavelength shift, and the high selectivity for H2S is achieved. The sensitive mechanism is proposed and analysed in detail. The sensor has the advantages of low cost, small size, simple structure and easy preparation. It has a potential application for H2S low concentration measurement in production environments.
6 Highlights
Cu/GO composite film-coated tapered SMF interferometer was proposed.
The interference spectra appear red shift with the increasing H2S concentration.
A high linearity of 0.99474 and a good selectivity are obtained.
Calculated the LOD of this sensor is as low as 2.79 ppm.
These highlights are new and were not reported in previous papers.
Funding source: National Natural Science Foundation of China
Award Identifier / Grant number: 51574054
Funding statement: The National Natural Science Foundation of China (51574054), the University Innovation Team Building Program of Chongqing (CXTDX201601030), the Livelihood and National Natural Science Foundations of Chongqing Science and Technology Bureau (cstc2017shmsA20017, cstc2018jcyjAX0294), the Postgraduate Research Innovation Project of CQUT (ycx2018258), the Scientific and Technological Research Program of Chongqing Municipal Education Commission (KJ1600913), Chongqing Banan District Science and Technology Project (2018TJ12), the Innovation Leader Project of Chongqing Science and Technology Bureau (CSTCCXLJRC201905).
References
[1] K. H. Kilburn and R. H. Warshaw, Toxicol. Ind. Health 11, 185 (1995).10.1177/074823379501100206Suche in Google Scholar PubMed
[2] R. J. Reiffenstein, W. C. Hulbert, and S. H. Roth, Annu. Rev. 32, 109 (1992).10.1146/annurev.pa.32.040192.000545Suche in Google Scholar
[3] S. L. M. Rubright, L. L. Pearce, and J. Peterson, Nitric Oxide 71, 1 (2017).10.1016/j.niox.2017.09.011Suche in Google Scholar PubMed PubMed Central
[4] B. Crook, S. Stagg, A. Bowry, and G. Frost, Sci. Total Environ. 609, 1381 (2017).10.1016/j.scitotenv.2017.08.014Suche in Google Scholar PubMed
[5] B. J. Polk, J. Chem. Educ. 77, 1049 (2000).10.1021/ed077p1049Suche in Google Scholar
[6] V. Vitvitsky and R. Banerjee, Method. Enzymol. 13, 111 (2015).10.1016/bs.mie.2014.11.013Suche in Google Scholar PubMed PubMed Central
[7] M. Mirmotallebi, A. Irajizad, Z. S. Hosseini, and E. Jokar, J. Alloy Compound 740, 1024 (2018).10.1016/j.jallcom.2018.01.041Suche in Google Scholar
[8] A. Barrias, J. R. Casas, and S. Villalba, Sensors 16, 748 (2016).10.3390/s16050748Suche in Google Scholar PubMed PubMed Central
[9] O. Yaghobi and H. Karimi-Alavijeh, IEEE Sens. J. 19, 1788 (2018).10.1109/JSEN.2018.2882561Suche in Google Scholar
[10] H. K. Lee, J. Lee, N. J. Choi, S. E. Moon, H. Lee, et al., Procedia. Eng. 25, 892 (2011).10.1016/j.proeng.2011.12.219Suche in Google Scholar
[11] K. Toda, R. Furue, and S. Hayami, Anal. Chim. Acta 878, 43 (2015).10.1016/j.aca.2015.02.002Suche in Google Scholar PubMed
[12] L. Wang, Y. Ye, Y. Shen, F. Wang, X. Lu, et al., Sens. Actuat. B: Chem. 203, 864 (2014).10.1016/j.snb.2014.07.054Suche in Google Scholar
[13] M. S. Park, K. H. Kim, M. J. Kim, and Y. S. Lee, Colloid Surface A 490, 104 (2016).10.1016/j.colsurfa.2015.11.028Suche in Google Scholar
[14] S. D. Liu, X. Z. Yang, and W. L. Feng, Appl. Opt. 58, 2152 (2019).10.1364/AO.58.002152Suche in Google Scholar PubMed
[15] F. D. Yu, P. Xue, X. W. Zhao, and J. Zheng, IEEE Sens. J. 19, 950 (2019).10.1109/JSEN.2018.2880265Suche in Google Scholar
[16] N. Zhao, H. Fu, M. Shao, H. Li, Y. Liu, et al., Spectrosc. Spect. Anal. 34, 1722 (2014).Suche in Google Scholar
[17] X. Feng, W. Feng, C. Tao, D. Deng, X. Qin, et al., Sens. Actuat. B: Chem. 247, 540 (2017).10.1016/j.snb.2017.03.070Suche in Google Scholar
[18] X. Feng, X. Yang, G. Huang, D. Deng, X. Qin, et al., Acta Photonica Sinica 46, 0923002 (1817).10.3788/gzxb20174609.0923002Suche in Google Scholar
[19] Q. Wang, L. Kong, Y. Dang, F. Xia, Y. Zhang, et al., Sens. Actuat. B: Chem. 225, 213 (2016).10.1016/j.snb.2015.11.047Suche in Google Scholar
[20] Q. Wang and Y. Liu, Opt. Fiber Technol. 43, 1 (2018).10.1016/j.yofte.2018.03.010Suche in Google Scholar
[21] J. Guerrero-Contreras and F. Caballero-Briones. Mater. Chem. Phys. 153, 209 (2015).10.1016/j.matchemphys.2015.01.005Suche in Google Scholar
[22] M. Divagar, A. Gowri, S. John, and V. V. R. Sai, Sens. Actuat. B: Chem. 262, 1006 (2018).10.1016/j.snb.2018.02.059Suche in Google Scholar
[23] X. Ding, L. Qu, R. Yang, Y. Zhou, and J. Li, Luminescence 30, 465 (2015).10.1002/bio.2761Suche in Google Scholar PubMed
[24] A. S. Emrani, N. M. Danesh, P. Lavaee, M. Ramezani, K. Abnous, et al., Food Chem. 190, 115 (2016).10.1016/j.foodchem.2015.05.079Suche in Google Scholar PubMed
[25] E. Llobet, J. Brunet, A. Pauly, A. Ndiaye, and C. Varenne, Sensors 17, 391 (2017).10.3390/s17020391Suche in Google Scholar PubMed PubMed Central
©2019 Walter de Gruyter GmbH, Berlin/Boston
Artikel in diesem Heft
- Frontmatter
- Solid State Physics & Materials Science
- Electronic and Optical Properties of Cubic Perovskites CsPbCl3−yIy (y = 0, 1, 2, 3)
- Effect of Indium Doping on Optical Parameter Properties of Sol–Gel-Derived ZnO Thin Films
- Electrical Conductivity of Zirconium Tetrachloride Solutions in Molten Sodium, Potassium and Cesium Chlorides
- Hydrogen Sulfide Gas Sensor Based on Copper/Graphene Oxide Composite Film-Coated Tapered Single-Mode Fibre Interferometer
- Dynamical Systems & Nonlinear Phenomena
- Detecting the Flow Pattern Transition in the Gas-Liquid Two-Phase Flow Using Multivariate Multi-Scale Entropy Analysis
- Rapid Communication
- Simplistic Synthesis and Enhanced Photocatalytic Performance of Spherical ZnO Nanoparticles Prepared from Arabinose Solution
- The Deflection of Rotating Composite Tapered Beams with an Elastically Restrained Root in Hygrothermal Environment
- Effect of Dust Ion Collision on Dust Ion Acoustic Solitary Waves for Nonextensive Plasmas in the Framework of Damped Korteweg–de Vries–Burgers Equation
- Hydrodynamics
- Lie Symmetries and Similarity Solutions for Rotating Shallow Water
- A Note on the Significance of Quartic Autocatalysis Chemical Reaction on the Motion of Air Conveying Dust Particles