Activation of Small Organic Molecules on Ti2+-Rich TiO2 Surfaces: Deoxygenation vs. C–C Coupling
-
Jessica Kräuter


Abstract
Rutile TiO2 is an important model system for understanding the adsorption and conversion of molecules on transition metal oxide catalysts. In the last decades, point defects, such as oxygen vacancies and Ti3+ interstitials, exhibited an important influence on the reaction of oxygen and oxygen-containing molecules on titania surfaces. In brief, partially reduced TiO2 containing a significant amount of Ti3+ is often more active for the conversion of such molecules. In this study, we investigate an even higher reduced surface prepared by argon ion bombardment of a rutile TiO2 (110) single crystal. By X-ray photoelectron spectroscopy we show that, besides Ti4+, this surface is almost equally dominated by Ti3+ and Ti2+. To probe the reactivity of these highly reduced surfaces, we have adsorbed two different classes of oxygen-containing molecules and utilized temperature programmed reaction spectroscopy to investigate the conversion. While alcohols (in this case methanol) already show a defect-dependent partial conversion in a deoxygenation reaction on the (stochiometric or slightly reduced) rutile TiO2 (110) surface, ketones (e.g. acetone) are usually not converted on the rutile TiO2 (110) surface independent on the bulk defect density. Here, we present a nearly full conversion for both molecules via deoxygenation reactions and reductive C–C coupling, forming different hydrocarbons at different temperatures between 375 K and 640 K on the sputtered Ti2+ rich surface.
1 Introduction
In chemical industry, olefins like ethene and propene are important base chemicals for producing polymers, such as polyethylene (PE), polyethylene terephthalate (PET) and polypropylene (PP) [1], [2], [3], [4]. Nowadays, olefins can be obtained from different cracking processes as well as by metathesis, for example of ethene and 2-butene [5], [6]. In the cracking processes, long-chained hydrocarbons from crude oils are decomposed into small chained hydrocarbons like ethene and propene [7]. As there is a finite amount of fossil fuels on earth, alternative ways for the production of olefins are needed.
A good candidate for that comprises the synthesis involving bio alcohols using heterogeneous catalysis. The transition metal oxide TiO2 is particularly interesting because of its unique properties. The most stable modification rutile combines the advantages of low cost, low toxicity and the possibility for tuning its band gap by doping, so that photocatalytic reactions under visible light or solar irradiation become possible [8], [9]. Therefore, TiO2 is already used in industry as a photocatalyst for the degradation of volatile organic compounds (VOCs), which are generated as waste products in many different processes [10]. The rutile TiO2 (110) surface being the thermodynamically most stable surface is probably the most studied model system in the last decades [8], [9], [11]. It has not only been investigated as support material but also as a distinct catalyst [9], [12], [13], [14], [15], [16]. Previous studies regarding the adsorption and reaction of several classes of organic molecules helped to gain a detailed understanding of the occurring processes on the rutile TiO2 (110) surface as a model catalyst [17], [18]. Commonly, rutile surfaces are already partially reduced by typical preparation methods in UHV. For example, the preferential removal of oxygen via argon ion bombardment leads to a strong reduction of the titanium centers as we show in the following. Annealing at elevated temperatures induces the reoxidation of the surface and the diffusion of reduced titanium centers into the bulk [19]. Therefore, typical rutile TiO2 (110) samples contain a certain amount of bridging oxygen vacancies (BOV) as the main surface defects and titanium interstitials (Ti3+Int) as can be seen from the blue color caused by Ti3+ centers [20].
In the last decade, experimental and theoretical studies from different groups [20], [21], [22], [23], [24], [25], [26], [27], including previous work from our group [15], [16], reported that these point defects can contribute to chemical reactions and change the selectivity dramatically. Hydrocarbons, such as alkanes, alkenes and alkynes, desorb intact without any product formation. However, especially for alkanes, the desorption temperature rises with increasing length of the linear carbon chain, as shown by Dohnálek et al. [18], [28].
In contrast, alcohols [16], [27], [29], [30], [31], [32], [33], [34], [35], [36] and aldehydes [15], [37], [38], [39], [40], [41] can be activated on a partially reduced rutile TiO2 (110) surface in a deoxygenation reaction, forming hydrocarbons in most cases. Primary, secondary and tertiary alcohols as well as different polyols can be converted via a low and a high temperature deoxygenation, forming alkanes and alkenes depending on the properties of the adsorbed alcohol [12], [31], [42], [43], [44], [45]. We have shown for the simplest alcohol methanol, that the formation of methane is drastically enhanced for higher defect density in the titania bulk crystal [16]. In accordance with other studies based on static secondary ion mass spectrometry, high-resolution electron energy loss spectroscopy and infrared spectroscopy, the alkoxy species is the dominant precursor for this reaction [16], [26]. In the presence of oxygen, the partial oxidation forming aldehydes is enabled, which is also more pronounced for higher defect densities [16], [26], [36], [44], [45]. Whereas, the adsorption of aldehydes leads to reductive coupling, where the yield of the reductive coupling product is increasing with an increasing amount of defects [15], [46], [47]. In contrast to alcohols and aldehydes, it is not possible to convert ketones on a reduced rutile TiO2 (110) surface. However, different intermediates can be observed by polarized Fourier-Transform infrared reflexion absorption spectroscopy (FT-IRRAS) with increasing amount of defects [48], [49], [50].
The described defects and the further reduced Ti centers like Ti2+ cannot only be generated under UHV conditions but also under ambient conditions in air. Lately, it has been shown that titania nanocrystals can be treated in different ways to form reduced species. One way to produce such defects is to treat titania nanomaterials under reductive conditions, such as hydrogen atmosphere and high temperatures or sodium borohydride (NaBH4) [51], [52], [53]. A more interesting technical application is the (re)-generation of reduced Ti species in the presence of metal cocatalysts like platinum or aluminum. Here, in particular, the coexistence of aluminum has been reported to form highly reactive and stabile Ti2+ species at the Al-TiO2 interface after annealing at 673 K and additional exposure to solar radiation. After the reaction, the catalyst can easily be regenerated by repeating the annealing and irradiation step. These catalysts were already tested in different photocatalytic reactions, such as the reduction of nitrates from waste water or hydrogen evolution from pure water [54], [55], [56].
In brief, the activation and reaction of organic molecules is generally enhanced for partially reduced titania, especially by Ti3+ interstitials and oxygen vacancies. To study the reactivity of even more reduced titanium centers, such as Ti2+, a rutile TiO2 (110) surface was prepared by argon ion bombardment without thermal reoxidation, leading to a highly reduced surface. We compare the adsorption and conversion of two different organic oxygenates on the sputtered surface by means of temperature programmed reaction spectroscopy (TPRS). First, the reaction of methanol was investigated, which exhibited already different reaction pathways on a partially reduced rutile TiO2 (110) surface as pointed out in the previous paragraph. We also discuss acetone as a second probe molecule, which was nonreactive on a common rutile TiO2 (110) surface. Moreover, we present insights into the change of this Ti2+-rich surface during the conversion of acetone via the deoxygenation and reductive coupling pathways based on X-ray photoelectron spectroscopy (XPS) and low energy electron diffraction (LEED).
2 Experimental Section
All experiments were carried out on a rutile TiO2 single crystal (110) surface of a 1 mm thick bulk crystal (10 × 10 mm, SurfaceNet GmbH). Clean surfaces were prepared by alternating cycles of argon ion bombardment (300 K, 1 keV) and subsequent annealing in UHV (880 K for 20 min). The detailed ion bombardment conditions were 5 × 10⁻⁵ mbar Argon (99.999 %), leading to a sputtering current of 2 μA/cm2 for the LEED and TPRS experiments. This treatment regularly leads to clean (1×1) (110) surfaces [15], [16], [57]. All temperatures were measured using K-type thermocouples (CHAL-005, Omega Engineering), which were either glued into the crystal or next to it using a UHV compatible ceramic glue (Ceramabond 569, Aremco). For annealing, the given temperatures were kept for at least 15 min to eliminate temperature inhomogeneities. The surface quality was checked frequently with XPS and LEED throughout the experiments as far as possible.
For the LEED and TPRS experiments, a UHV system (base pressure <10−10 mbar), including a home-built sample holder, was used as described elsewhere [15], [16]. In brief, the chamber was equipped with an argon ion source, a commercial LEED diffractometer (OCI Vacuum Microengineering, BDL800IR-LMX-ISIJ), a quadrupole mass spectrometer fitted for TPRS (Pfeiffer Vacuum Prisma TM QMA 200), a gas system for chamber backfilling via a leak valve and a directional pinhole dosing system for organic compounds [here acetone (>99.5 %) and methanol (99.9 %)]. The acetone and methanol were purified by several (at least five) freeze-pump-thaw cycles before use. The adsorption of acetone and methanol was carried out at a sample temperature of 110 K with a pressure of 5 × 10⁻² mbar behind the pinhole. No significant background pressure increase was observed during the adsorption of molecules via the pinhole doser. All TPR spectra were recorded using a temperature slope of 2 K/s. The LEED patterns were obtained at an electron beam energy of 100.5 eV.
The XPS experiments were conducted at a Thermo Fisher ESCALAB 250Xi (base pressure <5 × 10⁻¹⁰ mbar) using monochromatic Al Kα radiation and an argon-assisted charge compensation. The detailed parameters for the measurements can be found in the Supplementary information (Tab. S1). All spectra were calibrated to the main O1s signal at 530.4 eV [19]. The quantification was done using the sensitivity coefficients for Al Kα radiation and an electron emission angle of 90° (perpendicular to the surface) [58]. For the study of the conversion of acetone on the sputtered surface by XPS a saturation dose (backfilling >10−6 mbar acetone for 180 s at room temperature) was used.
3 Results
In this study, we investigate sputtered, surfaces that are easily accessible by argon ion bombardment. However, highly reduced substrates are also available by other methods under reducing conditions [57], [59], [60], [61], [62]. In the following, we shall first discuss the chemical composition of such surfaces by means of X-ray photoelectron spectroscopy. In a second step, we present the activation of small organic molecules, such as methanol or acetone, on the sputtered and therefore unordered rutile surface and demonstrate the deoxygenation reaction forming hydrocarbons and reductive coupling products monitored by TPRS. Moreover, the reorganization of the (110) (1×1) surface during this reaction is followed by a combined LEED, XPS and TPRS study.
3.1 Thermal Stability of Sputtered Titania Surfaces: Reoxidation and Restructuring
Argon ion bombardment is a common technique that may lead to a reduction of transition metal oxides for model studies [9], [14], [63]. As the sputter yield is highly sensitive to the atomic weight, the removal of oxygen from the surface is much more efficient than for the metal ions. Therefore, the increased amount of oxygen vacancies leads to a reduction of the remaining metal ions as oxygen desorbs neutrally and two electrons are transferred to the remaining metal ions for each vacancy [64]. In Figure 1 the Ti2p (a), O1s (b) and valence band (c) photoelectron spectra of a clean rutile TiO2 (110) (1×1) surface (top lines) and of the same surface after 20 min of argon ion bombardment (bottom lines) is shown. The deconvolution of the Ti2p3/2 and the O1s peak is exemplarily labeled as dotted, colored lines. The Ti2p signal of the pristine surface exhibits two spin-orbit split signals (Ti2p1/2 and Ti2p3/2) for each chemical species. Therefore, we observe two doublets, each corresponding to the regular Ti4+ (Ti2p3/2 at 459.1 eV, red line) as well as the Ti3+ (Ti2p3/2 at 457.8 eV, green line) from the defects.

The X-ray photoelectron spectra (XPS) of a rutile TiO2 (110) single crystal after 20 min of argon ion bombardment (bottom lines) (excitation with monochromatic Al Kα radiation), sputtered at 300 K with a sputtering current of 2 μA/cm2 (top lines) and subsequent annealing at 873 K for 15 min. (a) Ti2p region, the deconvolution of the Ti2p3/2 signals for the three chemical species is shown. (b) O1s region, again with exemplary deconvolution for the three species. (c) Valence band spectra showing the increased in-band-gap density of states for the sample after sputtering.
To make the argumentation clearer, we will focus on the Ti2p3/2 signal in the following, because no new information is gained from the Ti2p1/2 signal. The defect density can easily be determined by signal fitting and integration. However, one should keep in mind that XPS has a certain information depth (in this case, around 2 nm) and is not exclusively sensitive to the very first atomic layer, but to the topmost ones. Therefore, deviations typically occur between the defect density obtained from XPS and usual titration-desorption experiments (for instance using water [42], carbon monoxide [65] or oxygen [22], [23], [66]) or quantitative scanning tunneling microscopy (STM) results [20]. Argon ion sputtering induces a dramatic change to the Ti2p spectra (Fig. 1a). A new chemical species arises at 455.1 eV (Ti2p3/2, blue line [≈36 % of the total Ti content]). In accordance with an earlier publication [63], we attribute this signal to Ti2+ species. The two other signals are significantly broadened and shifted to lower BE values (Ti2p3/2 for Ti4+ at 458.7 eV (33 % of the total Ti content) and for Ti3+ at 457.0 eV (31 % of total Ti). The signal broadening indicates that the surface is not only reduced but also less ordered.
Considering the three different Ti oxidation states, the stoichiometry of the surface can also be estimated to be approximately TiO1.5. We shall show at a later point, that the roughness and the absence of long-range order needs to be considered for the detailed quantification of sputtered surfaces. Annealing at 873 K for several minutes changes the Ti2p spectrum significantly. Here, the signal attributed to Ti2+ species completely vanished and the amount of Ti3+ species is dramatically decreased. Therefore, mostly Ti4+ is left on the surface, leading to the conclusion that the surface is reoxidized.
Figure 1b exhibits the XP spectra of the O1s region after argon ion bombardment (300 K) and annealing (873 K). After argon ion sputtering, a new, broad signal at 532.8 eV arises in the O1s spectrum (see Fig. 1b). In comparison to the Ti2p spectra, this should be related to the occurrence of Ti2+ species. Annealing to elevated temperatures results in a slightly asymmetric peak. The deconvolution of this signal proves the superposition of two signals. The main signal at 530.4 eV can be easily attributed to regular oxygen anions of the rutile lattice. The second, much smaller signal (531.4 eV) is dependent on the intrinsic defect density. Higher defect density leads to more pronounced signals here. Therefore, we attribute this signal to oxygen that interacts with point defects, such as oxygen vacancies or Ti3+ interstitials. In principle, both signals are shifted to higher binding energies compared to the main peak. This could also be due to the presence of hydroxyls at the surface. However, as we do not find any change of these signals by annealing to any temperature up to 900 K for any time for the clean rutile (110) surface but on the other hand a clear correlation to the Ti3+ content, we assign these signals to oxygen next to the reduced Tin+ species.
In accordance with the Ti2p spectra, all signals are significantly broadened after sputtering. After ion sputtering, the O/Ti ratio is depleted by approximately 20 %, which shows the oxygen deficiency of the sputtered surface. In detail, an O/Ti ratio of 1.78 was found for the surface after ion sputtering, while this value was 2.12 for the pristine surface. The O/Ti ratio for the sputtered surface differed from the stoichiometry that was estimated by the content of the three Tin+ species. One possible explanation is that the surface is significantly roughened after ion sputtering and appears without any long-range ordering. Therefore, it would be impossible to perform a simple estimation of the expected oxygen content by comparison to the bulk phase stoichiometries of different titanium oxides. In principle the quantification of the defect density should also be possible by determining the ratio of the Tin+ and oxygen species. However, as one oxygen vacancy equals approximately two electron charges, while Ti3+ interstitials are attributed to only one electron, the comparison from the defect density estimation of the different photoelectron signal ratios is difficult.
For chemical reactions as well as photocatalytic reactions, the valence band region is the most important. Particularly, the O2p and the lowest Ti3d orbitals constitute the occupied valence band while the conduction band is consisting mostly of Ti3d orbitals [24]. The valence band spectra obtained from the XPS experiments are shown in Figure 1c. For the pristine surface, the VB spectra are dominated by the O2p signals around 5.5 eV and 7.6 eV. In the band gap region (0–2 eV), there is a signal at low intensity. Therefore, only a small fraction of the Ti3d states are populated by the appearance of point defects, which are responsible for delivering additional electrons and filling the 3d orbitals. This in-band-gap density of filled states should be directly proportional to the defect density, as both point defects (Ti3+ and Ti2+) lead to the population of these states.
After ion sputtering, the O2p region is broadened, similar to the effects presented for the O1s region. More important is the band gap region. Here, more Ti3d states are populated, leading to a broad shoulder in the band gap region. The gap between the Fermi energy and the O2p levels is almost fully bridged, indicating a high conductivity and a broad UV/Vis absorption feature. Therefore, a more metal-like behavior and effective absorption of the solar light should be expected. However, as this is beyond the scope of this study, these properties were not evaluated at this point. For all three spectral regions, the reported species are in good accordance with earlier publications [59], [63].
3.2 Activation of the Organic Molecules on the Sputtered Rutile Surfaces: Deoxygenation and Reductive Coupling
To probe the activity of such Ti2+-rich rutile surfaces in chemical reactions, two different groups of oxygen-containing organic molecules are considered, namely, alcohols and ketones. We start with the adsorption of the simplest alcohol, which is methanol, on the sputtered rutile surface. By using TPRS, the desorption of methanol and the possible reaction products were traced. For the detailed assignment to molecular methanol desorption or the possible product formation, all spectra were analyzed with respect to the particular fragmentation patterns (see Fig. S1 in the Supplementary information). The fragmentation pattern is highly dependent on the used mass spectrometer and its specific adjustments. For a clearer understanding, we have chosen fragments that allow us to distinguish between different products.
The fragment m/z = 15 (methyl fragment) is, therefore, assigned to the desorption of methane, ethane or methanol. Here, m/z = 31 is exclusively present for the desorption of methanol, while m/z = 30 is observed for the desorption of either methanol or ethane. Whereas, the fragment m/z = 27 is dominant for ethane and ethene. By combining these fragments, a distinct assignment of the desorption traces is possible. However, it is often challenging to obtain an unambiguous assignment as many of these compounds have common fragments and exhibit relatively broad desorption features.
Figure 2 shows the recorded TPRS data after the adsorption of a monolayer of methanol on a sputtered rutile TiO2 surface at 110 K. The dosing time on the sputtered surface was chosen as equivalent to a monolayer dosing on the clean and ordered (110) surface as described before [16]. First, we discuss the desorption of intact methanol. In a second step the product formation is highlighted.

The TPRS data obtained after the adsorption of a monolayer of methanol on a sputtered rutile TiO2 (110) surface at 110 K with the fragments m/z = 31 (methanol), m/z = 30 (methanol, ethane) sputtering at 300 K with a sputtering current of 2 μA/cm2, m/z = 27 (ethane, ethene) and m/z = 15 (methanol, methane, ethane).
The main fragment of methanol (m/z = 31) reveals only one small desorption maximum at 335 K beside the tailing from the multilayer desorption. The desorption feature around 335 K is in proper agreement with the methanol desorption from regular Ti5c (corresponding to Ti4+ centers) at the ordered rutile (110) surface. The slight shifts of the desorption temperature (approximately + 50 K in this case) can be easily explained due to the presence of many reduced Ti3+ and Ti2+ centers in the neighborhood of the Ti4+ centers. By comparing the m/z = 31 to the m/z = 15 signal we conclude that only a small fraction of 20 % of the adsorbed methanol desorbs intact without conversion to another product.
More important for the conversion of methanol is the temperature regime around 550 K. Here, the main desorption features for the fragments m/z = 15 and m/z = 27 are observed, whereas there is no peak for m/z = 31 (methanol). The signal for m/z = 15 is the most intensive one. Hence, we can infer that the deoxygenation reaction forming alkanes is the preferred pathway under these conditions. The desorption of ethane can be excluded because of the missing signal in the fragment m/z = 30 for this temperature. Moreover, this is a likely assumption due to the fact that the formation of methane requires addition of a hydrogen atom to the methyl fragment that is likely to be abstracted from methanol forming surface hydroxyls. Therefore, methane is apparently the main product. In addition, the reductive coupling product ethene (m/z = 27) is observed in a significant amount.
Methanol is already a relatively reactive molecule on defective titania surfaces [16]. The activation of more inert compounds such as acetone, that does not form any products on the clean (110) surface is another important point. Therefore, the activation of acetone was also examined, and in the case of acetone, more fragments must be considered. The typical fragmentation pattern for these compounds are shown in the Supplementary information (Fig. S3). For the intact molecular desorption of acetone, m/z = 58 and m/z = 43 are considered. However, due to the fragmentation pattern and the discrimination of higher masses of our quadrupole mass spectrometer, the m/z ratios higher than m/z = 50 are not intensive. Hence, these fragments cannot be easily distinguished from the noise. For the deoxygenation reaction, two possible products are to be considered: propene and propane. Here, the assignment is more complex. Propane desorption can be identified by a desorption signal in m/z = 29, but it also has a little contribution to m/z = 39. The detection of propene is likely based on the m/z = 39, but m/z = 42 is also possible. Fortunately, propane can be distinguished from propene as the latter does not exhibit the m/z = 29 fragment that is the most intense one for propane. As reductive coupling could also occur, 2,3 dimethyl-butane (m/z = 55) and 2,3 dimethyl-butene (m/z = 84) were monitored.
The comparison of the different fragments shown in Figure 4 demonstrates that no molecular acetone is desorbing from the unordered surface. This was determined by monitoring the main fragment (m/z = 43) and the fragment with the highest m/z ratio (m/z = 58) of acetone. The absence of the fragment at m/z = 58 even when magnified 10 times indicates that no molecular acetone is desorbed. Considering also the m/z = 55 fragment we conclude that these signals in m/z = 43 are not due to acetone desorption but are caused by 2,3 dimethyl-butane formation.
Three different desorption features can be identified for the fragments m/z = 29, m/z = 39, m/z = 42, m/z = 55 and m/z = 84. This indicates the formation of several products at three different desorption temperatures at 375 K, 483 K and 640 K, respectively. To distinguish between the possible products for both expected reactions (deoxygenation and reductive coupling), every fragment is related to a desorbing product as follows.
The first desorption feature at 375 K displays a signal mainly in three different fragments (m/z = 29, m/z = 39 and m/z = 42) and a small shoulder in the fragment m/z = 43. Based on the analysis of the fragmentation pattern of all possible products (see Supplementary information, Fig. S3) the desorption of propene and propane seems likely. Therefore, at the given temperature the deoxygenation reaction exclusively takes place. However, as in the fragment m/z = 29, the desorption at 375 K is more prominent than for the other shown fragments, we likely suggest that the propane yield is higher here compared to propene. The second desorption peak at 483 K is the most intensive signal. In addition to the four fragments described before, which are also present for this feature, some additional peaks for the fragments m/z = 55 and the highest measured fragment m/z = 84 are observed. Therefore, besides the deoxygenation process the reductive coupling of two acetone molecules to 2,3 dimethyl-butane (see Fig. 3: m/z = 55) and 2,3 dimethyl-butene (see Fig. 3: m/z = 84) also takes place. The last desorption species at around 640 K exhibits the formation of the same products as the feature at 483 K. Therefore, desorption signals can be detected in all given fragments without the fragment with the highest m/z ratio of acetone (m/z = 58). This means that, again, the total conversion of acetone is observed, including the formation of the deoxygenation products (propene and propane) as well as the reductive coupling products (2,3 dimethyl-butane and 2,3 dimethyl-butene). Notably, the major product formation for acetone is taking place at much lower temperatures than in the case of methanol.

The temperature-programmed reaction spectra after the adsorption of a monolayer of acetone at 110 K onto a sputtered rutile TiO2 (110) surface exhibiting the fragments m/z = 29 (propane), m/z = 39 (propane, propene, 2,3 dimethyl-butene), m/z = 42 (propene), m/z = 55 (2,3 dimethyl-butane) and m/z = 84 (2,3 dimethyl-butene) and m/z = 43 (acetone, propane, 2,3 dimethyl-butene) and m/z = 58 (acetone) sputtering at 300 K with a sputtering current of 2 μ/cm2.
However, from the shown TPRS data, it is not possible to propose a reaction mechanism for the deoxygenation as well as for the reductive coupling reaction. Regarding the deoxygenation reaction of both molecules, it remains unclear how the proton addition (methane/propane) or migration (propene) occurs. In case of hydrocarbon formation from methanol we suggest that the necessary hydrogen comes from hydroxyls formed by dissociative methanol adsorption. In case of acetone, we consider the formation and dissociation of hydroxyl groups due to the keto-enol tautomerization. Our data do not allow us to distinguish between a genuine surface reaction or a recombinative desorption. FT-IRRAS experiments and additional TPRS studies, including isotopic labeling, may help to identify the reaction path in the future.
3.3 Adsorbate-Induced Reoxidation and Long-Range Ordering During the Conversion of Oxygen-Containing Organic Molecules
In both cases presented previously, the thermal conversion of oxygen-containing molecules on the sputtered rutile TiO2 surface via a deoxygenation pathway and the reductive coupling was demonstrated. The intact molecular desorption of the reactants was observed only as minor traces. Therefore, we have to consider whether the missing oxygen atoms of these organic molecules can reoxidize and reorganize the surface. To clarify this, LEED pattern of the three different states during the temperature ramp were obtained. For that, a monolayer of acetone was adsorbed on the sputtered surface and then heated subsequently to two different temperatures (500 K and 650 K). Current studies have shown that the surface neither reoxidizes nor shows any signs of reordering in the LEED pattern after annealing at these temperatures. After cooling the sample to 110 K, another monolayer of acetone was adsorbed and again heated to the given temperatures. This procedure was repeated three times. In order to probe the surface changes during the reactions at two different temperatures, the given temperatures were chosen with respect to the TPRS data shown in Figure 3.
Figure 4 shows the recorded LEED patterns. For comparison, the LEED pattern of a clean rutile TiO2 (110) (1×1) surface (a) and the observed LEED pattern of the sputtered surface obtained after 20 min of argon ion bombardment (b) are also given. After a monolayer adsorption of acetone at 110 K and heating to 500 K, no significant change of the pattern was observed (c). Whereas, after further heating to 650 K, clear spots appeared on the LEED pattern, indicating a starting reordering (d). The reflexes became more visible after every repetition of acetone adsorption and subsequent heating (Fig. 4e–h), leading to a further convergence towards the LEED pattern of a clean rutile TiO2 (110) (1×1) surface.
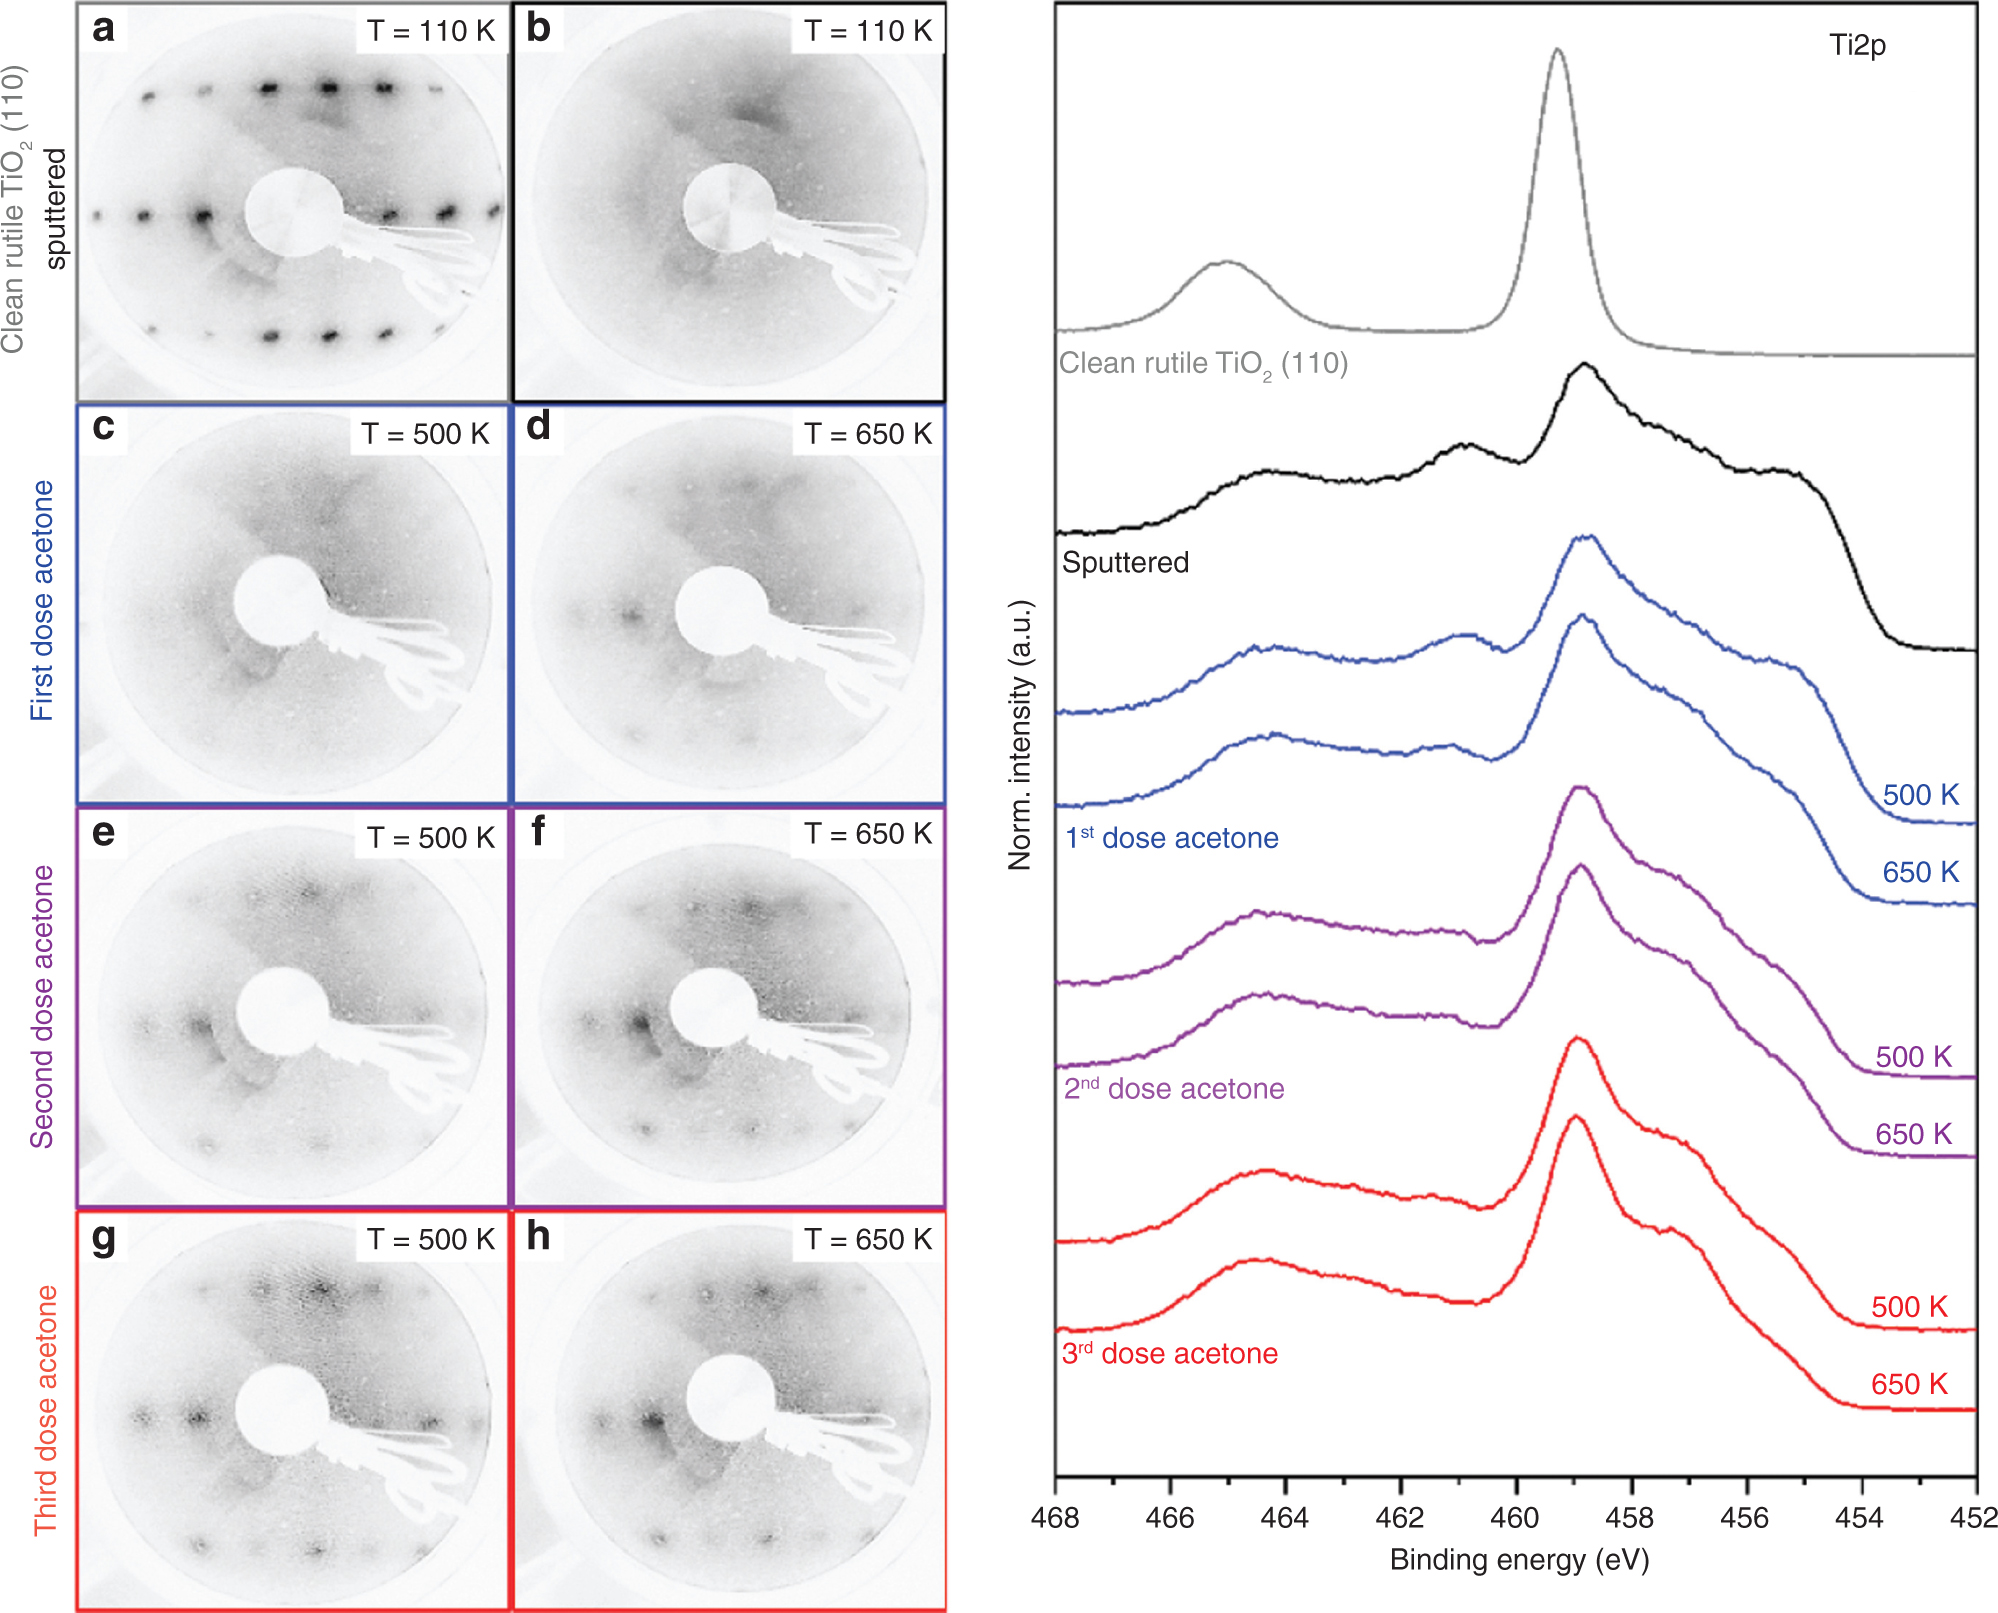
The LEED patterns and XP spectra recorded at different steps during the conversion of acetone on sputtered rutile surfaces (beam energy = 100.5 eV) sputtering at 300 K with 1 eV for 20 min. (a) Clean rutile TiO2 (110) (1×1) surface. (b) Sputtered surface after the first adsorption of a monolayer of acetone and heating to (c) 500 K and (d) 650 K. (e) Second adsorption of a monolayer acetone and again heating to (e) 500 K and (f) 650 K as well as the third adsorption of a monolayer acetone and heating to (g) 500 K and (h) 650 K (adsorption temperature 110 K). The corresponding Ti2p XP spectra are shown on the right as indicated (excitation with monochromatic Al Kα radiation). A saturation dose at room temperature was used.
Therefore, the deoxygenation reaction and the reductive coupling are also driven by the (partial) reoxidation and reordering of the reduced surface. The missing oxygen atoms that are not monitored in any desorbing product are integrated into the rebuilt rutile TiO2 (110) surface during both reactions. This also implies that we are unable to observe pure catalytic reactions here but at least partially stochiometric reactions with the titania itself. This conclusion is also supported by the TPRS investigations of the repeated adsorption-heating presented here.
These TPRS data are to be found in Figure S5 in the Supplementary information. The temperature programmed desorption from the surface was followed up to 680 K with repeated acetone adsorption at 110 K. A dramatic change was observed between the first and the second desorption spectra. The deoxygenation and reductive coupling yield dropped significantly (almost no desorption for m/z = 29 and 39). Instead of the three desorption features described previously, at the second and any further repetition, only one broad desorption feature at around 350 K appeared for these products. As this feature is a bit more pronounced for m/z = 29, we likely assign this feature to be dominated by propane desorption. Beyond the first repetition of the adsorption-desorption procedure a broad desorption feature for molecular acetone appears (m/z = 43, 58) around 274 K. This gives a hint for a dramatic chemical change of the surface during the first reaction cycle.
For a more systematic understanding, we have also followed the change of the surface during the conversion of acetone by XPS. Figure 4 (right set of spectra) shows the corresponding Ti2p spectra. The spectra for the ordered rutile TiO2 (110) surface as well as the spectra after sputtering are given as references. As already shown in the first part, three different Ti species were present (Ti4+, Ti3+ and Ti2+, respectively). During the repeated adsorption of acetone (saturation doses at room temperature and subsequent heating to the given temperatures, see Experimental for details), the Ti2+ signal strongly decreased, whereas the Ti4+ signal increased and narrowed. The signal corresponding to Ti3+ was approximately constant. Similar conclusions can be drawn from the O1s and valence band spectra taken during the conversion of acetone. These spectra are to be found in the Supplementary information, Figure S6. Here, the O1s signal narrowed and the shoulder corresponding to the presence of oxygen in the neighborhood to reduced Tin+ centers as well as the filled in-band-gap density of states vanished during the procedure. Figure S7 (see Supplementary information) shows the corresponding C1s spectra taken for one adsorption cycle of acetone. As for the sputtered surface, no C1s signal was observed, two chemical carbon species (284.6 eV and 286.0 eV, approximately in a 2:1 ratio) were detected after the adsorption of acetone at 300 K. From the signal position as well as its stochiometric ratio, the signals can be attributed to the carbon in the methyl and the carbonyl fragments of acetone. Heating to 405 K and 500 K led to a continuous decrease of these signals, indicating the conversion of acetone as shown before. However, no assignment to different reaction pathways can be concluded from these data, especially because the slow desorption of the adsorbates by the X-ray radiation cannot be excluded. Heating to 650 K and to higher temperatures removes all carbon.
By combining the recorded LEED, TPRS and XPS data, we can identify the formation of propene, propane and coupling products (2,3 dimethyl-butane and 2,3 dimethyl-butene) by the reaction of acetone with Ti2+ centers at different temperatures between 350 K and 650 K, including a long range reordering of the surface towards the typical rutile (110) (1×1) structure. The missing oxygen from the deoxygenation reaction is most likely incorporated into the titania surface during this process. The signal narrowing is consistent with the restructuring of the surface as observed in LEED. However, this does not fully explain the drastic change of the TPR spectra after the first adsorption cycle. Anyway, one possible explanation for this discrepancy could be the different adsorption temperatures for TPRS/LEED (T = 110 K) and the XPS (T = 298 K) experiments, resulting in a higher coverage for the cooled samples.
These results indicate that the sputtered surfaces cannot only be reorganized by annealing but also by the adsorption and deoxygenation of oxygen containing molecules. This is in good agreement with the STM-based study by the Besenbacher group, who followed the thermal reaction of reduced Ti ions with oxygen to form TiO2 islands [23], [24]. Another example is a study by the group of Sears, who used STM and low energy ion scattering to study the formation of ordered structures during annealing a reduced titania surface in an oxygen containing atmosphere [67].
4 Conclusion and Outlook
When bombarding a clean rutile TiO2 (110) surface with argon ions, the long-range ordering is lost as characterized by LEED. The XPS data revealed the presence of almost equal amounts of Ti2+ and Ti3+ species in addition to the lattice Ti4+ centers. Moreover, the surface was found to be significantly oxygen deficient (compared with TiO2) as shown by the Ti2p and O1s photoelectron spectra. Furthermore, the valence band spectra indicated the population of additional in-band-gap states that could have interesting potential for photocatalytic applications.
Thereupon, the activity was studied by investigating the thermal conversion of oxygen-containing organic molecules. The Ti2+-rich surface turned out to be highly reactive with respect to deoxygenation and C–C coupling reactions. While methanol already displays a deoxygenation reaction on a clean highly reduced rutile TiO2 (110) (1×1) surface, the conversion of acetone is not possible on the clean, ordered surface. On the sputtered surface, methanol and acetone both undergo the formation and desorption of deoxygenation and reductive coupling products at temperatures above 300 K. It is note-worthy, that there are some differences between the desorption behavior of methanol and acetone. Methanol shows one desorption feature at 550 K for both products (methane and ethane), whereas the reaction of acetone is more temperature dependent and complex. Here, three desorption features appear at different temperatures. At 375 K, the deoxygenation products propane and propene selectively desorb, with propane being more dominant. In contrast, the desorption of the deoxygenation products is accompanied by the formation of the reductive coupling products 2,3 dimethyl-butane and 2,3 dimethyl-butene for the other two desorption features (483 K and 640 K).
During these reactions, the reoxidation and reorganization of the surface stimulated by these molecules is observed indicating an (approximately stochiometric) reaction with the surface. However, for industrial use, the deactivation of the reactive Ti2+ through the reoxidation of the surface is a big disadvantage. To suppress the deactivation process, some kind of cocatalyst should be added to react with the oxygen. Aluminum is a possible cocatalyst to abstract oxygen from titania and slow down the deactivation of the catalyst [68]. An additional advantage of using aluminum as cocatalyst is that it not only abstracts oxygen but can also regenerate reductive Ti species at 673 K and additional treatment by solar radiation as shown in real systems [54]. Other possibilities for cocatalysts in abstracting oxygen are molybdenum or rhenium complexes [69], [70], [71], [72], [73].
Funding source: http://dx.doi.org/10.13039/501100001659
Award Identifier / Grant number: DFG RTG 2226
Funding statement: Studienstiftung des deutschen Volkes gibt keine Stiftungs-IDs aus. Deutsche Forschungsgemeinschaft, Funder Id: http://dx.doi.org/10.13039/501100001659, Grant Number: DFG RTG 2226.
Acknowledgement
We would like to thank Carsten Dosche and Ralf Nustedt for their technical support with the XPS and system construction. The Thermo Fisher ESCALAB 250Xi spectrometer was funded by the Deutsche Forschungsgesellschaft (INST 184/144-1 FUGG). We also thank the DFG Research Training Group 2226 “Chemical Bond Activation” for the funding. L.M. acknowledges the funding provided by the German Academic Scholarship Foundation (Studienstiftung des deutschen Volkes).
References
[1] C. S. Nichols, T. C. Moore, and W. L. Edwards, US Patent, Patent No. 5,898,058 (1999).Suche in Google Scholar
[2] Y. Doi, S. Ueki, and T. Keii, Macromolecules 12, 814 (1979).10.1021/ma60071a004Suche in Google Scholar
[3] W. Kaminsky, Catal. Today 62, 23 (2000).10.1016/S0920-5861(00)00406-5Suche in Google Scholar
[4] M. S. Cholod and N. M. Shah, US Patent, Patent No. 4,356,299 (1982).Suche in Google Scholar
[5] X. Zhu, X. Li, S. Xie, S. Liu, G. Xu, et al., Catal. Surv. Asia 13, 1 (2009).10.1007/s10563-008-9055-3Suche in Google Scholar
[6] J. M. Botha, M. M. Mbatha, B. S. Nkosi, A. Spamer and J. Swart, US Patent, Patent No. 6,586,649 B1 (2003).Suche in Google Scholar
[7] J. L. Enos, Invention and Innovation in the Petrleum Refining Industry: National Bureau of Economic Research, Camebridge, MA 1962, p. 299.10.1515/9781400879762-012Suche in Google Scholar
[8] C. L. Pang and R. Lindsay, Chem. Rev. 113, 3887 (2013).10.1021/cr300409rSuche in Google Scholar
[9] U. Diebold, Appl. Surf. Sci. 48, 53 (2003).10.1016/S0167-5729(02)00100-0Suche in Google Scholar
[10] Z. Shayegan, C. S. Lee, and F. Haghighat, Chem. Eng. J. 334, 2408 (2018).10.1016/j.cej.2017.09.153Suche in Google Scholar
[11] C. Pang, R. Lindsay, and G. Thornton, Chem. Soc. Rev. 37, 2328 (2008).10.1039/b719085aSuche in Google Scholar
[12] L. Chen, Z. Li, R. S. Smith, B. D. Kay, and Z. Dohnálek, J. Phys. Chem. C 118, 15339 (2014).10.1021/jp504770fSuche in Google Scholar
[13] J. Schneider, M. Matsuoka, M. Takeuchi, J. Zhang, Y. Horiuchi, et al., Chem. Rev. 114, 9919 (2014).10.1021/cr5001892Suche in Google Scholar
[14] M. Henderson, Surf. Sci. 419, 174 (1999).10.1016/S0039-6028(98)00778-XSuche in Google Scholar
[15] P. M. Clawin, C. M. Friend, and K. Al-Shamery, A Eur. J. 20, 7665 (2014).10.1002/chem.201402102Suche in Google Scholar PubMed
[16] M. Osmić, L. Mohrhusen, and K. Al-Shamery, J. Phys. Chem. C 123, 7615 (2018).10.1021/acs.jpcc.8b02953Suche in Google Scholar
[17] R. Franking, H. Kim, S. A. Chambers, A. N. Mangham, and R. J. Hamers, Langmuir 28, 12085 (2012).10.1021/la302169kSuche in Google Scholar PubMed
[18] L. Chen, R. S. Smith, B. D. Kay, and Z. Dohnálek, Surf. Sci. 650, 83 (2016).10.1016/j.susc.2015.11.002Suche in Google Scholar
[19] U. Diebold and T. E. Madey, Surf. Sci. Spectra. 4, 227 (1996).10.1116/1.1247794Suche in Google Scholar
[20] Z. Zhang, J. Lee, J. T. Yates, R. Bechstein, E. Lira, et al., J. Phys. Chem. C 114, 3059 (2010).10.1021/jp910358wSuche in Google Scholar
[21] G. Pacchioni, ChemPhysChem 4, 1041 (2003).10.1002/cphc.200300835Suche in Google Scholar PubMed
[22] E. Lira, S. Wendt, P. Huo, J. Ø. Hansen, R. Streber, et al., J. Am. Chem. Soc. 133, 6529 (2011).10.1021/ja200884wSuche in Google Scholar PubMed
[23] E. Lira, J. Hansen, P. Huo, R. Bechstein, P. Galliker, et al., Surf. Sci. 604, 1945 (2010).10.1016/j.susc.2010.08.004Suche in Google Scholar
[24] S. Wendt, P. T. Sprunger, E. Lira, G. K. H. Madsen, Z. Li, et al., Science 320, 1755 (2008).10.1126/science.1159846Suche in Google Scholar PubMed
[25] S. C. Jensen, A. Shank, R. J. Madix, and C. M. Friend, ACS Nano 6, 2925 (2012).10.1021/nn300949qSuche in Google Scholar PubMed
[26] E. Farfan-Arribas and R. J. Madix, J. Phys. Chem. B 106, 10680 (2002).10.1021/jp020729pSuche in Google Scholar
[27] E. Farfan-Arribas and R. J. Madix, Surf. Sci. 544, 241 (2003).10.1016/j.susc.2003.08.025Suche in Google Scholar
[28] Z. Li, R. S. Smith, B. D. Kay, and Z. Dohnálek, J. Phys. Chem. C 115, 22534 (2011).10.1021/jp208228fSuche in Google Scholar
[29] C. A. Walenta, S. L. Kollmannsberger, J. Kiermaier, A. Winbauer, M. Tschurl, et al., Phys. Chem. Chem. Phys. 17, 22809 (2015).10.1039/C5CP03550CSuche in Google Scholar
[30] A. Migani and L. Blancafort, J. Am. Chem. Soc. 139, 11845 (2017).10.1021/jacs.7b05121Suche in Google Scholar PubMed
[31] Z. Zhang, Y. Yoon, X. Lin, D. Acharya, B. D. Kay, et al., J. Phys. Chem. Lett. 3, 3257 (2012).10.1021/jz301412mSuche in Google Scholar
[32] P. M. Jayaweera, E. L. Quah, and H. Idriss, J. Phys. Chem. C 111, 1764 (2007).10.1021/jp0657538Suche in Google Scholar
[33] C. P. León, K. Sagisaka, D. Fujita, and L. Han, RSC Adv. 4, 8550 (2014).10.1039/c3ra47369dSuche in Google Scholar
[34] M. D. Kershis and M. G. White, Phys. Chem. Chem. Phys. 15 17976 (2013).10.1039/c3cp53027bSuche in Google Scholar PubMed
[35] S. Bates, M. Gillan, and G. Kresse, J. Phys. Chem. 2, 2017 (1998).10.1021/jp9804998Suche in Google Scholar
[36] R. Sánchez De Armas, J. Oviedo, M. A. San Miguel, and J. F. Sanz, J. Phys. Chem. C 111, 10023 (2007).10.1021/jp0717701Suche in Google Scholar
[37] M. Shen and M. A. Henderson, J. Phys. Chem. C 116, 18788 (2012).10.1021/jp3046774Suche in Google Scholar
[38] L. Y. Margolis, Catal. Rev. 8, 241 (1974).10.1080/01614947408071862Suche in Google Scholar
[39] X. Yu, Z. Zhang, C. Yang, F. Bebensee, S. Heissler, et al., J. Phys. Chem. C 120, 12626 (2016).10.1021/acs.jpcc.6b03689Suche in Google Scholar
[40] G. Busca, J. Lamotte, J. Lavalley, V. Lorenzelli, and C. Erba, J. Am. Chem. Soc. 109, 5197 (1987).10.1021/ja00251a025Suche in Google Scholar
[41] M. Pelucchi, E. Ranzi, A. Frassoldati, and T. Faravelli, Proc. Combust. Inst. 36, 393 (2017).10.1016/j.proci.2016.05.051Suche in Google Scholar
[42] Y. K. Kim, B. D. Kay, J. M. White, and Z. Dohnálek, Surf. Sci. 602, 511 (2008).10.1016/j.susc.2007.10.049Suche in Google Scholar
[43] O. Bondarchuk, Y. K. Kim, J. M. White, J. Kim, B. D. Kay, et al., J. Phys. Chem. C 111, 11059 (2007).10.1021/jp072298mSuche in Google Scholar
[44] Y. K. Kim, B. D. Kay, J. M. White, and Z. Dohnálek, J. Phys. Chem. C 111, 18326 (2007).10.1021/jp075808lSuche in Google Scholar
[45] Y. K. Kim, B. D. Kay, J. M. White, and Z. Dohnálek, Catal. Lett. 119, 1 (2007).10.1007/s10562-007-9199-1Suche in Google Scholar
[46] L. Benz, J. Haubrich, R. G. Quiller, S. C. Jensen, and C. M. Friend, J. Am. Chem. Soc. 2, 15026 (2009).10.1021/ja905522cSuche in Google Scholar PubMed
[47] Q. Yuan, Z. Wu, Y. Jin, F. Xiong, and W. Huang, J. Phys. Chem. C 118, 20420 (2014).10.1021/jp5061733Suche in Google Scholar
[48] T. Würger, W. Heckel, K. Sellschopp, S. Müller, A. Stierle, et al., J. Phys. Chem. C 122, 19481 (2018).10.1021/acs.jpcc.8b04222Suche in Google Scholar
[49] M. A. Henderson, J. Phys. Chem. B 108, 18932 (2004).10.1021/jp046357xSuche in Google Scholar
[50] N. G. Petrik, M. A. Henderson, and G. A. Kimmel, J. Phys. Chem. C 119, 12262 (2015).10.1021/acs.jpcc.5b02477Suche in Google Scholar
[51] W. Zhou, W. Li, J. Q. Wang, Y. Qu, Y. Yang, et al., J. Am. Chem. Soc. 136, 9280 (2014).10.1021/ja504802qSuche in Google Scholar PubMed
[52] M. Tian, M. Mahjouri-Samani, G. Eres, R. Sachan, M. Yoon, et al., ACS Nano 9, 10482 (2015).10.1021/acsnano.5b04712Suche in Google Scholar PubMed
[53] Y. Liu, L. Tian, X. Tan, X. Li, and X. Chen, Sci. Bull. 62, 431 (2017).10.1016/j.scib.2017.01.034Suche in Google Scholar
[54] N. L. De Silva, A. C. A. Jayasundera, A. Folger, O. Kasian, S. Zhang, et al., Catal. Sci. Technol. 8, 4657 (2018).10.1039/C8CY01212ASuche in Google Scholar
[55] D. S. Dharmagunawardhane, N. L. De Silva, U. B. Gunatilake, C. F. Yan, and J. Bandara, Mol. Catal. 470, 89 (2019).10.1016/j.mcat.2019.03.028Suche in Google Scholar
[56] Q. Wu, C. Zhang, B. Zhang, X. Li, Z. Ying, et al., J. Colloid. Interface Sci. 463, 75 (2016).10.1016/j.jcis.2015.10.026Suche in Google Scholar
[57] M. Li, W. Hebenstreit, U. Diebold, A. M. Tyryshkin, M. K. Bowman, et al., J. Phys. Chem. B 104, 4944 (2000).10.1021/jp9943272Suche in Google Scholar
[58] J. F. Moulder, W. F. Stickle, P. E. Sobol, and K. D. Bomben, in: Handbook of X-Ray Photoelectron Spectroscopy (Eds. J. Chastain, R. C. J. King), Physical electronics: Eden Prairie 1995.Suche in Google Scholar
[59] J. T. Mayer, U. Diebold, T. E. Madey, and E. Garfunkel, J. Electron. Spectros. Relat. Phenomena 73, 1 (1995).10.1016/0368-2048(94)02258-5Suche in Google Scholar
[60] M. Batzill, E. H. Morales, and U. Diebold, Chem. Phys. 339, 36 (2007).10.1016/j.chemphys.2007.07.037Suche in Google Scholar
[61] M. Batzill, E. H. Morales, and U. Diebold, Phys. Rev. Lett. 96, 026103 (2006).10.1103/PhysRevLett.96.026103Suche in Google Scholar
[62] C. Di Valentin, G. Pacchioni, and A. Selloni, J. Phys. Chem. C 113, 20543 (2009).10.1021/jp9061797Suche in Google Scholar
[63] W. Göpel, J. Anderson, D. Frankel, M. Jaehnig, K. Phillips, et al., Surf. Sci. 139, 333 (1984).10.1016/0039-6028(84)90054-2Suche in Google Scholar
[64] H. Idriss and M. A. Barteau, Catal. Lett. 26, 123 (1994).10.1007/BF00824038Suche in Google Scholar
[65] A. Linsebigler, G. Lu, and J. T. Yates, J. Phys. Chem. 100, 6631 (1996).10.1021/jp952018fSuche in Google Scholar
[66] N. G. Petrik, Z. Zhang, Y. Du, Z. Dohnálek, I. Lyubinetsky, et al., J. Phys. Chem. C 113, 12407 (2009).10.1021/jp901989xSuche in Google Scholar
[67] M. Li, W. Hebenstreit, L. Gross, U. Diebold, M. A. A. Henderson, et al. Surf. Sci. 437, 173 (1999).10.1016/S0039-6028(99)00720-7Suche in Google Scholar
[68] L. S. Dake and R. J. Lad, J. Vac. Sci. Technol. A Vacuum Surfaces Film 13, 122 (2002).10.1116/1.579424Suche in Google Scholar
[69] M. M. Abu-Omar, E. H. Appelman, and J. H. Espenson, Inorg. Chem. 35, 7751 (2002).10.1021/ic960701qSuche in Google Scholar
[70] E. Carmona, A. Galindo, and L. Sanchez, Polyhedron 3, 347 (1984).10.1016/S0277-5387(00)88119-XSuche in Google Scholar
[71] F. A. Cottonand and R. Poli, Polyhedron 6, 2181 (1987).10.1016/S0277-5387(00)84284-9Suche in Google Scholar
[72] H. Bögge, A. Müller, R. Coogan, T. J. Kemp, D. A. Brown, et al., Inorg. Chem. 35, 1674 (2002).10.1021/ic950819rSuche in Google Scholar PubMed
[73] K. P. Gable, J. J. J. Juliette, and M. A. Gartman, Organometallics 14, 3138 (2005).10.1021/om00007a007Suche in Google Scholar
[74] US Department of Commerce. NIST Chemistry Webbook 2018.Suche in Google Scholar
Supplementary Material
The online version of this article offers supplementary material (DOI: https://doi.org/10.1515/zna-2019-0135).
© 2019 Walter de Gruyter GmbH, Berlin/Boston
Artikel in diesem Heft
- Frontmatter
- Trends and Perspectives in Energy Research
- Quantitative Assessment of the Influence of Camera and Parameter Choice for Outdoor Electroluminescence Investigations of Silicon Photovoltaic Panels
- Sequentially Deposited Compact and Pinhole-Free Perovskite Layers via Adjusting the Permittivity of the Conversion Solution
- Efficient Solution Processed CH3NH3PbI3 Perovskite Solar Cells with PolyTPD Hole Transport Layer
- Potential of CZTSe Solar Cells Fabricated by an Alloy-Based Processing Strategy
- Two-Dimensional Absorbers for Solar Windows: A Simulation
- Harvesting the Electromagnetic Energy Confined Close to a Hot Body
- Activation of Small Organic Molecules on Ti2+-Rich TiO2 Surfaces: Deoxygenation vs. C–C Coupling
- Recent Advances in the Colloidal Synthesis of Ternary Transition Metal Phosphides
- Signatures of Strong Vibronic Coupling Mediating Coherent Charge Transfer in Two-Dimensional Electronic Spectroscopy