Evaluating serum FOXs transcription factor proteins in Hashimoto’s thyroiditis: a comparative analysis
-
Tugba Agbektas

 ,
Cemile Zontul
,
Zuhal Tuncbilek
,
Ayca Tas
,
Merve Zirek
,
Baris Sariakcali
and
Yavuz Silig
,
Cemile Zontul
,
Zuhal Tuncbilek
,
Ayca Tas
,
Merve Zirek
,
Baris Sariakcali
and
Yavuz Silig

Abstract
Objectives
Hashimoto’s thyroiditis (HT) is a complex metabolic autoimmune disease. FOXs participate in many cellular metabolic processes and control many related genes. This study aimed to investigate FOXO1, FOXP1 and FOXP2 protein levels in HT disease.
Methods
The study included 38 patients diagnosed with HT and 38 healthy individuals at the Department of Endocrinology and Metabolic Diseases at Sivas Cumhuriyet University Hospital. Venous blood samples were taken from the individuals in the study groups and serum was obtained. Serum FOXO1, FOXP1 and FOXP2 protein levels were analyzed using the enzyme-linked immunosorbent assay (ELISA) method.
Results
Serum FOXO1 and FOXP2 protein levels were found to be lower in the HT patient group compared to the control group (p<0.001). FOXP1 concentration was found to be lower in the patient group, but this decrease was not significant (p>0.05). Thyroid stimulating hormone (TSH), anti TPO, antithyroglobulin (anti Tg) and AST levels were found to be higher in HT patients compared to the control group, while T4 levels were found to be lower. According to protein-protein interaction (PPI) analysis, these proteins were found to interact highly with each other and are generally involved in T cell mechanisms.
Conclusions
HT is a common autoimmune disease and is metabolically associated with many pathways. This cross-sectional study is only a preliminary study on the possible association between HT and FOX family proteins.
Introduction
HT is one of the most common autoimmune thyroid diseases with thyroid cell destruction and is also called chronic lymphocytic thyroiditis [1]. It is generally seen in 10 % of the society and is more common in women than in men [2]. The age of diagnosis in HT is usually between 30 and 50 years [3]. The frequency of the disease increases with age and is associated with other autoimmune diseases such as type 1 diabetes, lupus, rheumatoid arthritis, celiac and addison’s disease [4]. HT is due to lymphocytic infiltration and follicular destruction by thyroid-specific B and T cells, including apoptosis of thyroid epithelial cells [5]. Thyroid cell damage is both cell and antibody related. Lymphocytic cell invasion, destruction of the thyroid stroma, progressive fibrosis, follicular atrophy and, over time, follicular oncocytic metaplasia are seen [4]. Although pulsatile hormone release during destruction of the thyroid gland can lead to hyperthyroid and normothyroid periods, the disease is more often diagnosed with hypothyroidism characterized by increased TSH, low free T4 (fT4), and high antibody levels [6]. Besides, HT is characterized with chronic inflammation [7]. A lot of inflammation markers have been reported to be associated with HT. These include neutrophil to lymphocyte ratio [8], uric acid [9], DeRitis score [10], platelet/lymphocyte ratio [11] and C-reactive protein [12]. Forkhead box transcription factors (FOX) proteins are involved in inflammation [13]. Thus, studying FOX proteins in HT is reasonable.
In recent years, various FOXs have been identified in almost all eukaryotes from yeast to humans. The FOX protein family activates the transcription of target genes via the DNA-binding FOX domain in the nucleus. FOX protein plays an important role in the execution of various cellular processes by regulating the expression levels of genes involved in oxidative stress response and redox signaling, DNA damage repair, cell cycle progression and arrest, diabetes, angiogenesis, gluconeogenesis and apoptosis [14], [15], [16].
Intracellular transcriptional functions of FOXs are regulated by acetylation, phosphorylation and post-translational modifications [14]. Somatic mutations have been reported in FOX genes that may contribute to cancer in different ways [17]. Mutation of FOX genes causes genetic diseases that promote cancer or cause diseases that extend to immunological defects [18]. FOXO1, FOXP1 and FOXP2, which are members of the FOX protein family, have been found to be widely expressed in various tissues and organs [17].
There is no study investigating the relationship between serum FOXO1, FOXP1 and FOXP2 levels in patients with HT. The aim of this study was to investigate the serum FOXO1, FOXP1 and FOXP2 levels in patients with HT.
Materials and methods
Study population
The diagnosis of HT is established through the comprehensive assessment of clinical presentation, serological markers, imaging studies, and, when indicated, histopathological evaluation. The most sensitive and specific serological marker is the presence of anti-thyroid peroxidase antibodies (TPOAb), which are detected in approximately 90–95 % of patients. TSH levels are typically elevated, and fT4 levels may be normal or decreased depending on the disease stage. Thyroid ultrasonography often reveals characteristic findings such as a diffusely hypoechoic and heterogeneous parenchyma, irregular glandular margins, and multiple small hypoechoic areas (pseudonodules). Fine-needle aspiration biopsy is not routinely required but may be performed in the presence of suspicious nodules. Histopathological findings, if available, demonstrate dense lymphocytic infiltration, germinal center formation, follicular cell destruction, and variable degrees of fibrosis. Therefore, the diagnosis of HT relies on the integration of clinical features, thyroid autoantibodies, ultrasound findings, and, when necessary, histological confirmation [19], 20].
In this study, the patient group consisted of 38 individuals diagnosed with HT at the Department of Endocrinology and Metabolic Diseases of Sivas Cumhuriyet University Medical Faculty Research and Application Hospital. All patients were newly diagnosed and had not received any prior treatment. Participants were randomly selected without discrimination regarding age or gender. The control group included 38 healthy individuals who presented to the same department, had no prior diagnosis of HT, and were matched with the patient group in terms of age and gender distribution. Demographic data such as age and gender were collected from all participants. Furthermore, laboratory parameters relevant to HT diagnosis, including TSH, fT3, fT4, Anti-TPO, Anti-Tg, ALT, and AST, were evaluated in both groups.
FOXO1, FOXP1 and FOXP2 proteins analysis
FOXO1 (Catalog no: SL3689Hu, Sunlong Biotech Co., Ltd., Hangzhou, China), FOXP1 (Catalog no: SL3037Hu, Sunlong Biotech Co., Ltd., Hangzhou, China), and FOXP2 (Catalog no: SL3688Hu, Sunlong Biotech Co., Ltd., Hangzhou, China) levels were measured using ELISA kits following the manufacturer’s instructions. The detectable ranges for each protein were as follows: FOXO1, 5–60 ng/L; FOXP1, 150–1800 pg/mL; and FOXP2, 25–300 ng/L. Plate washing was performed with a Bio-Tek ELX50 automatic washer (BioTek Instruments, USA), and absorbance was measured using a Microplate Reader (BioTek, Epoch, USA).
Collection and processing of blood samples
Fasting blood samples were collected from each participant and placed into a single serum separation tube evacuated tube. Serum was isolated by centrifugation at 3,000 rpm (approximately 1,400×g) for 10 min at room temperature. The resulting supernatant was carefully transferred into sterile eppendorf tubes under aseptic conditions. All blood samples were collected and processed according to standardized protocols and quality control measures to ensure sample integrity and analytical reliability. The samples were stored at −80 °C until analysis to prevent degradation.
Bioinformatics of the interaction of FOXO1, FOXP1 and FOXP2 genes
GeneMANIA (https://genemania.org/) was utilized to create a network and comprehend the connections between the genes under study and with additional genes [21]. GeneMANIA is a flexible, user-friendly web interface for generating hypotheses about gene function, analyzing gene lists and prioritizing genes for functional assays. Given a query list, GeneMANIA extends the list with functionally similar genes that it identifies using available genomics and proteomics data. GeneMANIA also reports weights that indicate the predictive value of each selected data set for the query. GeneMANIA uses an extensive quantity of functional association data to identify additional genes linked to a collection of input genes [22]. The interactions of FOXO1, FOXP1 and FOXP2 genes with each other and with related genes were investigated. Accordingly, the interactions of genes with functions such as physical interaction with the input genes, co-expression status, co-localization, genetic interaction, participation in similar pathways, and sharing of protein domains were estimated.
Protein-protein interaction analysis
Protein-protein interaction analysis of the proteins included in the study and their relationships with other proteins were performed using the STRING v12 database (https://version-12-0.string-db.org). Functional enrichment visualization of the pathways associated with FOXO1, FOXP1 and FOXP2 was analyzed using this database.
Statistical analysis
Statistical analyses were performed using SPSS (version 22.0; SPSS Inc., Chicago, USA) and GraphPad Prism (version 8.0.1). The descriptive statistics for the categorical variables were expressed in the form of counts and percentages. The Chi-squared test was employed to compare the proportions between the categorical variables. Variables which were normally distributed were expressed as mean ± standard deviation, whilst variables which were found to be non-normal were instead expressed as minimum–maximum and then compared by means of the Mann–Whitney U test. The validity of the assumption that the numerical data can be considered normally distributed was determined by evaluating the Shapiro-Wilk and Kolmogorov-Smirnov tests, in addition to employing various graphical techniques, including histograms and Q-Q plots, to analyse the data. The Peer-to-Peer Independent Samples Test was employed for the purpose of comparing numerical data obtained from the patient and control groups for normally distributed variables, as indicated by the results obtained from SPSS. In order to determine whether the given data conformed to a normal distribution, the skewness and kurtosis statistics were calculated. Subsequently, the data underwent adjustment and the implementation of appropriate tests for normality. One-way ANOVA was used to determine differences between groups after homogeneity of variance was ensured. Tukey post-hoc tests were used to determine the locations of the differences.
Receiver Operating Characteristic (ROC) analysis was conducted to assess the discriminatory power between patient and control groups based on the concentration values of FOXO1, FOXP1, and FOXP2 proteins. The area under the ROC curve (AUC) was computed with a 95 % confidence interval. The optimal cut-off values for FOXO1, FOXP1, and FOXP2 protein concentrations, deemed significant after ROC analysis, were determined using the youden index, which identifies the point maximizing both sensitivity and specificity. A significance threshold of p<0.05 was considered statistically significant. ROC curves are widely used in evaluating the performance of predictive models. These curves provide a graphical representation of the model’s ability to differentiate between the patient and control groups, based on the concentration values of the aforementioned proteins. The AUC serves as a summary measure of the model’s performance, with a value of 1 indicating perfect classification, and values lower than 1 reflecting progressively poorer discriminatory ability.
Results
This study aimed to investigate the potential role of FOXO1, FOXP1, and FOXP2 proteins in the pathogenesis of HT. A total of 76 samples, including 38 HT patients and 38 healthy controls, were analyzed.
Comparison of demographic and biochemical parameters
There was no statistically significant difference in gender distribution between the patient and control groups (p=0.602) Table 1, indicating that the groups were balanced in terms of sex.
Comparison of demographic information and FOXO1, FOXP1, FOXP2 protein levels of HT and controls between research groups.
| HT (n=38) | Control (n=38) | p-Values | ||
|---|---|---|---|---|
| Gender | Male | 9 (45.0 %) | 11 (55.0 %) | 0.602a |
| Female | 29 (51.8 %) | 27 (48.2 %) | ||
| Age | Male | 38.55 ± 11.14 | 38.90 ± 6.81 | >0.05b |
| Female | 39.58 ± 11.73 | 36.22 ± 9.68 | ||
| FOXO1, ng/L | 9.10–38.64 | 10.53–70.87 | <0.05 c | |
| FOXP1, pg/mL | 220.95–1787.30 | 186.19–1795.56 | 0.139c | |
| FOXP2, ng/L | 20.50–220.89 | 8.39–292.39 | <0.05 c |
-
aChi-square test with n (%). bİndependent t-test (mean±standard deviation). cMann-Whitney Test (min-max values). Values in bold are statistically significant p<0.05.
Statistically significant differences were observed in TSH, fT4, Anti-TPO, Anti-Tg, and AST levels between the patient and control groups (p<0.001), reflecting the typical biochemical characteristics of HT. However, fT3, glucose, ALT, and creatinine levels showed no significant differences between the groups (p>0.05), suggesting that these parameters may not play a direct or substantial role in HT pathogenesis Table 2.
Comparison of TSH, fT4, fT3, Anti-TPO, Anti-Tg, glucose, ALT, AST, and creatinine values between HT and control groups.
| HT (n=31) | Control (n=33) | p-Values | ||
|---|---|---|---|---|
| TSH, µIU/Ml | Male | 13.70 ± 17.18 | 1.34 ± 0.26 | <0.001 a |
| Female | 13.59 ± 18.21 | 1.95 ± 0.73 | ||
| fT4, µg/dL | Male | 0.97 ± 0.24 | 1.23 ± 0.16 | <0.001 a |
| Female | 0.98 ± 0.23 | 1.15 ± 0.16 | ||
| fT3, pg/mL | Male | 2.89 ± 0.33 | 3.69 ± 0.46 | 0.084a |
| Female | 3.10 ± 0.67 | 3.14 ± 0.49 | ||
| Anti TPO, IU/mL | Male | 95.80 ± 68.67 | 11.44 ± 12.83 | <0.001 a |
| Female | 174.31 ± 176.16 | 8.41 ± 6.56 | ||
| Anti Tg, IU/mL | Male | 230.96 ± 268.19 | 16.20 ± 5.91 | <0.001 a |
| Female | 245.48 ± 208.29 | 15.15 ± 3.06 | ||
| Glucose, mg/dL | Male Female |
96.22 ± 17.41 | 98.90 ± 20.75 | 0.853a |
| 92.17 ± 9.26 | 89.22 ± 8.18 | |||
| ALT, U/L | Male Female |
33.22 ± 28.75 | 21.68 ± 7.85 | 0.090a |
| 17.92 ± 7.45 | 14.81 ± 6.30 | |||
| AST, U/L | Male Female |
26.66 ± 16.37 | 16.83 ± 3.65 | 0.005 a |
| 18.25 ± 4.15 | 16.00 ± 4.06 | |||
| Creatinine, mg/dL | Male Female |
0.87 ± 0.12 | 0.86 ± 0.90 | 0.603a |
| 0.66 ± 0.09 | 0.66 ± 0.98 |
-
aOne way ANOVA, with Tukey post-hoc test (mean ± standard deviation). Values in bold are statistically significant p<0.05.
Serum protein levels of FOXO1, FOXP1, and FOXP2
FOXO1 and FOXP2 serum protein levels were significantly lower in HT patients compared to healthy controls, suggesting that these transcription factors may have a suppressive role in HT pathogenesis. FOXO1 concentrations were 15.24 ± 6.63 in HT patients (CV: 43.51 %) and 29.16 ± 17.52 in controls (CV: 60.10 %), showing a significant reduction in the patient group (p<0.001). FOXP2 concentrations were 69.17 ± 39.80 in HT patients (CV: 57.54 %) and 101.93 ± 64.86 in controls (CV: 63.64 %), indicating a statistically significant decrease (p<0.001) (Table 1). FOXP1 levels did not show a significant difference between the two groups (856.63 ± 539.35 [CV: 62.95 %] in HT patients vs. 1,037.20 ± 512.12 [CV: 49.37 %] in controls; p=0.139) (Table 1), suggesting that FOXP1 may not be as influential in HT pathogenesis as FOXO1 and FOXP2 or may function through a different mechanism.
Diagnostic potential of FOXO1, FOXP1, and FOXP2 – ROC analysis
To assess the potential of these markers in distinguishing HT patients from healthy individuals, a ROC curve analysis was performed (Table 3 and Figure 1). FOXO1 exhibited strong diagnostic potential, with an AUC value of 0.798 (95 % CI: 0.699–0.898, p<0.001). This finding suggests that FOXO1 can effectively differentiate HT patients from healthy controls. The optimal cutoff value was determined as 10.59, with a specificity of 97.4 % and a sensitivity of 23.7 %, indicating that FOXO1 may serve as a robust biomarker for ruling out the disease, though it may not be sufficient for early diagnosis on its own. FOXP2 also demonstrated significant diagnostic potential, with an AUC value of 0.725 (95 % CI: 0.609–0.842, p<0.001). The optimal cutoff value was 48.80, yielding a specificity of 92.1 % and a sensitivity of 28.9 %, suggesting that low FOXP2 protein level is associated with HT. FOXP1 did not exhibit a statistically significant ability to distinguish HT from controls (AUC=0.589, 95 % CI: 0.459–0.718, p=0.184), supporting previous findings that FOXP1 may not have a direct role in HT pathogenesis. These findings indicate that FOXO1 and FOXP2, due to their high specificity, could serve as complementary biomarkers in HT diagnosis. However, their relatively low sensitivity suggests that they may not be sufficient for early detection and should be evaluated alongside other biochemical markers.
ROC analysis results, sensitivity, specificity for the success of FOXO1, FOXP1, and FOXP2 concentration values in HT disease prediction.
| FOXO1 | FOXP1 | FOXP2 | |
|---|---|---|---|
| AUC (95 % CI) | 0.798 (0.699–0.898) | 0.589 (0.459–0.718) | 0.725 (0.609–0.842) |
| p-Values | <0.001 | 0.184 | 0.001 |
| Cut-off | 10.59 | – | 48.80 |
| Sensitivity, % | 23.7 | – | 28.9 |
| Specificity, % | 97.4 | – | 92.1 |
-
Values in bold are statistically significant p<0.05. AUC, Area under the ROC curve; CI, confidence interval.
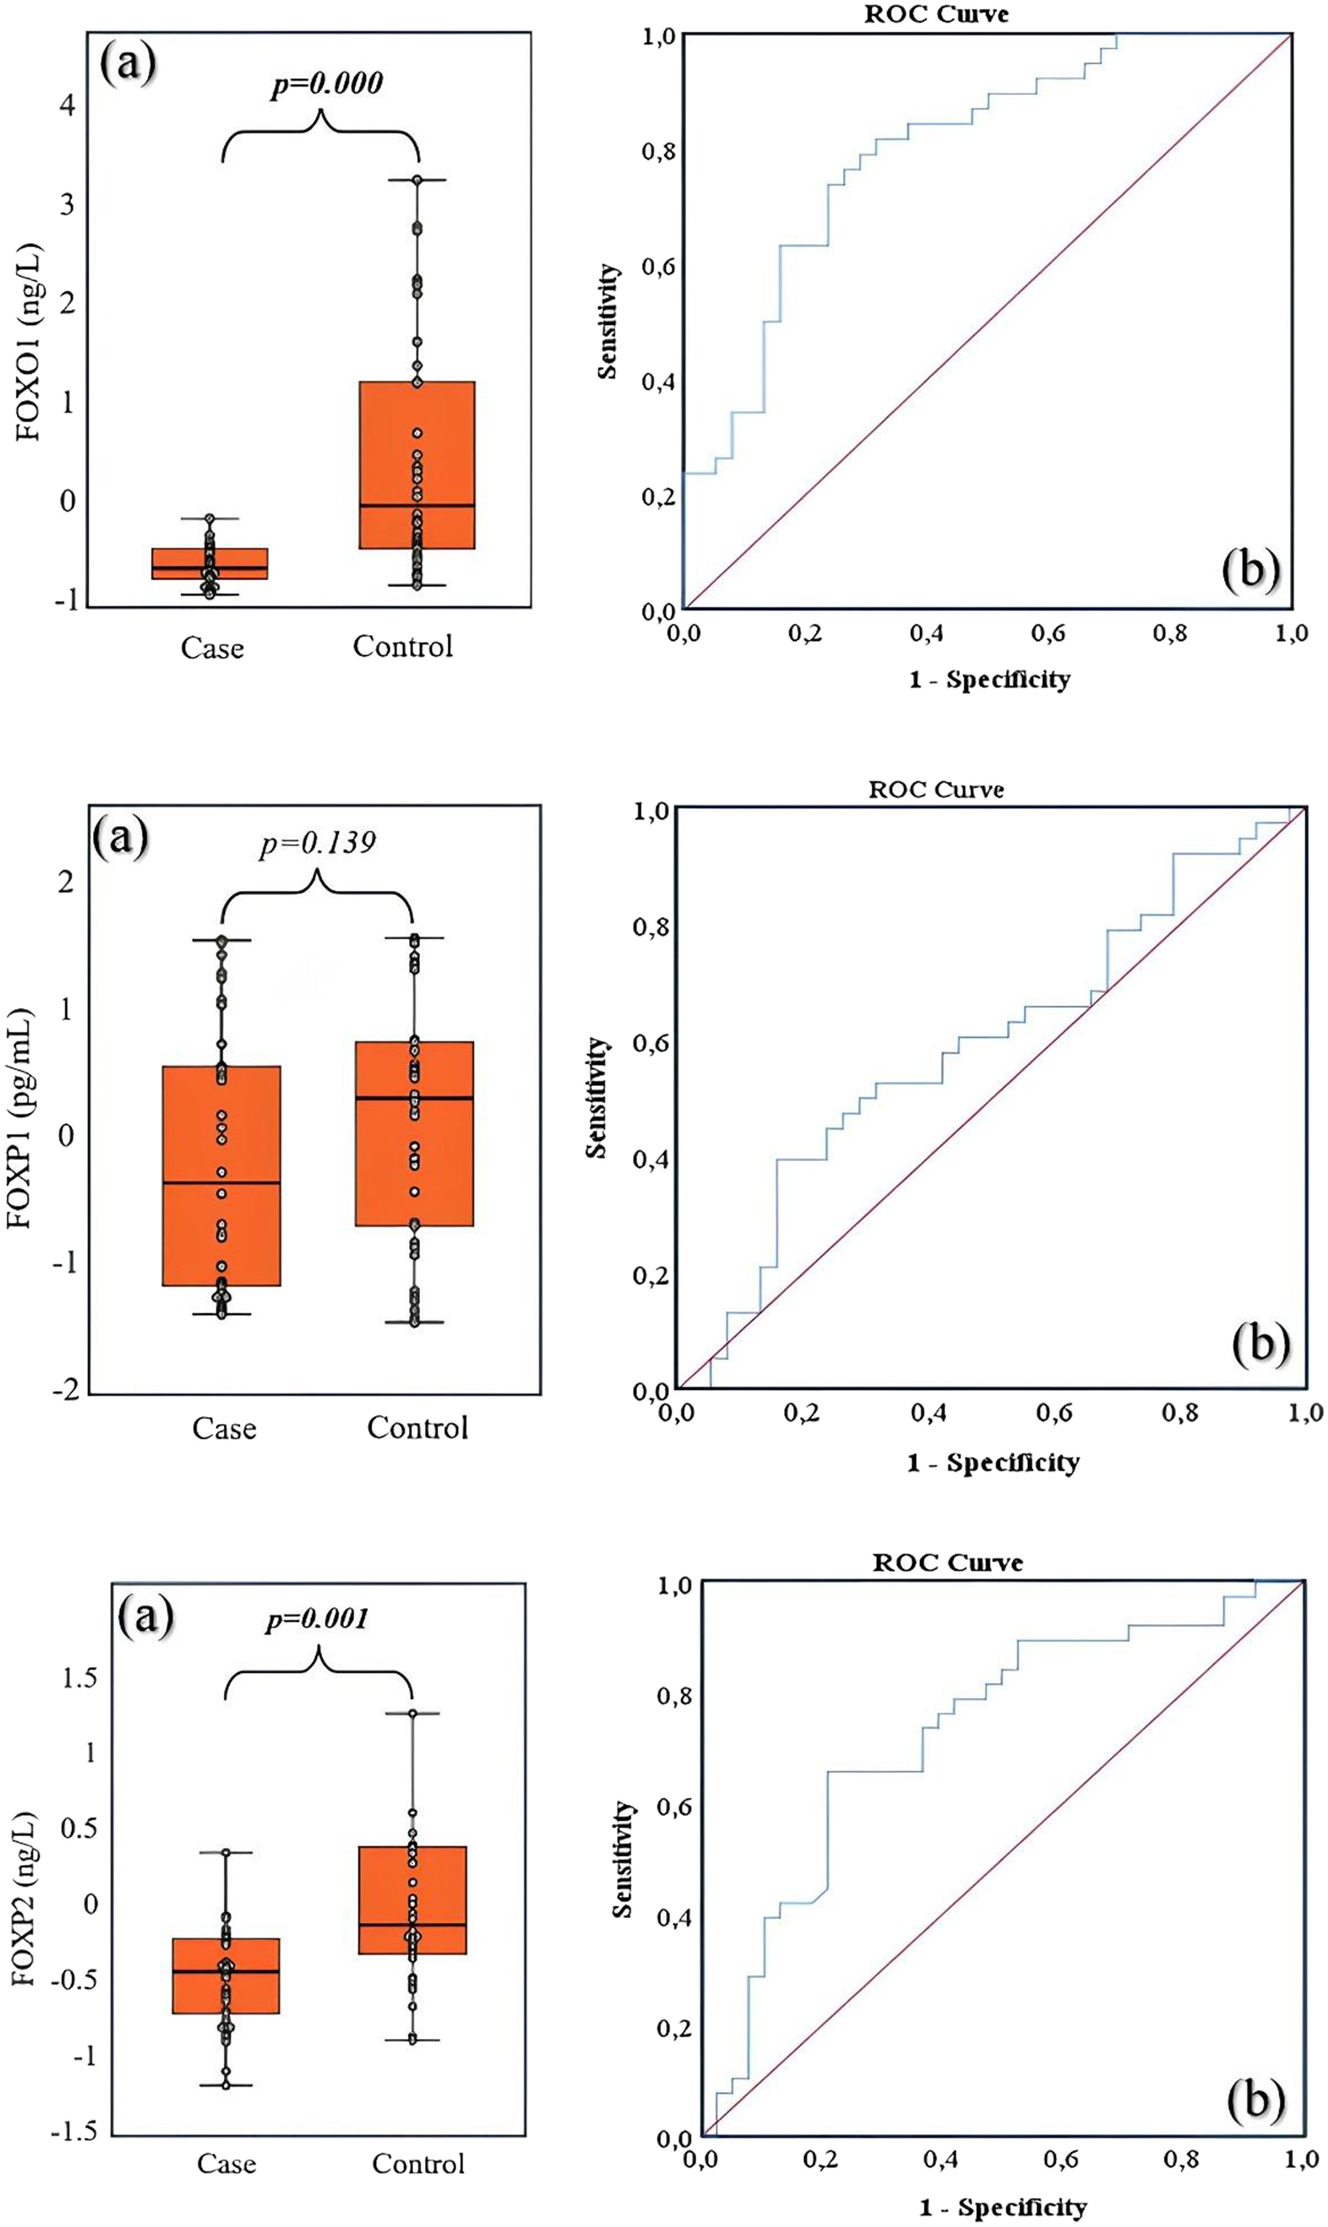
The boxplot displays the distribution of FOXO1, FOXP1 and FOXP2 concentration values between the case and control groups (a), the area under the ROC curve was calculated to discriminate between cases and controls based on FOXO1, FOXP1 and FOXP2 concentration values (b).
Correlation between FOXO1 and FOXP2 serum protein levels and disease progression
To further investigate the relationship between FOXO1 and FOXP2 levels, scatter plot analyses were performed (Figure 2). The scatter plot demonstrates the correlation between FOXO1 and FOXP2 levels, with individual data points grouped into two categories: case (HT patients, blue) and control (healthy individuals, red). The x-axis represents FOXP2 levels, while the y-axis represents FOXO1 levels. The majority of HT cases (blue dots) are clustered in the lower left region of the plot, indicating simultaneously reduced FOXO1 and FOXP2 protein level in HT patients. This suggests a potential downregulation of these transcription factors in HT pathogenesis. The control group (red dots) is more widely dispersed, with some individuals showing higher FOXO1 and FOXP2 levels. A notable portion of controls exhibit FOXP2 levels above 100, while such high expression values are less common in HT cases. The horizontal line at FOXO1˜40 appears to highlight a natural cutoff, as nearly all HT cases remain below this threshold, whereas some controls exceed it. Similarly, a FOXP2 value above 150 is predominantly seen in controls, reinforcing the idea that higher FOXP2 levels may be protective or indicative of normal thyroid function. The positive correlation between FOXO1 and FOXP2 is more evident in the control group, as individuals with high FOXP2 levels tend to have higher FOXO1 levels. In contrast, this correlation seems weaker in the HT group, where FOXO1 remains relatively low despite variations in FOXP2. This scatter plot suggests that FOXO1 and FOXP2 are significantly downregulated in HT patients, reinforcing their potential role as disease biomarkers. The relatively high specificity of these markers in the ROC analysis supports their utility in differentiating HT from healthy individuals.

Scatter plot analysis of FOXO1 and FOXP2 protein levels in patients and control groups.
Scatter plot and pearson correlation analysis of FOXO1, FOXP2, and thyroid markers in HT
The correlation analysis revealed significant associations among the examined biochemical markers and transcription factors. Specifically, TSH exhibited a strong negative correlation with fT4 (r= −0.569, p<0.001) and significant positive correlations with Anti-TPO (r=0.524, p<0.001) and Anti-Tg (r=0.382, p=0.001). Conversely, fT4 demonstrated significant negative correlations with Anti-TPO (r= −0.417, p<0.001) and Anti-Tg (r= −0.413, p<0.001), while displaying a positive correlation with FOXO1 (r=0.236, p=0.040). Additionally, a significant positive correlation was observed between Anti-TPO and Anti-Tg (r=0.424, p<0.001). Notably, Anti-Tg exhibited a significant negative correlation with FOXO1 (r= −0.304, p=0.010), suggesting a potential regulatory role of FOXO1 in thyroid autoimmunity. Among the transcription factors, FOXO1 showed strong positive correlations with FOXP2 (r=0.724, p<0.001) and FOXP1 (r=0.285, p=0.013), while FOXP2 also exhibited a significant positive correlation with FOXP1 (r=0.334, p=0.003). In contrast, AST did not demonstrate any statistically significant correlations with the other variables. To further investigate these relationships, scatter plots (Figure 3) and Pearson correlation analysis were utilized to examine the associations between FOXO1 and FOXP2 protein concentrations and the biochemical markers. While no significant linear correlations were identified between FOXP2 and the analyzed markers, FOXO1 exhibited noteworthy trends. A significant negative correlation was found between FOXO1 and Anti-Tg (r= −0.304, p=0.010), indicating that higher FOXO1 levels may be associated with lower Anti-Tg concentrations. Additionally, a clustering tendency of Anti-Tg and Anti-TPO at low FOXO1 levels suggests a potential role of FOXO1 in thyroid autoimmune processes. Furthermore, the significant positive correlation between FOXO1 and fT4 (r=0.236, p=0.040) implies that FOXO1 may contribute to the regulation of thyroid hormone levels. These findings are consistent with well-established patterns observed in autoimmune thyroid diseases such as HT. The expected inverse relationship between TSH and fT4 (r= −0.569, p<0.001) was confirmed, alongside the positive correlations between TSH and thyroid autoantibodies (Anti-TPO and Anti-Tg). While FOXP2 did not exhibit statistically significant correlations with thyroid function markers or autoimmune parameters, the results suggest that FOXO1 may play a more prominent role in thyroid hormone regulation and autoimmune mechanisms.

Scatter plot analysis of FOXO1 and FOXP2 with anti-Tg, TSH, fT4, Anti-TPO, and AST in HT.
In conclusion, when evaluated together with scatter plots and correlation analyses, it can be suggested that FOXO1 may play a role in thyroid autoimmunity and the regulation of thyroid hormones. In contrast, the relationship between FOXP2 and the examined markers appears to be less pronounced.
The boxplot analysis of thyroid markers in HT
Box plot analyses were conducted to compare the differences in serum levels of TSH, fT4, AST, anti-TPO, and anti-Tg between the case and control groups. The analysis results indicate statistically significant differences between the groups for each biomarker (p<0.001***) (Figure 4). TSH levels were significantly higher in the case group compared to the control group. The box plot reveals a broader range of TSH distribution in the case group, with several outliers. This finding may suggest the presence of hypothyroidism or thyroid dysfunction in the case group. fT4 levels were significantly lower in the case group compared to the control group. The box plot shows a narrower distribution of fT4 in the case group, with fewer outliers. This suggests reduced thyroid hormone production in the case group. AST levels were markedly higher in the case group compared to the control group. The box plot demonstrates a wide AST distribution in the case group, with several outliers. This finding may indicate impaired liver function or the presence of inflammatory processes in the case group. Anti-TPO levels were significantly higher in the case group compared to the control group. The box plot reveals a broad distribution of anti-TPO in the case group, with numerous outliers. Anti-Tg levels were also significantly higher in the case group compared to the control group. The box plot illustrates a wide distribution of anti-Tg in the case group, with several outliers. This finding can be interpreted as an indicator of thyroid autoimmunity. Overall, box plot analyses show that TSH, AST, anti-TPO, and anti-Tg levels are significantly higher in the case group, while free T4 levels are notably lower, indicating thyroid dysfunction and HT in the case group. Additionally, the increase in AST levels may be associated with the systemic effects of thyroid dysfunction or concomitant liver dysfunction.

The boxplot analysis of TSH, fT4, AST, anti-TPO, and anti-Tg levels between HT patients and control groups.
Bioinformatics-based analysis of the potential role of FOXs in immune regulation
Protein-protein interaction (PPI) network analysis revealed the functional roles of FOX family transcription factors in the modulation of immune regulation in Figure 5. The constructed network, consisting of 13 nodes and 23 edges, exhibits a statistically significant enrichment of interactions (PPI enrichment p=0.000517) compared to the expected 10 edges, highlighting the presence of biologically meaningful protein associations. With an average node degree of 3.54 and a local clustering coefficient of 0.762, the network demonstrates a highly interconnected structure with functionally relevant modules. Notably, FOXO1, FOXP1, and FOXP2 occupy central positions within the network, emphasizing their regulatory influence on immune-related processes through interactions with key proteins. The observed associations between FOX proteins and immune-regulatory factors, such as NFATC2, CTBP1, and FOXP3, suggest their involvement in critical immunological functions, including T cell activation, differentiation, and cytokine production. The interaction levels and homology scores of these proteins are given in Table 4. Additionally, the database called GeneMANIA was used to show the interaction between genes. This database is used to analyze genes bioinformatically based on the data available in the literature. According to the findings, the protein values of the FOXO1, FOXP1 and FOXP2 genes were examined bioinformatically before being examined and it was observed that they interacted with each other. In addition, it is seen that the FOXO1, FOXP1 and FOXP2 genes interact not only with each other but also with the genes indicated in Figure 6. Approximately 77.64 % physical interaction with these genes is noticeable. It was found that the genes also interacted in terms of co-expression and predicted properties. It has been concluded that FOXO1, FOXP1 and FOXP2 and the proteins they interact with play a role in alpha T cell differentiation involved in immune response to a high extent and are therefore associated with HT (Figure 7). In addition to group similarity, proteins located at 13 nodes and 23 edges share similar properties in biological pathways such as alpha-beta T cell differentiation, CD4-positive alpha-beta T cell differentiation, and T helper cell differentiation.
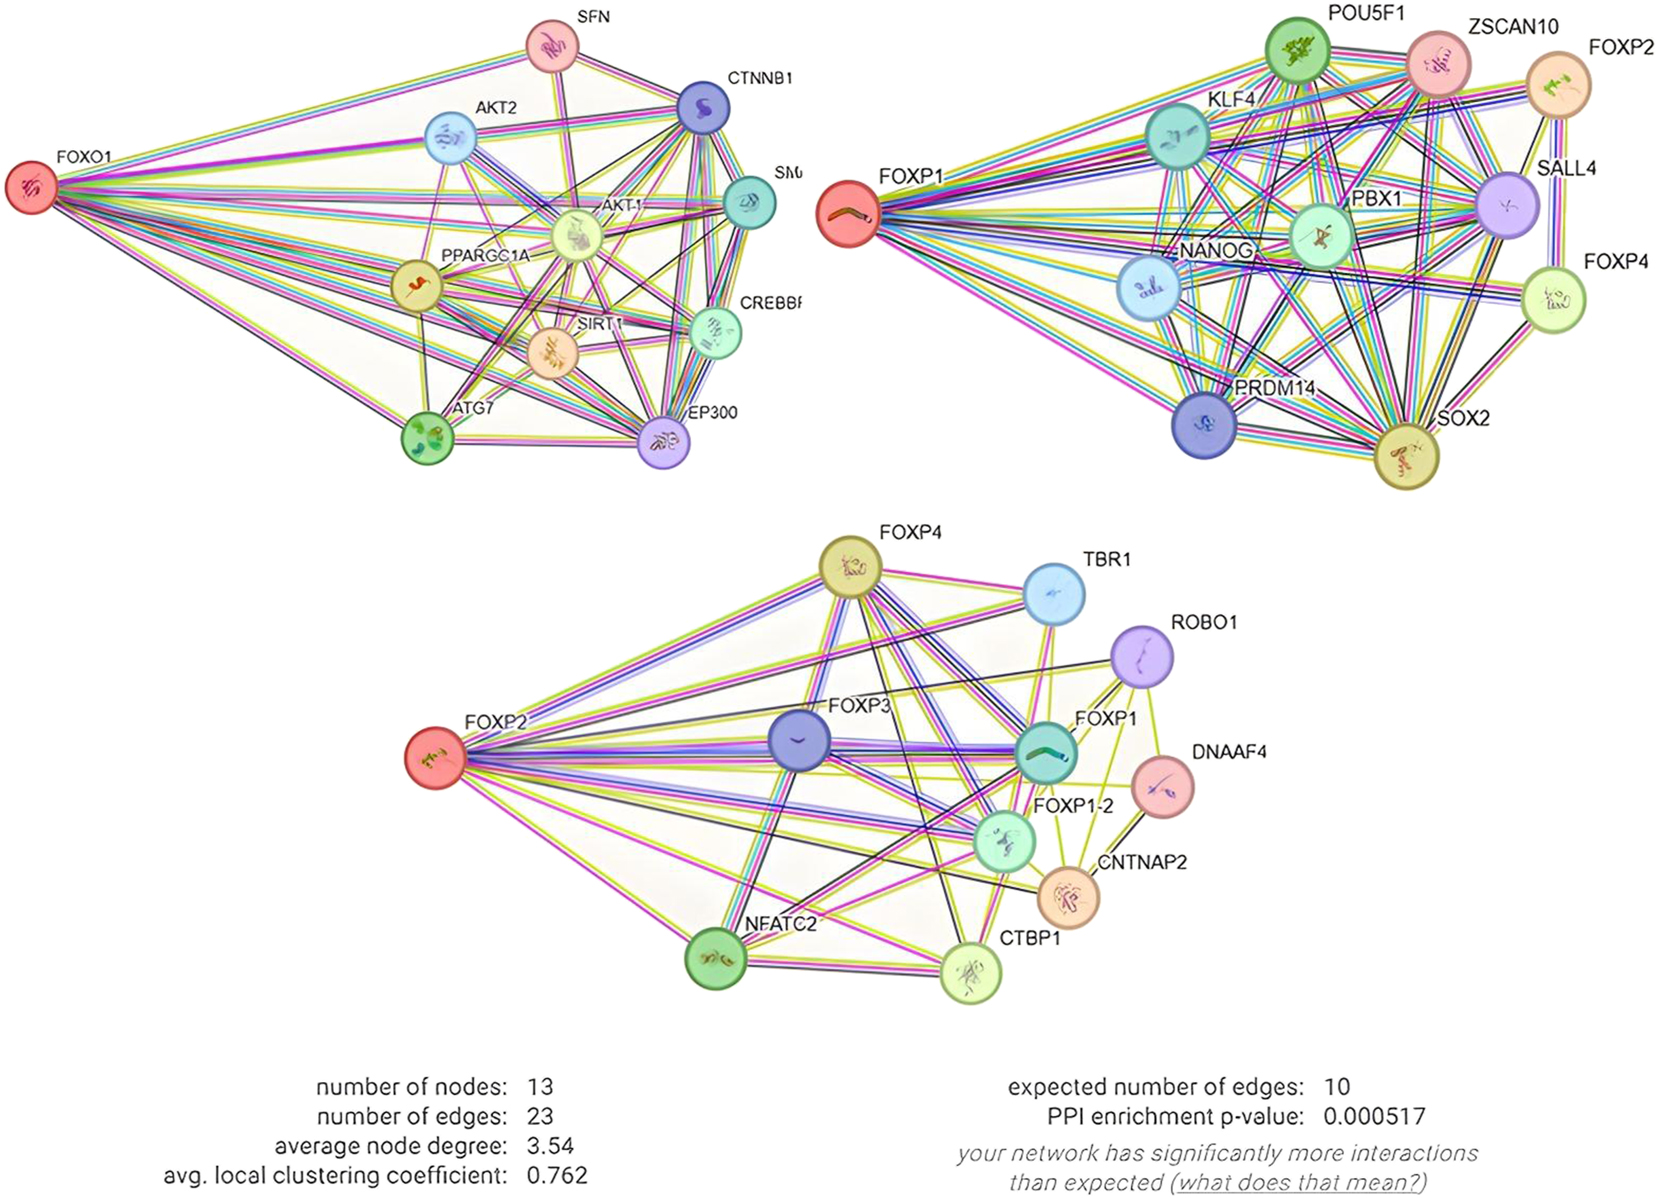
PPI interactions of FOXO1, FOXP1 and FOXP2 proteins with each other and other proteins.
Homology scores of PPI interactions of FOXO1, FOXP1 and FOXP2 proteins with each other and with other proteins.
| Node1 | Node2 | Node1 annotation | Node2 annotation | Score |
|---|---|---|---|---|
| FOXP2 | CNTNAP2 | Forkhead box protein P2 | Contactin-associated protein-like 2 | 0.977 |
| NLK | FOXO1 | Serine/threonine-protein kinase | Forkhead box protein O1 | 0.964 |
| FOXP4 | FOXP2 | Forkhead box protein P4 | Forkhead box protein P2 | 0.952 |
| FOXP2 | FOXP1 | Forkhead box protein P2 | Forkhead box P1 | 0.897 |
| FOXP4 | FOXP1 | Forkhead box protein P4 | Forkhead box P1 | 0.867 |
| TBR1 | FOXP2 | T-box brain protein 1 | Forkhead box protein P2 | 0.861 |
| FOXO1 | CITED2 | Forkhead box protein O1 | Cbp/p300-interacting transactivator 2 | 0.816 |
| ZSCAN10 | FOXP1 | Zinc finger and SCAN domain-containing protein 10 | Forkhead box P1 | 0.813 |
| MAPKAPK5 | FOXO1 | MAP kinase-activated protein kinase 5 | Forkhead box protein O1 | 0.779 |
| SATB1 | FOXP1 | DNA-binding protein SATB1 | Forkhead box P1 | 0.731 |
| TBR1 | FOXP1 | T-box brain protein 1 | Forkhead box P1 | 0.707 |
| FOXP1 | CNTNAP2 | Forkhead box P1 | Contactin-associated protein-like 2 | 0.646 |
| SATB1 | FOXO1 | DNA-binding protein SATB1 | Forkhead box protein O1 | 0.633 |
| FOXP2 | CITED2 | Forkhead box protein P2 | Cbp/p300-interacting transactivator 2 | 0.631 |
| TBR1 | SATB1 | T-box brain protein 1 | DNA-binding protein SATB1 | 0.558 |
| FOXP1 | FOXO1 | Forkhead box P1 | Forkhead box protein O1 | 0.517 |
| SRPX2 | FOXP2 | Sushi repeat-containing protein SRPX2 | Forkhead box protein P2 | 0.511 |
| TBR1 | FOXP4 | T-box brain protein 1 | Forkhead box protein P4 | 0.478 |
| SRPX2 | FOXP4 | Sushi repeat-containing protein SRPX2 | Forkhead box protein P4 | 0.466 |
| SRPX2 | FOXP1 | Sushi repeat-containing protein SRPX2 | Forkhead box P1 | 0.447 |
| SRPX2 | CNTNAP2 | Sushi repeat-containing protein SRPX2 | Contactin-associated protein-like 2 | 0.422 |
| ZNF534 | FOXP1 | Zinc finger protein 534 | Forkhead box P1 | 0.416 |
| FOXP2 | FOXO1 | Forkhead box protein P2 | Forkhead box protein O1 | 0.411 |

Interaction of FOXO1, FOXP1 and FOXP2 genes with each other and other genes in HT.

Demonstration of the roles of FOXO1, FOXP1 and FOXP2 proteins and their associated proteins in biological processes according to gene ontology.
Discussion
HT is an autoimmune endocrine disorder that damages the thyroid [23]. FOX family proteins have been associated with many diseases ranging from immunological defects [24]. No study involving HT and these proteins was found in the literature. In this study, FOXO1, FOXP1, and FOXP2 protein levels were investigated between HT and control groups. The results showed that there was a statistically significant decrease in FOXO1 and FOXP2 protein levels in HT patients compared with the control group. However, no significant difference was detected in the concentration values between the FOXP1 group. Limitations of the study include the small sample size of individuals in the study groups. In addition, tissue-based studies should be conducted in addition to examining FOX proteins circulating in the blood. The possibility that the half-life of the proteins included in the study may be low should also be taken into consideration. Additionally, detection of FOXO1, FOXP1, and FOXP2 proteins in serum by ELISA requires further analysis as to whether they are merely a consequence of cell death or part of an active biological process.
HT is the most common autoimmune disease in female patients between 45 and 60 years of age compared to male patients [25]. In our study, we found that the proportion of women in HT patients was 51.8 % and the proportion of men was 45 %. In our results, we found the mean age of HT patients to be 39.58 ± 11.73 years. According to our findings, no significance was observed between gender and HT. FOXs play an important role in maintaining cellular processes. In addition, many processes such as growth, development, differentiation and migration of cells are controlled by FOXs [24]. FOXO1 has been described as a transcription factor as it modulates numerous metabolic pathways such as cell cycle arrest and metabolic immunoregulation, as well as being involved in apoptosis and autophagy [26], 27]. In addition, various upstream signalling factors interact with the FOXO1 protein to form signalling pathways that regulate the transcriptional activity of FOXO1 in biological processes [28]. FOXO1 plays a critical role in maintaining tissue homeostasis and responding to various stimuli, making it a potential key target for disease treatment and prevention due to its widespread endogenous expression. However, the regulatory mechanisms of its post-transcriptional modifications and the clinical relevance of FOXO1 in disease remain unclear and sometimes contradictory [29]. According to a study on FOXO1, it was investigated whether hepatic gluconeogenic genes are mediated by thyroid hormone. FOXO1 is known to transcriptionally regulate phosphoenolpyruvate carboxykinase 1 (PCK1) and glucose-6-phosphatase catalytic subunit 1 (G6PC) genes. However, the thyroid hormone-mediated mechanism of the effect of FOXO1 has not been investigated. It was reported that FOXO1 activates PCK1 and G6PC via thyroid hormone and FOXO1 deacetylation is required. This showed that thyroid hormone-mediated deacetylation of FOXO1 is metabolically effective for cellular energy balance [30], 31]. FOXO1 has been proven to play an important role in the control of thyroid cells by insulin-like growth factor 1 (IGF-1) and TSH. FOXO1 is known to regulate p27KIP1 expression in undifferentiated thyroid cells and tumour cells. It has been pointed out that a decrease in FOXO1 expression promotes the proliferation of thyroid cancer cells. Accordingly, it has been revealed that FOXO1 has a tumour suppressor role on thyroid cancer [32]. It has also been reported that Sirtuin 1 (SIRT1)-mammalian target of rapamycin complex 2 (MTORC2)- Protein kinase B (AKT)-mediated signalling of thyroid hormone activates FOXO1. Accordingly, it has been proved once again that thyroid hormone regulates metabolic pathways through FOXO1 [33]. One study investigated the role of necdin on FOXO1 in the thyroid axis. In vivo and in vitro analyses showed that necdin regulates thyroid function via FOXO1 and controls it by decreasing the acetylation of FOXO1 in hypothalamic arcuate neurons [34]. FOXO1 has been noted to be downregulated in papillary thyroid cancer. This regulation has been reported to favour the development and proliferation of papillary thyroid cancer cells by inactivating the AKT/FOXO1/Bim pathway [35]. FOXO1 plays a role in activating dendritic cells (DCs) by regulating target genes. Levels of inflammatory cytokines increase via FOXO1. FOXO1 is inhibited to prevent the inflammatory response that occurs when mTOR and AKT pathways are activated. DCs increase in thyroid-infiltrating cells in HT. Conversely, FOXO1 and FOXO3 can inhibit T cell activation [36], 37]. It is known that DCs, which are associated with increased inflammation in HT, play a role in HT due to increased FOXO1. In our study, FOXO1 levels were observed to be decreased. These contradictory data are thought to be mediated by different mechanisms independent of inflammation. It is also predicted that the decrease in FOXO1 may be necessary for the activation of T cells. Despite this, there may be different reasons for the decrease in protein levels in the blood. In other words, protein half-life should be evaluated. If it is thought to be a marker, it is necessary to examine from which source and to what extent FOXO1 is released and protein half-life. With these thoughts, it is necessary to compare treated patient groups in HT patients who have not received any treatment to examine whether FOXO1 is involved in the development of the disease. In addition, mutational status of FOX proteins should be examined to reveal possible mechanisms that may predispose to the disease. In this case, when Single nucleotide polymorphisms (SNPs) belonging to the FOXO3a gene, another FOXO family member, were evaluated, it was determined that it could create a predisposition to HT [38]. FOXP1 was studied in Graves’ disease, a thyroid-related autoimmune disorder characterized by hyperthyroidism. FOXP1 expression was negatively correlated with thyroid stimulating hormone receptor antibody (TRAb) levels in Graves’ disease patients [39]. The amount of FOXP1 increases throughout DC maturation. Silencing FOXP1 in DCs decreases the expression of T cell and cytokines responses [40]. FOXP1 controls the growth of follicular helper and regulatory T-cells, maintains memory potential, and inhibits spontaneous T-cell activation [41]. While DCs should increase following FOXP1 upregulation, the fact that FOXP1 protein levels are low supports the idea that T cell activation plays a role in the development of HT. It has been found that FOXP2 expression is associated with the infiltration of immune cells. Accordingly, when FOXP2 is downregulated, it causes a decrease in DCs and immune escape on tumors [42]. Unlike FOXP2, FOXP3 was analyzed in a study involving patients with hyperthyroidism and healthy individuals. FOXP3 gene expression was found to be lower in individuals with toxic multinodular goitre and Graves’ disease compared to the control group. It was noted that FOXP3 gene expression increased in parallel with radioactive iodine-131 (RAI-131) treatment [43]. Despite the insufficient data on FOXP2 in autoimmune thyroid disorders, it is predicted that although the low protein levels of FOXP2 obtained are not significant, this decrease may cause an increase in the immune response and thyroid destruction.
Conclusions
FOX family proteins are thought to be associated with HT. It has been predicted that low serum protein levels of FOXO1 and FOXP2 in HT patients may be associated with this disease. Detailed and methodologically intensive studies on HT and FOXs are needed.
-
Research ethics: Ethics committee approval was obtained from Sivas Cumhuriyet University Non-Interventional Clinical Research Ethics Committee with decision number 2022-01/06.
-
Informed consent: Written informed consent forms were obtained from patients who agreed to participate in the study.
-
Author contributions: All authors have accepted responsibility for the entire content of this manuscript and approved its submission.
-
Use of Large Language Models, AI and Machine Learning Tools: None declared.
-
Conflict of interest: Authors state no conflict of interest.
-
Research funding: None declared.
-
Data availability: Not applicable.
References
1. Johnston, DE, Kaplan, MM. Pathogenesis and treatment of gallstones. N Engl J Med 1993;328:412–21. https://doi.org/10.1056/nejm199302113280608.Search in Google Scholar PubMed
2. Unamuno, X, Gómez‐Ambrosi, J, Rodríguez, A, Becerril, S, Frühbeck, G, Catalán, V. Adipokine dysregulation and adipose tissue inflammation in human obesity. Eur J Clin Invest 2018;48:e12997. https://doi.org/10.1111/eci.12997.Search in Google Scholar PubMed
3. Scognamiglio, G, Gamberini, E, Agnoletti, V, Coccolini, F. Diagnosis and treatment of the abdominal compartment syndrome. Compartment Syndr 2021:63–79. https://doi.org/10.1007/978-3-030-55378-4_7.Search in Google Scholar
4. Buechler, C, Feder, S, Haberl, EM, Aslanidis, C. Chemerin isoforms and activity in obesity. Int J Mol Sci 2019;20:1128. https://doi.org/10.3390/ijms20051128.Search in Google Scholar PubMed PubMed Central
5. Radetti, G. Clinical aspects of Hashimoto’s thyroiditis. Paediatr Thyroidol 2014;26:158–70. https://doi.org/10.1159/000363162.Search in Google Scholar PubMed
6. Cianci, P, Tartaglia, N, Fersini, A, Capuzzolo, S, Giambavicchio, LL, et al.. Acute cholecystitis: diagnostic pitfall and timing of treatment. In: Updates in gallbladder diseases. London: Intech Open; 2017:23–45 pp.10.5772/67549Search in Google Scholar
7. Aktas, G, Sit, M, Dikbas, O, Tekçe, BK, Savli, H, Tekçe, H, et al.. Could red cell distribution width be a marker in Hashimoto’s thyroiditis? Exp Clin Endocrinol Diabetes 2014;122:572–4. https://doi.org/10.1055/s-0034-1383564.Search in Google Scholar PubMed
8. Aktas, G, Sit, M, Dikbas, O, Erkol, H, Altinordu, R, Erkus, E, et al.. Elevated neutrophil-to-lymphocyte ratio in the diagnosis of Hashimoto’s thyroiditis. Rev Assoc Méd Bras 2017;63:1065–8. https://doi.org/10.1590/1806-9282.63.12.1065.Search in Google Scholar PubMed
9. Kurtkulagi, O, Tel, BMA, Kahveci, G, Bilgin, S, Duman, TT, Ertürk, A, et al.. Hashimoto’s thyroiditis is associated with elevated serum uric acid to high density lipoprotein-cholesterol ratio. Rom J Intern Med 2021;59:403–8. https://doi.org/10.2478/rjim-2021-0023.Search in Google Scholar PubMed
10. Duman, TT, Erge, E, Tel, BMA, Kiziltunc, C, Aktas, G. De Ritis score as an inflammatory marker in Hashimoto’s thyroiditis. Precision Medical. Sciences 2023;12:242–6. https://doi.org/10.1002/prm2.12114.Search in Google Scholar
11. Afsin, H, Aktas, G. Platelet to lymphocyte and neutrophil to lymphocyte ratios are useful in differentiation of thyroid conditions with normal and increased uptake. Ethiop J Health Dev 2021;35.Search in Google Scholar
12. Demirkol, ME, Aktas, G. C‐reactive protein to LymphocytE count ratio could be a reliable mArkeR of thyroiditis; the CLEAR‐T study. Precis Med Sci 2022;11:31–4. https://doi.org/10.1002/prm2.12065.Search in Google Scholar
13. Han, C, Guo, L, Sheng, Y, Yang, Y, Wang, J, Gu, Y, et al.. FoxO1 regulates TLR4/MyD88/MD2‐NF‐κB inflammatory signalling in mucosal barrier injury of inflammatory bowel disease. J Cell Mol Med 2020;24:3712–23. https://doi.org/10.1111/jcmm.15075.Search in Google Scholar PubMed PubMed Central
14. Fu, Z, Tindall, DJ. FOXOs, cancer and regulation of apoptosis. Oncogene 2008;27:2312–19. https://doi.org/10.1038/onc.2008.24.Search in Google Scholar PubMed PubMed Central
15. Lapierre, LR, Kumsta, C, Sandri, M, Ballabio, A, Hansen, M. Transcriptional and epigenetic regulation of autophagy in aging. Autophagy 2015;11:867–80. https://doi.org/10.1080/15548627.2015.1034410.Search in Google Scholar PubMed PubMed Central
16. Edmonds, JW, Prasain, JK, Dorand, D, Yang, Y, Hoang, HD, Vibbert, J, et al.. Insulin/FOXO signaling regulates ovarian prostaglandins critical for reproduction. Dev Cell 2010;19:858–71. https://doi.org/10.1016/j.devcel.2010.11.005.Search in Google Scholar PubMed PubMed Central
17. Dong, XY, Chen, C, Sun, X, Guo, P, Vessella, RL, Wang, RX, et al.. FOXO1A is a candidate for the 13q14 tumor suppressor gene inhibiting androgen receptor signaling in prostate cancer. Cancer Res 2006;66:6998–7006. https://doi.org/10.1158/0008-5472.can-06-0411.Search in Google Scholar
18. Benayoun, BA, Caburet, S, Veitia, RA. Forkhead transcription factors: key players in health and disease. Trends Genet 2011;27:224–32. https://doi.org/10.1016/j.tig.2011.03.003.Search in Google Scholar PubMed
19. Jonklaas, J, Bianco, AC, Bauer, AJ, Burman, KD, Cappola, AR, Celi, FS, et al.. Guidelines for the treatment of hypothyroidism: prepared by the American thyroid association task force on thyroid hormone replacement. Thyroid 2014;24:1670–751. https://doi.org/10.1089/thy.2014.0028.Search in Google Scholar PubMed PubMed Central
20. Pearce, SHS, Brabant, G, Duntas, LH, Monzani, F, Peeters, RP, Razvi, S, et al.. 2013 ETA guidelines: management of subclinical hypothyroidism. Eur Thyroid J 2013;2:215–28. https://doi.org/10.1159/000356507.Search in Google Scholar PubMed PubMed Central
21. Warde-Farley, D, Donaldson, SL, Comes, O, Zuberi, K, Badrawi, R, Chao, P, et al.. The GeneMANIA prediction server: biological network integration for gene prioritization and predicting gene function. Nucleic Acids Res 2010;38:W214–20. https://doi.org/10.1093/nar/gkq537.Search in Google Scholar PubMed PubMed Central
22. Madrid, NY, Giraldo, LJM. Role of gene interactions in the pathophysiology of skeletal dysplasias: a case report in Colombia. J Genet Eng Biotechnol 2024;22:100350. https://doi.org/10.1016/j.jgeb.2023.100350.Search in Google Scholar PubMed PubMed Central
23. Pergjini, BM. General population attitudes and knowledge of Hashimoto’s disease [Doctoral dissertation]. Split: University of Split. School of Medicine; 2024.Search in Google Scholar
24. Hannenhalli, S, Kaestner, KH. The evolution of Fox genes and their role in development and disease. Nat Rev Genet 2009;10:233–40. https://doi.org/10.1038/nrg2523.Search in Google Scholar PubMed PubMed Central
25. Uncu, G. Hashimoto tiroiditinde HDL ile ilişkili miyeloperoksidaz (MPO) ve paraoksonaz1in (PON1) koroner arter hastalığı ile ilişkisi [Master’s thesis]. Çorum: Hitit Üniversitesi Fen Bilimleri Enstitüsü; 2020Search in Google Scholar
26. Murtaza, G, Khan, AK, Rashid, R, Muneer, S, Hasan, SMF, Chen, J. FOXO transcriptional factors and long‐term living. Oxid Med Cell Longev 2017;2017:3494289. https://doi.org/10.1155/2017/3494289.Search in Google Scholar PubMed PubMed Central
27. Wang, S, Xia, P, Huang, G, Zhu, P, Liu, J, Ye, B, et al.. FoxO1-mediated autophagy is required for NK cell development and innate immunity. Nat Commun 2016;7:11023. https://doi.org/10.1038/ncomms11023.Search in Google Scholar PubMed PubMed Central
28. Wang, Y, Zhou, Y, Graves, DT. FOXO transcription factors: their clinical significance and regulation. BioMed Res Int 2014;2014:925350. https://doi.org/10.1155/2014/925350.Search in Google Scholar PubMed PubMed Central
29. Kandula, V, Kosuru, R, Li, H, Yan, D, Zhu, Q, Lian, Q, et al.. Forkhead box transcription factor 1: role in the pathogenesis of diabetic cardiomyopathy. Cardiovasc Diabetol 2016;15:1–12. https://doi.org/10.1186/s12933-016-0361-1.Search in Google Scholar PubMed PubMed Central
30. Singh, BK, Sinha, RA, Zhou, J, Xie, SY, You, SH, Gauthier, K, et al.. FoxO1 deacetylation regulates thyroid hormone-induced transcription of key hepatic gluconeogenic genes. J Biol Chem 2013;288:30365–72. https://doi.org/10.1074/jbc.m113.504845.Search in Google Scholar PubMed PubMed Central
31. Gross, DN, Wan, M, Birnbaum, MJ. The role of FOXO in the regulation of metabolism. Curr Diabetes Rep 2009;9:208–14. https://doi.org/10.1007/s11892-009-0034-5.Search in Google Scholar PubMed
32. Zaballos, MA, Santisteban, P. FOXO1 controls thyroid cell proliferation in response to TSH and IGF-I and is involved in thyroid tumorigenesis. Mol Endocrinol 2013;27:50–62. https://doi.org/10.1210/me.2012-1032.Search in Google Scholar PubMed PubMed Central
33. Singh, BK, Sinha, RA, Zhou, J, Tripathi, M, Ohba, K, Wang, ME, et al.. Hepatic FOXO1 target genes are co-regulated by thyroid hormone via RICTOR protein deacetylation and MTORC2-AKT protein inhibition. J Biol Chem 2016;291:198–214. https://doi.org/10.1074/jbc.m115.668673.Search in Google Scholar PubMed PubMed Central
34. Hasegawa, K, Kawahara, T, Fujiwara, K, Shimpuku, M, Sasaki, T, Kitamura, T, et al.. Necdin controls Foxo1 acetylation in hypothalamic arcuate neurons to modulate the thyroid axis. J Neurosci 2012;32:5562–72. https://doi.org/10.1523/jneurosci.0142-12.2012.Search in Google Scholar
35. Song, HM, Song, JL, Li, DF, Hua, KY, Zhao, BK, Fang, L. Inhibition of FOXO1 by small interfering RNA enhances proliferation and inhibits apoptosis of papillary thyroid carcinoma cells via Akt/FOXO1/Bim pathway. OncoTargets Ther 2015:3565–73. https://doi.org/10.2147/ott.s95395.Search in Google Scholar
36. Ramos-Leví, AM, Marazuela, M. Pathogenesis of thyroid autoimmune disease: the role of cellular mechanisms. Endocrinol Nutr 2016;63:421–9. https://doi.org/10.1016/j.endoen.2016.09.005.Search in Google Scholar
37. Chistiakov, DA. Immunogenetics of Hashimoto’s thyroiditis. J Autoimmune Dis 2005;2:1–21. https://doi.org/10.1186/1740-2557-2-1.Search in Google Scholar PubMed PubMed Central
38. Roehlen, N, Doering, C, Hansmann, ML, Gruenwald, F, Vorlaender, C, Bechstein, WO, et al.. Vitamin D, FOXO3a, and Sirtuin1 in hashimoto’s thyroiditis and differentiated thyroid cancer. Front Endocrinol;20189:527. https://doi.org/10.3389/fendo.2018.00527.Search in Google Scholar PubMed PubMed Central
39. Liu, Y, Zou, J, Xu, J, Wang, X, Xing, J, Wang, L, et al.. Comprehensive analysis of lncRNA expression profile and the potential role of ENST00000604491 in Graves’ disease. J Immunol Res 2022;2022:8067464. https://doi.org/10.1155/2022/8067464.Search in Google Scholar PubMed PubMed Central
40. Guo, Z, Tao, Y, Yin, S, Song, Y, Lu, X, Li, X, et al.. The transcription factor Foxp1 regulates the differentiation and function of dendritic cells. Mech Dev 2019;158:103554. https://doi.org/10.1016/j.mod.2019.05.001.Search in Google Scholar PubMed
41. Kaminskiy, Y, Kuznetsova, V, Kudriaeva, A, Zmievskaya, E, Bulatov, E. Neglected, yet significant role of FOXP1 in T-cell quiescence, differentiation and exhaustion. Front Immunol 2022;13:971045. https://doi.org/10.3389/fimmu.2022.971045.Search in Google Scholar PubMed PubMed Central
42. French, JD, Kotnis, GR, Said, S, Raeburn, CD, McIntyre, RCJr., Klopper, JP, et al.. Programmed death-1+ T cells and regulatory T cells are enriched in tumor-involved lymph nodes and associated with aggressive features in papillary thyroid cancer. J Clin Endocrinol Metabol 2012;97:E934–43. https://doi.org/10.1210/jc.2011-3428.Search in Google Scholar PubMed PubMed Central
43. Khalaf, ZA, Jasim, HM, Mahdi, AA. FOXP3 and IL-10 overexpression: a novel diagnostic biomarker in Iraqi patients having hyperthyroidism treated with radioactive iodine. Gene Reports 2021;25:101384. https://doi.org/10.1016/j.genrep.2021.101384.Search in Google Scholar
© 2025 the author(s), published by De Gruyter, Berlin/Boston
This work is licensed under the Creative Commons Attribution 4.0 International License.