
Oxidative stress and response of antioxidant system in Nostoc muscorum exposed to different forms of Zinc
-
Sadaf Mahfooz


Abstract
Objective
Present study aims to evaluate oxidative stress-mediated toxicity mechanisms of nano-ZnO (N-ZnO) compared to ZnCl2 and bulk-ZnO (M-ZnO), using cyanobacterium as a toxicity assessment tool.
Methods
Nostoc muscorum was used as a test organism and the experiments were performed in parallels after treated with 2–128 μM of N-ZnO, M-ZnO, and ZnCl2.
Results
Low concentrations of ZnCl2 (2–8 μM) and N-ZnO (16–32 μM) led to a significant increase in the carotenoids, which could be ascribed to its role as an antioxidant, whereas higher concentrations were inhibitory to the photosynthetic pigments. Enhanced activities of superoxide dismutase (SOD), peroxidase (POD) and accelerated lipid peroxidation depicted significant accumulation of superoxide and peroxide radicals in N. muscorum exposed to N-ZnO and ZnCl2. The non-enzymatic antioxidants such as proline and total phenols also showed enhanced accumulations up to 16 and 64 μM of ZnCl2 and N-ZnO treatment, respectively.
Conclusion
Our results for the very first time depicted the significant accumulation of stress biomarkers in N. muscorum in response to deleterious effects of oxidative stress caused by N-ZnO, ZnCl2, and M-ZnO. Present results revealed varying levels of toxicity of various forms of zinc, which decreased in an order of ZnCl2>N-ZnO>M-ZnO.
Özet
Amaç
Bu çalışmada, toksisite değerlendirme aracı olarak siyanobakteri kullanarak ZnCl2 ve bulk-ZnO (M-ZnO) ile karşılaştırıldığında, nano-ZnO‘in (N-ZnO) oksidatif stres aracılı toksisite mekanizmasını değerlendirmeyi amaçladık.
Yöntemler
Bir test organizması olarak Nostoc muscorum kullanımıştır, deneyler parallel olarak 2–128 μM N-ZnO, M-ZnO ve ZnCl2 ile muamele edildikten sonra gerçekleştirilmiştir.
Bulgular
Düşük konsantrasyonda ZnCl2 (2–8 μM) ve N-ZnO (16–32 μM) antioksidan rolünü destekleyen bir şekilde, karotenoidlerde belirgin bir artış göstermiştir, bunun yanısıra daha yüksek konsantrasyonlar fotosentetik pigmentleri inhibe etmiştir. Süperoksit dismutaz (SOD), peroksidaz (POD) aktivitelerindeki artış ve hızlandırılmış lipit peroksidasyonu, N-ZnO ve ZnCl2‘ye maruz bırakılan N. muscorum‘da süperoksit ve peroksit radikallerinin önemli bir birikimine işaret etmiştir. 16 μM ZnCl2 ve 64 μM N-ZnO uygulamaları sonucunda Prolin ve toplam fenoller gibi enzimatik olmayan antioksidanlarda da yüksek birikimler gösterilmiştir.
Sonuç
Bu çalışmanın sonuçları ilk kez, N-ZnO, ZnCl2 ve M-ZnO‘nun neden olduğu zararlı etkilere yanıt olarak N. muscorum‘da oksidatif stres biyobelirteçlerinin önemli birikiminin olduğunu göstermiştir. Mevcut sonuçlar ZnCl2>N-ZnO>M-ZnO sıralamasında, çeşitli çinko formlarının, düşen toksisitesinin seviyelerini ortaya koymuştur.
Introduction
Our environment is being routinely exposed to a variety of contaminants including heavy metals due to unrestricted developmental activities, which might pose a serious threat to our ecosystem [1]. Besides these heavy metal contaminants, the rapid expansion of nanotechnology has also resulted in the subsequent significant release of nanoparticles (NPs) into the aquatic environment during the cycle of manufacturing, transportation, consumption, and disposal [2]. Amongst all the known heavy metal and metal nanoparticles, zinc oxide nanoparticles (ZnO NPs) have gained great attention in recent years due to its wide application for both industrial and household applications [3]. They are widely used as UV-absorbers, catalyst and nanosensors due to their unique optical, catalytic, semiconducting, piezoelectric, and magnetic properties [4]. In the presence of excessive amounts of metals, the toxicity symptoms appear as a result of interactions at the cellular/molecular level. The scale of the problem has prompted the search for effective and reliable ways of monitoring the toxic effects of these pollutants. To determine the toxicity of these contaminants various bioassays are used, in which wide range of organisms are being recognized as a bioindicator for predicting the possible mechanism of toxicity and the underlying mechanisms to combat the subsequent oxidative stress [5]. The use of photosynthetic prokaryotes like cyanobacteria as a bioindicator is significant because they form the base of the aquatic food chain and any alterations in their populations can alter the upper trophic level of the ecosystem. These primary producers are widely distributed in various habitats particularly copious in marine ecosystems and foreseen as an ideal model to study the toxic effects of the released NPs [6], as they are effective biological metal sorbents and have the ability to accumulate many metals in a significant amount. They rapidly respond and adapt to stress condition in general and in particular of heavy metal (Ni) stress [7].
Metal nanoparticle-mediated toxicity might be due to one or combination of several effects like coordination effects, genotoxicity, non-homeostasis effects and oxidative stress. Amongst these, the most important mechanism is ROS mediated toxicity once they interact or get internalized into the living cells depending upon their solubility, which is a key issue in the toxicity of metal nanoparticles [8]. Due to the large surface area of NPs and higher electronic density as compared to their bulk counterpart they interact with biomolecules with enhanced reactivity [9]. To combat the effect of oxidative stress triggered by excessive ROS generation, cells possess enzymatic and non-enzymatic antioxidant defence mechanisms. Enzymatic components include peroxidase (POD), catalase (CAT), ascorbate, superoxide dismutase (SOD) and some important non-enzymatic components are total phenol and proline. In response to various stressful conditions such as osmotic stress, high salinity and heavy metal stress intracellular proline showed enhanced accumulation to combat the resulting oxidative stress [10].
From the present study, it is concluded that Nostoc muscorum can tolerate ZnCl2 up to a concentration of 8 μM, N-ZnO up to 32 μM and M-ZnO up to the highest chosen concentration (128 μM). Thus, this blue-green alga can not only be used as a cost-effective metal/metal nanoparticles toxicity assessment tool but also for bioremediation in the aquatic ecosystem.
Materials and methods
Chemicals and reagents
All the chemicals were purchased from a standard company like SD-fine, Sigma-Aldrich, Merck (Worli, Mumbai), Glaxo, Fischer, Himedia, etc.
Experimental organism and growth conditions
Cyanobacterium, N. muscorum used in the present study as a test organism was obtained through the courtesy of Dr S. M. Prasad, Department of Botany, University of Allahabad. The axenic culture of N. muscorum was maintained in the plant tissue culture room at 27±2°C under the light intensity of 2400 Lux and 14:10 h light and dark photoperiod. Cultures were grown in 1 L BG11 media (pH 7.0) [11] for regular experiments.
Stock preparation of ZnCl2, M-ZnO, and N-ZnO for treatment
ZnCl2, M-ZnO and N-ZnO (<100 nm), all were purchased from Sigma-Aldrich. The stock suspensions/solutions (1000 μM) of the tested chemicals were prepared in deionized water (Milli-Q, Millipore). All stock suspensions except ZnCl2 were sonicated (Ultrasonic Bath sonicator, Model- 3.5 L 100 H, electric supply- 230 V AC 50 Hz, Qualigens) for 30 min, stored in the dark at +4°C and used for testing within 2 months. The M-ZnO and N-ZnO suspension were again sonicated for 15 min immediately prior to each treatment.
Experimental design
An exponential phase culture of N. muscorum was supplemented with the stock solution of N-ZnO to give the selected concentrations (2, 4, 8, 16, 32, 64 and 128 μM) in the test medium. Simultaneously, N. muscorum was also treated with similar concentrations (2–128 μM) of two reference molecules (ZnCl2 and M-ZnO) to better understand the underlying toxicity mechanisms of N-ZnO into the cells. Thereafter, selected parameters such as growth measurement, pigment estimation, total peroxide, superoxide, lipid peroxidation, SOD, POD, proline, and phenol content were estimated as per the methods described below. All experiments were conducted in triplicate and repeated thrice to confirm the reproducibility of the results.
Growth measurement
Growth was measured in terms of chlorophyll estimation on alternate days at regular intervals for 10 days.
Photosynthetic pigment extraction and estimation
For extraction of chl-a and carotenoids, an equal volume of N. muscorum was centrifuged and the pellet was suspended in 80% acetone (acetone: water, v/v). For chl-a and carotenoids estimation, the absorbance of extracts was read spectrophotometrically (Systronics 2020) at 665 nm and 480 nm, respectively. The content of both the pigment was calculated by the specific coefficients given by Myers and Krats [12]. The quantitative estimation of pigments in terms of g/L was done by the formula given below:
where, α, absorption coefficient (value of α for chl-a is 82.04 and for carotenoids is 200); D, optical density; d, inside path length of spectrophotometer in (cm); C, concentration of pigment in gL−1.
Estimation of protein
Protein content was measured by the method developed by Lowry et al. [13]. For protein estimation, cyanobacterial cells were digested with 0.5 mL of 1 N NaOH for 10 min in a boiling water bath. Thereafter, 2.5 mL of reagent C was added and incubated for 15 min at room temperature followed by addition of 0.5 mL of Folin-Ciocalteu’s reagent. The absorbance of resulting blue color was taken at 660 nm. The concentration of protein in μg/mL was calculated from the BSA standard curve.
Superoxide estimation
Superoxide radical was estimated in ZnCl2, M-ZnO and N-ZnO treated and untreated cells of N. muscorum as per the method of Elstner and Heupel [14]. Cells were homogenized in 2 mL phosphate buffer and centrifuged at 8000×g. Thereafter, 0.9 mL phosphate buffer and 0.1 mL hydroxylamine were added in 1 mL of supernatant. O.D was recorded at 530 nm after 20 min incubation with 1 mL of each NEDD and sulfanilamide. A standard curve of sodium nitrite was used for the calculation of superoxide content.
Peroxide estimation
The level of peroxide in the cells was determined by following the method of Sagisaka [15]. For peroxide estimation, treated and untreated cells were extracted in 3.5 mL of 5% trichloroacetic acid (TCA). After that, total peroxide in the supernatant was recorded spectrophotometrically at 480 nm. The amount of total peroxide was calculated by referring to H2O2 standard curve.
Lipid peroxidation
Lipid peroxidation in the ZnCl2, M-ZnO, and N-ZnO treated and untreated cells of N. muscorum were measured by estimating the end product malondialdehyde (MDA) as per the method of Heath and Packer [16]. The cellular pellets were homogenized in 50 mM phosphate buffer. The resulting homogenate was centrifuged at 8000×g for 20 min. To 0.5 mL aliquot of the supernatant, 2 mL of 20% trichloroacetic acid (TCA, w/v in TBA solution) containing 0.5% thiobarbituric acid (TBA, w/v in 0.2 N HCl) was added. The mixture was heated at 90°C for 20 min and then quickly cooled in ice bath. After centrifugation at 8000×g for 10 min, the absorbance of the supernatant was read at 532 nm. The value for nonspecific absorption of each sample at 600 nm was also recorded and subtracted from the absorption recorded at 532 nm. The concentration of MDA, an end product of lipid peroxidation was calculated from extinction coefficient 155 m mol−1cm−1. The result is represented as nmol MDA/g dry weight.
Superoxide dismutase activity (SOD)
SOD activity was measured spectrophotometrically by the method of Giannopolitis and Ries [17]. The unit of superoxide dismutase activity was defined as the amount of enzyme which caused a 50% inhibition of the reaction observed in the absence of enzyme.
Peroxidase activity (POD)
For the estimation of the POD, the method of Gahagen et al. [18] was followed. Treated and untreated cells were homogenized in 2 mL of 100 mM phosphate buffer (pH 7.0) at 5°C. After that, the homogenate was centrifuged at 8000×g for 30 min. One millilitre of enzyme extract was mixed with 1 mL of 25 mM H2O2 and 1 mL of 100 mM pyrogallol prepared in deionized water. After mixing, change in optical density was recorded for 2–3 min at 430 nm.
Proline content measurement
Proline was determined by following Bates et al. [19] method. For proline estimation 15 mL treated and untreated culture was centrifuged at 8000×g. Then, the cells were homogenized in 10 mL of 3% sulfosalicylic acid and again centrifuged at 8000×g to remove cell debris. Thereafter, 2 mL of acid ninhydrin and glacial acetic acid was added to 2 mL of obtained supernatant and incubated for 1 h at boiling temperature. The toluene was used for extraction of proline into an organic phase, which was used for quantification at 520 nm. A standard curve of proline was used for the calculation of proline concentration.
Phenol content measurement
Total phenol content was estimated by the method of Singleton and Rossi [20]. For the total phenol extraction, 10 mL of treated and untreated cells were centrifuged and extracted in 2 mL of 80% methanol. After that, 2 mL sodium bicarbonate, 0.3 mL double-distilled water (DDW) and 0.2 mL Folin reagent was added in 0.5 mL of supernatant and incubated in a water bath until the blue color developed. The absorbance of the colored compound was recorded at 750 nm. A Gallic acid standard curve was used for estimation of total phenol.
Statistical analysis
All experiments were performed using exponentially growing cultures and repeated three times to ascertain the reproducibility of the results. Values are represented as mean±SEM (n=3). Tests of significance were performed by one-way analysis of variance (ANOVA), followed by Dunnett’s test with control by using Graph Pad Prism 5 software.
Results and discussion
Metal and metallic nanoparticles toxicity to cyanobacteria are one of the most threatening environmental problems. Zinc is essential to trace elements for the living organisms, but at higher concentrations, it can cause severe damages even the cell death.
Figure 1A–C demonstrate the effects of different concentrations (2–128 μM) of ZnCl2, N-ZnO, and M-ZnO, respectively on the growth pattern of N. muscorum. When the cells of N. muscorum was treated with 2–8 μM of ZnCl2, the lag phase occurred for 2 days followed by a log phase which continued up to 10 days. Thereafter, the dose-dependent decline in growth can be observed after the 8th and 2nd day, once treated with 16–32 μM and 64–128 μM of ZnCl2, respectively (Figure 1A). The most toxic form of zinc, i.e. Zn2+ become toxic only at higher concentrations [21]. Whereas, after treated with a similar dose of N-ZnO (2–128 μM), log phase continued up to 10 days for 2–32 μM of N-ZnO. The remarkable decline in growth was observed only at higher concentration (64 and 128 μM) of N-ZnO after the 6th day of treatment (Figure 1B). On the other hand, no significant alteration in the growth pattern of N. muscorum was observed after treated with 2–128 μM of M-ZnO up to 10 days as compared to control (Figure 1C). Our results are in consonance with [22], who also showed the dose-dependent (0.05, 0.1, 0.2, 0.42 and 1 mg/L) and time-dependent (24, 48 and 72 h) growth inhibition in two algae sp. Scenedesmus dimorphus and Chlorella Vulgaris treated with ZnO NPs. The decline in the growth of cyanobacteria under various abiotic stresses including heavy metal stress has been reported earlier [23].
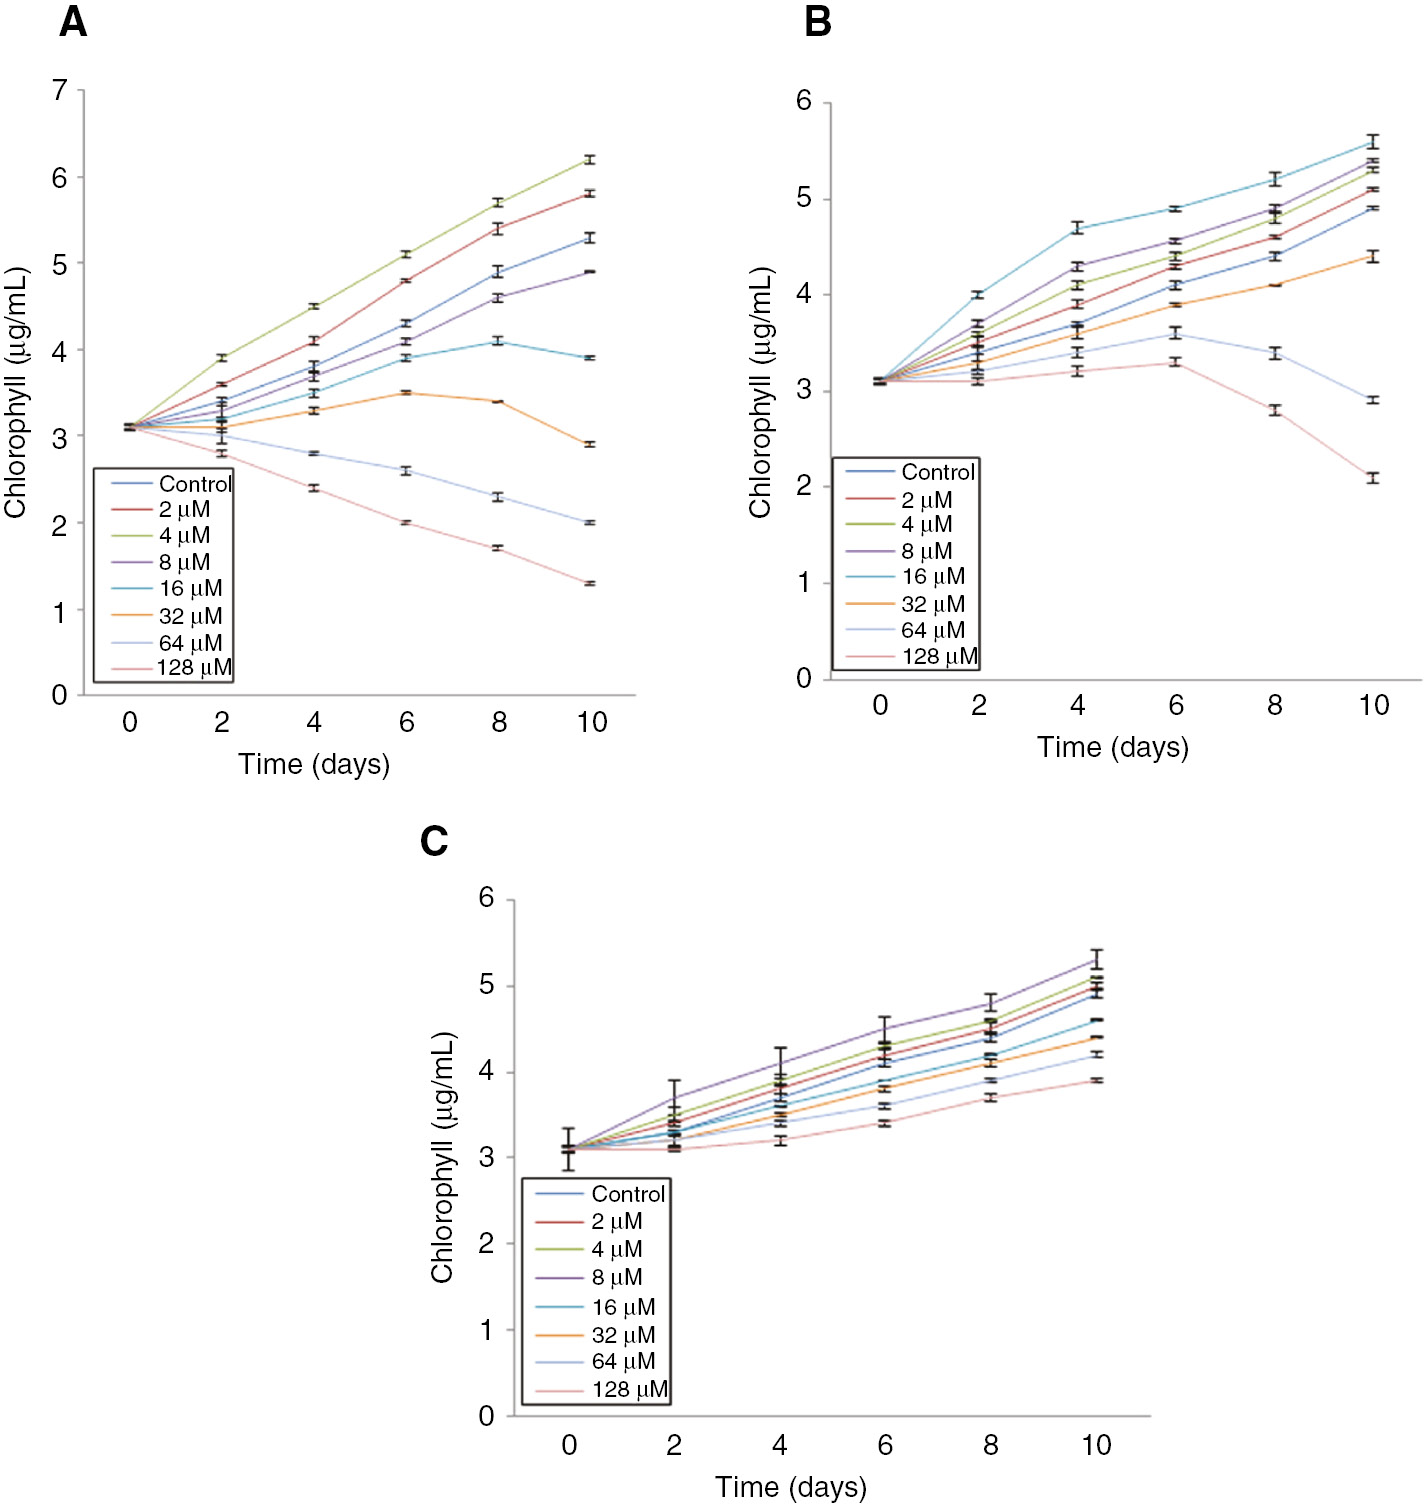
Effect of different concentrations (2–128 μM) of ZnCl2 (A), N-ZnO (B) and M-ZnO (C) on the growth pattern of Nostoc muscorum up to 10 days.
Values are means±SEM with n=3.
Results presented in Tables 1–3 clearly illustrate the photosynthetic pigments and total protein of N. muscorum were severely affected by increasing concentrations of ZnCl2 followed by N-ZnO, but no such significant changes were observed in the case of M-ZnO treatment. The damage to the pigment except carotenoids was directly proportional to the concentration of the toxicant and became prominent after 8 μM and 32 μM of ZnCl2 and N-ZnO exposure, respectively. Whereas, the carotenoid content increased significantly from 2–8 μM of ZnCl2 and 16–32 μM of N-ZnO treatment, showing its antioxidant potential at low concentrations of Zn2+. In contrast, after treated with 2–128 μM of M-ZnO, little bit enhancement in both the photosynthetic pigments was observed only at the highest dose (128 μM). Photosynthetic parameters proved to be very useful for envisaging the toxicity profiles of heavy metals and metal NPs [24]. Heavy metals (Pb2+ and Cd2+) leads to dose-dependent (0, 0.5, 1, 2, 4, 6 and 8 mg/L) decline in photosynthetic pigment content and growth of unicellular cyanobacterium Synechocystis sp. PCC 6803 [25]. Approximately 20% and 80% growth inhibition occurs at 200 and 300 mg/L of ZnO NPs, respectively and more than 50% reduction in photosynthetic pigments in 300 mg/L ZnO NPs treated Arabidopsis plants was also reported [26]. These metals induced damages to photosynthetic pigments could be due to the replacement of magnesium ions from the tetrapyrrole ring of chlorophyll molecules, electron transport chain impairment, damages to enzymes associated with chlorophyll synthesis or might be due to the ROS mediated peroxidation of membrane lipids [27].
Effect of ZnCl2 on photosynthetic pigments and total protein of N. muscorum measured after 72 h of treatment.
| ZnCl2 (μM) | Chl-a (μg mL−1) | Carotenoids (μg mL−1) | Total protein (μg mL−1) |
|---|---|---|---|
| 0 | 3.7±0.26 | 1.33±0.07 | 94.4±0.31 |
| 2 | 4.8±0.28 (+29)a | 2.2±0.17 (+65)c | 97.1±1.0 (+3) |
| 4 | 5.4±0.28 (+45)b | 2.9 ±0.11 (+118)c | 107.2±2.9 (+13) |
| 8 | 3.6±0.29 (2) | 1.96±0.18 (+47)b | 122.3±2.0 (+29)a |
| 16 | 3.4±0.26 (9) | 1.2±0.08 (10) | 130.8±0.5 (+39)b |
| 32 | 3.1±0.20 (16) | 0.9±0.14 (32) | 106.6±1.5 (+12) |
| 64 | 2.8±0.23 (24) | 0.7±0.12 (47)b | 89.1±2.5 (6) |
| 128 | 1.9±0.17 (49)c | 0.3±0.05 (77)c | 60.7±1.9 (36)b |
Values in parenthesis are [%] decrease or increase (+). The results represented are the mean±SEM of three independent experiments (n=3) performed in triplicate (ap<0.05, bp<0.01, cp<0.001 represent significant difference compared with control).
Effect of N-ZnO on photosynthetic pigments and total protein of N. muscorum measured after 72 h of treatment.
| N-ZnO (μM) | Chl-a (μg mL−1) | Carotenoids (μg mL−1) | Total protein (μg mL−1) |
|---|---|---|---|
| 0 | 3.7±0.26 | 1.33±0.07 | 94.4±0.31 |
| 2 | 3.9±0.28 (+5) | 1.37±0.05 (+3) | 95.2±0.2 (+0.8) |
| 4 | 4.1±0.27 (+11) | 1.4±0.05 (+5) | 96.2±0.4 (+2) |
| 8 | 4.4±0.26 (+19) | 1.49±0.05 (+12) | 97.4±0.7 (+3) |
| 16 | 4.6±0.23 (+24) | 1.62±0.03 (+21) | 109.3±2.9 (+16) |
| 32 | 5.4±0.30 (+45)b | 1.71±0.01 (+28)a | 133.2±2.1 (+41)c |
| 64 | 5.1 ±0.28 (+37) | 1.4±0.01 (+5) | 107.4±2.3 (+14) |
| 128 | 3.5 ±0.17 (5) | 0.9±0.11 (32)b | 76.6±2.7 (19)a |
Values in parenthesis are [%] decrease or increase (+). The results represented are the mean±SEM of three independent experiments (n=3) performed in triplicate (ap<0.05, bp<0.01, cp<0.001 represent significant difference compared with control).
Effect of M-ZnO on photosynthetic pigments and Total Protein of N. muscorum measured after 72 h of treatment.
| M-ZnO (μM) | Chl-a (μg mL−1) | Carotenoids (μg mL−1) | Total protein (μg mL−1) |
|---|---|---|---|
| 0 | 3.7±0.26 | 1.33±0.07 | 94.4±0.31 |
| 2 | 3.8±0.20 (+3) | 1.37±0.06 (+3) | 95.0±0.14 (+0.6) |
| 4 | 3.89±0.17 (+5) | 1.4±0.06 (+4) | 95.4±0.21 (+1) |
| 8 | 4.1±0.17 (+11) | 1.43±0.06 (+5) | 96.2±0.36 (+2) |
| 16 | 4.29±0.18 (+16) | 1.46±0.069 (+10) | 96.9±0.2 (+3) |
| 32 | 4.36±0.18 (+18) | 1.49 ±0.06 (+12) | 97.4±0.5 (+3) |
| 64 | 4.43±0.20 (+20) | 1.54±0.07 (+16) | 98.6±0.7 (+4) |
| 128 | 4.6±0.23 (+24)a | 1.58±0.06 (+19)a | 100.4±0.8 (+6) |
Values in parenthesis are [%] decrease or increase (+). The results represented are the mean±SEM of three independent experiments (n=3) performed in triplicate (ap<0.05, represent significant difference compared with control).
Further, the enhanced level of superoxide and total peroxide radicals in N. muscorum after treated with different dose (2–128 μM) of ZnCl2, N-ZnO and M-ZnO are shown in Figures 2 and 3, respectively. In the case of ZnCl2 treatment, superoxide and peroxide level increased gradually by 12–121% and 18–132%, respectively in a dose-dependent manner up to 128 μM. A similar trend of increment in superoxide (5–98%) and peroxide (7–106%) radicals were also observed up to 128 μM of N-ZnO. But no such significant ROS formation (superoxide and peroxide) were observed in the case of M-ZnO exposure might be due to the insignificant dissolution of M-ZnO into their ionic form that can cause a noteworthy effect (Figures 2 and 3). De Berardis et al. [28] stated that under stress condition, chemical reactions take place and increase in the formation of superoxide radical (O2−) occur, which causes ROS accumulation and oxidative stress. Major toxicological mechanisms of environmental NPs are facilitated by oxidative stress caused by ROS generation. Present results are supported by [29], who showed that significant amount of ROS could be produced in the cells even they are exposed to insignificant amounts of ZnO or CuO NPs.
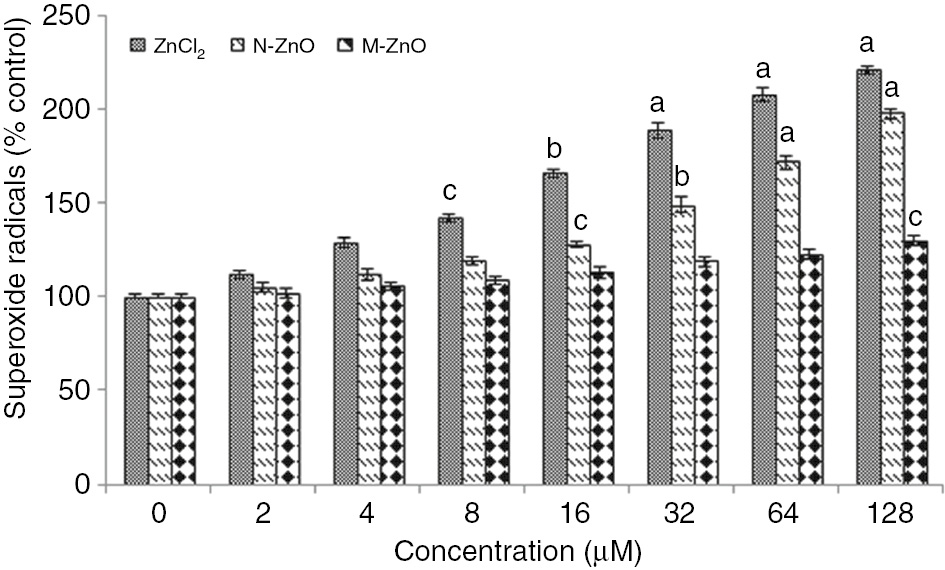
Effect of different concentrations (2–128 μM) of ZnCl2, N-ZnO and M-ZnO on superoxide radical of N. muscorum after 72 h.
The superoxide content in untreated control was 2566±1.8 μmol (g dry weight)−1×10⁻³. The results represented are the mean±SEM of three independent experiments (n=3) performed in triplicate (cp<0.05, bp<0.01, ap<0.001 represent significant difference compared with control).
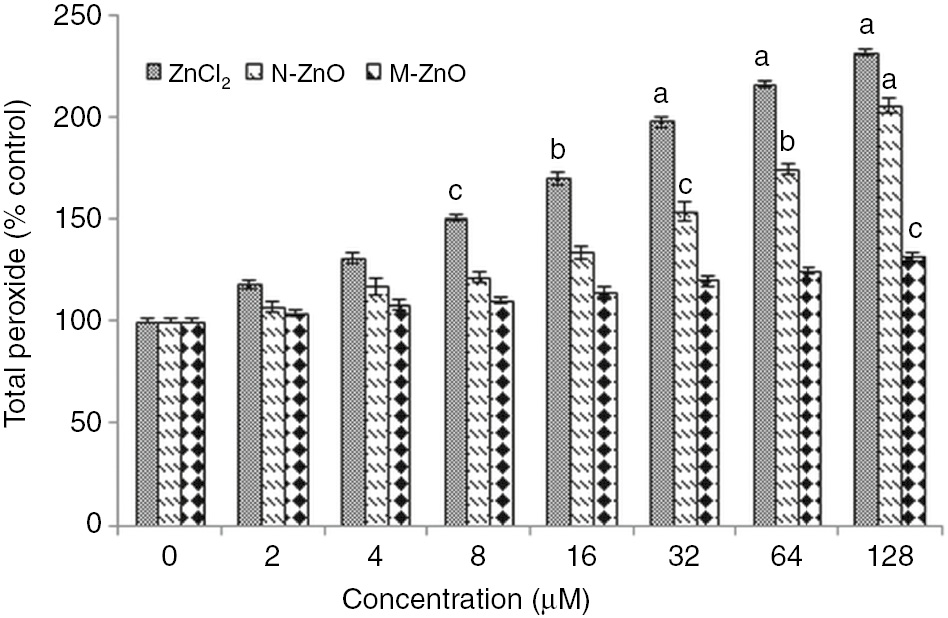
Effect of different concentrations (2–128 μM) of ZnCl2, N-ZnO and M-ZnO on total peroxide of N. muscorum after 72 h.
Total peroxide levels in untreated control were 646±3.2 μmol (g dry weight)−1×10². The results represented are the mean±SEM of three independent experiments (n=3) performed in triplicate (cp<0.05, bp<0.01, ap<0.001 represent significant difference compared with control).
Figure 4 elucidates the lipid peroxidation estimated as MDA content in N. muscorum exposed to 2–128 μM of ZnCl2, N-ZnO, and M-ZnO for 72 h. Exposure of ZnCl2, results in the enhanced accumulation (14–97%) of MDA up to 128 μM, depicting significant lipid peroxidation at higher concentrations. Whereas, after treated with N-ZnO, peroxidation of lipids increased gradually (4–72%) in a dose-dependent manner up to 128 μM. In contrast, treatment of M-ZnO results in less/insignificant peroxidation of lipid up to 64 μM. The lipid peroxidation under heavy metal stress as a marker of oxidative stress is a well-known phenomenon [30]. The enhanced level of lipid peroxidation in the N. muscorum treated with high dose of ZnCl2 and N-ZnO depicted that their excess accumulation triggered the production of ROS, which caused the oxidative damage to the plasma membrane. These results are in accordance with [31], who showed that the amount of ROS was found to be much higher in metal oxide NPs suspensions compared to their bulk formulations.
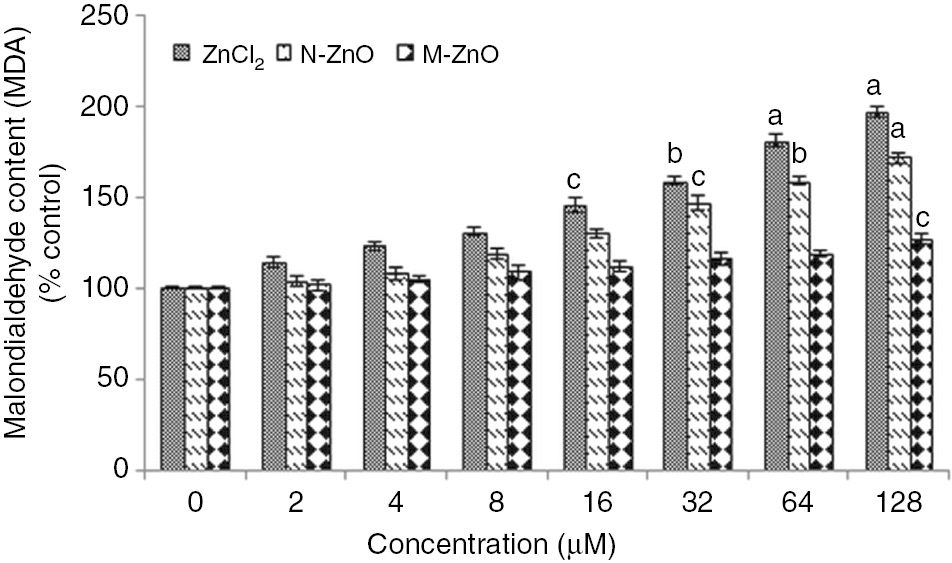
Effect of different concentrations (2–128 μM) of ZnCl2, N-ZnO and M-ZnO on lipid peroxidation of Nostoc muscorum after 72 h.
The MDA content in untreated control was 782.6±4 nmol (g dry weight)−1. The results represented are the mean±SEM of three independent experiments (n=3) performed in triplicate (cp<0.05, bp<0.01, ap<0.001 represent significant difference compared with control).
As a result of this ROS generation, oxidative stress takes place into the cells, which accelerates the superoxide dismutase (SOD) and peroxidase (POD) activity in N. muscorum exposed to different concentration (2–128 μM) of ZnCl2, N-ZnO and M-ZnO (Figures 5 and 6). The cells under ZnCl2 stress showed enhanced SOD (26–78%) and POD (30–89%) activity up to 16 μM, after that sharp decline in both the scavenging activity was observed upto 128 μM, depicting severe toxicity of ZnCl2 at higher concentrations, which ultimately results in cell death. While, under N-ZnO stress, both SOD (9–85%) and POD (15–93%) activity was increased in a dose-dependent manner up to 64 μM. In contrast, M-ZnO exposure results in little bit enhancement in both SOD and POD activity only at highest concentrations (64 and 128 μM).
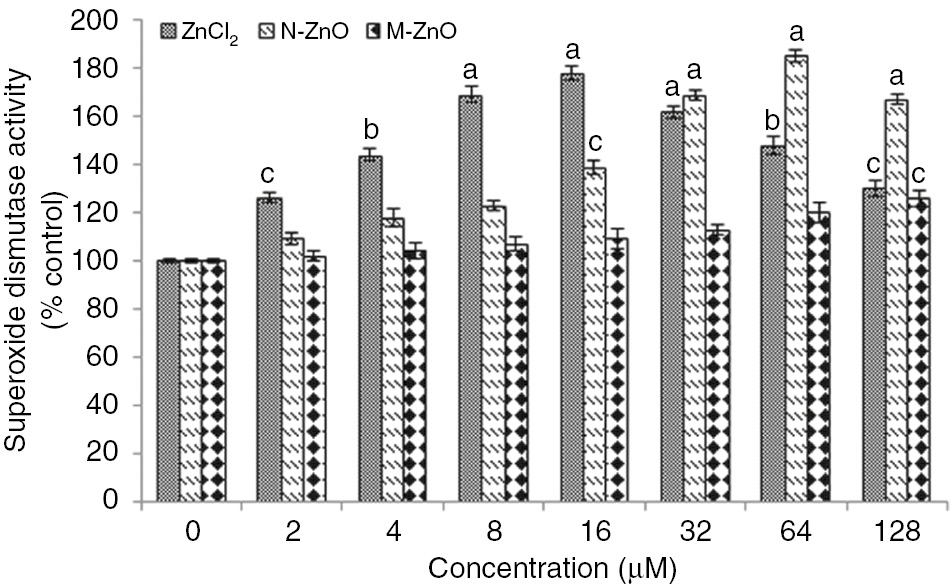
Effect of different concentrations (2–128 μM) of ZnCl2, N-ZnO and M-ZnO on SOD activity of Nostoc muscorum after 72 h.
SOD activity in untreated control was 8.2±0.7 Unit (mg protein)−1. The results represented are the mean±SEM of three independent experiments (n=3) performed in triplicate (cp<0.05, bp<0.01, ap<0.001 represent significant difference compared with control).
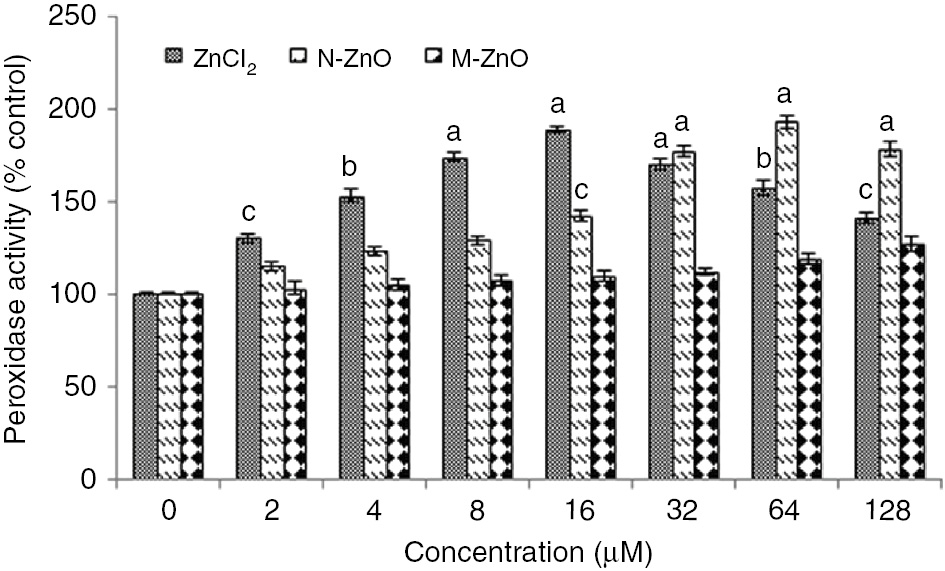
Effect of different concentrations (2–128 μM) of ZnCl2, N-ZnO and M-ZnO on POD activity of Nostoc muscorum after 72 h.
POD activity in untreated control was 2.56±0.3 changes in (n=3) OD430 (mg protein)−1 min−1. The results represented are the mean±SEM of three independent experiments performed in triplicate (cp<0.05, bp<0.01, ap<0.001 represent significant difference compared with control).
Defense mechanisms get accelerated to combat the deleterious effects of reactive oxygen species in various organisms [32]. The control of steady-state ROS levels by SOD is an important protective mechanism against cellular oxidative damage [33]. Increased SOD and POD activity in N. muscorum (Figures 5 and 6) following ZnCl2 and N-ZnO treatment could be ascribed to the increased production of superoxide anion (O2−) and peroxide radicals in the cells. But such significant alterations in stress biomarkers were not observed in the case of M-ZnO, might be due to the low dissolution of M-ZnO into the dispersed medium. The toxicity of N-ZnO was higher compared to their bulk counterpart (M-ZnO) because of higher solubility [34]. Induced SOD activity in Spirulina plantensis- S5 exposed to Pb, Cu, and Zn have been reported [23]. A similar trend of enhancement in SOD activity in the leaves of Arabidopsis thaliana and in marine microalgae Tetraselmis gracilis following Cd treatment was stated [35]. Besides the enhancement of SOD activity, POD activity has also been found to be accelerated in various terrestrial and aquatic sp. exposed to Zn and Al, a similar pattern of results was also reported in the present study [36].
Besides, these enzymatic antioxidants some non-enzymatic antioxidants are also accumulated against the resulting oxidative stress. Figures 7 and 8 demonstrate the proline and total phenol accumulation in N. muscorum exposed to 2–128 μM of ZnCl2, N-ZnO, and M-ZnO for 72 h. Exposure of ZnCl2 results in proline and total phenol accumulation by 18–58% and 20–62%, respectively in a dose-dependent manner up to 16 μM, after that decline in both the non-enzymatic antioxidants was observed up to 128 μM by 25–70% and 21–65%, respectively. The decline in proline and total phenol accumulation at higher concentrations might be due to the overproduction of free radicals, which might lead to the cell death. While in the case of N-ZnO, the proline and total phenol content increased by 6–76% and 8–87% in a dose-dependent manner up to 64 μM. It is known that proline and many phenolic metabolites are induced under abiotic as well as biotic stress and accumulated in tissue after different environmental stresses. Many plants exposed to drought or a high salt content in the soil known to accumulate proline to combat the effects of various stresses [37]. Besides, acting as an osmolyte and important metal chelator, these metabolites also scavenges the free radicals to provide protection against the oxidative stress-mediated cell damage [38]. In the same way, the decline in stress correlates with the quantity of total free phenols because these phenolics exhibit properties of antioxidant due to the availability of free phenolic hydrogen [39]. These metabolites are accumulated under stress condition might be to participate in ROS scavenging through antioxidative enzymes, like H2O2 scavenging in assistance of peroxidases [40].
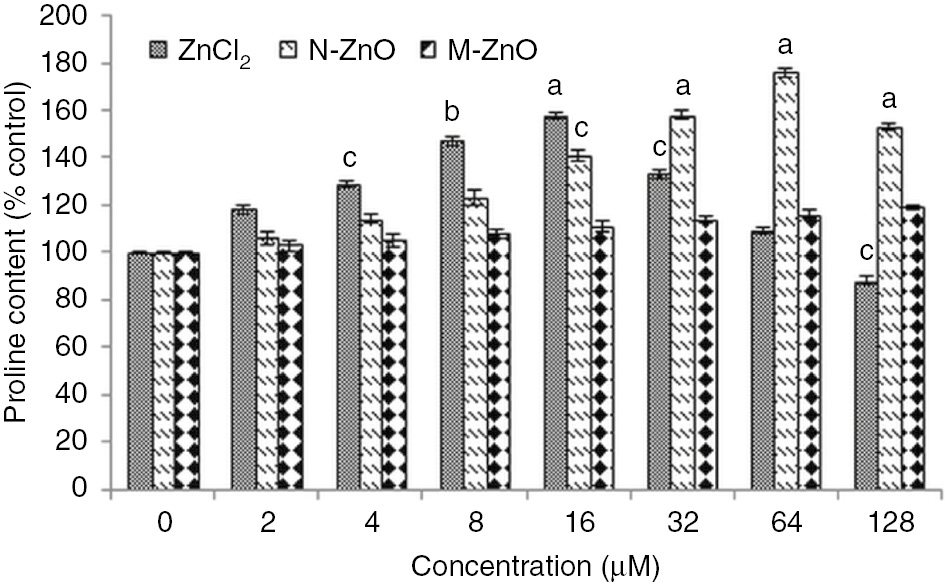
Effect of different concentrations (2–128 μM) of ZnCl2, N-ZnO and M-ZnO on proline content of Nostoc muscorum after 72 h.
Proline content in untreated control was 15.2±0.8 μg (g dry weight)−1. The results represented are the mean±SEM of three independent experiments (n=3) performed in triplicate (cp<0.05, bp<0.01, ap<0.001 represent significant difference compared with control).
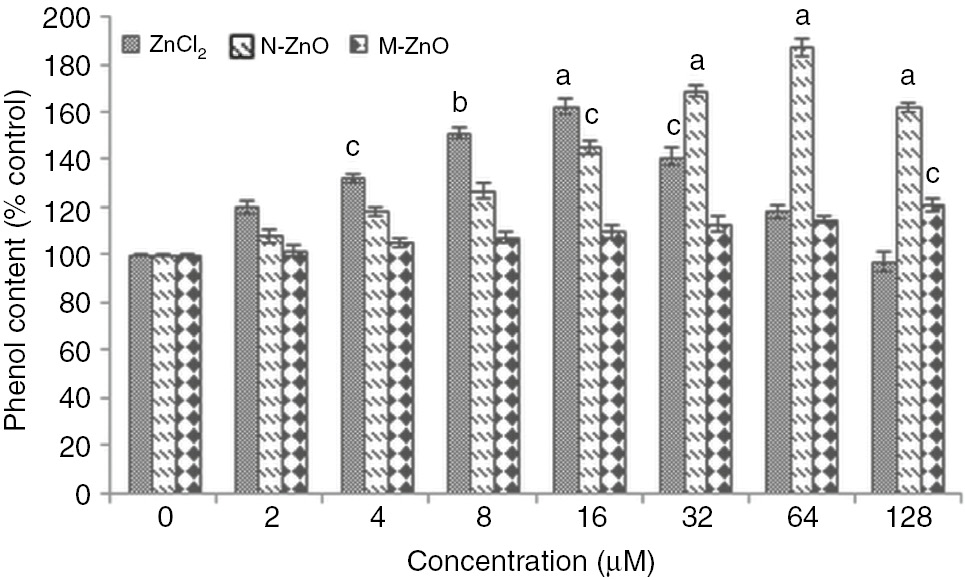
Effect of different concentrations (2–128 μM) of ZnCl2, N-ZnO and M-ZnO on phenol content of Nostoc muscorum after 72 h.
Phenol content in untreated control was 0.9±0.2 mg (g dry weight)−1. The results represented are the mean±SEM of three independent experiments (n=3) performed in triplicate (cp<0.05, bp<0.01, ap<0.001 represent significant difference compared with control).
Conclusion
In conclusion, the study established advantages of using cyanobacteria as a worthy tool to evaluate environmental toxicity caused by metals and metallic NPs. The current study emphasized the evaluation of oxidative stress-mediated toxicity mechanism of ZnCl2 and N-ZnO. Analysis of photosynthetic and biochemical parameters provided a comparative toxicity prediction of ZnCl2, M-ZnO, and N-ZnO. Further, the investigation of ZnCl2 and N-ZnO mediated acceleration of antioxidant machinery revealed significant ROS generation, which can be accounted for the metal-induced oxidative stress tolerance in a cyanobacterium. Thus, the present work stands first to study, evaluate and compare the nanoparticle and metal-induced toxicity in cyanobacterium N. muscorum and establishes it as a potent strain for simple, cost-effective and efficient model organism to study (eco) toxicity of these metal nanoparticles. Further studies to better understand the underlying molecular mechanisms of toxicity of metals and metallic nanoparticles in cyanobacterium N. muscorum are underway.
Acknowledgements
We are grateful to Department of Science and Technology (DST), INSPIRE, New Delhi and Council of Science and Technology (CST), for providing financial assistance and Vice-Chancellor, Integral University, Lucknow for providing necessary laboratory facilities. The manuscript has been approved by competent authority of University and the assigned communication number is IU/R&D/2017-MCN00034.
Conflict of interest: The authors declare that they have no conflict of interest regarding this study.
References
1. Jadhav JP, Kalyani DC, Telke AA, Phugare SS, Govindwar SP. Evaluation of the efficacy of a bacterial consortium for removal of colors, reduction of heavy metals, and toxicity from textile dye effluent. Bioresour Technol 2010;101:165–73.10.1016/j.biortech.2009.08.027Search in Google Scholar PubMed
2. Ju-Nam Y, Lead JR. Manufactured nanoparticles: an overview of their chemistry, interactions and potential environmental implication. Sci Total Environ 2008;400:396–414.10.1016/j.scitotenv.2008.06.042Search in Google Scholar PubMed
3. Kahru A, Dubourguier HC. From ecotoxicology to nanoecotoxicology. Toxicology 2010;269:105–19.10.1016/j.tox.2009.08.016Search in Google Scholar PubMed
4. Cash KJ, Clark HA. Nanosensors and nanomaterials for monitoring glucose in diabetes. Trends Mol Med 2010;16:584–93.10.1016/j.molmed.2010.08.002Search in Google Scholar PubMed PubMed Central
5. Zeng J, Yang L, Wang WX. Acclimation to and recovery from cadmium and zinc exposure by a freshwater cyanobacterium, Microcystis aeruginosa. Aquat Toxicol 2009;93:1–10.10.1016/j.aquatox.2009.02.013Search in Google Scholar PubMed
6. Rodea PI, Gonzalo S, Santiago MJ, Leganes F, Garcia CE, Rosal R, et al. An insight into the mechanisms of nanoceria toxicity in aquatic photosynthetic organisms. Aquat Toxicol 2012; 122–123:133–43.10.1016/j.aquatox.2012.06.005Search in Google Scholar PubMed
7. Farooqui A, Mahfooz S, Shamim A, Siddiqui MH, Kesari KK. Molecular modulations and influence of acclimation of Ni on acute Ni toxicity in Plectonema boryanum. Turk J Biochem 2016;41:393–402.10.1515/tjb-2016-0131Search in Google Scholar
8. Long TC, Saleh N, Tilton RD, Lowry GV, Veronesi B. Titanium dioxide (P25) produces reactive oxygen species in immortalized brain microglia (BV2): implications for nanoparticle neurotoxicity. Environ Sci Technol 2006;40:4346–52.10.1021/es060589nSearch in Google Scholar PubMed
9. Pisanic T, Jin S, Shubayev VI. Iron oxide magnetic nanoparticle nanotoxicity: incidence and mechanisms, In: Sahu SC, Casciano DA, editors. Nanotoxicity: From Health Risk to In Vitro and In Vivo Models. John Wiley and Sons, Ltd, 2009;397–425.10.1002/9780470747803.ch20Search in Google Scholar
10. Miller G, Stein H, Honing A, Kapulnik Y, Zilberstein A. Responsive modes of Medicago sativa proline dehydrogenase genes during salt and recovery dictate free proline accumulation. Planta 2005;222:70–9.10.1007/s00425-005-1518-4Search in Google Scholar PubMed
11. Huges E, Garham PR, Zehrider A. A toxicity of a unialgal culture of Microcystis aeroginosa. Can J Microbiol 1958;4:215–36.10.1139/m58-024Search in Google Scholar
12. Myers J, Kratz WA. Relationship between pigment content and photosynthetic characteristics in a blue green alga. J Gen Physiol 1955;39:11–21.10.1085/jgp.39.1.11Search in Google Scholar
13. Lowry OH, Rosenbrough NJ, Farr AL, Randall R. Protein measurement with the folin phenol reagent. J Biol Chem 1951;193:269–75.10.1016/S0021-9258(19)52451-6Search in Google Scholar
14. Elstner EF, Heupel A. Inhibition of nitrite formation from hydroxyl ammonium chloride: a simple assay for superoxide dismutase. Anal Biochem 1976;70:616–20.10.1016/0003-2697(76)90488-7Search in Google Scholar
15. Sagisaka S. The occurrence of peroxide in a perennial plant, Populusgelrica. Plant Physiol 1976;57:308–9.10.1104/pp.57.2.308Search in Google Scholar
16. Heath RL, Packer L. Photoperoxidation in isolated chloroplast I. Kinetics and Stoichiometry of fatty acid peroxidation. Arch Biochem Bioph 1968;125:189–98.10.1016/0003-9861(68)90654-1Search in Google Scholar
17. Giannopolitis CN, Ries SK. Superoxide dismutase. I. Occurrence in higher plants. Plant Physiol 1977;59:309–14.10.1104/pp.59.2.309Search in Google Scholar PubMed PubMed Central
18. Gahagen HE, Holm RE, Abeles FB. Effect of ethylene on peroxidase activity. Physiol of Plant 1968;21:1270.10.1111/j.1399-3054.1968.tb07358.xSearch in Google Scholar
19. Bates LS, Waldren RP, Teare ID. Rapid determination of free proline for water stress studies. Plant Soil 1975;39:205–7.10.1007/BF00018060Search in Google Scholar
20. Singleton VL. Rossi JA. Colorimetry of total phenolics with phosphomolybdic phosphotungstic acid reagents. Am J Ecol Vitic 1965;16:144–58.10.5344/ajev.1965.16.3.144Search in Google Scholar
21. Baumann A, Morrison L, Stengel DB. Metal accumulation and toxicity measured by PAM- Chlorophyll fluorescence in seven species of marine macroalgae. Ecotoxicol Environ Saf 2009;72:1063–75.10.1016/j.ecoenv.2008.10.010Search in Google Scholar PubMed
22. Hamide P, Fatemeh S, Abdolkarim K, Zohreh R. Toxicity of Zinc Oxide Nanoparticles to Chlorella vulgaris and Scenedesmus dimorphous Algae Species. World J Fish Mar Sci 2013;5:563–70.Search in Google Scholar
23. Choudhary M, Jetley UK, Khan MA, Zutshi S, Fatma T. Effect of heavy metal stress on proline, malondialdehyde, and superoxide dismutase activity in the cyanobacterium Spirulinaplatensis-S5. Ecotoxicol Environ Saf 2007;66:204–9.10.1016/j.ecoenv.2006.02.002Search in Google Scholar PubMed
24. Tang Y, Shuyan Li, Qiao J, Wang H, Li L. Synergistic effects of nano-sized titanium dioxide and zinc on the photosynthetic capacity and survival of Anabaena sp. Int J Mol Sci 2013;14:14395–407.10.3390/ijms140714395Search in Google Scholar PubMed PubMed Central
25. Arunakumar KK, Zhang X. Effects of heavy metals (Pb2+ and Cd2+) on the ultrastructure, growth and pigment contents of the unicellular cyanobacterium Synechocystis sp. PCC 6803. Oceanol Limnol 2009;27:383–8.10.1007/s00343-009-9123-1Search in Google Scholar
26. Wang X, Yang X, Chen S, Li Q, Wang W, Hou C, et al. Zinc oxide nanoparticles affect biomass accumulation and photosynthesis in arabidopsis. Front Plant Sci 2016;6:1243.10.3389/fpls.2015.01243Search in Google Scholar PubMed PubMed Central
27. Sandalio LM, Dalurzo HC, Gomez M, Romero-Puertas MC, Del Rio LA. Cadmium- induced changes in the growth and oxidative metabolism of pea plants. J Exp Bot 2001;52:2115–26.10.1093/jexbot/52.364.2115Search in Google Scholar PubMed
28. De Berardis B, Civitelli G, Condello M, Lista P, Pozzi R, Arancia G, et al. Exposure to ZnO nanoparticles induces oxidative stress and cytotoxicity in human colon carcinoma cells. Toxicol Appl Pharmacol 2010;246:116–27.10.1016/j.taap.2010.04.012Search in Google Scholar PubMed
29. Toduka Y, Toyooka T, Ibuki Y. Flow cytometric evaluation of nanoparticles using side- scattered light and reactive oxygen species – Mediated fluorescence – Correlation with genotoxicity. Environ Sci Technol 2012;46:7629–36.10.1021/es300433xSearch in Google Scholar PubMed
30. Metwally A, Safronova VI, Belimov AA, Dietz KJ. Genotypic variation of the response to cadmium toxicity in Pisum sativum L. J Exp Bot 2005;56:167–78.10.1093/jxb/eri017Search in Google Scholar PubMed
31. Xiong D, Fang T, Yu L, Sima X, Zhu W. Effects of nanoscale TiO2, ZnO and their bulk counterparts on zebrafish: acute toxicity, oxidative stress and oxidative damage. Sci Total Environ 2011;409:1444–52.10.1016/j.scitotenv.2011.01.015Search in Google Scholar PubMed
32. Gharieb MM, Gadd GM. Role of glutathione in detoxification of metal(loid)s by Saccharomyces cerevisiae. Biometals 2004;17:183–8.10.1023/B:BIOM.0000018402.22057.62Search in Google Scholar
33. Mittler R, Vanderauwera S, Gollery M, Van BF. Reactive oxygen gene network of plants. Trends Plant Sci 2004;9:490–8.10.1016/j.tplants.2004.08.009Search in Google Scholar PubMed
34. Borm P, Klaessig FC, Landry TD, Moudgil B, Pauluhn J, Thomas K, et al. Research strategies for safety evaluation of nanomaterials, Part V: role of dissolution in biological fate and effects of nanoscale particles. Toxicol Sci 2006;90:23–32.10.1093/toxsci/kfj084Search in Google Scholar PubMed
35. Polit ES, Drazkiewicz M, Krupa Z. Lipid peroxidation and antioxidative response in Arabidopsis thaliana exposed to cadmium and copper. Acta Physiol Plant 2010;32:169–75.10.1007/s11738-009-0393-1Search in Google Scholar
36. Sharma P, Dubey RS. Involvement of oxidative stress and role of antioxidative defence system in growing rice seedlings exposed to toxic concentrations of aluminium. Plant Cell Rep 2007;26:2027–38.10.1007/s00299-007-0416-6Search in Google Scholar PubMed
37. Ashraf M, Foolad MR. Roles of glycine betaine and proline in improving plant abiotic stress resistance. Environ Exp Bot 2011;59:206–16.10.1016/j.envexpbot.2005.12.006Search in Google Scholar
38. Matysik J, Alia B, Mohanty P. Molecular mechanisms of quenching of reactive oxygen species by proline under stress in plants. Curr Sci 2002;82:525–32.Search in Google Scholar
39. Beta T, Nam S, Dexter JE, Sapistein H. Phenolic content and antioxidant activity of pearled wheat and roller-milled fractions. Cereal Chem 2005;28:390–3.10.1094/CC-82-0390Search in Google Scholar
40. Sgherri C, Cosi E, Navari-Izzo F. Phenols and antioxidative status of Raphanus sativus grown in copper excess. Physiol Plant 2003;118:21–8.10.1034/j.1399-3054.2003.00068.xSearch in Google Scholar PubMed
©2018 Walter de Gruyter GmbH, Berlin/Boston
Articles in the same Issue
- Frontmatter
- Research Articles
- Betaine treatment decreased serum glucose and lipid levels, hepatic and renal oxidative stress in streptozotocin-induced diabetic rats
- Oxidative stress and response of antioxidant system in Nostoc muscorum exposed to different forms of Zinc
- An investigation on Trakya region Oak (Quercus spp.) honeys of Turkey: their physico-chemical, antioxidant and phenolic compounds properties
- Effects of Shiranuhi flower extracts and fractions on lipopolysaccharide-induced inflammatory responses in murine RAW 264.7 cells
- Evaluation of resveratrol organogels prepared by micro-irradiation: fibroblast proliferation through in vitro wound healing
- Ecological and phytochemical attributes of endemic Ferula gummosa Boiss. at vegetative and generative stages
- Characterization of calmodulin in the clam Anodonta woodiana: differential expressions in response to environmental Ca2+ and Cd2+
- Foliar application effects of salicylic acid and jasmonic acid on the essential oil composition of Salvia officinalis
- Antioxidant and antimicrobial activities of four Astragalus species growing wild in Turkey
- Differences in structure, allergenic protein content and pectate lyase enzyme activity of some Cupressaceae pollen
- In vitro bioactivities and subacute toxicity study of O. basilicum, T. vulgaris and R. officinalis
- Wendlandia exserta: a pertinent source of antioxidant and antimicrobial agent
- Effects of epigallocatechin-3-gallate (EGCG) on a scleroderma model of fibrosis