Comparison of ELISA and flow cytometry for measurement of interleukin-1 beta, interleukin-6 and tumor necrosis factor-α
-
Aysun Çetin

 ,
Behzat Çimen
,
Behzat Çimen

Abstract
Background
Although majority of the previous studies have shown a good correlation between enzyme linked immuno sorbent assay (ELISA) and flow cytometry in terms of cytokines, two laboratory methods usually were compared with the regression analysis and correlation in the literature. This study aimed at comparing the ELISA and flow cytometry assay for measuring cytokines by using two different statistical methods, regression analysis and Bland-Altman plot.
Materials and methods
Fifty patients, diagnosed with hypercholesterolemia and expecting high level serum cytokines, and 30 healthy volunteers, expecting normal level serum cytokines, were enrolled in the study. The interleukin-1 beta (IL-1β), interleukin-6 (IL-6) and tumor necrosis factor-alpha (TNF-α) were measured using ELISA, and compared with obtained levels using flow cytometric method.
Results
Although regression analysis showed that the two methods are compatible with measurements of IL-1β, IL-6 and TNF-α, they tended to show dissimilarity with measurements of IL-1β and TNF-α based on Bland-Altman graphs.
Conclusion
According to Bland-Altman plot, our results providing evidence of ELISA and flow cytometry assays were compatible with each other for IL-1β and IL-6 measurements compared to TNF-α measurement. However, our study has a small number of participants, hence this study need to be confirmed by investigations involving more participants.
Özet
Amaç
Önceki çalışmaların büyük çoğunluğu, sitokinler açısından Enzim Bağlı İmmüno Sorbent Testi (ELISA) ile akış sitometrisi arasında iyi bir korelasyon olduğunu göstermesine rağmen, iki laboratuvar yöntemi literatürde genellikle regresyon analizi ve korelasyon ile karşılaştırılmıştır. Bu çalışmada, iki farklı istatistiksel yöntem olan regresyon analizi ve Bland-Altman grafiği kullanılarak sitokinlerin ölçümü için ELISA ve akış sitometri analizinin karşılaştırılması amaçlanmıştır.
Gereç ve Yöntem
Hiperkolesterolemi tanısı konulan ve yüksek düzeyde serum sitokin düzeyleri beklenen elli hasta ve normal serum sitokin düzeyleri beklenen 30 sağlıklı gönüllü çalışmaya dâhil edildi. İnterlökin-1 beta (IL-1β), interlökin-6 (IL-6) ve tümör nekrozis faktör-alfa (TNF-α) ELISA kullanılarak ölçüldü ve akış sitometri yöntemi kullanılarak elde edilen düzeylerle karşılaştırıldı.
Bulgular
Regresyon analizi, iki yöntemin IL-1β, IL-6 ve TNF-α’nın ölçülmesinde uyumlu olduklarını göstermesine rağmen, Bland-Altman grafiğine göre iki yöntemin IL-1β ve TNF-α’nın ölçümünde farklılık gösterme eğiliminde olduğu belirlendi.
Sonuç
Bland-Altman grafiğine göre; sonuçlarımız, ELISA ve akış sitometrisi analizlerinin IL-1β ve IL-6 ölçümünde, TNF-α ölçümüne göre daha uyumlu olduğunu kanıtlamaktadır. Bununla birlikte, çalışmamızın az sayıda katılımcı içermesi nedeniyle daha fazla katılımcıyı içeren araştırmalarla bu çalışmanın doğrulanması gerekmektedir.
Introduction
Cytokines are crucial immunoregulators that act an important part in hematopoiesis, inflammation; and they display great importance for the diagnosis and follow-up of many diseases [1]. Cytokines are small, soluble proteins which act as immune mediators and together form the communication network for the immune system. Therefore, cytokine profiling may provide precious mechanistic data for many inflammatory and immune disease states [2]. Typically, cytokines including interleukin-1 beta (IL-1β), interleukin-6 (IL-6) and tumor necrosis factor-alpha (TNF-α) have been measured by enzyme linked immuno sorbent assay (ELISA) for years. This well-developed methodology necessitates significant sample volumes for each analyte, which is labor intensive, time consuming, but limited to single analyte at a time; however, it is generally cost-effective [3], [4]. These limitations are circumvented by flow cytometry, an optimized method of intracellular cytokine detection in specific cells [5]. The implementation depends on the capacity of the flow cytometer to detect molecules either within or on the surface of a cell or microbead supports [3], [4], [5], [6], [7], [8], [9]. However, it is possible that every researcher may not have access to this optimized method or may have to choose ELISA for some reasons.
When investigators need to change one method for another one, or assess a new or alternative method, or quite simply they have a concordance problem between two instruments, they are in need of some tools to measure and appraise the differences as well as the causes of these differences [10]. As new technologies for the detection of cytokines continue to emerge, it is necessary to evaluate them carefully for clinical utility [11]. There are many studies comparing ELISA and flow cytometry, which are used for a long time in the measurement of cytokine levels [12], [13], [14]. For example, Carson and Vignali compared ELISA and flow cytometric methods in terms of 15 cytokines, and they showed that both methods are compatible with IL-1β and TNF-α and flow cytometric method which is more sensitive [12]. Chen et al. found that correlation coefficient (r) of the two methods is 0.97 and flow cytometry has statistically significant lower coefficient of variation values than those of ELISA [13]. Kellar et al. noted that there were significantly high correlations between the two methods in terms of TNF-α [14].
Laboratory methods are usually compared by researchers using regression and correlation analyzes [15]. Indeed, when previous studies on cytokines are examined, it is also seen that great majority of the investigations give the product-moment correlation coefficient between the results of the two measurement methods as an indicator of compliance [1], [3], [12; 13; 14]. However, correlation analysis is aimed for two different variables to determine a nonlinear trend, and r measures the strength of the linear connection between the two variables [10], [11]. Moreover, these statistical methods are criticized for producing generally overestimated measures or may give totally erroneous results in some specific cases [14]. Therefore, correlation analysis is criticized for usually generating overestimated measures or may give totally erroneous results in some specific cases [15], [16].
An alternative method for comparing these two methods is Bland-Altman method which supplies an intuition to assess whether both can be employed alternatively or not [10], [16]. Bland-Altman method depends on visualization of variances in measurements employing a graphical approach to plot the difference against the mean of the measurements [14]. Bland-Altman method computes the average difference between two methods of measurement and standard deviation (SD) of the difference, and calculates ‘95% limit of agreement’ as the mean difference. The presentation of ‘95% limit of agreement’ on Bland-Altman plot permits visual decision of how well two measurement methods are in concordance with each other. Smaller range between the limit might be commented as better compliance [15], [16], [17], [18].
Although majority of the previous studies have shown a good correlation between ELISA and flow cytometry in terms of cytokines, two laboratory methods usually compare the regression analysis and correlation in the literature [4], [12, 13, 14]. Nevertheless, there have been no studies comparing ELISA and Flow methods, which have been used for many years in cytokine measurement, with Bland-Altman plot. Therefore, we aimed at comparing ELISA and flow cytometry assays for measuring IL-1β, IL-6 and TNF-α levels by using not only linear regression but also Bland-Altman plot, which is based on the quantification of the agreement between two quantitative measurements by studying the mean difference and constructing limits of agreement.
Materials and methods
Study groups
The study group included 50 patients aged 18–65 diagnosed with hypercholesterolemia and 30 healthy subjects who appeared at the outpatient clinic of Faculty of Medicine, Erciyes University in Kayseri, Turkey. The study protocol was approved by the Ethics Committee of Erciyes University (05.02.2013-2013/119). LDL limit was determined according to the National Cholesterol Education Program, European Society of Cardiology, and European Atherosclerosis Society, Current Medical Diagnosis and Treatment 2013 [19]. Patients were informed about the research and they signed the “informed consent form” according to Helsinki Declaration. The subjects with renal failure, coronary artery disease, liver disease, immune system diseases, diabetes, systemic disease, hypertension, and receiving treatment via lipid-lowering drugs for any reason were excluded from the study. Together with patients with similar age and gender distributions, 30 healthy volunteers who had no systemic diseases, and were nonsmokers, and did not use any drugs and whose body mass indexes were within the range of 18.5–24.9 kg/m2 were included in study.
Sampling and storage
Blood samples were drawn into one CBC tubes containing ethylenediaminetetraacetic acid; yet, one of the tubes was without anticoagulant by the venipuncture technique after an overnight (≥12 h) fast. Blood specimens were allowed to clot for 30 min. Then, tubes were centrifuged at 2000×g for 10 min at 4°C and aliquots of samples were stored at −40°C for measurement.
Determination of IL-1β, IL-6 and TNF-α by flow cytometry
Concentrations of IL-1β, IL-6 and TNF-α were determined using the BD CBA Flex Set System and the BD Human Soluble Protein Master Buffer Kit (Catalog number: 558264, BD Bioscience-PharMingen, San Diego, CA, USA). This kit allows the simultaneous measurement of levels of IL-1β, IL-6 and TNF-α in a single sample. The kit included three bead populations with distinct fluorescence intensities. The beads were coated with capture antibodies specific to IL-1β, IL-6 and TNF-α (Catalog numbers: 558279, 558276, 558273, respectively) and mixed with phycoerythrin (PE) conjugated detection antibodies. These capture beads were incubated with recombinant standards or test samples to form sandwich complexes. The cost-benefit analysis was resolved in the FL-3 channel of a FACSCalibur flow cytometer (BD Bioscience-Pharmingen), and the results were produced in graphic and tabular formate employing cost-benefit analysis software (BD Bioscience-Pharmingen). The assay sensitivities for IL-1β, IL-6 and TNF-α were 0.8, 12.6 and 3.4 pg/mL, respectively.
The tests were conducted and analyzed in line with the producer’s instructions. For determination of IL-1β, IL-6 and TNF-α, the blood samples were run without predilution. Briefly, 50 μL of each sample was mixed with 50 μL of mixed capture beads and 50 μL of the human inflammation PE detection reagent consisting of PE-conjugated anti-mouse IL-1β, IL-6 and TNF-α. The samples were incubated at room temperature for 2 h in the dark. After incubation with the PE detection reagent, the samples were washed once and resuspended in 300 μL of wash buffer before acquisition on the FACSCalibur (Becton Dickinson). The BD FACSCalibur flow cytometer (BD Bioscience) was calibrated with setup beads, and 300 events were gained for each factor and each sample. Individual analyte concentrations were demonstrated by their fluorescence intensities and computed with their respective standard reference curve and FCAP array software [20], [21].
Determination of IL-1β, IL-6 and TNF-α by ELISA
TNF-α
The serum TNF-α levels were detected using a commercial ELISA kit (Boster: EK0525) according to the manufacturers’ protocols. Boster’s rat TNF-α ELISA kit was based on standard sandwich ELISA technology. A monoclonal antibody from mouse specific to TNF-α was precoated onto 96-well plates. Standards and test samples were added to the wells, and afterwards a biotinylated detection polyclonal antibody from goat specific to TNF-α was added, and then the process continued by washing with PBS or TBS buffer. Avidin-biotin-peroxidase complex was added and unbound conjugates were washed away with PBS or TBS buffer. HRP substrate TMB was utilized to visualize HRP enzymatic reaction. TMB was catalyzed by HRP to generate a blue color product that converted into yellow after adding acidic stop solution. The density of yellow is proportional to human TNF-α amount of sample captured in plate.
IL-1β and IL-6
The serum levels of IL-1β and IL-6 were detected using commercial invitrogen brand ELISA kits (catalog number for IL-1β: KHC0011 and for IL-6: KHC0061) according to the manufacturers’ protocols. These kits use ELISA based monoclonal antibodies specific to Human IL-1β; and Human IL-6 are coated onto the wells of the microtiter strips provided. Samples, including standards of known IL-1β and IL-6 content, control specimens, and unknowns, were pipetted into these wells. During the first incubation, the IL-1β and IL-6 antigens bound to the immobilized (capture) antibodies on one site. After washing, a biotinylated monoclonal antibodies specific to IL-1β and IL-6 were added. During the second incubation, this antibody bound to the immobilized IL-1β and IL-6 captured during the first incubation. After removal of excess second antibody, streptavidin-peroxidase (enzyme) was added. This bound to the biotinylated antibody to complete the four-member sandwich. After a second incubation and washing to remove all unbound enzyme, a substrate solution was added, which acted upon by the bound enzyme to produce color. We measured the absorbance of each well at 450 nm after having added 100 μL of stop solution. The intensity of this colored product was directly proportional to the concentration of IL-1β and IL-6 present in the original specimen.
Statistical analysis
Statistical analyses were performed using statistics programs with IBM SPSS Statistics 20.0. The normality of the data was assessed by the Shapiro-Wilk normality test and Q-Q graphs. Data were expressed as numbers for categorical variables and mean±SD or median (25th–75th percentile) for continuous variables. Comparisons between groups were performed using the Mann-Whitney U-test (non-normal distribution) and independent samples t-test (normal distribution). Gender comparison was made with the exact method of the χ2-test. Accordance of ELISA and the flow cytometric method was assessed by Passing and Bablok regression, intra class correlation coefficient (ICC) and Bland-Altman analysis in MedCalc 12.7.5.0 program. Passing and Bablok regression results interpretation: “Regression equation (y=a+bx) revealed constant [regression line’s intercept (a)] and proportional [regression line’s slope (b)] difference with their confidence intervals of 95% (95% CI). CI explain if their value differ from value zero (0) for intercept and value one (1) for slope only by chance. Thus, if 95% CI for intercept includes value zero it can be concluded that there is no significant difference between obtained intercept value and value zero and there is no constant difference between two methods. Respectively, if 95% CI for slope includes value one, it can be concluded that there is no significant difference between obtained slope value and value one and there is no proportional difference between two methods” [22]. Statistical significance was set at 0.05.
Results
The mean ages of patients were 46.94±9.11 and of the controls were 46.26±8.11. There was no difference between patients and controls in terms of age, gender, weight, height and BMI values (Table 1). Clinical and laboratory parameters of the study population are given in Table 1.
Clinical and laboratory parameters of the study population.
| Parameters | Patients (n:50) | Controls (n:30) | p-Value |
|---|---|---|---|
| Age (year) | 46.94±9.11 | 46.26±8.11 | 0.740 |
| Gender (M/F) | 18 (36%)/32 (64%) | 11 (36.6%)/19 (63.4%) | 0.952 |
| Weight (kg) | 61.50 (56–72) | 62.00 (58–73) | 0.560 |
| Height (m) | 1.61 (1.54–1.71) | 1.59 (1.58–1.76) | 0.344 |
| BMI (kg/m2) | 23.95 (23.01–24.56) | 23.85 (22.97–24.46) | 0.376 |
| LDL (mg/dL) | 188.4 (171.6–206.2) | 93.4 (80.8–98.4) | <0.001 |
| Cholesterol (mg/dL) | 264 (254–287) | 158 (147–169) | <0.001 |
Data are expressed as number for categorical variables and mean±SD or median (25th–75th percentile) for continuous variables.
When measured with ELISA and flow cytometry methods, IL-1β, IL-6 and TNF-α levels in patients were found to be significantly higher (p<0.001) than those of the control group (Table 2). There was no significant difference (p>0.05) between male and female gender groups in terms of ELISA and flow methods for cytokines.
Comparison of the study groups in terms of IL-1β, IL-6 and TNF-α.
| Parameters | Patients (n:50) | Controls (n:30) | p-Value |
|---|---|---|---|
| IL-1β (pg/mL) | |||
| ELISA | 42.6 (39.64–45.74) | 30.68 (27.63–35.02) | <0.001 |
| FLOW | 45.22 (41.20–48.02) | 32.06 (28.45–36.41) | <0.001 |
| IL-6 (pg/mL) | |||
| ELISA | 45.85 (38.41–52.38) | 39.49 (30.72–40.93) | <0.001 |
| FLOW | 46.51 (39.65-53.98) | 40.35 (33.54-42.54) | <0.001 |
| TNF-α (pg/mL) | |||
| ELISA | 28.76±6.66 | 19.18±6.40 | <0.001 |
| FLOW | 41.11±8.86 | 29.04±8.29 | <0.001 |
Data are expressed as number for categorical variables and mean±SD or median (25th–75th percentile) for continuous variables.
When an in-class correlation analysis was performed to examine the agreement between ELISA and flow cytometry in terms of IL-1β, ICC of ELISA and flow cytometry was found to be 0.9975, and it was observed that there was an agreement between the two methods (Figure 1A). Although both methods are in agreement with ICC result, Passing and Bablok regression analysis results showed that there is a minimal proportional error for IL-1β. Passing and Bablok regression results demonstrated that there is no constant error between the values obtained by ELISA and flow cytometry methods, but a proportional bias is observed in terms of IL-1β.

Regression and Bland-Altman graphics for measurement of IL-1β.
(A) y=−0.04+1.04x, 95% confidence intervals for a and b were found as (−0.55–0.01) and (1.04–1.05), respectively/intra class correlation coefficient=0.997. (B) It is seen that the differences between the two methods are not show an intercept error around zero for IL-1β.
On the other hand, it was found that Bland-Altman graph supports Passing and Bablog results and there is a proportional error in terms of IL-1β. Figure 1B shows that the differences were observed between −3.3 and −0.1. The difference between ELISA and flow cytometry is usually below zero point (Figure 1B). However, it was observed that as the mean values increased, the difference steadily decreased in general. The IL-1β levels were measured by flow cytometry as 0−2% more than the ELISA method at lower values of IL-1β. At high values of IL-1β, the IL-1β levels were measured by flow cytometry as 2–4% more than the ELISA method. Thus, as a result, a constant error is present between ELISA and flow cytometry in terms of IL-1β.
For measurement of IL-6, it was observed that there is no proportional error between the values obtained by ELISA and flow cytometry methods, but a constant error is observed in terms of IL-6. When an intra-class correlation analysis was performed to examine the agreement between ELISA and flow cytometry in terms of IL-6; ICC of ELISA and flow cytometry was found to be 0.9979, and there was an agreement between the two methods (Figure 2A). For the same parameter, the differences were between −2.8 and 0.02 (Figure 2B). Difference between ELISA and flow cytometry is usually below zero point. In this case, the IL-6 levels are measured by flow cytometry in an average of 1.39 units more than the ELISA method. Thus, a constant error is present between ELISA and flow cytometry in terms of IL-6.
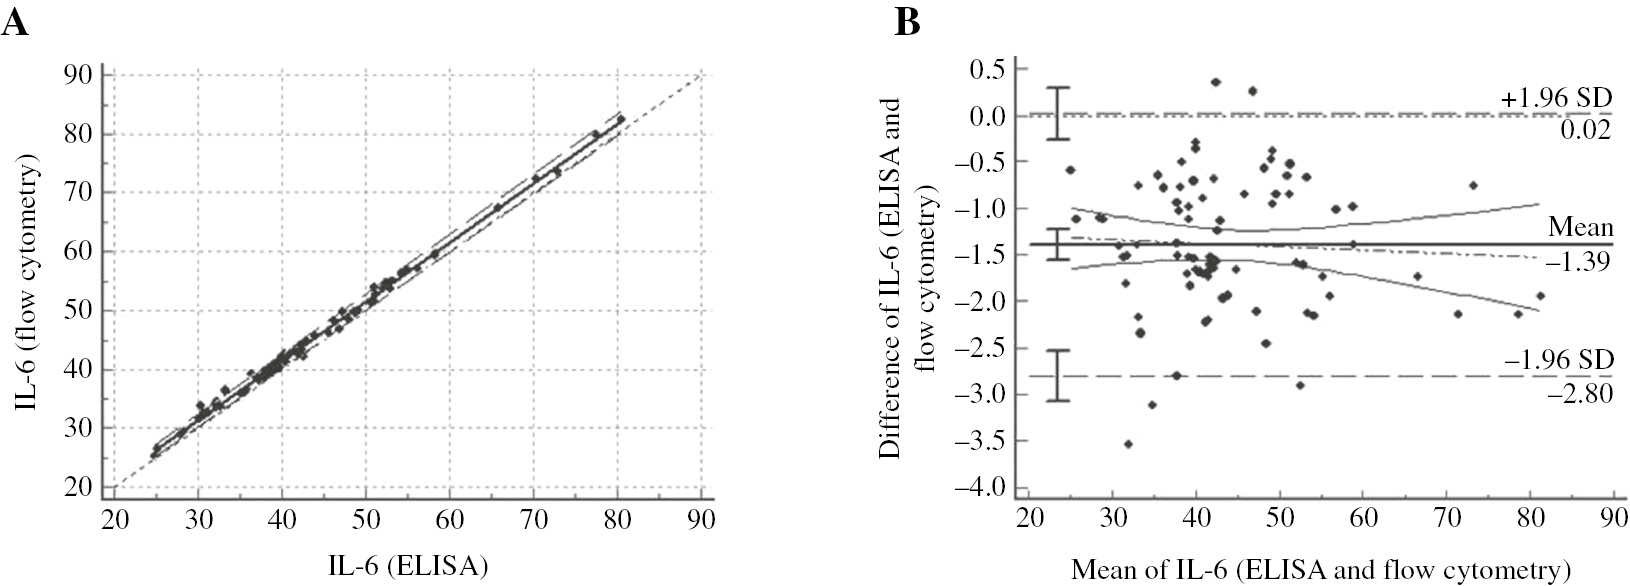
Regression and Bland-Altman graphics for measurement of IL-6.
(A) y=1.33+1.00x, 95% confidence intervals for a and b were found as (0.68–1.94) and (0.99–1.02), respectively/intra class correlation coefficient=0.997. (B) It is seen that the differences between the two methods are not show a proportional error around zero for IL-6.
For measurement of TNF-α, there is no constant error between the values obtained by ELISA and flow cytometry methods, but a proportional bias is observed in terms of TNF-α. When an in-class correlation analysis was performed to examine the agreement between ELISA and flow cytometry in terms of TNF-α; ICC of ELISA and flow cytometry was found to be 0.9215, and there was an agreement between the two methods (Figure 3A). For the same parameter, Figure 3B indicates that there were differences between −18.3 and −4 on Bland-Altman average difference graphics. The difference between ELISA and flow cytometry was below zero point. However, it was observed that as the mean increased, the difference steadily decreased in general (Figure 3B). In this case, the TNF-α levels are measured by flow cytometry in an average of 11.2 units more than the ELISA method. Thus, as a result, a constant error is present between ELISA and flow cytometry in terms of TNF-α.
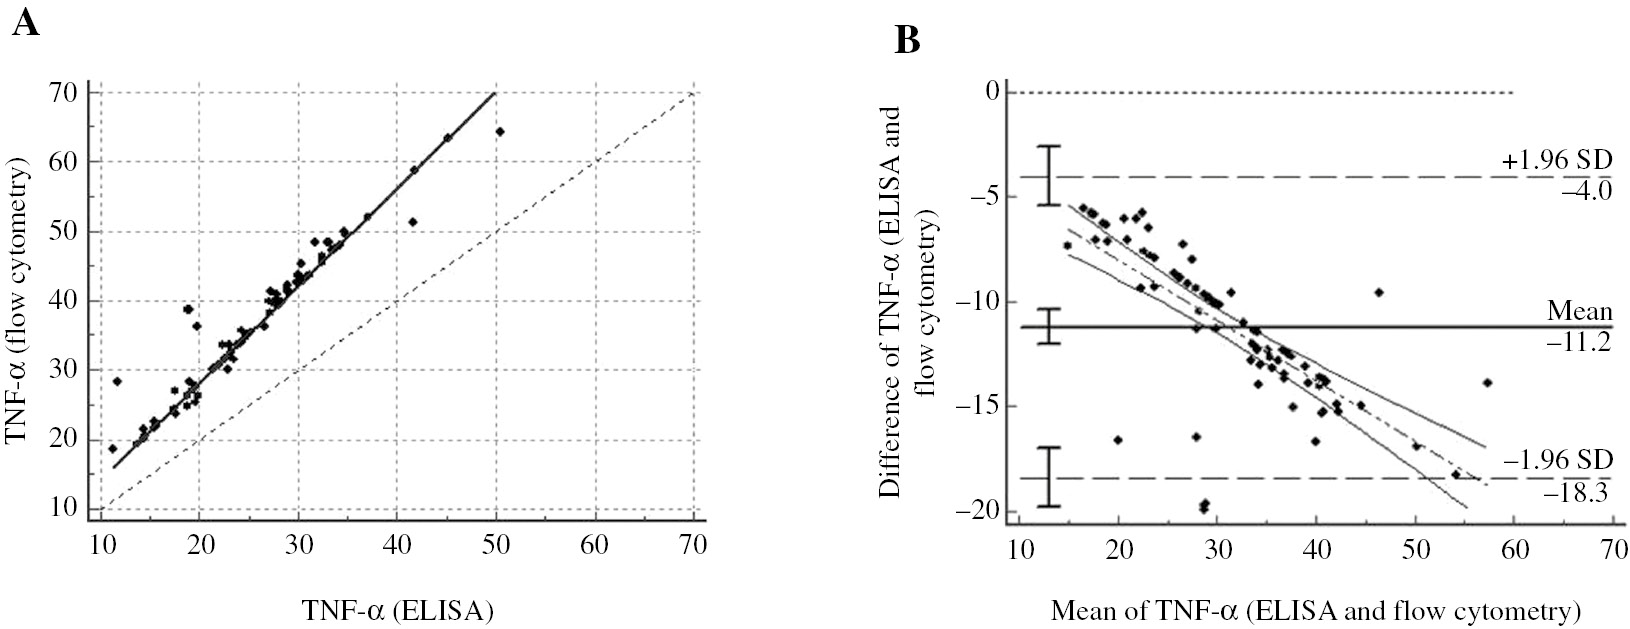
Regression and Bland-Altman graphics for measurement of TNF-α.
(A) y=−0.002+1.403x, 95% confidence intervals for a and b were found as (−0.06–0.02) and (1.40–1.41), respectively/intra class correlation coefficient=0.921. (B) It is seen that the differences between the two methods are not show an intercept error around zero for TNF-α.
Discussion
In current study, we compared the ELISA and flow cytometry assay for measuring the levels of IL-1β, IL-6 and TNF-α using regression analysis and Bland-Altman plot. Our results demonstrated that trends for the levels of IL-1β, IL-6 and TNF-α had correlation between ELISA and flow cytometry method. However, Bland-Altman analysis showed that the limits of agreement for IL-1β and IL-6 were small enough to be confident.
The availability of methods to measure cytokines, which are crucial for fighting off infections and for other immune responses, is critically important. ELISA is the most widely used and best validated method, but it measures only a single cytokine in each sample [16]. This explains the high reagent costs, excessive technician time, and large sample volumes necessary to produce each result. The capacity to detect and quantitate many cytokines simultaneously on the same sample via a robust flow cytometry would decrease these costs and enhance efficiency [4], [23]. Nevertheless, the flow cytometric assay becomes cheaper than ELISA only if six or more cytokines are measured simultaneously, as the number of reagents used for per cytokine assay can be significantly reduced [12].
ELISA kits, used in our study, for IL-1β, IL-6 and TNF-α (from Invitrogen Brand and Boster) are reported to have sensitivity under 1 pg/mL, 2 pg/mL and 1 pg/mL, respectively. Furthermore, flow cytometry kits used in our study, for IL-1β, IL-6 and TNF-α (from BD biosciences) are reported to have enhanced sensitivity at an approximate value of less than 0.3 pg/mL. In the typical double antibody sandwich ELISA, antibody stuck to the bottom of a well provides not only antigen capture but also immune specificity, while another antibody linked to enzyme supplies detection and an amplification factor. This approach enables accurate and sensitive detection of the antigen, the cytokine of interest [4]. On the other hand, the use of fluorescence in flow cytometry assay, rather than colorimetric measurements, may provide more sensitivity, specificity and a broader range for cytokines quantitation [24].
Medical scientists frequently need to compare two methods of measurement, or a new method with a fixed one, to determine whether these two methods can be employed interchangeably or the new method can substitute the fixed one [15]. Although these differences are known, it has been suggested that good correlations were observed between ELISA and flow cytometry for cytokines in the literature [4], [12, 13, 14]. However, there have been many researchers who have reported a high correlation coefficient, and mistakenly interpreted the results as evidence of agreement between ELISA and flow cytometry for measuring cytokines [22], [25], [26]. Therefore, correlation coefficient is criticized for generally producing overestimated measures or may give generally erroneous results in some specific cases [10], [16], [27], [28].
In our study, consistent with previous studies, ELISA and flow cytometry methods have compliance with IL-1β, IL-6 and TNF-α performed with regression analysis. However, Bland-Altman plot, which supplies an intuition to assess whether both can be employed alternatively or not, showed that this compatibility was not so easy. If a regression line was suited to Bland-Altman plot, it was argued that proportional bias occurred if the gradient of the slope substantially differed from zero [10], [16]. Nevertheless, Ludbrook claimed that the existence of bias in the analysis was because of some kind of statistical possibility [29]. An approach employing least-products regression to fit the regression line in Bland-Altman plot has been alleged to remove the bias problem in Bland-Altman plots [10]. When it comes to the so-called 95% limits of agreement, it is obvious from the foregoing that only when there is no proportional bias, this technique can be utilized securely to decide whether one method complies well enough with the other so that either can be employed in clinical applications [10], [29].
In our study, when an in-class correlation analysis is performed to examine the agreement between ELISA and flow cytometry in terms of IL-1β, IL-6 and TNF-α, it is observed that there is an aggrement between the two methods.
Kellar et al. measured IL-6 by means of both ELISA and flow cytometry; and they found that two methods were compatible with each other in terms of IL-6 measurement [14]. Carson and Vignali reported that the two methods were compatible with each other for measuring IL-6; and flow cytometry method was significantly more sensitive than ELISA [12].
In our study, Bland-Altman analysis demonstrated that the IL-1β levels were measured by flow cytometry as 4% more than the ELISA method. Since there is a proportional error that can be overlooked, it may be suggested that the two methods were high compatible with each other for IL-1β. Bland-Altman analysis also demonstrated that the IL-6 levels were measured by flow cytometry as 3.4% more than the ELISA method. Since the proportional error is low, it may be suggested that the ELISA and flow cytometry assays are compatible with each other for IL-6, but it should be taken into account that the constant error is 1.33. On the other hand, according to Bland-Altman analysis, there was constant bias between ELISA and flow cytometry for measuring the levels of TNF-α. The TNF-α levels were measured by flow cytometry as 31% higher than that of the ELISA method. Since the constant error is too low but the proportional error is high, it may be suggested that ELISA and flow cytometry assays were not compatible with each other for TNF-α measurement.
Bland-Altman analysis demonstrated that 95% of the differences between ELISA and Luminex values were within ±1.96 SD from the mean difference indicated by the 95% limits of agreement for the measurements of IL-6 and IL-8 [30]. They also found that there was no constant bias as a function of inflammation level. Thus, they suggested that the limits of agreement for IL-6 and IL-8 were small enough to be confident that Luminex can be used in place of ELISA.
According to our knowledge of literature, ELISA and flow cytometry assay were, for the first time, compared via this study by using Bland-Altman plot for measuring cytokines levels. In this study, Bland-Altman analysis demonstrated that the limits of agreement for IL-1β and IL-6 were small enough to be confident. As the number of samples increases, even the smallest differences between methods indicate the existence of a constant error. Nevertheless, this study has some limitations. Firstly, the small number of participants may have limited our findings to be generalized. Secondly, we collected only blood samples, while other body fluid samples were absent in the study. Lastly, the lack of limits of agreement knowledge between ELISA and flow cytometry for measurement of other cytokines such as IL-4, IL-10, IL-13, etc., still remains unclear. Therefore, further investigations are necessary in order to make a more comprehensive evaluation between the two methods for the measurement of cytokines.
Conclusion
In the present study, it was found that ELISA and flow cytometry complied with measuring the levels of IL-1β, IL-6 and TNF-α as a result of correlation analysis. Bland-Altman plot, which proposed an alternative analysis, based on the quantification of the agreement between two quantitative measurements by studying the mean difference and constructing limits of agreement, and showed that the TNF-α levels were measured by flow cytometry as 31% more than the ELISA method. According to the limits of agreement for IL-1β and IL-6, they were small enough to be confident, and it may be suggested that ELISA and flow cytometry assays were high compatible with each other for IL-1β while two methods were compatible with each other for IL-6 measurement. However, our study has a small number of subjects and parameters; so, the subject deserves further investigation.
Acknowledgments
This research work was supported by Grants from Erciyes University Scientific Research Project Coordination Center (Project number: TTU-2013-4523).
Conflict of interest: The authors report no declarations of interest.
References
1. Chaudhry H, Zhou J, Zhong Y, Ali MM, McGuire F, Nagarkatti PS, et al. Role of cytokines as a double-edged sword in sepsis. In Vivo 2013;27:669–84.Search in Google Scholar
2. Elsabahy M, Wooley KL. Cytokines as biomarkers of nanoparticle immunotoxicity. Chem Soc Rev 2013;42:5552–76.10.1039/c3cs60064eSearch in Google Scholar PubMed PubMed Central
3. Skogstrand K. Multiplex assays of inflammatory markers, a description of methods and discussion of precautions – our experience through the last ten years. Methods 2012;56:204–12.10.1016/j.ymeth.2011.09.025Search in Google Scholar PubMed
4. Leng SX, McElhaney JE, Walston JD, Xie D, Fedarko NS, Kuchel GA. ELISA and multiplex technologies for cytokine measurement in inflammation and aging research. J Gerontol A Biol Sci Med Sci 2008;63:879–84.10.1093/gerona/63.8.879Search in Google Scholar PubMed PubMed Central
5. Freer G, Rindi L. Intracellular cytokine detection by fluorescence-activated flow cytometry: basic principles and recent advances. Methods 2013;61:30–8.10.1016/j.ymeth.2013.03.035Search in Google Scholar PubMed
6. Daubeuf F, Becker J, Aguilar-Pimentel JA, Ebel C, Hrabě de Angelis M, Hérault Y, et al. A fast, easy, and customizable eight-color flow cytometric method for analysis of the cellular content of bronchoalveolar lavage fluid in the mouse. Curr Protoc Mouse Biol 2017;7:88–99.10.1002/cpmo.26Search in Google Scholar PubMed
7. Dabitao D, Margolick JB, Lopez J, Bream JH. Multiplex measurement of proinflammatory cytokines in human serum: comparison of the meso scale discovery electrochemiluminescence assay and the cytometric bead array. J Immunol Methods 2011;372:71–7.10.1016/j.jim.2011.06.033Search in Google Scholar PubMed PubMed Central
8. Stenken JA, Poschenrieder AJ. Bioanalytical chemistry of cytokines – a review. Anal Chim Acta 2015;853:95–115.10.1016/j.aca.2014.10.009Search in Google Scholar PubMed PubMed Central
9. Rountree W, Vandergrift N, Bainbridge J, Sanchez AM, Denny TN. Statistical methods for the assessment of EQAPOL proficiency testing: ELISpot, luminex, and flow cytometry. J Immunol Methods 2014;409:72–81.10.1016/j.jim.2014.01.007Search in Google Scholar PubMed PubMed Central
10. Giavarina D. Understanding Bland Altman analysis. Biochem Med 2015;25:141–51.10.11613/BM.2015.015Search in Google Scholar PubMed PubMed Central
11. Scott LE, Galpin JS, Glencross DK. Multiple method comparison: statistical model using percentage similarity. Cytometry B Clin Cytom 2003;54:46–53.10.1002/cyto.b.10016Search in Google Scholar PubMed
12. Carson RT, Vignali DA. Simultaneous quantitation of 15 cytokines using a multiplexed flow cytometric assay. J Immunol Methods 1999;227:41–52.10.1016/S0022-1759(99)00069-1Search in Google Scholar
13. Chen R, Lowe L, Wilson JD, Crowther E, Tzeggai K, Bishop JE, et al. Simultaneous quantification of six human cytokines in a single sample using microparticle-based flow cytometric technology. Clin Chem 1999;45:1693–4.10.1093/clinchem/45.9.1693Search in Google Scholar
14. Kellar KL, Kalwar RR, Dubois KA, Crouse D, Chafin WD, Kane BE. Multiplexed fluorescent bead-based immunoassays for quantitation of human cytokines in serum and culture supernatants. Cytometry 2001;45:27–36.10.1002/1097-0320(20010901)45:1<27::AID-CYTO1141>3.0.CO;2-ISearch in Google Scholar
15. Hanneman SK. Design, analysis, and interpretation of method-comparison studies. AACN Adv Crit Care 2008;19:223–34.10.1097/01.AACN.0000318125.41512.a3Search in Google Scholar
16. Lu MJ, Zhong WH, Liu YX, Miao HZ, Li YC, Ji MH. Sample size for assessing agreement between two methods of measurement by Bland-Altman method. Int J Biostat 2016;12:1557–4679.10.1515/ijb-2015-0039Search in Google Scholar
17. Zaki R, Bulgiba A, Ismail R, Ismail NA. Statistical methods used to test for agreement of medical instruments measuring continuous variables in method comparison studies: a systematic review. PLoS One 2012;7:e37908.10.1371/journal.pone.0037908Search in Google Scholar
18. Kim HY. Statistical notes for clinical researchers: evaluation of measurement error 2: Dahlberg’s error, Bland-Altman method, and Kappa coefficient. Restor Dent Endod 2013;38:182–5.10.5395/rde.2013.38.3.182Search in Google Scholar
19. Reiner Z, Catapano AL, De Backer G, Graham I, Taskinen MR, Wiklund O, et al. ESC/EAS guidelines for the management of dyslipidaemias: the Task Force for the management of dyslipidaemias of the European Society of Cardiology (ESC) and the European Atherosclerosis Society (EAS). Eur Heart J 2011;32:1769–818.10.1093/eurheartj/ehr158Search in Google Scholar
20. Maier R, Weger M, Haller-Schober EM, El-Shabrawi Y, Theisl A, Barth A, et al. Application of multiplex cytometric bead array technology for the measurement of angiogenic factors in the vitreous. Mol Vis 2006;12:1143–7.Search in Google Scholar
21. Borkenstein A, Faschinger C, Maier R, Weger M, Theisl A, Demel U, et al. Measurement of tumor necrosis factor-alpha, interleukin-6, Fas ligand, interleukin-1α, and interleukin-1β in the aqueous humor of patients with open angle glaucoma using multiplex bead analysis. Mol Vis 2013;19:2306–11.Search in Google Scholar
22. Bilić-Zulle L. Comparison of methods: Passing and Bablok regression. Biochem Med (Zagreb) 2011;21:49–52.10.11613/BM.2011.010Search in Google Scholar
23. Young SH, Antonini JM, Roberts JR, Erdely AD, Zeidler-Erdely PC. Performance evaluation of cytometric bead assays for the measurement of lung cytokines in two rodent models. J Immunol Methods 2008;331:59–68.10.1016/j.jim.2007.11.004Search in Google Scholar
24. Tanqri S, Vall H, Kaplan D, Hoffman B, Purvis N, Porwit A, et al. Validation of cell-based fluorescence assays: practice guidelines from the ICSH and ICCS – part III – analytical issues. Cytometry B Clin Cytom 2013;84:291–308.10.1002/cyto.b.21106Search in Google Scholar
25. Naguib IA, Abdelaleem EA, Zaazaa HE, Hussein EA. Partial least-squares and linear support vector regression chemometric methods for simultaneous determination of amoxicillin trihydrate and dicloxacillin sodium in the presence of their common impurity. J AOAC Int 2016;99:972–9.10.5740/jaoacint.16-0033Search in Google Scholar PubMed
26. Davis RL, Liang C, Sue CM. A comparison of current serum biomarkers as diagnostic indicators of mitochondrial diseases. Neurology 2016;86:2010–5.10.1212/WNL.0000000000002705Search in Google Scholar PubMed PubMed Central
27. Genc Y, Sertkaya D, Demirtas S. The statistical methods used to study the integration of the two measurement techniques in clinical research. J Ankara Univ Fac Med 2003;56:1–6.Search in Google Scholar
28. Liu J, Tang W, Chen G, Lu Y, Feng C, Tu XM. Correlation and agreement: overview and clarification of competing concepts and measures. Shanghai Arch Psychiatry 2016;28:115–20.Search in Google Scholar
29. Ludbrook J. Statistical techniques for comparing measurers and methods of measurement: a critical review. Clin Exp Pharmacol Physiol 2002;29:527–36.10.1046/j.1440-1681.2002.03686.xSearch in Google Scholar PubMed
30. Zhu Y, Alapati D, Costa J, Maduskuie VL, Fawcett PT, Thomas H, et al. A comparison of enzyme-linked immunosorbent assay versus multiplex methodology using an in vitro model of pulmonary hypertension and inflammation. J Biomed Sci Eng 2014;7:419–26.10.4236/jbise.2014.77044Search in Google Scholar
©2018 Walter de Gruyter GmbH, Berlin/Boston
Articles in the same Issue
- Frontmatter
- Research Articles
- Evaluation of Gas6 and sAxl levels during attacks and attack-free periods of familial Mediterranean fever
- Do ovarian reserve markers predict the subsequent pregnancy outcomes in women with recurrent pregnancy loss?
- Evaluation of the relationship between TNFα, sTNFR1, sTNFR2, sIL2R, IL6, neopterin with disease activity in ankylosing spondylitis
- Evaluation of biological variations in glucose and glycated hemoglobin levels in healthy individuals
- Assessment of vitamin D deficiency level by the physiological response of parathyroid hormone in Turkish adults
- The comparison of two glucose measurement systems: POCT devices versus central laboratory
- Can ursolic acid be beneficial against diabetes in rats?
- Pediatric reference intervals of free thyroxine and thyroid stimulating hormone in three different hospitals
- Comparison of ELISA and flow cytometry for measurement of interleukin-1 beta, interleukin-6 and tumor necrosis factor-α
- The effects of vitamin D supplementation on healthy and hypercholesterolemic rabbits on levels of OSI and paraoxonase
- Short Communication
- Serum amylase or serum lipase, a comparison in acute pancreatitis
- Letters to the Editor
- Laboratory errors in the measurement of spectrin levels: detection range
- Improper coverage factor to compare expanded uncertainty with allowable total error
- Case Reports
- Idiopathic chylothorax in geriatrics: the oldest case report so far
- Myocarditis case associated with Campylobacter jejuni