Impurity measurements in hydrogen using laser spectroscopy: carbon monoxide as a case study
-
Victor Gorshelev
 ,
Gourab Dutta Banik
,
Gourab Dutta Banik
 and
Javis A. Nwaboh
and
Javis A. Nwaboh

Abstract
Hydrogen is an energy gas that is used commercially in a variety of applications that include fuel cells. Before utilization, hydrogen must meet certain quality characteristics. ISO 14687 specifies the limit values of impurities in H2. Carbon monoxide is an impurity that must be accurately measured in commercial H2 and its limit value as specified in ISO 14687 is 200 nmol/mol. In this work, we present a new laser spectrometric method for traceable CO impurity measurements in H2. The method is based on Optical Feedback Cavity Enhanced Absorption Spectroscopy (OF-CEAS). We demonstrate the applicability of the method by measuring CO amount fractions in H2 in the range of 0.05–20 μmol/mol. The traceability of the results to the SI units is addressed and uncertainties are evaluated following the GUM (Guide to the expression of uncertainty in measurement) principles. For the CO amount fraction measurement range of 0.05–20 μmol/mol, the relative combined uncertainty of the results is in the 1.5 % range, k = 1.
Zusammenfassung
Wasserstoff ist ein Energiegas, das kommerziell in einer Vielzahl von Anwendungen genutzt wird, darunter auch in Brennstoffzellen. Vor der Verwendung muss Wasserstoff bestimmte Qualitätsmerkmale erfüllen. Die ISO 14687 legt Grenzwerte für Verunreinigungen in H2 fest. Kohlenmonoxid ist eine Verunreinigung, die im kommerziellen Wasserstoff präzise gemessen werden muss; der in ISO 14687 festgelegte Grenzwert beträgt 200 nmol/mol. In dieser Arbeit stellen wir eine neue laserspektrometrische Methode zur rückführbaren Messung von CO-Verunreinigungen in H2 vor. Die Methode basiert auf der Optical Feedback Cavity Enhanced Absorption Spectroscopy (OF-CEAS). Wir demonstrieren die Anwendbarkeit der Methode durch Messung von CO-Stoffmengenanteilen in H2 im Bereich von 0,05–20 μmol/mol. Die Rückführbarkeit der Ergebnisse auf die SI-Einheiten wird sichergestellt, und die Messunsicherheiten werden gemäß den Grundsätzen des GUM (Guide to the Expression of Uncertainty in Measurement) bewertet. Für den Messbereich der CO-Stoffmengenanteile von 0,05–20 μmol/mol liegt die relative kombinierte Messunsicherheit der Ergebnisse im Bereich von 1,5 %, k = 1.
1 Introduction
Hydrogen is gaining prominence as a clean energy carrier, with applications spanning transportation, industry, and stationary power generation. However, to ensure its safe and efficient use, rigorous quality control is essential. Impurities such as carbon monoxide (CO), carbon dioxide (CO2), methane (CH4), ammonia (NH3), and water (H2O) can affect e.g. fuel cell performance i.e. catalyst longevity and overall system reliability. As a result, stringent purity requirements have been established in international standards such as ISO 14687 [1], which defines the minimum quality characteristics for hydrogen fuel across various applications including residential, commercial, industrial, vehicular, and stationary use [1]. ISO 14687 also establishes the necessary requirements to ensure hydrogen fuel complies with safety and performance standards, particularly as its role in energy systems expands to support greenhouse gas emission reduction efforts.
Carbon monoxide impurity measurements in H2, in particular, are becoming indispensable due to its detrimental effects on e.g. proton exchange membrane fuel cells (PEMFCs), even at trace levels. Carbon monoxide (CO) is a potent catalyst poison that significantly impairs fuel cell performance, necessitating a strict limit value for CO in H2. Although performance degradation caused by CO can be mitigated by adjusting operating conditions, these measures may not always be practical. Therefore, concerns remain regarding the long-term effects of CO exposure on fuel cell durability [1].
Ensuring compliance with the ISO 14687 standard demands highly reliable measurement methods, with a strong emphasis on traceability of results to e.g. the international system of units (SI) and GUM (Guide to the expression of uncertainty in measurement) compliant uncertainty assessment [2]. Despite significant progress, challenges remain in achieving low detection limits, minimizing measurement uncertainty, and establishing full traceability in impurity quantification. Existing techniques such as gas chromatography (GC), Fourier-transform infrared (FTIR) spectroscopy, and mass spectrometry (MS) are widely used for impurity analysis [3]. While GC and MS techniques offer robust analytical capabilities, they also come with limitations, including long analysis times, complex sample preparation, and sometimes difficulties in achieving near real-time or in situ/online monitoring at field sites.
Laser-based spectroscopic techniques have emerged as powerful tools for offline and online impurity detection in hydrogen, offering high sensitivity, rapid response times, and in situ measurement capabilities. In addition, an analyzer based on laser spectroscopy can deliver gas species amount fraction results which are directly traceable to the SI [4], [5]. A laser spectrometer that can deliver SI-traceable amount fraction results is called an Optical Gas Standard (OGS) [4]. PTB is actively developing Optical Gas Standards for a variety of gas species such as NO2, N2O and NH3 [4], [6]. A prominent example of a fully functional OGS is the PTB HCl OGS [4], [7].
This paper focuses on the application of laser spectroscopy for impurity quantification, using carbon monoxide (CO) as a case study. We present the results of CO measurements in H2 using an optical feedback cavity enhanced absorption spectroscopy (OF-CEAS) instrument, intended to be operated as an Optical Gas Standard. To best of our knowledge, this is the first time the OGS approach is being implemented using OF-CEAS for CO impurity analysis in H2. By leveraging the capability of this highly sensitive laser spectroscopic technique, we demonstrate its potential for highly accurate CO amount fraction measurements. The traceability of the results to the SI is addressed, as well as uncertainty estimation following GUM principles.
2 Experimentals
The experimental setup for CO impurity measurements in H2 is shown in Figure 1. It consists of a sample preparation (mixing system) unit and an existing OF-CEAS spectrometer that has been upgraded. Briefly, the OF-CEAS spectrometer has a V-shaped optical cavity (gas cell with a geometrical length of ∼40 cm) with three high reflectivity mirrors (R ≥ 99.99 %), resulting to a free spectral range (FSR) of ∼190 MHz. The spectrometer’s laser is a distributed feedback diode laser emitting around ∼2 µm and used to probe the target CO molecular transition. As the laser wavelength is tuned, the laser light entering the cavity undergoes multiple reflections inside the cavity, reaching an effective optical path length of over 10 km [8], [9]. The intensity of the transmitted light leaking out of the cavity is measured by a photo detector placed behind the exit mirror of one of the cavity arms, as shown in Figure 1. Details on the OF-CEAS measurement technique are found in [10], [11], [12]. Figure 2a shows a typical transmission signal recorded when a CO sample is present inside the cavity of the OF-CEAS instrument. To acquire the signal in Figure 2a, the laser frequency was scanned over the absorption profile of the probed absorption line of CO. The spectra are recorded at a frequency of 0.1 Hz, then further processed to calculate the CO amount fraction. One of the unique features of the OF-CEAS instrument is the small sample volume of the gas cell of <100 ml, which facilitates a quick gas sample refresh time and thus improving the response time of the instrument. To address the selectivity of the OF-CEAS instrument, the probed CO absorption line was carefully chosen in a wavelength region (around 2 μm) where there is no interference due to absorption of other prominent impurities in commercial H2 such as water vapour and CO2.

Schematic diagram of the OF-CEAS experimental set-up with gas sample preparation system (V1-3, valves; MFC1-3, mass flow controllers; PD1, photodetector). The filter (2 μm) at the input of the OF-CEAS prevents any particulate contamination of the instrument.
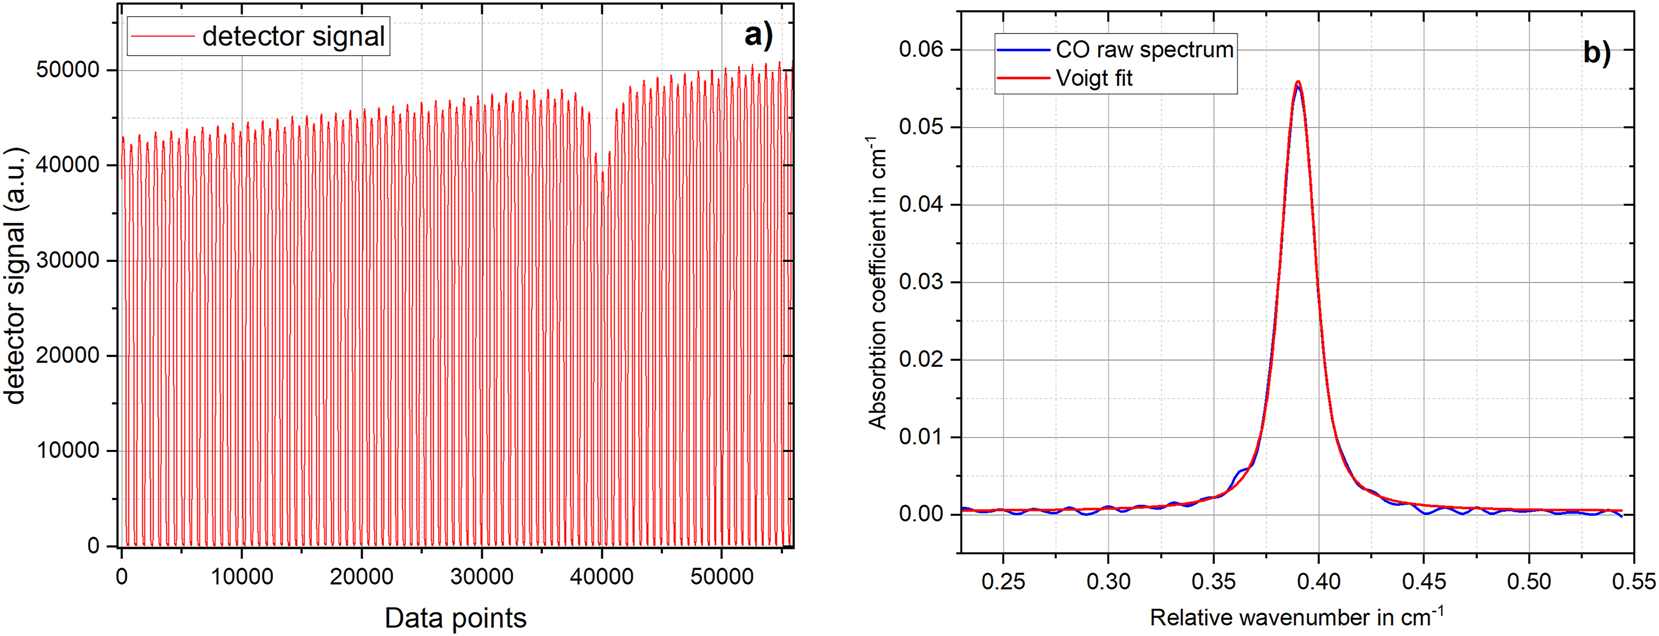
OF-CEAS instrument signal and resulting spectrum. (a) Measured cavity transmission. (b) Measured absorption coefficient data of CO in H2, derived from the data as in Figure 1. The data is fitted with a Voigt profile to derive the integrated absorption coefficient (line area).
For CO amount fraction measurements, the samples are introduced into the cavity via a sample preparation (gas mixing) system. The gas mixing system is based on mass flow controllers (MFC) from Bronkhorst with the stated accuracy of 0.5 % of reading plus 0.1 % of full scale. The sample preparation system has three lines (CO gas mixture, nitrogen and hydrogen) directly connected to a cross connection for mixing. Nitrogen is used to purge the OF-CEAS instrument after the measurements to get rid of leftover H2 in the sampling lines and the optical cavity. The measurements with the OF-CEAS spectrometers are performed in flow conditions (flow rate of 0.3 L/min) while the pressure in the gas cell is kept constant at ∼100 hPa. The gas cell (optical cavity) is heated to a stable temperature of ∼318.15 K.
As presented above, Figure 2a depicts a typical signal measured by the OF-CEAS instrument in Figure 1. The absorption coefficient data in Figure 2b is calculated using the data in Figure 2a according to the Equation (1):
where I0 and I are the intensities of the light transmitted through the cavity without and with the presence of CO gas mixture, respectively. The quantity R is the reflectivity of the mirrors, and d is the total length of the two arms of the V-shaped cavity.
The data from the instrument as shown in Figure 2b was fitted with a Voigt profile to determine the integrated absorption coefficient αint (area underneath the absorption coefficient curve = “line area”). The fitting was performed with the Gaussian width calculated at the measured gas temperature of 318.15 K, and the Lorentzian line width as well as the line centre of the probe CO molecular transition were kept free. By means of αint the CO amount fraction (xCO) was calculated using equation (2) as also described in [6],
where kB is the Boltzmann constant, T is the gas temperature, S T is the temperature-dependent line strength of the probed CO line and p is the total gas pressure. The CO amount fraction results calculated using Eq. (2) are traceable to the international system of units (SI) if the input quantities in the right-hand side of the equation are traceable to the SI as well. The Boltzmann constant k B is taken from the CODATA database [13], the gas pressure p and temperature T are measured with sensors traceable to respective PTB standards. To establish the traceability in S T a high-resolution FTIR spectrum of CO has been recorded at PTB probing the vibrational band of CO around 2.3 µm, and consequently the individual rotational lines of CO molecules were fitted with a custom build high-resolution data fitting algorithm. From the fitting, the line intensity (S T ) was found to be in the order of 10−21 cm/molecule, which has been used for evaluation of the data in this article similar to [14], [15]. However, discussion of the line data for CO measured at PTB using a high resolution FTIR [16] is outside the scope of this article and has been planned to be published in a separate upcoming paper.
Figure 3a shows the CO amount fraction in H2 results which were calculated according to Eq. (2). For these measurements, the CO in H2 gas mixture was provided by BAM (Bundesanstalt für Materialforschung und -prufung) within a round robin test as one of the activities in the BMVI – NOW RingWaBe project [17]. The reported value of the CO amount fraction for the BAM mixture was 196 ± 7 nmol/mol, coverage factor k = 2. The value measured at PTB (see Figure 3a: 191.5 ± 8.2 nmol/mol, coverage factor k = 2 [2], histogram in the inset: HWHM = 1.9 nmol/mol) is in excellent agreement with the reported value of the gas mixtures, demonstrating the capability of CO in H2 measurements around the limit value of 200 nmol/mol (ISO 14687) employing a new spectroscopic method developed at PTB. The combined uncertainty of the PTB results was evaluated following the GUM principles and employing the GUM workbench software [2]. Table 1 contains the relative uncertainties of the most significant input parameters used in calculating the combined uncertainty (1.5 % relative, k = 1) of the CO amount fraction results. Equation (1) was used as the model function for the uncertainty evaluation in Table 1. As shown in Table 1, the uncertainty of the CO amount fraction results is dominated by the uncertainty of the line strength (1.10 %), followed by the uncertainty of the line area (1.00 %), then the uncertainty of the gas temperature (0.31 %) and that of the gas pressure (0.30 %). The individual uncertainty contributions of the parameters (see Eq. (2)) are also represented by the index values (% individual contribution) in Table 1, where the line strength has the largest value of 50.4 %.

Measurement results and their precision. (a) CO in H2 amount fraction results. (b) Allan deviation of CO amount fraction results in Figure 3a.
Table of input parameters in Eq. (2) and their respective relative uncertainties.
| Parameter | Value | Relative uncertainty (k = 1), % | Index (% individual contribution) |
|---|---|---|---|
| Pressure | 100.021 hPa | 0.30 | 3.80 |
| Temperature | 318.15 K | 0.31 | 4.10 |
| Line strength | 3.2937 × 10⁻²¹ cm/molecule | 1.10 | 50.4 |
| Line area | 1.436 × 10⁻³ cm−1 | 1.00 | 41.7 |
| CO concentration (x CO ) result | 191.5 nmol/mol | 1.50 (combined uncertainty) | – |
-
Bold values represent the main result and its uncertainty.
To determine the reproducibility of the measurements performed by the OF-CEAS instrument in Figure 1, five additional CO in H2 amount fraction measurements were performed on different days using the BAM gas mixture 196 nmol/mol. Table 2 summarizes the results derived between the 10th and 16th of September 2024. The mean value of the results in Table 2 is 191.7 ± 7.4 nmol/mol and the repeatability of the results expressed as the standard deviation is 0.25 nmol/mol. The Mean value of 191.7 ± 7.4 nmol/mol is in good agreement with the value reported by BAM for the gas mixture (196 nmol/mol), further demonstration the capability of the OF-CEAS instrument in Figure 1 for accurate and reproduceable measurements of CO impurity in commercial H2.
CO in H2 amount fraction results measured at different days.
| Date of measurements | CO amount fraction in nmol/mol (k = 2) |
|---|---|
| 2024-09-10 | 191.5 ± 8.2 |
| 2024-09-11 | 191.7 ± 8.2 |
| 2024-09-11 | 191.8 ± 8.2 |
| 2024-09-12 | 192.1 ± 8.2 |
| 2024-09-16 | 192.1 ± 8.2 |
| Mean value | 191.7 ± 7.4 |
-
Bold values represent the mean value across several days.
The precision of the instrument is also an important parameter to determine when targeting low CO (nmol/mol levels) amount fraction measurements. Figure 3b represents an Allan deviation of the data in Figure 3a. As shown in Figure 3b, an optimal precision of 0.2 nmol/mol (detection limit) has been achieved for the instrument at a time resolution of 930 s. This precision of 0.2 nmol/mol highlights the instrument’s ability to accurately measure CO concentrations in high-purity H2 at the threshold level of 200 nmol/mol.
For CO measurements in the nmol/mol level, the response time and linearity of the instrument are necessary parameters to also verify. The response time is particularly necessary when the instrument is to be operated for online CO measurements at a field site e.g. H2 refilling station. To determine the response time of the instrument, measurements were performed by varying the CO amount fraction in H2 from about 20,000 nmol/mol to 50 nmol/mol. For these experiments, the CO samples were generated using the sample preparation system in Figure 1. For the dilution experiments, a commercial CO in H2 gas mixture (19,700 ± 591 nmol/mol) in a cylinder was used. Figure 4a shows step changes of CO in H2 amount fraction results. For the 19,700 nmol/mol mixture our instrument delivered 19,440 ± 292 nmol/mol CO amount fraction based on our evaluation approach, which is in good agreement with the value provided for the commercial mixture and further demonstrate the capability of our measurement method for independent CO measurements without any prior calibration of the instrument with a gas standard. As shown in the inset in Figure 4a, a response time of <4 min was measured for the instrument. Figure 4b depicts a plot of the CO results evaluated from the steps in Figure 4a as a function of dynamically prepared gas mixtures values. The combined uncertainty of the values in both axis in Figure 4b is 1.5 % relative, k = 1. A generalized linear regression is applied to the data in Figure 4b, resulting in a slope value of 0.98 ± 0.02, k = 2 and an intercept value of −0.45 ± 2.36 nmol/mol. The intercept parameter is insignificant (the uncertainty is larger than the intercept value), indicating that the experimental conditions were appropriately described.

Dilution of 20,000 nmol/mol CO in H2 mixture. (a) CO amount fraction steps from 50 to 20,000 nmol/mol. (b) A plot of measured CO amount fraction as a function of CO amount fractions generated using the gas preparation system.
3 Discussions
The results of the independent measurements of the CO in H2 amount fraction at PTB showed a good agreement with the reported value from BAM at around the limit value for CO in hydrogen (200 nmol/mol). The traceability of the results to the SI was achieved via establishing the traceability of all the input parameters such as the measured gas sample pressure and temperature, as well as spectroscopic line intensity in an independent FTIR measurement. The agreement between the PTB results and the reported BAM value indicates that the instrument has the potential to be operated without the need of a prior calibration with gas mixtures of CO in H2 and hence can be operated as an OGS after a further validation in e.g. an international comparison organized by the CCQM (Consultative Committee for Amount of Substance). As presented, an Optical Gas Standard is a laser spectrometer that can deliver gas species (e.g. CO) amount fraction results that are directly traceable to the SI. The CO OGS providing the SI-traceable results, in contrast to non-OGS CO analyzers [18], can be used for calibration purposes in the laboratory or in the field. Similarly to the existing PTB Hydrogen Chloride (HCl) OGS, which will be providing services on HCl measurements (calibration of other HCl analyser and value assignment of gas mixtures) [5], [7], the CO OGS when fully implemented will be used for services on hydrogen quality i.e. calibration of other CO analysers and value assignment of CO in H2 gas mixtures. This CO in H2 OGS development is being carried out within the BMVI-NOW (Bundesministerium für Verkehr und digitale Infrastruktur) RingWaBe (https://www.ringwabe.ptb.de/home) project. The project aims to establish metrological traceability for hydrogen purity standards, support the validation and accreditation of German laboratories in accordance with ISO 14687 and ISO/IEC 17025, and provide scientific foundations for reference material production and quality analysis. The project also focuses on improving online analytical methods for impurity measurements in hydrogen supplied via pipelines as well as contributing to standardization efforts through active knowledge transfer.
The optimal precision of our instrument of 0.2 nmol/mol (0.1 % and a factor of 1,000 at the limit value of 200 nmol/mol) shows that the instruments is highly precise for CO impurity measurements in H2. The instrument is compact and portable, and with a response time of <4 min it can be used for online measurements at field sites e.g. at H2 refilling stations. The day-to-day reproducibility of the CO results of 0.25 nmol/mol demonstrates the consistency of the instrument to provide accurate and reliable data over extended measurement periods, which is absolutely necessary for H2 quality control. The relative combined uncertainty of the CO results delivered by the instrument stands at 1.5 %, k = 1. This uncertainty of 1.5 %, (corresponding to 3 % for k = 2) is in line with the requirements of ISO 21087:2019(E), where combined standard measurement uncertainties of 10 %, and 50 % when below 10 nmol/mol are required for analytical methods [19]. As shown in Table 1, to further reduce the uncertainty in the results, future work will first focus on reducing the uncertainty of the line strength value which currently stands at 1.1 % relative, k = 1. However, we found the relative uncertainty of 1.5 % already sufficient for commercial H2 quality control purposes.
4 Conclusions
A laser spectroscopic method has been developed at PTB for independent CO amount fraction measurements in H2. While the instrument does not require prior calibration with a calibration gas standard, the used pressure and the temperature sensors were calibrated. The traceability of the CO amount fraction results to the SI units is addressed via input parameters such as the measured gas pressure and temperature that are traceable to respective PTB standards. The instrument is being developed to be operated as an Optical Gas Standard (OGS) for future services at PTB. The relative combined uncertainty of the CO amount fraction results delivered by the instrument is 1.5 % (k = 1), the optimal precision is 0.2 nmol/mol at a time resolution of 930 s, and the day-to-day repeatability of the readings is 0.25 nmol/mol.
Funding source: Bundesministerium für Digitales und Verkehr (BMDV)
Award Identifier / Grant number: 03B11026
About the authors

Dr. Victor Gorshelev is a postdoctoral research scientist at PTB Braunschweig in the working group 3.42 “Spectroscopic Gas Analysis and Reference Data”. He obtained a Master of Science in Applied Mathematics and Physics from Moscow Institute of Physics and Technology. He got his PhD from Bremen University, Germany, focusing on spectroscopic study of absorption properties of atmospheric gases for use in remote sensing applications.

Dr. Gourab Dutta Banik is a postdoctoral researcher at the PTB working group 3.42 “Spectroscopic Gas Analysis and Reference Data” since 2023. He completed his Master of Science in Physics from National Institute of Technology Durgapur, India. He did his PhD in the field of high-resolution laser spectroscopy instrument development and practical application cavity ring-down techniques in exhaled human breath and atmospheric trace gas measurement from S. N. Bose National Centre for Basic Sciences Kolkata, India.

Felix Witt is a PhD student at the Physikalisch-Technische Bundesanstalt in Braunschweig, working with high speed airborne laser hygrometers. He finished the master’s program Computational Sciences in Engineering of the Technische Universität Braunschweig and was awarded the Karl-Doetsch-Nachwuchspreis for his master thesis. Before studying in Braunschweig, he completed his bachelor’s degree in mechanical engineering in a dual study program at the University of Applied Sciences in Hamburg and at Dräger Safety in Lübeck.

Dr. Javis A. Nwaboh is the group head of the PTB working group 3.42 “Spectroscopic Gas Analysis and Reference Data” with many years of experience in laser spectroscopic measurements in different applications including atmospheric monitoring and hydrogen quality control measurements. He obtained a Master of Science in Physics from Umeå University Sweden. He is also a holder of a PhD from the Technical University of Braunschweig Germany, with focus in the field of laser spectroscopy.
Acknowledgments
This work was funded by the BMVI-NOW (Bundesministerium für Verkehr und digitale Infrastruktur) RingWaBe (https://www.ringwabe.ptb.de/home) project. The author would like to acknowledge past and current members of the PTB working group 3.42, especially Prof. Volker Ebert, for useful discussions towards the realization of this work.
-
Research ethics: Not applicable.
-
Informed consent: Not applicable.
-
Author contributions: All authors have accepted responsibility for the entire content of this manuscript and approved its submission.
-
Use of Large Language Models, AI and Machine Learning Tools: None declared.
-
Conflict of interest: The authors state no conflict of interest.
-
Research funding: This work was funded by the BMVI-NOW (Bundesministerium für Verkehr und digitale Infrastruktur) RingWaBe project. Das Projekt “Vergleichbarkeit der Wasserstoffqualitätsanalytik (RingWaBe)” wird unter dem Kennzeichen 03B11026 durch das Bundesministerium für Digitales und Verkehr (BMDV) mit 3.708.252 € gefördert. Das Projekt wird von der NOW GmbH koordiniert. Der Projektträger ist das Forschungzentrum Jülich (PTJ).
-
Data availability: Not applicable.
References
[1] ISO 14687:2025, “Hydrogen fuel quality – product specification,” 2025. Available at: https://www.iso.org/standard/82660.html.Search in Google Scholar
[2] JCGM, “Evaluation of measurement data – guide to the expression of uncertainty in measurement,” JCGM, vol. 100, p. 2008(E), 2008. https://doi.org/10.59161/JCGM100-2008E.Search in Google Scholar
[3] C. Beurey, et al.., “Review and survey of methods for analysis of impurities in hydrogen for fuel cell vehicles according to ISO 14687:2019,” Front. Energy Res., vol. 8, 2021. https://doi.org/10.3389/fenrg.2020.615149.Search in Google Scholar
[4] J. A. Nwaboh, et al.., “Towards an Optical Gas Standard for traceable calibration-free and direct NO2 concentration measurements,” Appl. Sci., vol. 11, no. 12, p. 5361, 2021. https://doi.org/10.3390/app11125361.Search in Google Scholar
[5] J. A. Nwaboh, et al.., “Hydrogen chloride Optical Gas Standards (OGS) at PTB,” in SMSI 2021 – System of Units and Metreological Infrastructure (Conference Paper), 2021.10.5162/SMSI2021/D4.1Search in Google Scholar
[6] A. Pogány, et al.., “A metrological approach to improve accuracy and reliability of ammonia measurements in ambient air,” Meas. Sci. Technol., vol. 27, no. 11, p. 5012, 2016. https://doi.org/10.1088/0957-0233/27/11/115012.Search in Google Scholar
[7] J. A. Nwaboh, et al.., “Accurate analysis of HCl in biomethane using laser absorption spectroscopy and ion-exchange chromatography,” Analyst, vol. 146, no. 4, pp. 1402–1413, 2021. https://doi.org/10.1039/D0AN01955K.Search in Google Scholar
[8] M. M. Twigg, et al.., “Intercomparison of in situ measurements of ambient NH3: instrument performance and application under field conditions,” Atmos. Meas. Tech., vol. 15, no. 22, pp. 6755–6787, 2022. https://doi.org/10.5194/amt-15-6755-2022.Search in Google Scholar
[9] I. Ventrillard, et al.., “Comparison of optical-feedback cavity-enhanced absorption spectroscopy and gas chromatography for ground-based and airborne measurements of atmospheric CO concentration,” Atmos. Meas. Tech., vol. 10, no. 5, pp. 1803–1812, 2017. https://doi.org/10.5194/amt-10-1803-2017.Search in Google Scholar
[10] J. Morville, S. Kassi, M. Chenevier, and D. Romanini, “Fast, low-noise, mode-by-mode, cavity-enhanced absorption spectroscopy by diode-laser self-locking,” Appl. Phys. B, vol. 80, pp. 1027–1038, 2005. https://doi.org/10.1007/s00340-005-1828-z.Search in Google Scholar
[11] S. G. Baran, G. Hancock, R. Peverall, G. A. D. Ritchie, and N. J. van Leeuwen, “Optical feedback cavity enhanced absorption spectroscopy with diode lasers,” Analyst, vol. 134, no. 2, pp. 243–249, 2009. https://doi.org/10.1039/b811793d.Search in Google Scholar PubMed
[12] D. J. Hamilton and A. J. Orr-Ewing, “A quantum cascade laser-based optical feedback cavity-enhanced absorption spectrometer for the simultaneous measurement of CH4 and N2O in air,” Appl. Phys. B, vol. 102, pp. 879–890, 2011. https://doi.org/10.1007/s00340-010-4259-4.Search in Google Scholar
[13] NIST, “CODATA recommended values,” 2025. Available at: https://pml.nist.gov/cuu/Constants/.Search in Google Scholar
[14] A. Pogány, O. Werhahn and V. Ebert, “Measurement of ammonia line intensities in the 1.5 µm region by direct tunable diode laser absorption spectroscopy,” J. Quant. Spectrosc. Radiat. Transfer, vol. 276, 2021, Art. no. 107884. https://doi.org/10.1016/j.jqsrt.2021.107884.Search in Google Scholar
[15] A. Pogány, S. Wagner, O. Werhahn, and V. Ebert, “Development and metrological characterization of a tunable diode laser absorption spectroscopy (TDLAS) spectrometer for simultaneous absolute measurement of carbon dioxide and water vapor,” Appl. Spectrosc., vol. 69, no. 2, pp. 257–268, 2015. https://doi.org/10.1366/14-07575.Search in Google Scholar PubMed
[16] Kim, K. Berezkin, J. Saturno, V. Werwein, G. Li, and A. Domanskaya, “Himitsu bako of NO2 mixtures: characterization of NO2 reference material using FTIR spectroscopy in middle infrared region,” Emiss. Control Sci. Technol., vol. 11, p. 6, 2025. https://doi.org/10.1007/s40825-024-00252-5.Search in Google Scholar
[17] “RingWaBe project home page,” 2023. Available at: https://www.ringwabe.ptb.de/home.Search in Google Scholar
[18] K. Arrhenius, A. Morris, M. Hookham, N. Moore, P. Modugno, and T. Bacquart, “An inter-laboratory comparison between 13 international laboratories for eight components relevant for hydrogen fuel quality assessment,” Measurement, vol. 230, 2024, Art. no. 114553. https://doi.org/10.1016/j.measurement.2024.114553.Search in Google Scholar
[19] ISO 21087:2019, “Gas analysis – analytical methods for hydrogen fuel – proton exchange membrane (PEM) fuel cell applications for road vehicles,” 2019. Available at: https://www.iso.org/standard/69909.html.Search in Google Scholar
© 2025 the author(s), published by De Gruyter, Berlin/Boston
This work is licensed under the Creative Commons Attribution 4.0 International License.
Articles in the same Issue
- Frontmatter
- Editorial
- Special Issue: Sensoren und Messtechnik für die Energiewende
- Research Articles
- Impurity measurements in hydrogen using laser spectroscopy: carbon monoxide as a case study
- Progressing TDLAS instrumentation for SI-traceable measurements of nitrous oxide in maritime applications
- Multi-range voltage divider for wideband power measurements
- Radon sensor networks for large buildings: balancing the trade-off between energy efficiency and health
- Fibre-optic thermometry to support the clean energy transition
- Dienstleistungen der Wasserstoff-Metrologie
- The global dimension of the energy transition
- The digital transformation of the quality infrastructure supports the energy transition
- Integrating energy data from a lambda architecture into a Digital Twin