Introducing a New Dataset: Age Representation in Parliaments on the Party-Level
-
Kira Renée Kurz

 and
Felix Ettensperger
and
Felix Ettensperger

Abstract
This research note highlights the underrepresentation of younger people in parliaments across the globe, which has been a persistent issue for decades. We introduce a novel open-access dataset containing information on mean and median age as well as the share of MPs in specific age brackets in party parliamentary groups in lower houses or single chambers of national parliaments. The dataset covers 163 cases from 30 countries and features variables that present these aforementioned shares in relation to the respective group’s presence in the voting-age population (Age Representation Index). Furthermore, the dataset includes the share of women within the party parliamentary groups as well as identifiers that enable matching the dataset with indicators from the Political Party Database (PPDB), the V-Party dataset, PartyFacts and the Manifesto Project Database. Our main finding underlines the importance of research focusing on party level factors influencing youth representation as there is not only variation between countries, but also within them on the party-level. Additionally, we show that most party parliamentary groups in which women are underrepresented also have low relative shares of young people, which is in line with theoretical arguments on party behavior.
1 Introduction
Young people are underrepresented in parliaments. In 2020, 36.70 % of all parliaments worldwide did not have a single Member of Parliament (MP) below the age of 30 and even the average proportion of MPs under the age of 40 amounted to only 17.50 % (Inter Parliamentary Union 2021, p. 13). But of course we see great variation when looking at the national level: after elections in 2018, the share of MPs up to the age of 35 was 20.40 % in Italy and 24.20 % in Sweden, but only 12.90 % in Mexico (Stockemer and Sundström 2022a), with many other countries exhibiting even lower shares. And great variation can also be observed at the subnational level: after the same 2018 elections, in Italy the share of MPs below the age of 35 ranged from 5.50 % (FORZA ITALIA) to 38.80 % (FIVE STARS MOVEMENT), in Sweden from 9.50 % (LIBERAL PARTY) to 50.00 % (GREEN PARTY) and in Mexico from 9.10 % (ECOLOGICAL GREEN PARTY) to 16.70 % (PARTY OF THE DEMOCRATIC REVOLUTION).
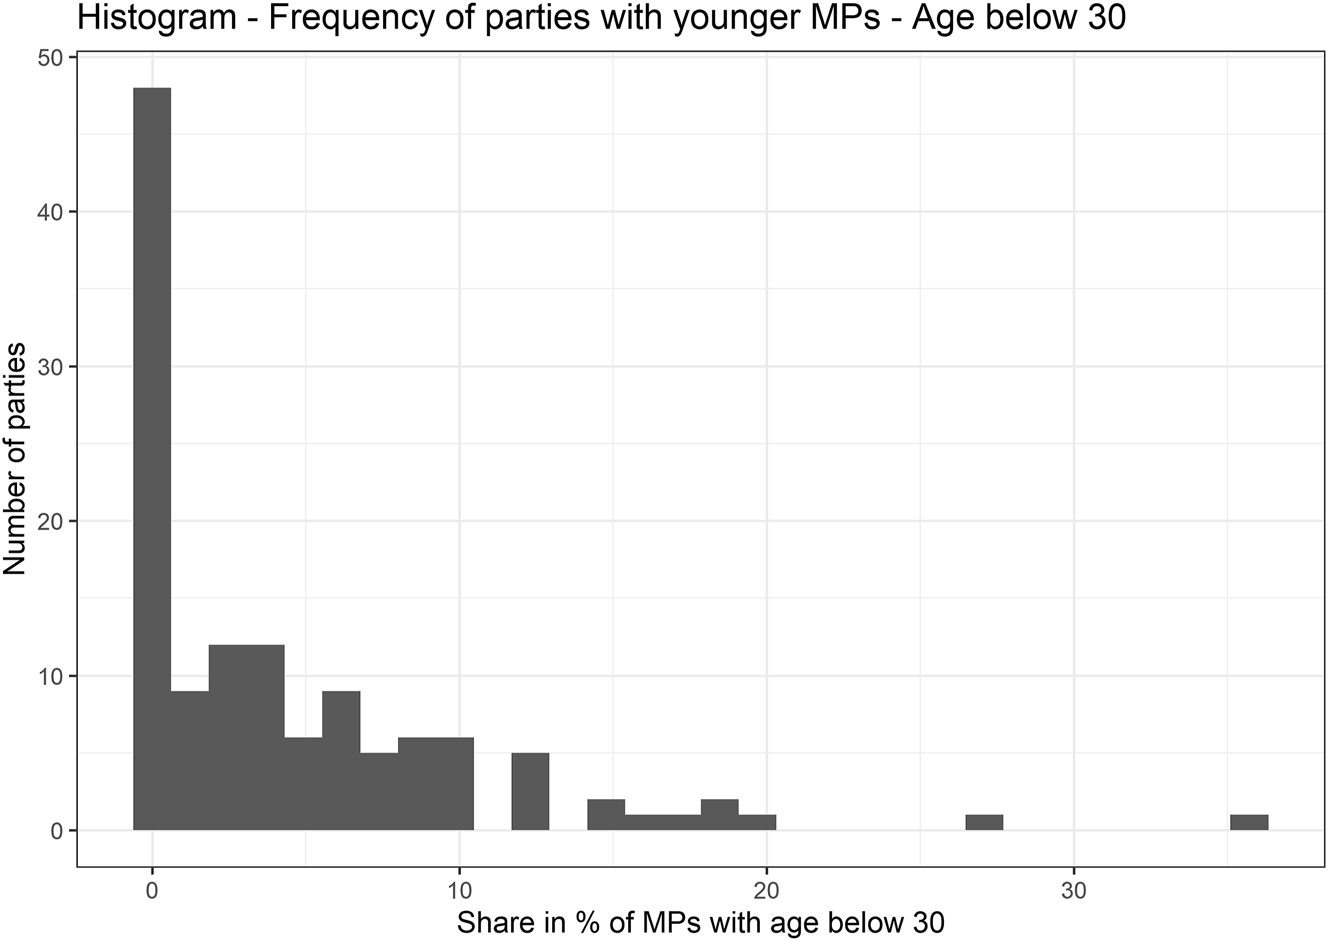
Frequency of parties according to their share of MPs below the age of 30 (only including parties with at least 10 MPs in the dataset).

Frequency of parties according to their share of MPs below the age of 35 (only including parties with at least 10 MPs in the dataset).

Frequency of parties according to their share of MPs below the age of 40 (only including parties with at least 10 MPs in the dataset).

Frequency of parties according to their share of MPs aged 40 years or more, but below 60 years (only including parties with at least 10 MPs in the dataset).

Frequency of parties according to their share of MPs aged 60 years or older (only including parties with at least 10 MPs in the dataset).
These examples illustrate why research on party-level factors influencing the representation of different age groups in parliaments is needed. In this research note we present a novel open-access dataset enabling such research (access via Harvard Dataverse: https://doi.org/10.7910/DVN/EPHSUS). The dataset covers 163 cases from 30 countries and contains information on the percentage of MPs in specific age brackets in party parliamentary groups in lower houses/single chambers of national parliaments. Additionally, the dataset includes variables that present these shares in relation to the respective group’s presence in the voting-age population. Furthermore, we have included the share of women within the party parliamentary groups as the causes for the underrepresentation of women and younger people seem to be linked (Joshi and Och 2021). For example gender influences the preferences of youth wing members when deciding to run for a seat in a decision making body – an effect that seems to be influenced by party structure and party family (Ohmura and Bailer 2023). One could also argue that belonging to a specific age group is perceived differently for men and women, which then could influence the chances of them to win elections – an effect that might vary depending on the party family and the targeted electorate. Finally, the dataset features identifiers that enable matching the dataset with indicators from the Political Party Database (PPDB, Scarrow, Webb, and Poguntke 2022), the Manifesto Project Database (Lehmann et al. 2022), PartyFacts (Bederke, Döring, and Regel 2021) and the V-Party-Dataset (Lindberg et al. 2022).
The research note proceeds as follows: First, we are going to describe the importance of researching youth and age group representation. In a second step, we elaborate on the need for data on the party-level before describing our case selection and the data sources. Then, we present the dataset and the included variables, discuss first insights, and finally give a short conclusion.
2 The Importance of Researching Youth and Age Group Representation
Even though age has always been described as an influential factor in politics, most research focusing on group representation has studied women, ethnic minorities, class, or the LGBTQI* community. This has changed in recent years and the importance of researching age group representation and especially youth representation has been described in depth (see Stockemer and Sundström 2022a, 2023).
Therefore, we only want to present a short overview of arguments. The first one builds upon democratic theory and the ‘politics of presence’ (Phillips 1995): parliaments should represent the diversity of their societies, including age groups. If young people are not adequately represented in parliament, their views and needs may be neglected. The link between descriptive and substantive youth representation has been described by Bailer et al. (2022), who found evidence that young legislators – at least at the beginning of their career – represent youth’s specific interests.
This leads to the second argument, that we need to better understand age group representation as especially aging societies exhibit systemic incentives for parties to be biased towards the older share of the electorate: for political parties, young people are likely not to be the main target group as they are either too young to vote or, if they are of voting age, less likely to vote than older people and previous generations (Bhatti and Hansen 2012). Additionally, in some countries with low fertility rates, young people are a relatively small group within society. As we often observe differences in the policy preferences of older and younger voters, parties going for the more promising ‘grey vote’ (Davidson 2012) disadvantages the representation of younger people’s interests.
Thirdly, the underrepresentation of young people in parliaments can contribute to youth’s alienation from conventional politics as the following argument shall illustrate. Especially in aging societies with shrinking shares of young people that additionally have lower turnout rates than older citizens (Bhatti and Hansen 2012), the majority of parties might think that they have little to gain from addressing the demands of young citizens. Additionally, one could argue that as parties try to cater to the median voter and as incumbents tend to be re-nominated, there are incentives to put forward mostly middle-aged or elderly candidates. This could in turn reinforce negative attitudes towards conventional politics amongst youths: observing that parties do not address their specific demands and that politicians are in overwhelming numbers much older than themselves, they might see very little opportunity for descriptive and substantive representation through parties and elections. Bearing in mind that young people are interested in politics but simultaneously strongly disillusioned by the political system (Dalton 2021; Henn and Foard 2012; Pickard 2022), the need to break this ‘vicious cycle’ (Stockemer and Sundström 2023) becomes obvious. One potential solution is to increase the representation of young people in positions of power. Therefore, we agree with Stockemer and Sundström that “the academic literature could also do its part by raising more awareness of the underrepresentation of young adults in the political process and by elucidating the factors that contribute to young people’s underrepresentation” (2018, p. 69).
3 The Need for Data on the Party-Level
Previous research on the underrepresentation of young people in parliaments has primarily focused on institutional effects such as age quotas or the electoral system (Belschner and Garcia de Paredes 2021; Joshi 2013; Krook and Nugent 2018; Stockemer and Sundström 2018, 2019, 2022b), voter preferences (Belschner 2022; Eshima and Smith 2022) and the intersection of age and gender (Belschner and Garcia de Paredes 2021; Joshi and Och 2021; Stockemer and Sundström 2022b). However, little attention has been paid to the role of political parties. This is surprising as political parties are central in candidate selection and have a significant impact on the demographic makeup of elected politicians, as demonstrated in the case of gender (Caul 1999) and ethnic minority representation (Auer, Portmann, and Tichelbaecker 2023; Schönwälder 2013). Emerging research suggests that the same applies to age representation (Hofmane 2023; Stockemer and Sundström 2022c). During our research, we found that only three studies examine the role of political parties and their characteristics from a comparative perspective: One paper that focused on the European Parliament (Sundström and Stockemer 2018), a recent book chapter by the same authors (Stockemer and Sundström 2022c) and our own article which analyzes data from 28 advanced democracies based on the dataset at hand (Kurz and Ettensperger Forthcoming).
This lack of research is in large parts due to a lack of comparative data on the party-level. Whilst data on the descriptive representation of different age groups on the parliamentary level is accessible through the Inter Parliamentary Union’s database (IPU 2023) as well as through the newly published Worldwide Age Representation in Parliaments dataset (WARP, Stockemer and Sundström 2022a), party-level data has been lacking due to the amount of work needed to compile such a dataset. While far from perfect, our dataset shall serve as a starting point for party-level research on the causes of differences in the descriptive representation of age groups. Furthermore, the provided dataset might hold significance for the wider research community focused on electoral and representation studies. Metrics such as the median age of parliamentarians or the share of relatively young MPs could serve as control variables for studies focusing on voting behavior or on environmental policy outputs.
4 Case Selection, Data Gathering and Methodological Choices
In selecting the cases, we aimed to include as many cases from advanced democracies (V-DEM polyarchy-index >0.7) as possible so as to not exclusively cover Western Europe or North America. In a second step, we had to limit our case selection to reduce the workload and thus, only included cases for which ample data was available in the Party Manifesto Project and the Political Party Database (PPDB) Round 2. As PPDB Round 2 data was collected between 2017 and 2019, we set the timeframe to include party parliamentary groups from elections between 2017 and 2020. The timeframe led to the exclusion of parties from Bulgaria as the last elections were held in 2016 and 2021. We also decided to exclude Israel as MPs change too frequently between the parties. Greece had to be excluded as birth data was missing for too many MPs.[1]
The data was obtained through several approaches. For some parliaments, MP lists including their birthdays could be downloaded directly from the parliament’s website (some even had an R package or an open data portal) or could be compiled from the MPs’ profiles on the websites. In cases where the MP profiles did not include birthdays, we researched the individual dates through other publicly available sources. For other parliaments, the research or press officers sent us lists upon request, and for three countries we used the website EveryPolitician (http://everypolitician.org) to access data on age and gender. Data sources for each country as well as country-specific information are described in detail in the Data Notes published with the dataset.
To calculate our indicators, such as the share of MPs below the age of 30 within a party group, we used the age at the day of election and not the age at the beginning of the tenure. The duration of the time between election and the beginning of a legislative period varies quite strongly over different countries and thus, using the time of election enhances comparability. As information on whether MPs were directly elected or entered parliament at a later point in time (as replacements) was not always available, both types of MPs are included in our calculations. Hence in some cases, the number of MPs included in the calculation does not align with the number of seats the party held during the legislative period. For those MPs that entered parliament over the course of the legislative period, their age was still calculated based on the main election date and thus will not correspond exactly with their age at the time of entering parliament. As for some countries, it is possible to differentiate between directly elected candidates and replacement candidates, we will include this information in a later version of the dataset. This will enable robustness tests controlling for the status of the deputy.
Regarding the calculation of the different Age Representation Indices (ARIs) – a relative measure of age group representation – we followed the conceptualization presented by Sundström and Stockemer in their conceptual paper (2021) and in their introduction to the WARP dataset (Stockemer and Sundström 2022a, pp. 1770–1771). The share of a specific age group in the party group is set in proportion to the share of this age group within the voting-age population of the country. Population data stems from the United Nation’s Population Division’s database (United Nations, Department of Economic and Social Affairs, Population Division 2023). A score of 1.0 indicates perfect proportional representation, a score below indicates underrepresentation and a score above 1.0 indicates that the age group is overrepresented within the party parliamentary group.
As some party parliamentary groups are quite small (n < 10), we recommend to filter for bigger party parliamentary groups when using the dataset for automatic methods (e.g. correlation scores, regression analysis, Qualitative Comparative Analysis) so that the variables are not too heavily biased by outliers. On the downside, such analyses are then limited to larger (more successful) parties and to parties operating within parliaments where even smaller factions have more than 10 members (large parliaments or majority systems).
5 The Dataset
The dataset contains 163 cases from 30 countries (Australia, Austria, Belgium, Canada, Croatia, Czech Republic, Denmark, Estonia, Finland, France, Germany, Hungary, Ireland, Italy, Japan, Latvia, Lithuania, Mexico, Netherlands, Norway, Poland, Portugal, Romania, Serbia, South Korea, Spain, Sweden, Switzerland, the United Kingdom, and the United States). Below, we present a short description of the included variables.
5.1 Identifier Variables
| country | Country name |
| ISO3 | Country code |
| party.name | Party name in English |
| party.abb | Party abbreviation |
| ID.PPDB | Identifier for merging with data from the Political Party Database (PPDB, Scarrow, Webb, and Poguntke 2022) |
| ID.ManifProj | Identifier for merging with data from the Manifesto Project Database (Lehmann et al. 2022) |
| pf_party_id | Party Facts-identifier for merging with data from PartyFacts (Bederke, Döring, and Regel 2021; Döring and Regel 2019) and the V-Party dataset (Lindberg et al. 2022; Pemstein et al. 2020). |
5.2 Filter Variables
| election.year | Indicates the election that led to the formation of the party parliament group |
| nr.MPs | Number of MPS that are the basis for the calculation of the following variables. The variable can be used to filter for bigger party groups as for small ones the following variables are very sensitive to outliers. |
5.3 Age Group Representation
As in representation research there is no consensus on what constitutes a young MP (for a detailed discussion see Stockemer and Sundström 2023), we have decided to include several thresholds in our dataset which have all been used in previous works on youth representation: 30, 35 and 40 years of age. As the shares of specific age groups is calculated for the day of election, their share within legislatures is likely to be substantively lower for most of the time. If someone enter the parliament at age 35, (s)he might be around 40 towards the end of the legislative period (mostly 4 or 5 years).
| share.below30 | Share of MPs below 30 within the party parliamentary group, age 30 excluded. |
| share.30to35 | Share of MPs between 30 and 35 within the party parliamentary group, age 30 included, age 35 excluded. |
| share.35to40 | Share of MPs between 35 and 40 within the party parliamentary group, age 35 included, age 40 excluded. |
| share.40to60 | Share of MPs between the of 40 and 60 within the party parliamentary group, age 40 included, age 60 excluded. |
| share.above60 | Share 60 and above, age 60 included. |
Please note that for all of the age brackets we have also included the raw numbers at the end of the dataset (nr.below30, nr.30to35, nr.35to40, nr.40to60, nr.above60) to enhance transparency.
| median.age | Median age of the party parliamentary group. |
| mean.age | Mean age of the party parliamentary group. |
| ARI30 | Share of MPs below the age of 30 in relation to the share of people below 30 in the voting-age population of the respective country.[2] |
| ARI35 | Similar to ARI30. |
| ARI40 | Similar to ARI30. |
| ARI40to60 | Similar to ARI30. |
| ARI60+ | Similar to ARI30. |
| share.women | Share of women within the party parliamentary group (not available for all countries, as the gender of MPs was not always indicated in the MP lists we used). Please note that we have also included the raw numbers at the end of the dataset (nr.women). |
6 First Insights and Possible Applications
6.1 Distribution
The histograms Figures 1–5 show the distribution of shares of different age groups within the dataset for parties with at least 10 MPs. For all age groups, except between 40 and just below 60, we observe a distribution that is skewed to the right.
When looking at the ARI scores for parties with a minimum of 10 MPs in the dataset, we observe that generally, the young and the old are underrepresented, whereas those aged between 40 and 60 are overrepresented. For ARI30, only five party parliamentary groups out of 126 reach a score above 0.95; for ARI35 only 10 party groups, and even for ARI40 only 33 parties do. Regarding the indicator ARI60+, only 11 parties feature a score above 0.95 – within this group we find both US parties, with people above 60 being strongly overrepresented in the Democratic party (AR60+ = 1.70) and moderately overrepresented in the Republican party (ARI60+ = 1.37). On the other hand, the age group ranging from 40 to just below 60 years of age is underrepresented (ARI <0.95) in only four of the 126 cases.
6.2 Variance on the Party-Level
The main findings we have gained from a first analysis of the dataset are the following: variance in age group representation exists not only between countries but also within them. To exemplify this finding, we present boxplots for the share of MPs below the age of 35 on the country level including all cases with more than 10 MPs (Figures 6 and 7). Boxplots for the ARI35 scores of parties in each country can be found in the Appendix (Figure 9). For further illustration, we shall now look at some countries in greater detail. In Denmark the span (difference between minimum and maximum) is almost 43 % points, and the interquartile range is still 22 % points. Whilst we can generally observe more intra-country variation in proportional electoral systems due to the resulting multiparty systems, the Danish amount of variance is still remarkably high. In contrast, in Germany, sharing the same institutional setting, the span is below 10 % points and the interquartile distance a mere 3.92 % points.

Boxplots of the share of MPs below 35 in party parliamentary groups (in per cent) per country. Countries from A to J.

Boxplots of the share of MPs below 35 in party parliamentary groups (in per cent) per country. Countries from L to U.
Interesting outliers featuring a high share of young MPs are Italy’s FIVE STARS MOVEMENT (38.77 %), Sweden’s GREEN PARTY (50.00 %), Norway’s SOCIALIST LEFT PARTY (36.36 %) and the Dutch SOCIALIST PARTY (50.00 %). Other parties with comparably high shares of young MPs without being outliers in their national party systems are the SAVE ROMANIA UNION (45.24 %), the Danish SOCIALIST PEOPLE’S PARTY (42.86 %) and the Finnish GREEN LEAGUE (35.00 %). Most parties with shares of 35.00 % or higher are either green or left-wing parties. This is in line with previous research that identified an inclusive ideology as a contributing factor regarding the descriptive representation of youth (Sundström and Stockemer 2018) and other underrepresented groups such as women (Caul 1999, 2001; Paxton and Kunovich 2003). The exceptions are the Romanian USR – a party that focuses on fighting corruption and belonging to the center–right, and the Italian M5S, a populist party advocating for more direct democracy. Both of these parties are rather young: the USR was founded in 2016 and the M5S in 2009, which might be a factor in explaining their high share of young MPs. In sum, our findings clearly show that research on party-level factors influencing the descriptive representation of different age groups is needed.
6.3 Relationship Between the Share of Female MPs and the Share of Young MPs
In Figure 8, we plot the share of female MPs in a party group against the party’s ARI35 (share of MPs below 35 in relation to the share of this group in the voting-age population of the country). The dotted lines in the scatterplot indicate proportional representation.[3] Within party groups on the left side of the vertical line, people below the age of 35 are underrepresented. Within party groups below the horizontal line, women are underrepresented. In most of the featured cases, both groups are thus underrepresented. Only in two cases are both groups overrepresented: within the Spanish PODEMOS and the Swedish GREEN PARTY. Additionally, we can observe a positive correlation between the share of female MPs and the ARI35. Building upon previous findings from research on the descriptive and substantive representation of women (Erzeel and Celis 2016; van der Zwan, Lubbers, and Eisinga 2019; Bönisch 2022), one could hypothesize that party ideology is the mitigating factor influencing both outcome variables. For instance, a left economic position is often associated with fighting for minorities and outgroups – young adults and women could both be conceptualized as such groups with regard to positions of (political) power. Additionally, progressive libertarian positions are not only linked to measures enhancing gender equality, but they are also often more in line with young people’s values. Additionally, parties that appeal to young voters on the policy dimension might also try to present candidates that these voters identify with. On the contrary, parties promoting traditionalist and authoritarian values are less likely to have gender-balanced candidate lists and have older support bases, which should lead to older delegates.

Scatterplot of the share of female MPs in per cent versus ARI35, the dotted lines indicating proportional representation.
6.4 Possible Applications
A first application of the dataset within a wider research framework is a Qualitative Comparative Analysis on the conditions under which we observe high/low shares of MPs under the age of 35 (Kurz and Ettensperger Forthcoming). Based on previous literature, we had anticipated that the percentage of young MPs would be greater in certain circumstances, such as having a proportional representation electoral system, operating in relatively rich countries, decentralized nomination processes, strong party youth organizations, an inclusive party ideology and young party structures. Our findings demonstrate that a proportional electoral system and a progressive party ideology do indeed facilitate a high proportion of young MPs, where the latter becomes influential especially in combination with a proportional electoral system. However, the impact of strong youth organizations and a decentralized selectorate appear to be context-specific and somewhat ambiguous. Party age seems to matter only for a minority of the cases. To summarize, there is no single factor that guarantees a high number of young parliamentarians, but rather a combination of several factors. Further research on party-level factors influencing the representation of different age groups is thus needed to better understand the influential factors as well as their interactions.
7 Conclusions
To date, the dataset we have presented is the only source of comparative data on youth representation at the party level, which complements existing national-level datasets and databases such as the WARP dataset or the Inter-Parliamentary Union’s database. As such, it serves as a crucial resource for researchers, policymakers, and the public to access information on age group and especially youth representation in national legislatures. The dataset includes various age representation indicators, such as the percentage of MPs in specific age brackets (below 30 years, 31–35, 36–40, … ), the median age and the mean age of MPs within the party parliamentary groups. The cases within the dataset clearly show that research on party-level factors influencing the descriptive representation of different age groups is needed. We find great variation not only between countries but also within them.
Finally, we plan to enlarge the dataset by including additional elections, countries, and parties. To reach this goal, we are open for collaborative efforts and welcome others to join the project.
Acknowledgments
We would like to thank Megan Stewart, Malte Jennerjahn and João Marques Sampaio for their indispensable help building the dataset and Ieva Hofmane for feedback on an earlier draft of this research note. Kira Renée Kurz is receiving a scholarship from Heinrich-Böll-Foundation.

Boxplots of the ARI35 for individual party parliamentary groups per country.
References
Auer, D., L. Portmann, and T. Tichelbaecker. 2023. “Electoral Discrimination, Party Rationale, and the Underrepresentation of Immigrant-Origin Politicians.” American Journal of Political Science, https://doi.org/10.1111/ajps.12817.Search in Google Scholar
Bailer, S., C. Breunig, N. Giger, and A. M. Wüst. 2022. “The Diminishing Value of Representing the Disadvantaged: Between Group Representation and Individual Career Paths.” British Journal of Political Science 52: 535–52. https://doi.org/10.1017/S0007123420000642.Search in Google Scholar
Bederke, P., H. Döring, and S. Regel. 2021. “Party Facts – Version 2021.” https://doi.org/10.7910/DVN/GM8LWQ.Search in Google Scholar
Belschner, J. 2022. “Youth Advantage Versus Gender Penalty: Selecting and Electing Young Candidates.” Political Research Quarterly 90–106, https://doi.org/10.1177/10659129211072559.Search in Google Scholar
Belschner, J., and M. Garcia de Paredes. 2021. “Hierarchies of Representation: The Re-Distributive Effects of Gender and Youth Quotas.” Representation 57: 1–20. https://doi.org/10.1080/00344893.2020.1778510.Search in Google Scholar
Bhatti, Y., and K. M. Hansen. 2012. “The Effect of Generation and Age on Turnout to the European Parliament – How Turnout Will Continue to Decline in the Future.” Electoral Studies 31: 262–72. https://doi.org/10.1016/j.electstud.2011.11.004.Search in Google Scholar
Bönisch, L. E. 2022. “What Factors Shape the Substantive Representation of Lesbians, Gays and Bisexuals in Parliament? Testing the Impact of Minority Membership, Political Values and Awareness.” Parliamentary Affairs 75: 843–66. https://doi.org/10.1093/pa/gsab033.Search in Google Scholar
Caul, M. 1999. “Women’s Representation in Parliament.” Party Politics 5: 79–98. https://doi.org/10.1177/1354068899005001005.Search in Google Scholar
Caul, M. 2001. “Political Parties and the Adoption of Candidate Gender Quotas: A Cross-National Analysis.” The Journal of Politics 63: 1214–29. https://doi.org/10.1111/0022-3816.00107.Search in Google Scholar
Dalton, R. J. 2021. The Good Citizen: How a Younger Generation Is Reshaping American Politics, 3rd ed. Thousand Oaks: CQ Press, An Imprint of SAGE Publications, Inc.Search in Google Scholar
Davidson, S. 2012. Going Grey: The Mediation of Politics in an Ageing Society. London: Routledge.Search in Google Scholar
Döring, H., and S. Regel. 2019. “Party Facts: A Database of Political Parties Worldwide.” Party Politics 25: 97–109. https://doi.org/10.1177/1354068818820671.Search in Google Scholar
Erzeel, S., and K. Celis. 2016. “Political Parties, Ideology and the Substantive Representation of Women.” Party Politics 22: 576–86. https://doi.org/10.1177/1354068816655561.Search in Google Scholar
Eshima, S., and D. M. Smith. 2022. “Just a Number? Voter Evaluations of Age in Candidate-Choice Experiments.” The Journal of Politics 84: 1856–61. https://doi.org/10.1086/719005.Search in Google Scholar
Henn, M., and N. Foard. 2012. “Young People, Political Participation and Trust in Britain.” Parliamentary Affairs 65: 47–67. https://doi.org/10.1093/pa/gsr046.Search in Google Scholar
Hofmane, I. 2023. “Standing in the Way of the Young: The Central Role of Political Parties in Youth Representation in Parliaments.” In: 14th Graduate Conference on Party Research, PRUF Düsseldorf.Search in Google Scholar
Inter Parliamentary, Union. 2023. “Global Data on National Parliaments.” https://data.ipu.org/.Search in Google Scholar
Inter Parliamentary Union. 2021. Youth Participation in National Parliaments. https://www.ipu.org/youth2021.Search in Google Scholar
Joshi, D. K. 2013. “The Representation of Younger Age Cohorts in Asian Parliaments: Do Electoral Systems Make a Difference?” Representation 49: 1–16. https://doi.org/10.1080/00344893.2013.775960.Search in Google Scholar
Joshi, D. K., and M. Och. 2021. “Early Birds, Short Tenures, and the Double Squeeze: How Gender and Age Intersect With Parliamentary Representation.” Politics, Groups, and Identities 9: 629–45. https://doi.org/10.1080/21565503.2019.1629319.Search in Google Scholar
Krook, M. L., and M. K. Nugent. 2018. “Not Too Young to Run? Age Requirements and Young People in Elected Office.” Intergenerational Justice Review 4: 60–7, https://doi.org/10.24357/igjr.4.2.702.Search in Google Scholar
Kurz, K. R., and F. Ettensperger. Forthcoming. “Exploring the Conditions for Youth Representation: A Qualitative Comparative Analysis of Party Parliamentary Groups.” European Political Science.Search in Google Scholar
Lehmann, P., T. Burst, T. Matthieß, S. Regel, A. Volkens, B. Weßels, and L. Zehnter, and Wissenschaftszentrum Berlin für Sozialforschung. 2022. “Manifesto Project Dataset.” https://doi.org/10.25522/manifesto.mpds.2022a.Search in Google Scholar
Lindberg, S. I., N. Düpont, M. Higashijima, Y. B. Kavasoglu, K. L. Marquardt, M. Bernhard, H. Döring, et al.. 2022. “V-Party Dataset V2.” https://doi.org/10.23696/vpartydsv2.Search in Google Scholar
Ohmura, T., and S. Bailer. 2023. “Power-Seeking, Networking and Competition: Why Women Do Not Rise in Parties.” West European Politics 46: 897–927. https://doi.org/10.1080/01402382.2022.2097442.Search in Google Scholar
Paxton, P., and S. Kunovich. 2003. “Women’s Political Representation: The Importance of Ideology.” Social Forces 82: 87–113. https://doi.org/10.1353/sof.2003.0105.Search in Google Scholar
Pemstein, D., K. L. Marquardt, E. Tzelgov, Y. Wang, J. Medzihorsky, J. Krusell, F. Miri, and J. von Römer. 2020. “The V-Dem Measurement Model: Latent Variable Analysis for Cross-National and Cross-Temporal Expert-Coded Data.” V-Dem Working Paper 21, 5th ed.10.2139/ssrn.3595962Search in Google Scholar
Phillips, A. 1995. The Politics of Presence. Oxford: Oxford University Press.Search in Google Scholar
Pickard, S. 2022. “Young Environmental Activists and Do-It-Ourselves (DIO) Politics: Collective Engagement, Generational Agency, Efficacy, Belonging and Hope.” Journal of Youth Studies 25: 730–50. https://doi.org/10.1080/13676261.2022.2046258.Search in Google Scholar
Scarrow, S. E., P. D. Webb, and T. Poguntke. 2022. “Political Party Database Round 2 V4 (First Public Version).” https://doi.org/10.7910/DVN/0JVUM8.Search in Google Scholar
Schönwälder, K. 2013. “Immigrant Representation in Germany’s Regional States: The Puzzle of Uneven Dynamics.” West European Politics 36: 634–51. https://doi.org/10.1080/01402382.2013.773730.Search in Google Scholar
Stockemer, D., and A. Sundström. 2018. “Age Representation in Parliaments: Can Institutions Pave the Way for the Young?” European Political Science Review 10: 467–90. https://doi.org/10.1017/S1755773918000048.Search in Google Scholar
Stockemer, D., and A. Sundström. 2019. “Young Deputies in the European Parliament: A Starkly Underrepresented Age Group.” Acta Politica 54: 124–44. https://doi.org/10.1057/s41269-018-0078-0.Search in Google Scholar
Stockemer, D., and A. Sundström. 2022a. “Introducing the Worldwide Age Representation in Parliaments (WARP) Data Set.” Social Science Quarterly 103: 1765–74. https://doi.org/10.1111/ssqu.13221.Search in Google Scholar
Stockemer, D., and A. Sundström. 2022b. “Quotas, the Electoral System Type and the Election of Young Women.” Social Politics: International Studies in Gender, State & Society 28: 1025–45. https://doi.org/10.1093/sp/jxaa006.Search in Google Scholar
Stockemer, D., and A. Sundström. 2022c. Youth Without Representation. Ann Arbor: University of Michigan Press.Search in Google Scholar
Stockemer, D., and A. Sundström. 2023. “Age Inequalities in Political Representation: A Review Article.” Government and Opposition 1–18, https://doi.org/10.1017/gov.2023.11.Search in Google Scholar
Sundström, A., and D. Stockemer. 2018. “Youth Representation in the European Parliament: The Limited Effect of Political Party Characteristics.” Intergenerational Justice Review 4: 68–78, https://doi.org/10.24357/igjr.4.2.696.Search in Google Scholar
Sundström, A., and D. Stockemer. 2021. “Conceptualizing, Measuring, and Explaining Youths’ Relative Absence in Legislatures.” PS: Political Science & Politics 54: 195–201. https://doi.org/10.1017/S1049096520000906.Search in Google Scholar
United Nations, Department of Economic and Social Affairs, Population Division. 2023. Data Portal, Custom Data Acquired via Website. https://population.un.org/DataPortal/.Search in Google Scholar
van der Zwan, R., M. Lubbers, and R. Eisinga. 2019. “The Political Representation of Ethnic Minorities in the Netherlands: Ethnic Minority Candidates and the Role of Party Characteristics.” Acta Politica 54: 245–67. https://doi.org/10.1057/s41269-018-0085-1.Search in Google Scholar
© 2023 the author(s), published by De Gruyter, Berlin/Boston
This work is licensed under the Creative Commons Attribution 4.0 International License.
Articles in the same Issue
- Frontmatter
- Editors Note
- Editors’ Note
- Special Issue: Political Demography; Guest Editor: Kira Renée Kurz
- Population Age Structure and the Vulnerability of States to Coups d’État
- Introducing a New Dataset: Age Representation in Parliaments on the Party-Level
- Articles
- Analysis of the Impact of Digitalization on the Quality and Availability of Public Services in Ukraine – A Comparative Approach with Insights from Estonia
- Modelling Factors Affecting Internally Generated Funds of the Tamale Metropolitan Assembly of Ghana Using Multivariate Analysis Techniques