Macroeconomic Imbalances and Financial Stress Among BRICS: Analysis of Frequency-Dependent and Asymmetric Causal Nexuses
-
Mohammed Armah

 ,
Ebenezer Bugri Anarfo
,
Ebenezer Bugri Anarfo

Abstract
This study investigates the intricate and evolving causal relationship between macroeconomic imbalances and financial stress in BRICS nations. To analyse these dynamics across different time scales, thus enabling timely and policy intervention, we employ an asymmetric, noise-reducing-domain ICEEMDAN-based non-parametric model supplemented by a time-varying vector autoregressive model spanning from 1998 to 2021. Our findings reveal that financial stress and macroeconomic imbalance in BRICS exhibit both frequency-dependent and asymmetric linkages, shedding light on the mechanisms underlying financial contagion and market instability in BRICS nations. Specifically deteriorating financial conditions are linked to heightened macroeconomic instability, whereas periods of low stress correspond to improved macroeconomic condition. The results underscore the need to strengthen the macroeconomic frameworks with inflation serving as a critical nominal anchor and focal point of overarching policy guidelines. Proactive monitoring and responses to accumulation of financial imbalances are essential. The study recommends that policymakers should implement fiscal and monetary measures that prioritize sustainable economic growth while reducing reliance on debt and maintaining current account balance to mitigate financial vulnerabilities.
Acknowledgements
The authors would like to thank the editor and an anonymous referee for their valuable comments which led considerable improvement of the paper.
-
Author contributions: The authors has accepted responsibility for the entire content of this submitted manuscript and approved submission.
-
Conflict of interest: The authors declare no conflict of interest regarding this article.
-
Research funding: None declared.
Appendix A: Cross-Quantilograms
This appendix summarizes the nonparametric quantile-based method introduced by Han et al. (2016). As previously noted, this method is suitable for detecting extreme dependency, using arbitrary quantile, lags in detecting extreme dependency between variables (Abakah et al. 2023). CQ method takes into account heavy tail features of financial time series at various time lags and will enable us quantifies the strength of dependence between FS and MIs into short term medium and long term (Mensi et al. 2023). Assume
For k = 0, ±1, ±2, …, where
where
where 1 − α is the confidence interval for
Summary statistics of FSI and macroeconomic imbalance.
| South Africa | FSI | OGAP | CA | CGD |
| Mean | −0.007 | 0 | −2.140*** | 1.589*** |
| Variance | 1.068*** | 0.000*** | 6.214*** | 0.017*** |
| Skewness | 1.190*** | −5.218*** | 0.737*** | 0.384 |
| JB | 24.170*** | 6,776.081*** | 9.416*** | 4.407 |
| ERS | −0.938 | −2.682*** | −1.493 | −0.674 |
| Q(20) | 159.057*** | 19.791** | 217.832*** | 648.362*** |
| Q2(20) | 47.297*** | 0.254 | 181.251*** | 639.913*** |
| Correlation | ||||
| Kendall | FSI | OGAP | CA | CGD |
| FSI | 1.000*** | 0.152** | 0.234*** | 0.071 |
| OGAP | 0.152** | 1.000*** | −0.268*** | 0.114 |
| CA | 0.234*** | −0.268*** | 1.000*** | 0.152** |
| CGD | 0.071 | 0.114 | 0.152** | 1.000*** |
| Brazil | FSI | OGAP | CA | CGD |
| Mean | −0.008 | 0 | −2.287*** | 1.831*** |
| Variance | 1.067*** | 0.000*** | 4.140*** | 0.003*** |
| Skewness | −0.562** | −1.762*** | 0.498** | 0.741*** |
| Ex.Kurtosis | 1.495** | 6.921*** | −1.022*** | −0.301 |
| JB | 13.985*** | 241.260*** | 8.141** | 9.143*** |
| ERS | −2.556** | −3.666*** | −1.863* | 0.581 |
| Q(20) | 213.349*** | 61.092*** | 286.332*** | 432.473*** |
| Q2(20) | 87.252*** | 2.12 | 140.764*** | 432.756*** |
| Correlation | ||||
| Kendall | FSI | OGAP | CA | CGD |
| FSI | 1.000*** | 0.075 | 0.071 | −0.246*** |
| OGAP | 0.075 | 1.000*** | −0.290*** | −0.282*** |
| CA | 0.071 | −0.290*** | 1.000*** | 0.129 |
| CGD | −0.246*** | −0.282*** | 0.129 | 1.000*** |
| India | FSI | OGAP | CA | CGD |
| Mean | 0.004 | 0.019 | −1.214*** | 1.697*** |
| Variance | 1.092*** | 13.285*** | 3.584*** | 0.002*** |
| Skewness | 0.128 | −0.900*** | 0.116 | 0.348 |
| Ex.Kurtosis | −0.635 | 29.379*** | 0.532 | −1.374*** |
| JB | 1.874 | 3,465.475*** | 1.346 | 9.485*** |
| ERS | −0.546 | −5.828*** | −1.893* | −1.143 |
| Q(20) | 187.235*** | 22.896*** | 164.374*** | 554.308*** |
| Q2(20) | 64.501*** | 25.469*** | 112.402*** | 554.797*** |
| Correlation | ||||
| Kendall | FSI | OGAP | CA | CGD |
| FSI | 1.000*** | 0.045 | −0.254*** | −0.104 |
| OGAP | 0.045 | 1.000*** | 0.011 | −0.051 |
| CA | −0.254*** | 0.011 | 1.000*** | 0.329*** |
| CGD | −0.104 | −0.051 | 0.329*** | 1.000*** |
| China | FSI | OGAP | CA | CGD |
| Mean | −0.429*** | 0.058 | 3.200*** | 1.450*** |
| Variance | 1.572*** | 4.908*** | 7.485*** | 0.007*** |
| Skewness | −0.253 | 0.379 | 1.303*** | −2.568*** |
| Ex.Kurtosis | 0.098 | 22.576*** | 0.942* | 6.819*** |
| JB | 1.059 | 2040.994*** | 30.725*** | 291.496*** |
| ERS | −1.494 | −4.996*** | −1.426 | −0.002 |
| Q(20) | 235.704*** | 32.904*** | 372.818*** | 261.918*** |
| Q2(20) | 74.252*** | 20.769** | 347.974*** | 278.706*** |
| Correlation | ||||
| Kendall | FSI | OGAP | CA | CGD |
| FSI | 1.000*** | −0.098 | −0.124 | −0.001 |
| OGAP | −0.098 | 1.000*** | −0.036 | −0.113 |
| CA | −0.124 | −0.036 | 1.000*** | 0.099 |
| CGD | −0.001 | −0.113 | 0.099 | 1.000*** |
| Russia | FSI | OGAP | CA | CGD |
| Mean | −0.008 | 0 | 5.949*** | 1.202*** |
| Variance | 1.624*** | 0.001*** | 9.938*** | 0.090*** |
| Skewness | 1.303*** | −0.094 | 0.044 | 0.973*** |
| Ex.Kurtosis | 2.377*** | −0.844*** | −1.404*** | 0.078 |
| JB | 49.777*** | 2.989 | 7.920** | 15.179*** |
| ERS | −0.65 | −3.266*** | −1.467 | −0.85 |
| Q(20) | 150.728*** | 195.655*** | 393.065*** | 542.648*** |
| Q2(20) | 62.435*** | 54.375*** | 397.626*** | 515.746*** |
| Correlation | ||||
| Kendall | FSI | OGAP | CA | CGD |
| FSI | 1.000*** | 0 | −0.022 | 0.363*** |
| OGAP | 0 | 1.000*** | −0.06 | −0.048 |
| CA | −0.022 | −0.06 | 1.000*** | 0.149** |
| CGD | 0.363*** | −0.048 | 0.149** | 1.000*** |
Principal components analysis: proportion of eigenvalue components.
| Eigenvalue components | PC1 | PC2 | PC3 | PC4 | PC5 | PC1-PC3 |
|---|---|---|---|---|---|---|
| South Africa | 0.2862 | 0.202 | 0.1965 | 0.1812 | 0.1342 | 0.6847 |
| China | 0.322 | 0.2574 | 0.1862 | 0.1296 | 0.1048 | 0.7656 |
| Brazil | 0.2475 | 0.2149 | 0.2059 | 0.1809 | 0.1508 | 0.6683 |
| Russia | 0.3594 | 0.2877 | 0.1528 | 0.1191 | 0.0809 | 0.7999 |
| India | 0.2800 | 0.2527 | 0.2147 | 0.1402 | 0.1123 | 0.7474 |
-
Source: Authors computation.
The number of IMFs and the selected IMFs from the ICEEMDAN algorithm.
| Date series | Time scale | Countries | Selected IMF |
|---|---|---|---|
| Signals | |||
| IMF.1 | Short term | Brazil | 1 |
| IMF.2 | Short term | Russia | |
| IMF.3 | Medium term | India | 3 |
| IMF.4 | Medium term | China | |
| Residual | Long term | South Africa | Residual |
See Figures 4a, 4b(i)-4b(xv).
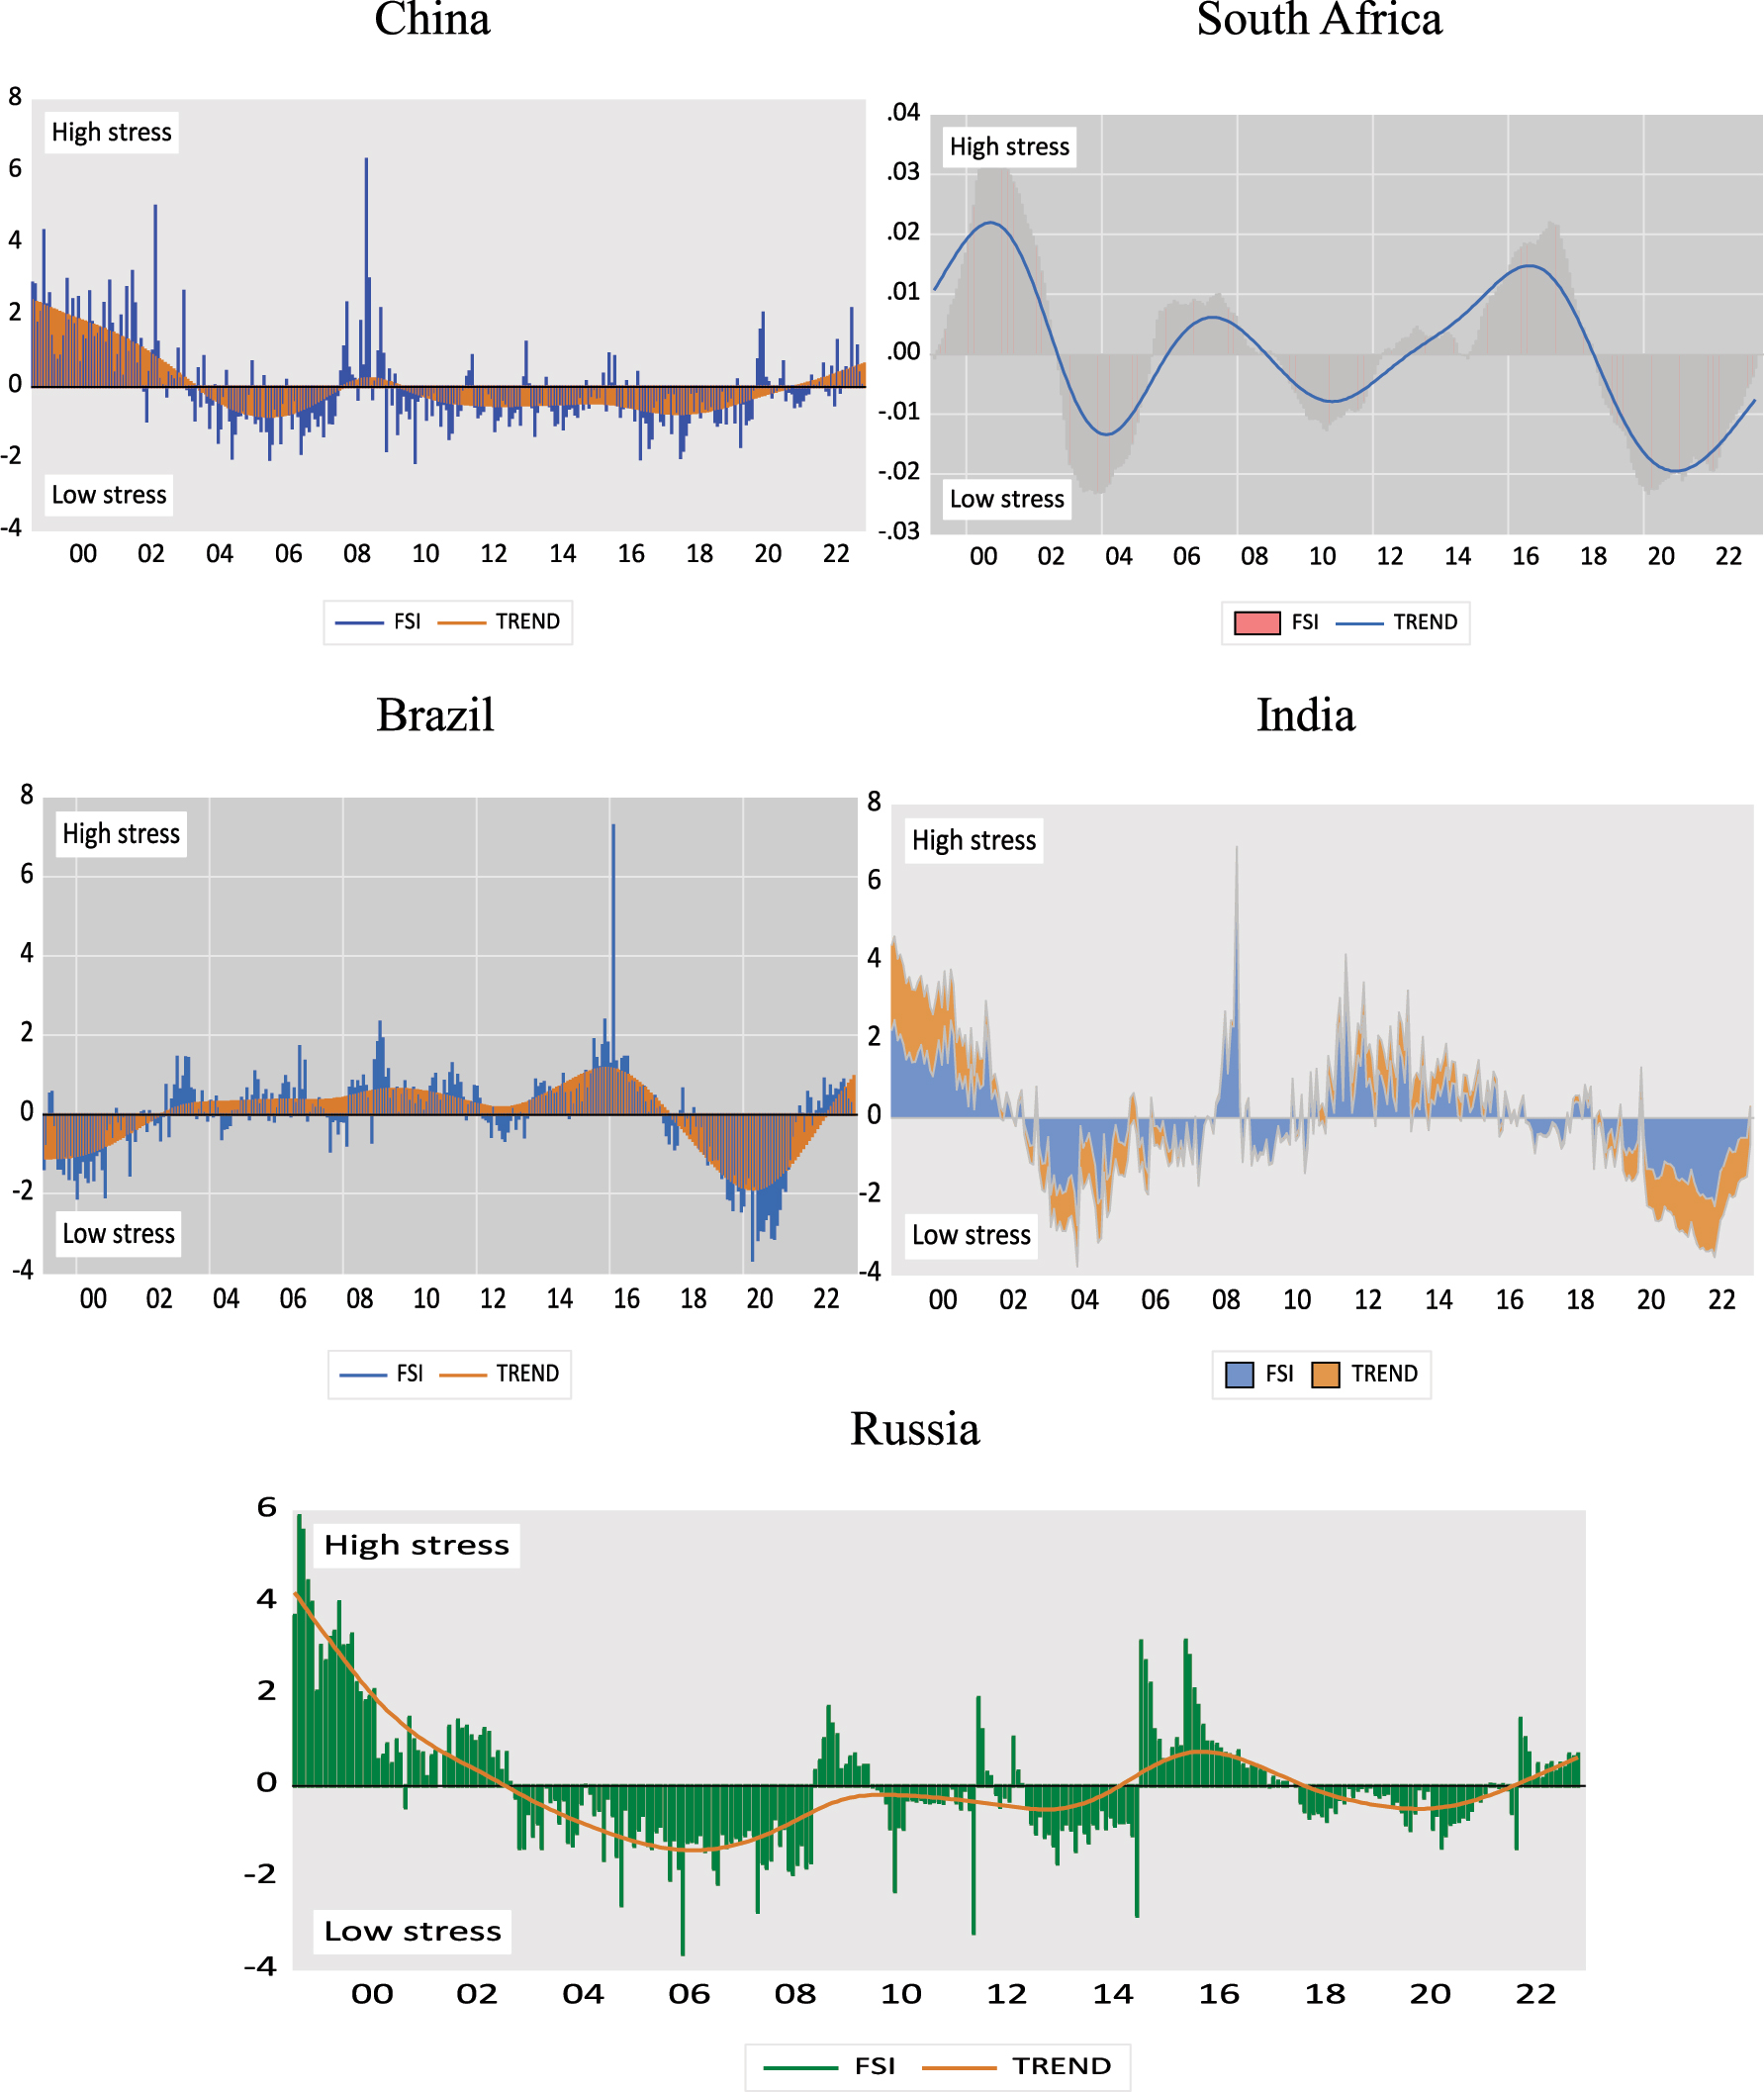
Identification of financial stress event of BRICS market.
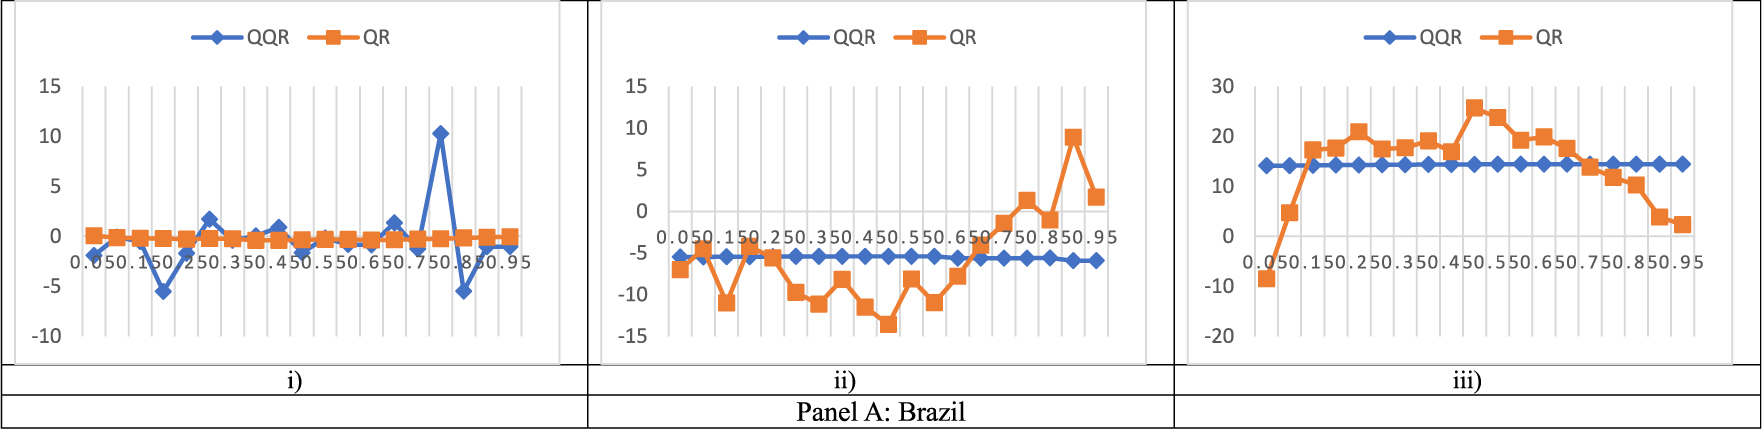
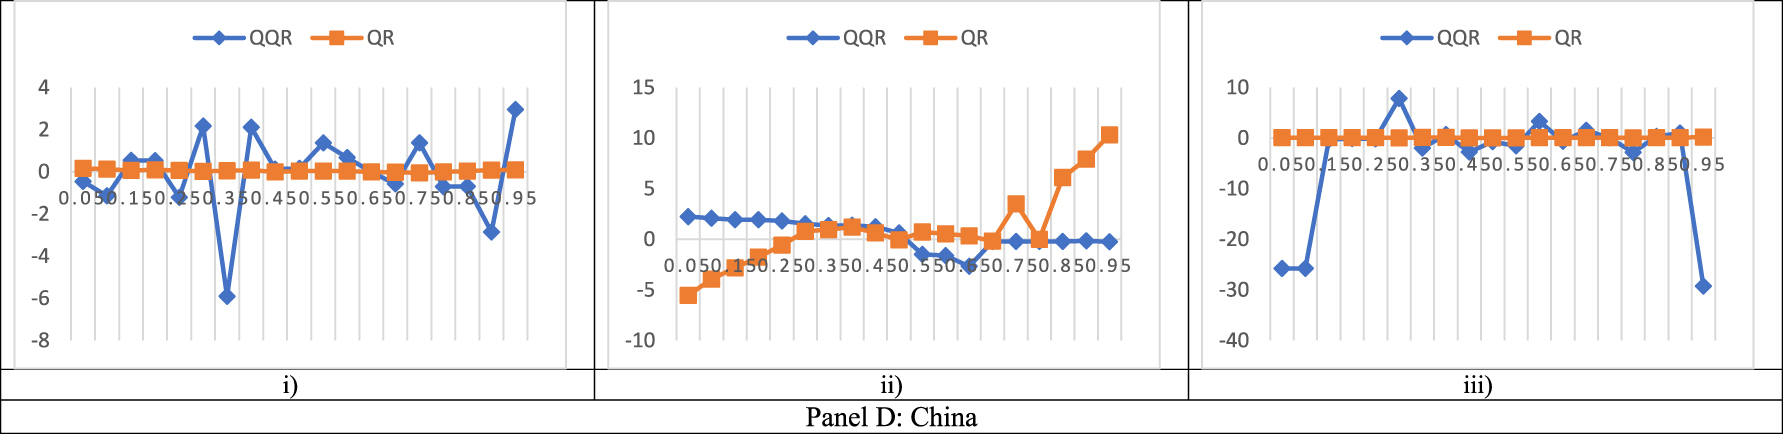
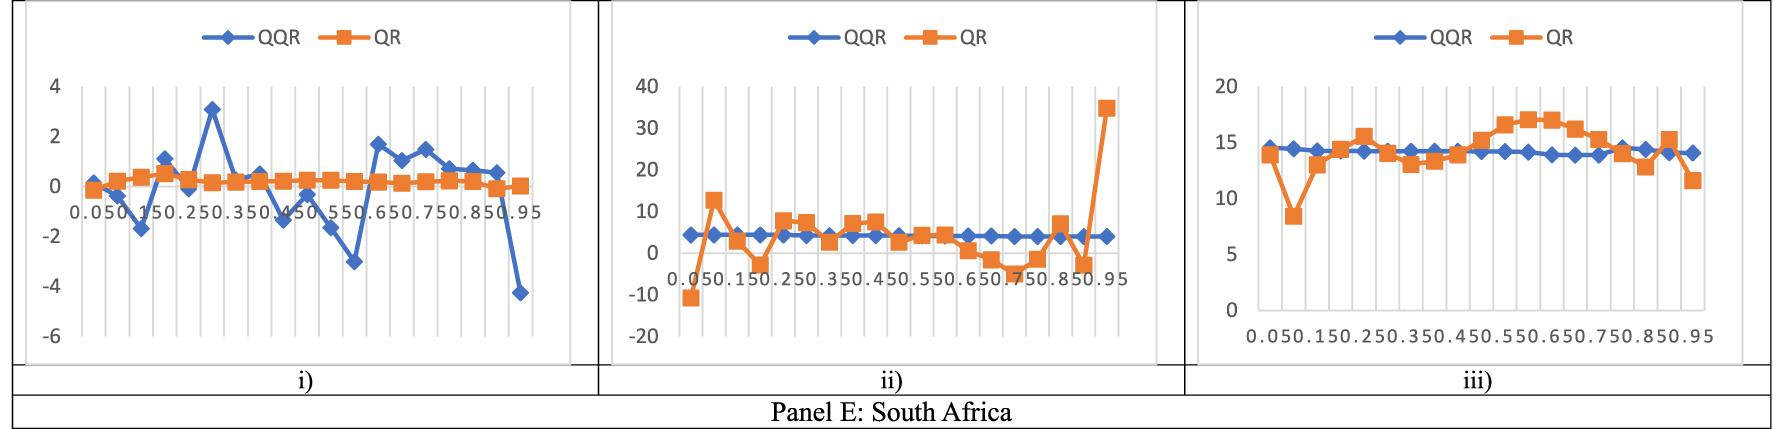
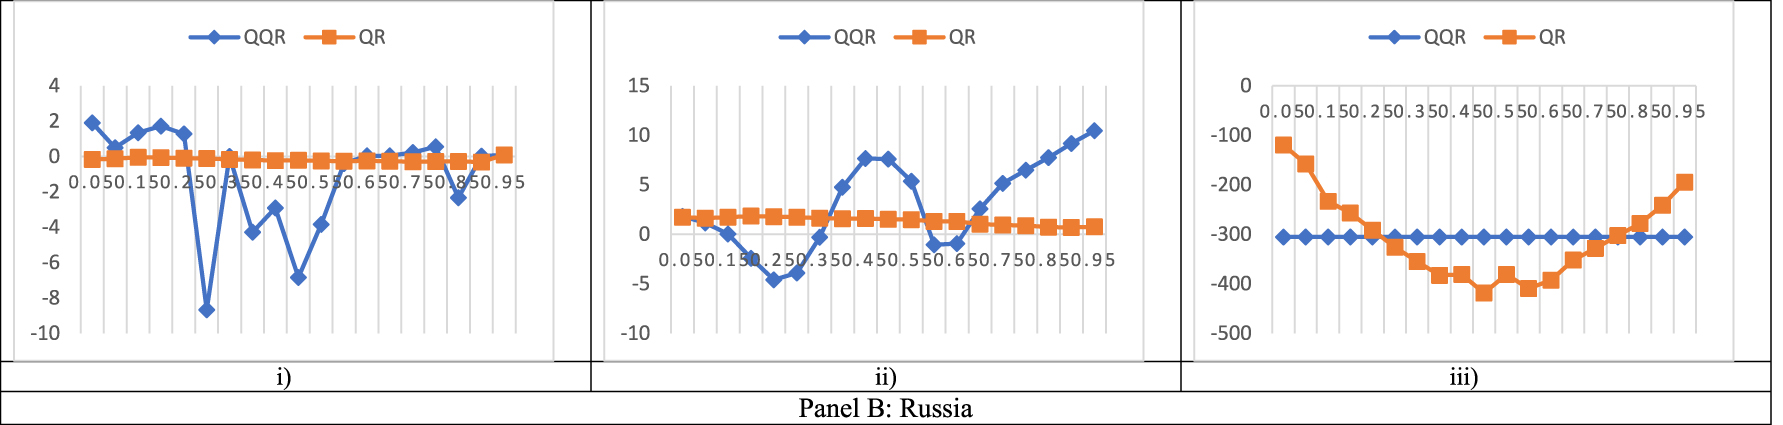
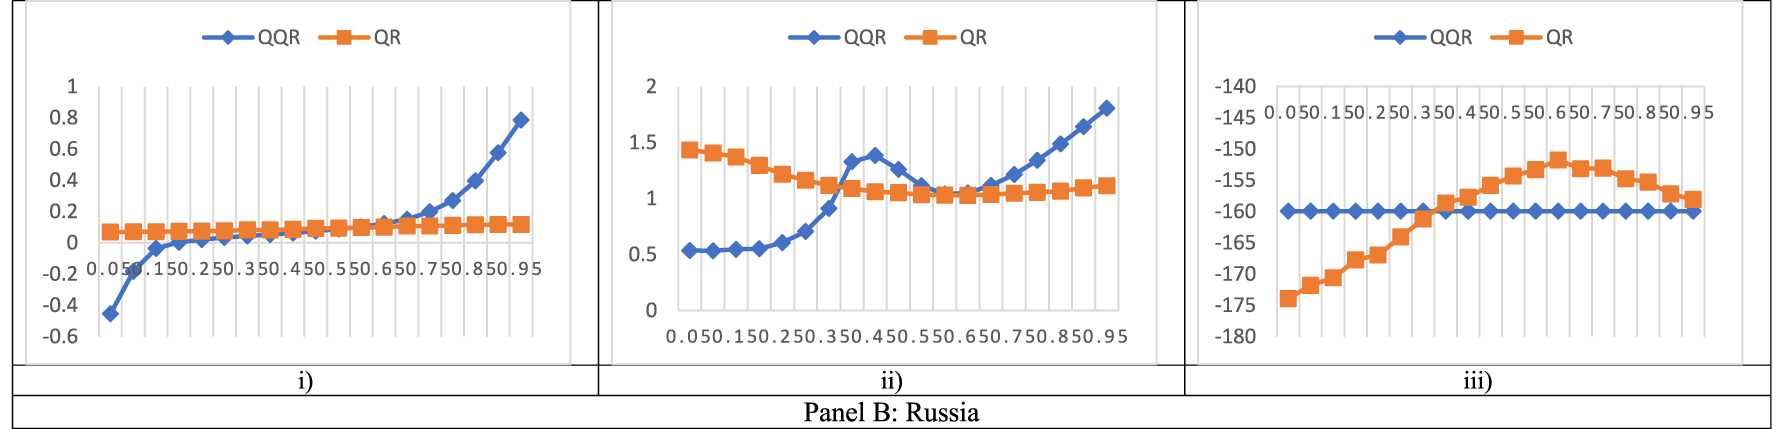
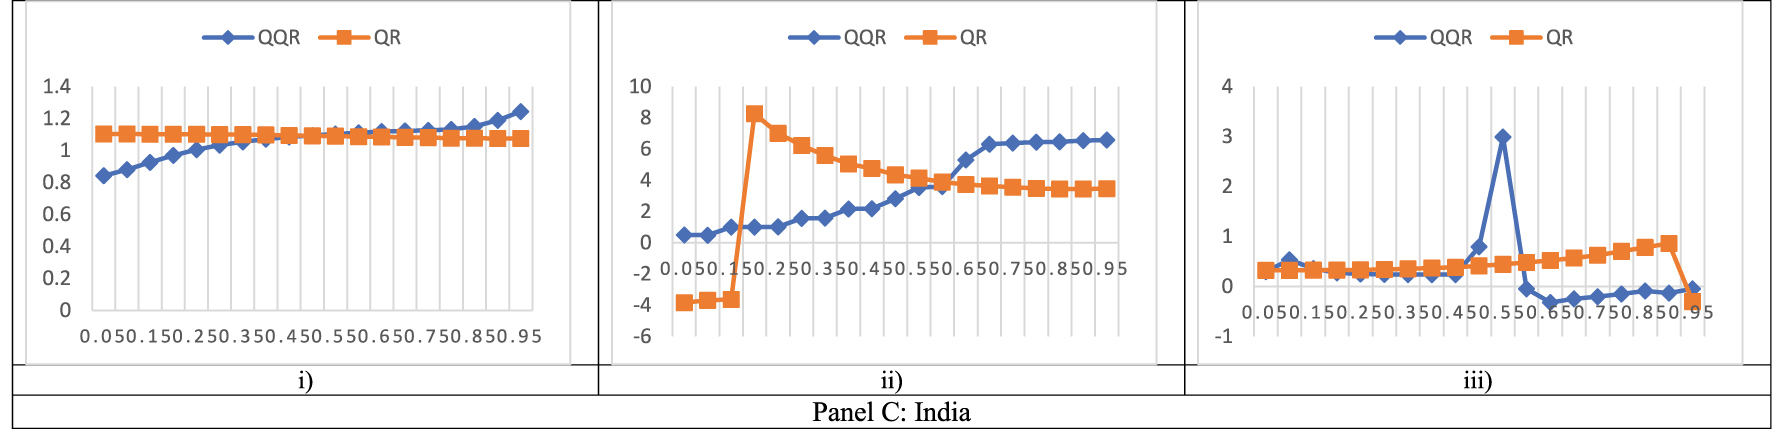
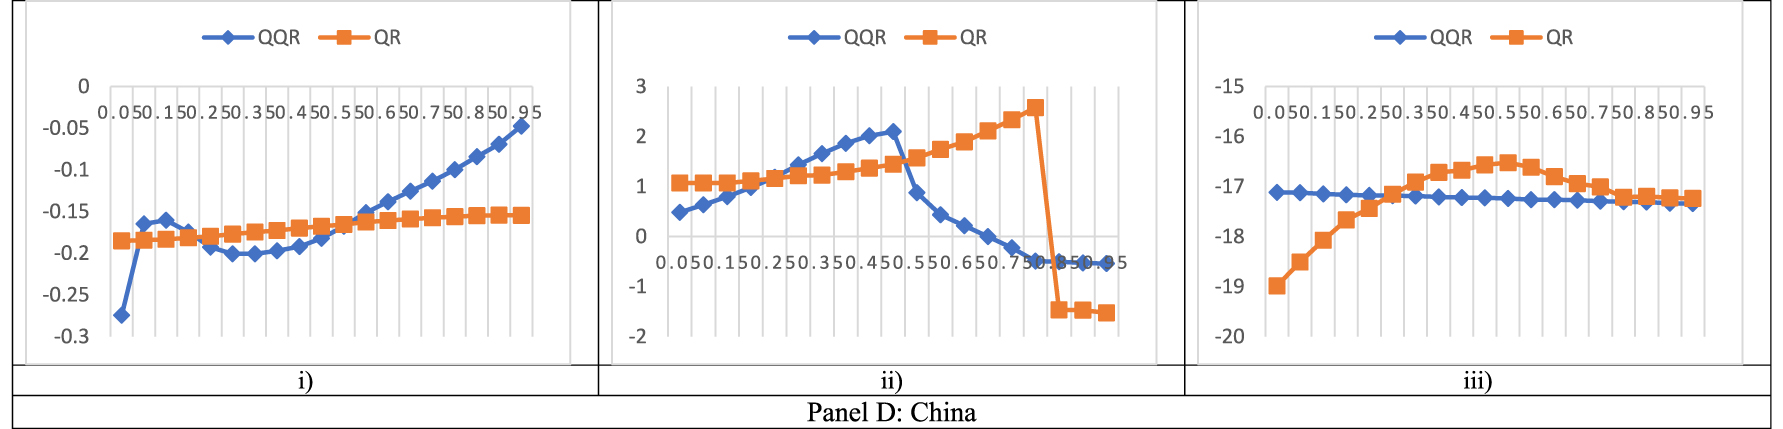
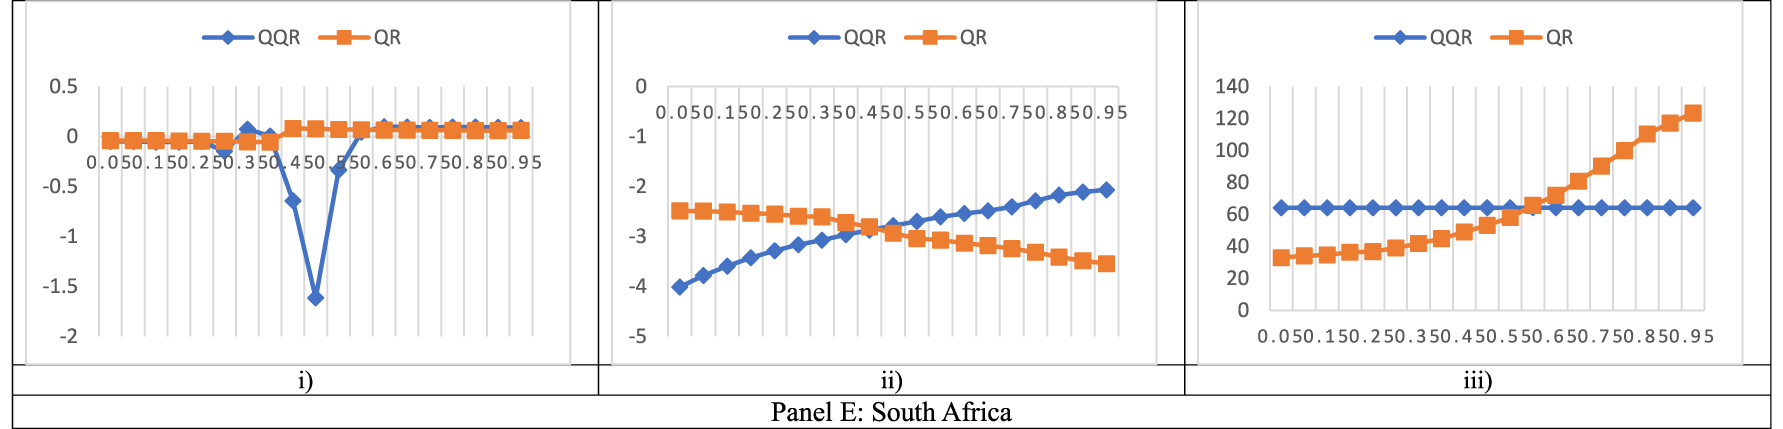
Line graphs of QQR and QR slopes between FSI and MIs at IMF1. The x-axis displays the quantiles whiles the y-axis displays the beta estimates. (i) FSI and CA. (ii) FSI and CGD. (iii) FSI and OGAP.
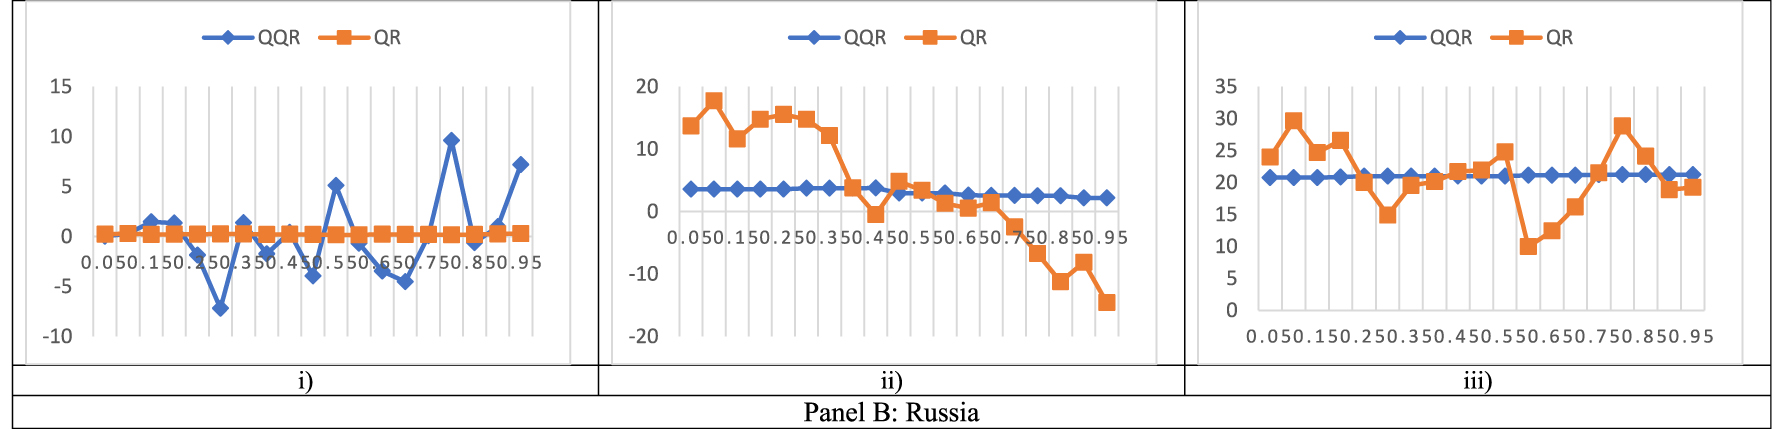
Line graphs of QQR and QR slopes between FSI and MIs at IMF1. The x-axis displays the quantiles whiles the y-axis displays the beta estimates. (i) FSI and CA. (ii) FSI and CGD. (iii) FSI and OGAP.
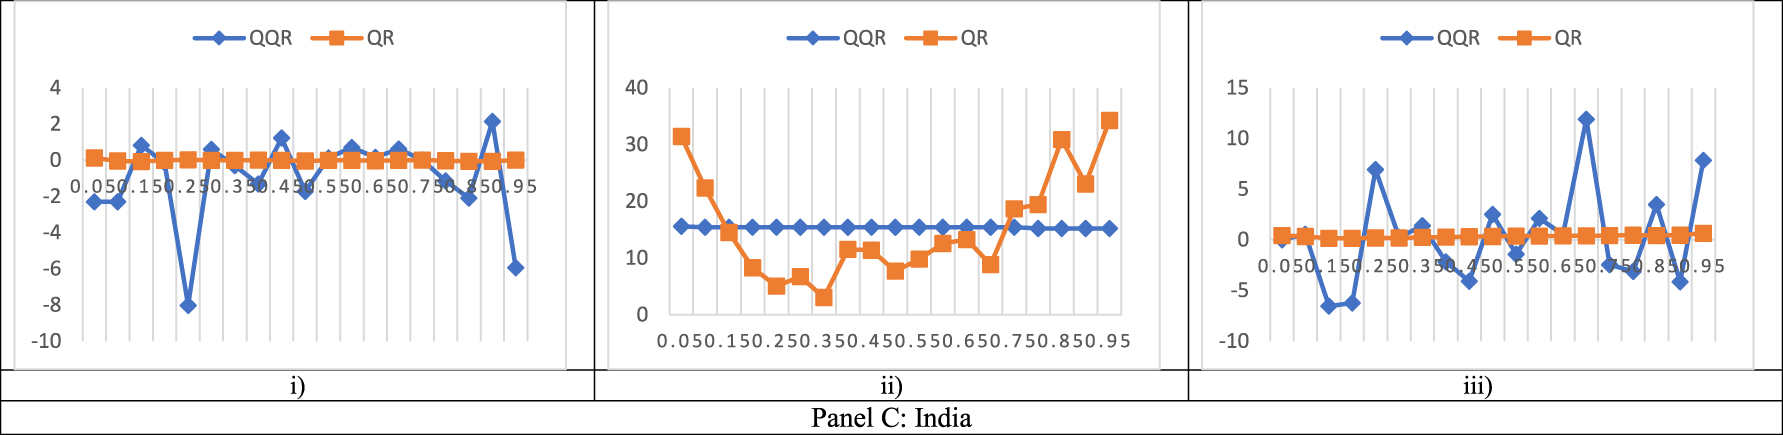
Line graphs of QQR and QR slopes between FSI and MIs at IMF1. The x-axis displays the quantiles whiles the y-axis displays the beta estimates. (i) FSI and CA. (ii) FSI and CGD. (iii) FSI and OGAP.
Line graphs of QQR and QR slopes between FSI and MIs at IMF1. The x-axis displays the quantiles whiles the y-axis displays the beta estimates. (i) FSI and CA. (ii) FSI and CGD. (iii) FSI and OGAP.
Line graphs of QQR and QR slopes between FSI and MIs at IMF1. The x-axis displays the quantiles whiles the y-axis displays the beta estimates. (i) FSI and CA. (ii) FSI and CGD. (iii) FSI and OGAP.
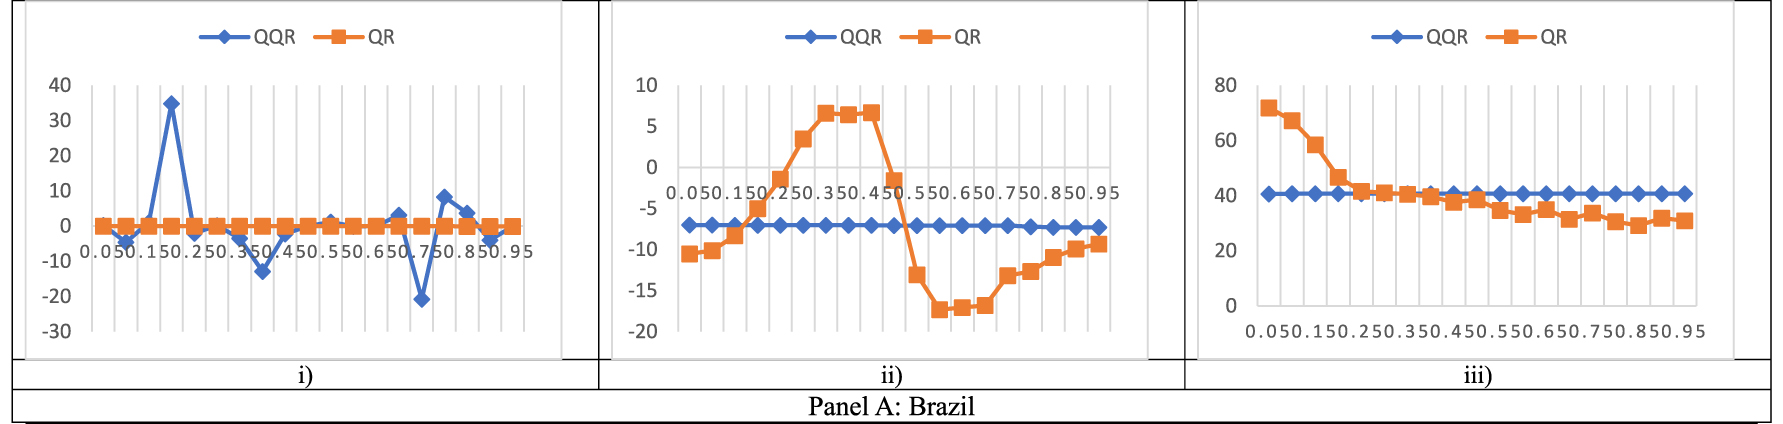
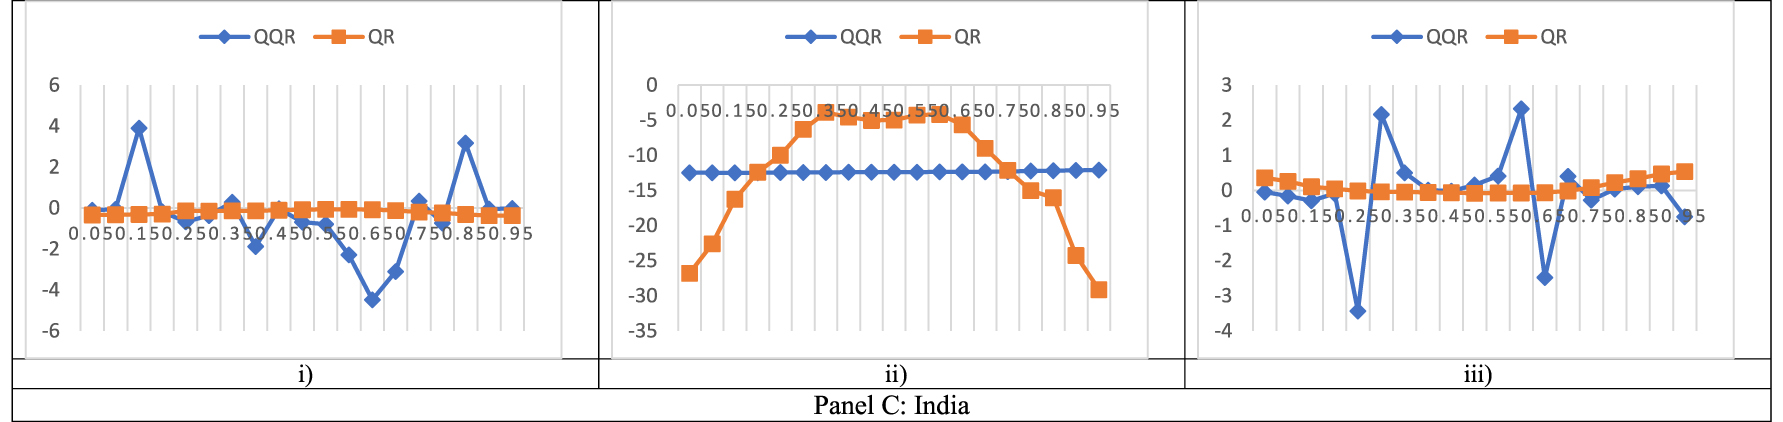
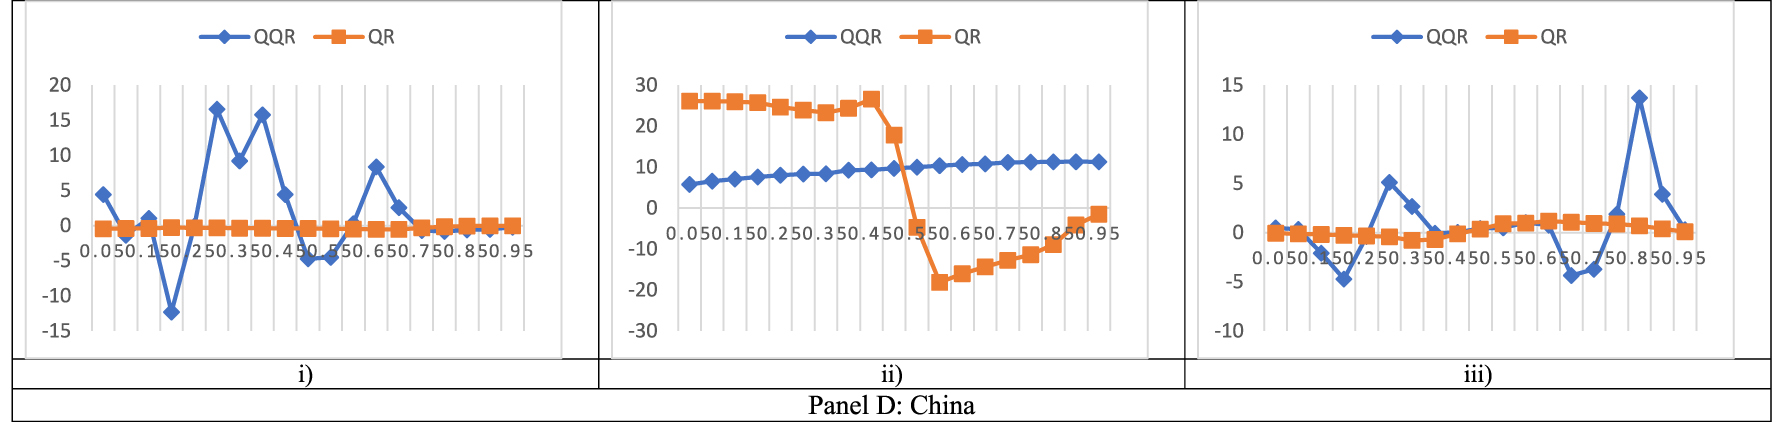
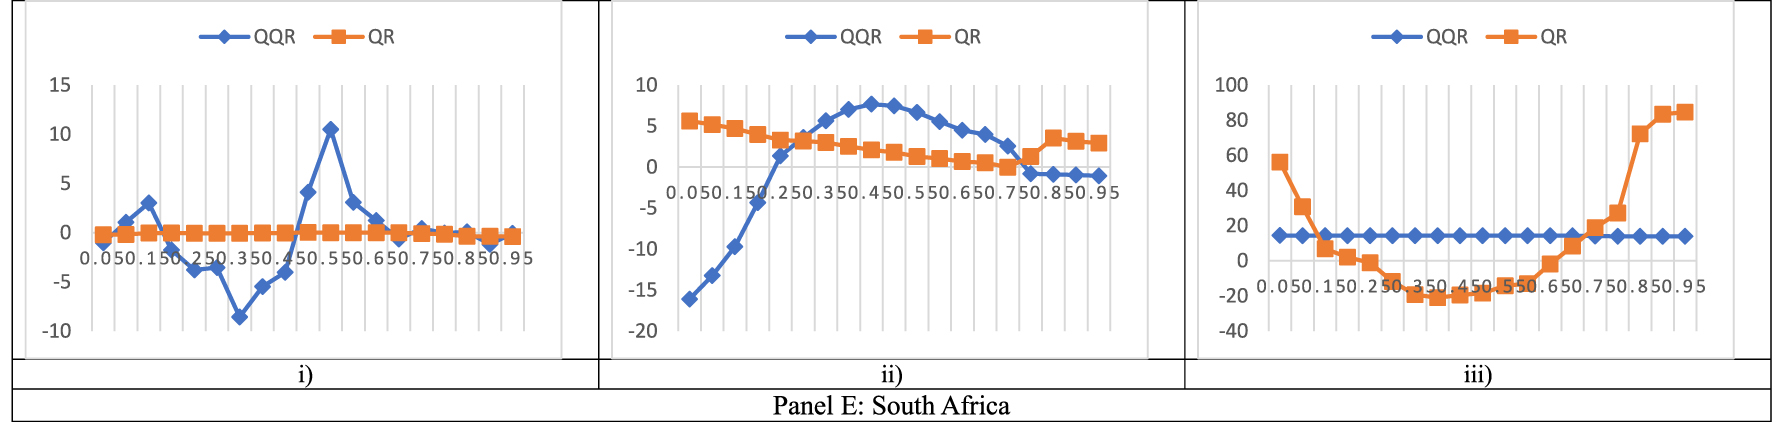
Line graphs of QQR and QR slopes between FSI and MIs at IMF3. The x-axis displays the quantiles whiles the y-axis displays the beta estimates. (i) FSI and CA. (ii) FSI and CGD. (iii) FSI and OGAP.
Line graphs of QQR and QR slopes between FSI and MIs at IMF3. The x-axis displays the quantiles whiles the y-axis displays the beta estimates. (i) FSI and CA. (ii) FSI and CGD. (iii) FSI and OGAP.
Line graphs of QQR and QR slopes between FSI and MIs at IMF3. The x-axis displays the quantiles whiles the y-axis displays the beta estimates. (i) FSI and CA. (ii) FSI and CGD. (iii) FSI and OGAP.
Line graphs of QQR and QR slopes between FSI and MIs at IMF3. The x-axis displays the quantiles whiles the y-axis displays the beta estimates. (i) FSI and CA. (ii) FSI and CGD. (iii) FSI and OGAP.
Line graphs of QQR and QR slopes between FSI and MIs at IMF3. The x-axis displays the quantiles whiles the y-axis displays the beta estimates. (i) FSI and CA. (ii) FSI and CGD. (iii) FSI and OGAP.
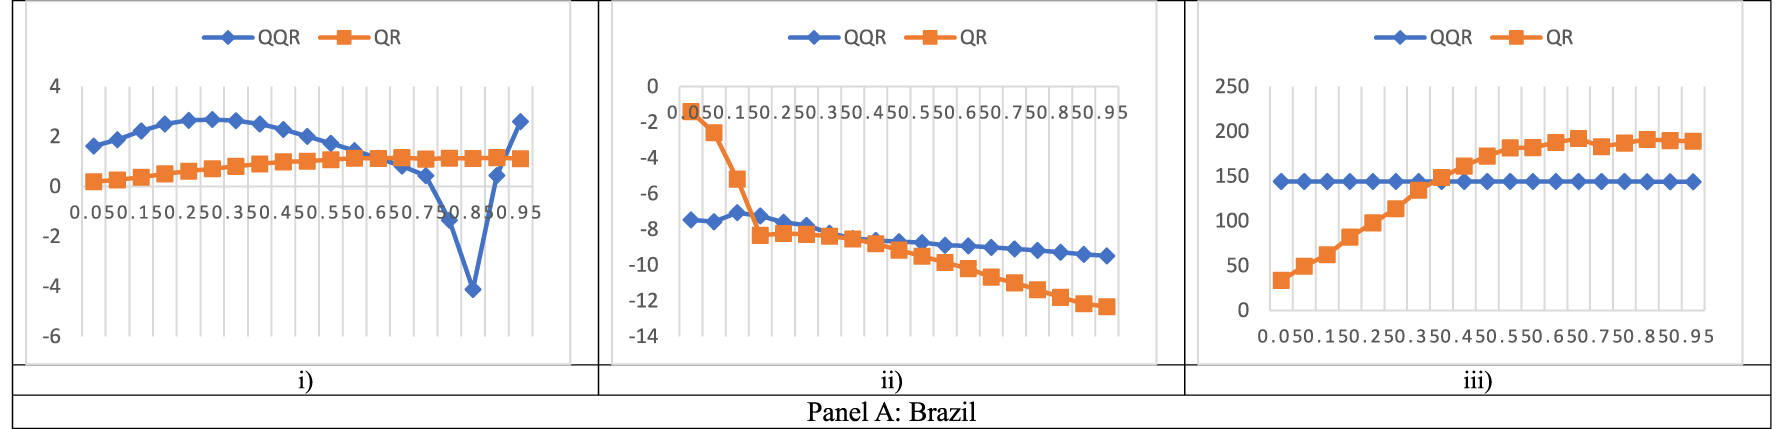
Line graphs of QQR and QR slopes between FSI and MIs at residuals. The x-axis displays the quantiles whiles the y-axis displays the beta estimates. (i) FSI and CA. (ii) FSI and CGD. (iii) FSI and OGAP.
Line graphs of QQR and QR slopes between FSI and MIs at residuals. The x-axis displays the quantiles whiles the y-axis displays the beta estimates. (i) FSI and CA. (ii) FSI and CGD. (iii) FSI and OGAP.
Line graphs of QQR and QR slopes between FSI and MIs at residuals. The x-axis displays the quantiles whiles the y-axis displays the beta estimates. (i) FSI and CA. (ii) FSI and CGD. (iii) FSI and OGAP.
Line graphs of QQR and QR slopes between FSI and MIs at residuals. The x-axis displays the quantiles whiles the y-axis displays the beta estimates. (i) FSI and CA. (ii) FSI and CGD. (iii) FSI and OGAP.
Line graphs of QQR and QR slopes between FSI and MIs at residuals. The x-axis displays the quantiles whiles the y-axis displays the beta estimates. (i) FSI and CA. (ii) FSI and CGD. (iii) FSI and OGAP.
References
Abakah, E. J. A., A. K. Tiwari, S. Ghosh, and B. Doğan. 2023. “Dynamic Effect of Bitcoin, Fintech and Artificial Intelligence Stocks on Eco-Friendly Assets, Islamic Stocks and Conventional Financial Markets: Another Look Using Quantile-Based Approaches.” Technological Forecasting and Social Change 192 (122566), https://doi.org/10.1016/j.techfore.2023.122566.Search in Google Scholar
Aboura, S., and B. van Roye. 2017. “Financial Stress and Economic Dynamics: The Case of France.” International Economics 149: 57–73.10.1016/j.inteco.2016.11.001Search in Google Scholar
Adam, T., S. Benecká, and J. Matějů. 2018. “Financial Stress and its Non-linear Impact on CEE Exchange Rates.” Journal of Financial Stability 36: 346–360, https://doi.org/10.1016/j.jfs.2018.04.008.Search in Google Scholar
Adams, C., and D. Park. 2009. “Causes and Consequences of Global Imbalances: Perspective from Developing Asia.” Asian Development Review 26 (1): 19–47. https://doi.org/10.1142/s0116110509000025.Search in Google Scholar
Adarov, A. 2021. “Dynamic Interactions between Financial Cycles, Business Cycles and Macroeconomic Imbalances: A Panel VAR Analysis.” International Review of Economics and Finance 74 (April): 434–51. https://doi.org/10.1016/j.iref.2021.03.021.Search in Google Scholar
Adrian, T., N. Boyarchenko, and D. Giannone. 2019. “Vulnerable Growth.” American Economic Review 109 (4): 1263–89. https://doi.org/10.1257/aer.20161923.Search in Google Scholar
Adrian, T., and N. Liang. 2018. “Monetary Policy, Financial Conditions, and Financial Stability.” 52nd Issue (January 2018) of the International Journal of Central Banking 59.Search in Google Scholar
Afanasyeva, E., S. Jerow, S. J. Lee, and M. Modugno. 2020. “Sowing the Seeds of Financial Imbalances: The Role of Macroeconomic Performance.” Journal of Financial Stability 74:100839, https://doi.org/10.1016/j.jfs.2020.100839.Search in Google Scholar
Agyei, S. K., and A. Bossman. 2023. “Exploring the Dynamic Connectedness between Commodities and African Equities.” Cogent Economics and Finance 11 (1). https://doi.org/10.1080/23322039.2023.2186035.Search in Google Scholar
Ahlgren, N., and J. Antell. 2010. “Stock Market Linkages and Financial Contagion: A Cobreaking Analysis.” The Quarterly Review of Economics and Finance 50 (2): 157–66. https://doi.org/10.1016/j.qref.2009.12.004.Search in Google Scholar
Al-Thaqeb, S. A., and B. G. Algharabali. 2019. “Economic Policy Uncertainty: A Literature Review.” The Journal of Economic Asymmetries 20: e00133. https://doi.org/10.1016/j.jeca.2019.e00133.Search in Google Scholar
Alsubaie, S. M., K. H. Mahmoud, A. Bossman, and E. Asafo-adjei. 2022. “Vulnerability of Sustainable Islamic Stock Returns to Implied Market Volatilities: An Asymmetric Approach.” Discrete Dynamics in Nature and Society 2022 (1): 9–12, https://doi.org/10.1155/2022/3804871.Search in Google Scholar
Altınkeski, B. K., E. I. Cevik, S. Dibooglu, and A. M. Kutan. 2022. “Financial Stress Transmission between the U.S. And the Euro Area.” Journal of Financial Stability 60 (March): 101004. https://doi.org/10.1016/j.jfs.2022.101004.Search in Google Scholar
Alvi, J., I. Arif, and K. Nizam. 2024. “Advancing Financial Resilience: A Systematic Review of Default Prediction Models and Future Directions in Credit Risk Management.” Heliyon 10 (21): e39770. https://doi.org/10.1016/j.heliyon.2024.e39770.Search in Google Scholar PubMed PubMed Central
Amewu, G., N. K. Akosah, and M. Armah. 2024a. “African Sovereign Risk Premia and International Market Assets: A Relook under the COVID-19 Outbreak.” Heliyon 10 (21): e40194. https://doi.org/10.1016/j.heliyon.2024.e40194.Search in Google Scholar PubMed PubMed Central
Amewu, G., M. Armah, S. Kuttu, and B. A. Kusi. 2024b. “African and International Financial Markets Interdependencies: Does Covid-19 Media Coverage Make Any Difference?” Research in Globalization: 100249. https://doi.org/10.1016/j.resglo.2024.100249.Search in Google Scholar
Antonakakis, N., I. Chatziantoniou, and D. Gabauer. 2020. “Refined Measures of Dynamic Connectedness Based on Time-Varying Parameter Vector Autoregressions.” Journal of Risk and Financial Management 13 (4): 84. https://doi.org/10.3390/jrfm13040084.Search in Google Scholar
Apostolakis, G. N., N. Giannellis, and A. P. Papadopoulos. 2019. “Financial Stress and Asymmetric Shocks Transmission within the Eurozone. How Fragile Is the Common Monetary Policy?” North American Journal of Economics and Finance 50 (June): 101006. https://doi.org/10.1016/j.najef.2019.101006.Search in Google Scholar
Apostolakis, G., and A. P. Papadopoulos. 2015. “Financial Stress Spillovers across the Banking, Securities and Foreign Exchange Markets.” Journal of Financial Stability 19: 1–21. https://doi.org/10.1016/j.jfs.2015.05.003.Search in Google Scholar
Armah, M., and G. Amewu. 2022. “Time-frequency Dynamics of Financial Market Stress and Global Economic Uncertainties : Evidence from the COVID-19 Pandemic Uncertainties : Evidence from the COVID-19 Pandemic.” Applied Economics Letters 10 (3): 934–939, https://doi.org/10.1080/13504851.2022.2156465.Search in Google Scholar
Armah, M., and G. Amewu. 2024. “Quantile Dependence and Asymmetric Connectedness between Global Financial Market Stress and REIT Returns : Evidence from the COVID-19 Pandemic.” The Journal of Economic Asymmetries 29 (January): e00352. https://doi.org/10.1016/j.jeca.2024.e00352.Search in Google Scholar
Armah, M., G. Amewu, and A. Bossman. 2022. “Time-frequency Analysis of Financial Stress and Global Commodities Prices: Insights from Wavelet- Based Approaches.” Cogent Economics & Finance 10 (1): 0–25. https://doi.org/10.1080/23322039.2022.2114161.Search in Google Scholar
Armah, M., A. Bossman, and G. Amewu. 2023. “Information Flow between Global Financial Market Stress and African Equity Markets: An Eemd-Based Transfer Entropy Analysis.” Heliyon 9 (3): e13899. https://doi.org/10.2139/ssrn.4269772.Search in Google Scholar
Balakrishnan, R., S. Danninger, S. Elekdag, and I. Tytell. 2011. “The Transmission of Financial Stress from Advanced to Emerging Economies.” Emerging Markets Finance and Trade 47 (Suppl. 2): 40–68. https://doi.org/10.2753/REE1540-496X4703S203.Search in Google Scholar
Balcilar, M., A. H. Elsayed, and S. Hammoudeh. 2023. “Financial Connectedness and Risk Transmission Among MENA Countries: Evidence from Connectedness Network and Clustering Analysis.” Journal of International Financial Markets, Institutions and Money 82: 101656. https://doi.org/10.1016/j.intfin.2022.101656.Search in Google Scholar
Balcilar, M., Z. A. Ozdemir, H. Ozdemir, G. Aygun, and M. E. Wohar. 2022. “The Macroeconomic Impact of Economic Uncertainty and Financial Shocks under Low and High Financial Stress.” The North American Journal of Economics and Finance 63: 101801. https://doi.org/10.1016/j.najef.2022.101801.Search in Google Scholar
Balcilar, M., Z. A. Ozdemir, B. Tunçsiper, H. Ozdemir, and M. Shahbaz. 2020. “On the Nexus Among Carbon Dioxide Emissions, Energy Consumption and Economic Growth in G-7 Countries: New Insights from the Historical Decomposition Approach.” Environment, Development and Sustainability 22 (8): 8097–134. https://doi.org/10.1007/s10668-019-00563-6.Search in Google Scholar
Berger, T., and S. Hienzsch. 2024. “Which Global Cycle? A Stochastic Factor Selection Approach for Global Macro-Financial Cycles.” Studies in Nonlinear Dynamics & Econometrics.10.1515/snde-2023-0093Search in Google Scholar
Bonga-Bonga, L. 2018. “Uncovering Equity Market Contagion Among BRICS Countries: An Application of the Multivariate GARCH Model.” Quarterly Review of Economics and Finance 67: 36–44. https://doi.org/10.1016/j.qref.2017.04.009.Search in Google Scholar
Borio, C. 2014. “The Financial Cycle and Macroeconomics: What Have We Learnt?” Journal of Banking and Finance 45 (1): 182–98. https://doi.org/10.1016/j.jbankfin.2013.07.031.Search in Google Scholar
Bossman, A. 2021. “Information Flow from COVID-19 Pandemic to Islamic and Conventional Equities: An ICEEMDAN-Induced Transfer Entropy Analysis.” Complexity 2021 (1): 4917051, https://doi.org/10.1155/2021/4917051.Search in Google Scholar
Bossman, A., and S. K. Agyei. 2022. “ICEEMDAN-Based Transfer Entropy between Global Commodity Classes and African Equities.” Mathematical Problems in Engineering 2022 (1): 8964989, https://doi.org/10.1155/2022/8964989.Search in Google Scholar
Bossman, A., S. K. Agyei, P. Owusu Junior, E. A. Agyei, P. K. Akorsu, E. Marfo-Yiadom, and G. Amfo-Antiri. 2022a. “Flights-to-and-from-Quality with Islamic and Conventional Bonds in the COVID-19 Pandemic Era: ICEEMDAN-Based Transfer Entropy.” Complexity 2022. https://doi.org/10.1155/2022/1027495.Search in Google Scholar
Bossman, A., Z. Umar, and T. Teplova. 2022b. “Modelling the Asymmetric Effect of COVID-19 on REIT Returns: A Quantile-On-Quantile Regression Analysis.” Journal of Economic Asymmetries 26 (May): e00257. https://doi.org/10.1016/j.jeca.2022.e00257.Search in Google Scholar PubMed PubMed Central
Boubaker, S., J. W. Goodell, D. K. Pandey, and V. Kumari. 2022. “Heterogeneous Impacts of Wars on Global Equity Markets: Evidence from the Invasion of Ukraine.” Finance Research Letters 48: 102934. https://doi.org/10.1016/J.FRL.2022.102934.Search in Google Scholar
Chandia, K. E., M. B. Iqbal, and W. Bahadur. 2022. “An Analysis of the Linkages Among Fiscal Vulnerability, Financial Stress and Macroeconomic Policies: An Econometric Study.” Fulbright Review of Economics and Policy 2 (1): 35–60. https://doi.org/10.1108/frep-06-2021-0036.Search in Google Scholar
Chatterjee, M., and I. Naka. 2022. “Twenty Years of BRICS: Political and Economic Transformations through the Lens of Land.” Oxford Development Studies 50 (1): 2–13. https://doi.org/10.1080/13600818.2022.2033191.Search in Google Scholar
Chen, L., T. Verousis, K. Wang, and Z. Zhou. 2023. “Financial Stress and Commodity Price Volatility.” Energy Economics 125: 106874. https://doi.org/10.1016/j.eneco.2023.106874.Search in Google Scholar
Chen, S., Y. Huang, and L. Ge. 2024. “An Early Warning System for Financial Crises: A Temporal Convolutional Network Approach.” Technological and Economic Development of Economy 30 (3): 688–711. https://doi.org/10.3846/tede.2024.20555.Search in Google Scholar
Chiranjivi, G. V. S., and R. Sensarma. 2023. “The Effects of Economic and Financial Shocks on Private Investment: A Wavelet Study of Return and Volatility Spillovers.” International Review of Financial Analysis 90: 102936. https://doi.org/10.1016/j.irfa.2023.102936.Search in Google Scholar
Christensen, I., and F. Li. 2014. “Predicting Financial Stress Events: A Signal Extraction Approach.” Journal of Financial Stability 14: 54–65. https://doi.org/10.1016/j.jfs.2014.08.005.Search in Google Scholar
Cockeran, H. J. 2016. “South Africa’s Macroeconomic Resilience to External Shocks: A Comparison to its BRICS Partners.” International Journal of Economics and Finance Studies 8 (1): 145–60.Search in Google Scholar
Colominas, M. A., G. Schlotthauer, and M. E. Torres. 2014. “Improved Complete Ensemble EMD: A Suitable Tool for Biomedical Signal Processing.” Biomedical Signal Processing and Control 14 (1): 19–29. https://doi.org/10.1016/j.bspc.2014.06.009.Search in Google Scholar
Csortos, O., and Z. Szalai. 2014. Early Warning Indicators: Financial and Macroeconomic Imbalances in Central and Eastern European Countries (2014/2; MNB Working Papers).Search in Google Scholar
Cui, J., and A. Maghyereh. 2024. “Unveiling Interconnectedness: Exploring Higher-Order Moments Among Energy, Precious Metals, Industrial Metals, and Agricultural Commodities in the Context of Geopolitical Risks and Systemic Stress.” Journal of Commodity Markets 33: 100380. https://doi.org/10.1016/j.jcomm.2023.100380.Search in Google Scholar
Dany-Knedlik, G., M. Kämpfe, and T. Knedlik. 2021. “The Appropriateness of the Macroeconomic Imbalance Procedure for Central and Eastern European Countries.” Empirica 48 (1): 123–139, https://doi.org/10.1007/s10663-020-09471-9.Search in Google Scholar
David, J. 2016. Brexit Costs Investors $2 Trillion, the Worst One-Day Drop Ever – British Pound Sterling Falls below Friday’s 31-year Low amid Uncertainty. https://desdemonadespair.net/2016/06/brexit-costs-investors-2-trillion-wors.html (accessed October 17, 2021).Search in Google Scholar
Dey, A., R. Chhibba, D. V. Ratnam, and N. Sharma. 2021. “A Combined iCEEMDAN and VMD Method for Mitigating the Impact of Ionospheric Scintillation on GNSS Signals.” Acta Geophysica 69 (5): 1933–48. https://doi.org/10.1007/s11600-021-00629-y.Search in Google Scholar
Dias, R. M. T., N. R. Horta, and M. Chambino. 2023. “Portfolio Rebalancing in Times of Stress: Capital Markets vs. Commodities.” Journal of Economic Analysis 2 (1): 63–76.Search in Google Scholar
Diebold, F. X., and K. Yilmaz. 2012. “Better to Give Than to Receive: Predictive Directional Measurement of Volatility Spillovers.” International Journal of Forecasting 28 (1): 57–66. https://doi.org/10.1016/j.ijforecast.2011.02.006.Search in Google Scholar
Diebold, F. X., and K. Yilmaz. 2014. “On the Network Topology of Variance Decompositions: Measuring the Connectedness of Financial Firms.” Journal of Econometrics 182 (1): 119–34.10.1016/j.jeconom.2014.04.012Search in Google Scholar
Dovern, J., and B. van Roye. 2014. “International Transmission and Business-Cycle Effects of Financial Stress.” Journal of Financial Stability 13: 1–17. https://doi.org/10.1016/j.jfs.2014.02.006.Search in Google Scholar
Dua, P., and D. Goel. 2021. “Determinants of Inflation in India.” The Journal of Developing Areas 55 (2). https://doi.org/10.1353/jda.2021.0040.Search in Google Scholar
Duprey, T., and B. Klaus. 2022. “Early Warning or Too Late? A (Pseudo-)real-time Identification of Leading Indicators of Financial Stress.” Journal of Banking & Finance 138: 106196. https://doi.org/10.1016/j.jbankfin.2021.106196.Search in Google Scholar
Eichengreen, B., A. Rose, and C. Wyplosz. 2004. “Contagious Currency Crises.” In Capital Flows and Crises, edited by B. Eichengreen. London, England: Massachusetts Institute of Technology Press.Search in Google Scholar
Elish, E., and R. Hammam. 2018. “Dynamic Interaction between Macroeconomic Imbalances: The Case of Egypt.” International Journal of Business and Economics Perspectives 13 (1): 53–70.Search in Google Scholar
Elsayed, A. H., N. Naifar, and S. Nasreen. 2023. “Financial Stability and Monetary Policy Reaction: Evidence from the GCC Countries.” Quarterly Review of Economics and Finance 87: 396–405. https://doi.org/10.1016/j.qref.2022.03.003.Search in Google Scholar
Elsayed, A. H., and L. Yarovaya. 2019. “Financial Stress Dynamics in the MENA Region: Evidence from the Arab Spring.” Journal of International Financial Markets, Institutions and Money 62: 20–34. https://doi.org/10.1016/j.intfin.2019.05.004.Search in Google Scholar
Flandrin, P., G. Rilling, and P. Goncalves. 2004. “Empirical Mode Decomposition as a Filter Bank.” IEEE Signal Processing Letters 11 (2): 112–4. https://doi.org/10.1109/LSP.2003.821662.Search in Google Scholar
Forbes, K. J., and R. Rigobon. 2001. “Measuring Contagion: Conceptual and Empirical Issues.” In International Financial Contagion, 43–66. Boston MA: Springer US.10.1007/978-1-4757-3314-3_3Search in Google Scholar
Forbes, K. J., and R. Rigobon. 2002. “No Contagion, Only Interdependence: Measuring Stock Market Comovements.” Journal of Finance 57 (5): 2223–61. https://doi.org/10.1111/0022-1082.00494.Search in Google Scholar
Forbes, K. J., and F. E. Warnock. 2021. “Capital Flow Waves – or Ripples? Extreme Capital Flow Movements since the Crisis.” Journal of International Money and Finance 116: 102394. https://doi.org/10.1016/j.jimonfin.2021.102394.Search in Google Scholar
Gabauer, D., and R. Gupta. 2018. “On the Transmission Mechanism of Country-specific and International Economic Uncertainty Spillovers: Evidence from a TVP-VAR Connectedness Decomposition Approach.” Economics Letters 171: 63–71. https://doi.org/10.1016/j.econlet.2018.07.007.Search in Google Scholar
Gallegati, M., and D. D. Gatti. 2018. “Macrofinancial Imbalances in Historical Perspective: A Global Crisis Index.” Journal of Economic Dynamics and Control 91: 190–205. https://doi.org/10.1016/j.jedc.2018.01.026.Search in Google Scholar
Giampaoli, N., M. Cucculelli, and V. Sullo. 2024. “Business and Financial Cycle across Regimes: Does Financial Stress Matter?” International Review of Economics & Finance 96: 103645. https://doi.org/10.1016/j.iref.2024.103645.Search in Google Scholar
Gkillas, K., R. Gupta, and D. I. Vortelinos. 2023. “Uncertainty and Realized Jumps in the Pound-Dollar Exchange Rate: Evidence from over One Century of Data.” Studies in Nonlinear Dynamics & Econometrics 27 (1): 25–47. https://doi.org/10.1515/snde-2020-0083.Search in Google Scholar
Gnimassoun, B., and V. Mignon. 2016. “How Do Macroeconomic Imbalances Interact? Evidence from a Panel VAR Analysis.” Macroeconomic Dynamics 20: 1717–41. https://doi.org/10.1017/S136510051500005X.Search in Google Scholar
Gourinchas, P. O. 2023. “International Macroeconomics: From the Great Financial Crisis to COVID-19, and beyond.” IMF Economic Review 71 (1): 1. https://doi.org/10.1057/s41308-022-00171-x.Search in Google Scholar
Gubareva, M., A. Bossman, and T. Teplova. 2023. “North American Journal of Economics and Finance Stablecoins as the Cornerstone in the Linkage between the Digital and Conventional Financial Markets.” North American Journal of Economics and Finance 68 (February): 101979. https://doi.org/10.1016/j.najef.2023.101979.Search in Google Scholar
Hakkio, C. S., and W. R. Keeton. 2009. “Financial Stress: What Is it, How Can it Be Measured, and Why Does it Matter?” Economic Review 94 (2): 5–50. https://doi.org/10.2469/dig.v40.n1.29.Search in Google Scholar
Han, H., O. Linton, T. Oka, and Y.-J. Whang. 2016. “The Cross-Quantilogram: Measuring Quantile Dependence and Testing Directional Predictability between Time Series.” Journal of Econometrics 193 (1): 251–70. https://doi.org/10.1016/j.jeconom.2016.03.001.Search in Google Scholar
Hu, B., A. A. Alola, M. Z. Tauni, T. S. Adebayo, and S. Abbas. 2023. “Pathway to Cleaner Environment: How Effective Are Renewable Electricity and Financial Development Approaches?” Structural Change and Economic Dynamics 67 (March): 277–92. https://doi.org/10.1016/j.strueco.2023.08.003.Search in Google Scholar
Huang, Z. 1998. “Extensions to the K-Means Algorithm for Clustering Large Data Sets with Categorical Values.” Data Mining and Knowledge Discovery 2 (3): 283–304. https://doi.org/10.1023/A:1009769707641.10.1023/A:1009769707641Search in Google Scholar
Huang, N. E., Z. Shen, S. R. Long, M. C. Wu, H. H. Shih, Q. Zheng, and N.-C. Yen, et al.. 1998. “The Empirical Mode Decomposition and the Hilbert Spectrum for Nonlinear and Non-stationary Time Series Analysis.” Proceedings of the Royal Society of London. Series A: Mathematical, Physical and Engineering Sciences 454: 903–95.10.1098/rspa.1998.0193Search in Google Scholar
Hui, Y., W.-K. Wong, Z. Bai, and Z.-Z. Zhu. 2017. “A New Nonlinearity Test to Circumvent the Limitation of Volterra Expansion with Application.” Journal of the Korean Statistical Society 46 (3): 365–74. https://doi.org/10.1016/j.jkss.2016.11.006.Search in Google Scholar
Inekwe, J. N., Y. Jin, and M. R. Valenzuela. 2018. “The Effects of Financial Distress: Evidence from US GDP Growth.” Economic Modelling 72: 8–21. https://doi.org/10.1016/j.econmod.2018.01.001.Search in Google Scholar
Iqbal, B. A. 2022. “BRICS as a Driver of Global Economic Growth and Development.” Global Journal of Emerging Market Economies 14 (1): 7–8. https://doi.org/10.1177/09749101211067096.Search in Google Scholar
Islam, R., and V. Volkov. 2022. “Contagion or Interdependence? Comparing Spillover Indices.” Empirical Economics 63 (3): 1403–55. https://doi.org/10.1007/s00181-021-02169-2.Search in Google Scholar PubMed PubMed Central
Jeong, K., W. K. Härdle, and S. Song. 2012. “A Consistent Nonparametric Test for Causality in Quantile.” Econometric Theory 28 (4): 861–87. https://doi.org/10.1017/S0266466611000685.Search in Google Scholar
Jha, R. 2023. “Macroeconomic Policies in the Current Global Context.” In Macroeconomics for Development, 142–55. Cheltenham, GL: Edward Elgar Publishing.10.4337/9781788977869.00013Search in Google Scholar
Joy, J., and P. K. Panda. 2021. “An Empirical Analysis of Sustainability of Public Debt Among BRICS Nations.” Journal of Public Affairs 21 (2): e2170, https://doi.org/10.1002/pa.2170.Search in Google Scholar
Kasal, S. 2023. “What Are the Effects of Financial Stress on Economic Activity and Government Debt? an Empirical Examination in an Emerging Economy.” Borsa Istanbul Review 23 (1): 254–67. https://doi.org/10.1016/j.bir.2022.10.007.Search in Google Scholar
Khan, N., A. Saleem, and O. Ozkan. 2023. “Do Geopolitical Oil Price Risk Influence Stock Market Returns and Volatility of Pakistan: Evidence from Novel Non-parametric Quantile Causality Approach.” Resources Policy 81 (February): 103355. https://doi.org/10.1016/j.resourpol.2023.103355.Search in Google Scholar
Kishimba, K. J., J. O. Akande, and P.-F. Muzindutsi. 2024. “Macro Credit Risk Stress Testing in Tanzanian Banking Sector: A Global Vector Autoregressive (GVAR) Approach.” Journal of African Business 25 (3): 531–54. https://doi.org/10.1080/15228916.2023.2215579.Search in Google Scholar
Klacso, J. 2024. “How Micro Data Improve the Estimation of Household Credit Risk within the Macro Stress Testing Framework.” Computational Economics 64 (2): 707–33. https://doi.org/10.1007/s10614-023-10453-9.Search in Google Scholar
Knedlik, T., and G. V. O. N. Schweinitz. 2012. “Macroeconomic Imbalances as Indicators for Debt Crises in Europe.” Journal of Common Market Studies 50 (5): 726–45. https://doi.org/10.1111/j.1468-5965.2012.02264.x.Search in Google Scholar
Kocaarslan, B., U. Soytas, R. Sari, and E. Ugurlu. 2019. “The Changing Role of Financial Stress, Oil Price, and Gold Price in Financial Contagion Among US and BRIC Markets.” International Review of Finance 19 (3): 541–74. https://doi.org/10.1111/irfi.12189.Search in Google Scholar
Koop, G., and D. Korobilis. 2014. “A New Index of Financial Conditions.” European Economic Review 71: 101–16. https://doi.org/10.1016/j.euroecorev.2014.07.002.Search in Google Scholar
Kotliński, K. 2023. “The Macroeconomic Stability of United Kingdom after Brexit.” Ekonomia i Prawo. Economics and Law 23. (Forthcoming).10.12775/EiP.2023.032Search in Google Scholar
Kou, Z., F. Yang, J. Wu, and T. Li. 2020. “Application of Iceemdan Energy Entropy and Afsa-Svm for Fault Diagnosis of Hoist Sheave Bearing.” Entropy 22 (12): 1–13. https://doi.org/10.3390/e22121347.Search in Google Scholar PubMed PubMed Central
Kwark, N. S., and C. Lee. 2021. “Asymmetric Effects of Financial Conditions on GDP Growth in Korea: A Quantile Regression Analysis.” Economic Modelling 94: 351–69. https://doi.org/10.1016/j.econmod.2020.10.014.Search in Google Scholar
Laeven, L. 2018. “Systemic Banking Crises Revisited.” International Monetary Fund, https://doi.org/10.5089/9781484376379.001.Search in Google Scholar
Levine, R. 1997. “Financial Development and Economic Growth: Views and Agenda.” Journal of Economic Literature 35 (2): 688–726.Search in Google Scholar
Levine, R., and S. Zervos. 1998. “Stock Markets, Banks, and Economic Growth.” American Economic Review 88 (3): 537–58. https://doi.org/10.2307/116848.Search in Google Scholar
Li, T., Z. Qian, and T. He. 2020. “Short-Term Load Forecasting with Improved CEEMDAN and GWO-Based Multiple Kernel ELM.” Complexity. https://doi.org/10.1155/2020/1209547.Search in Google Scholar
Lim, S.-Y., and S.-Y. Choi. 2024. “Dynamic Credit Risk Transmissions Among Global Major Industries: Evidence from the TVP-VAR Spillover Approach.” The North American Journal of Economics and Finance 74: 102251. https://doi.org/10.1016/j.najef.2024.102251.Search in Google Scholar
Lo, A. W. 2004. “The Adaptive Markets Hypothesis.” The Journal of Portfolio Management 30 (1): 15–29. https://doi.org/10.3905/jpm.2004.442611.Search in Google Scholar
MacDonald, R., V. Sogiakas, and A. Tsopanakis. 2018. “Volatility Co-movements and Spillover Effects within the Eurozone Economies: A Multivariate GARCH Approach Using the Financial Stress Index.” Journal of International Financial Markets, Institutions and Money 52: 17–36. https://doi.org/10.1016/j.intfin.2017.09.003.Search in Google Scholar
Mallick, H., H. Padhan, and M. K. Mahalik. 2019. “Does Skewed Pattern of Income Distribution Matter for the Environmental Quality? Evidence from Selected BRICS Economies with an Application of Quantile-On-Quantile Regression (QQR) Approach.” Energy Policy 129: 120–31. https://doi.org/10.1016/j.enpol.2019.02.021.Search in Google Scholar
Martínez, J. F., and D. Oda. 2021. “Characterization of the Chilean Financial Cycle, Early Warning Indicators and Implications for Macro-Prudential Policies.” Latin American Journal of Central Banking 2 (1): 100024. https://doi.org/10.1016/j.latcb.2021.100024.Search in Google Scholar
Mensi, W., M. Gubareva, H. U. Ko, X. V. Vo, and S. H. Kang. 2023. “Tail Spillover Effects between Cryptocurrencies and Uncertainty in the Gold, Oil, and Stock Markets.” Financial Innovation 9 (1). https://doi.org/10.1186/s40854-023-00498-y.Search in Google Scholar PubMed PubMed Central
Müller, U. A., M. M. Dacorogna, R. D. D, O. V. Pictet, R. B. Olsen, and J. R. Ward. 1993. Fractals and Intrinsic Time: A Challenge to Econometrician. Zurich: Unpublished Manuscripts,Olsen and Associates.Search in Google Scholar
Mundra, S., and M. Bicchal. 2021. “Evaluating Financial Stress Indicators: Evidence from Indian Data.” Journal of Financial Economic Policy 13 (1): 116–35. https://doi.org/10.1108/JFEP-11-2019-0232.Search in Google Scholar
O’Brien, M., and S. Velasco. 2024. “Macro-financial Imbalances and Cyclical Systemic Risk Dynamics: Understanding the Factors Driving the Financial Cycle in the Presence of Non-linearities.” Macroeconomic Dynamics: 1–20.10.1017/S1365100524000154Search in Google Scholar
Owusu Junior, P., S. Frimpong, A. M. Adam, S. K. Agyei, E. N. Gyamfi, D. Agyapong, and G. Tweneboah. 2021. “COVID-19 as Information Transmitter to Global Equity Markets: Evidence from CEEMDAN-Based Transfer Entropy Approach.” Mathematical Problems in Engineering 2021 (1): 8258778, https://doi.org/10.1155/2021/8258778.Search in Google Scholar
Park, C. Y., and R. V. Mercado. 2014. “Determinants of Financial Stress in Emerging Market Economies.” Journal of Banking and Finance 45 (1): 199–224. https://doi.org/10.1016/j.jbankfin.2013.09.018.Search in Google Scholar
Pata, U. K., M. T. Kartal, T. S. Adebayo, and S. Ullah. 2023. “Enhancing Environmental Quality in the United States by Linking Biomass Energy Consumption and Load Capacity Factor.” Geoscience Frontiers 14 (3): 101531. https://doi.org/10.1016/j.gsf.2022.101531.Search in Google Scholar
Pesaran, H. H., and Y. Shin. 1998. “Generalized Impulse Response Analysis in Linear Multivariate Models.” Economics Letters 58 (1): 17–29. https://doi.org/10.1016/s0165-1765(97)00214-0.Search in Google Scholar
Rao, B. M., and P. Padhi. 2020. “Common Determinants of the Likelihood of Currency Crises in BRICS.” Global Business Review 21 (3): 698–712. https://doi.org/10.1177/0972150918779163.Search in Google Scholar
Reimann, C. 2024. “Predicting Financial Crises: An Evaluation of Machine Learning Algorithms and Model Explainability for Early Warning Systems.” Review of Evolutionary Political Economy: 1–33. https://doi.org/10.1007/s43253-024-00114-4.Search in Google Scholar
Rousseau, P. L., and P. Wachtel. 2011. “What Is Happening to the Impact of Financial Deepening on Economic Growth?” Economic Inquiry 49 (1): 276–88. https://doi.org/10.1111/j.1465-7295.2009.00197.x.Search in Google Scholar
Sergeyev®, D., C. Lian®, and Y. Gorodnichenko. 2024. “The Economics of Financial Stress.” Review of Economic Studies: rdae110. https://doi.org/10.1093/restud/rdae110.Search in Google Scholar
Sim, N., and H. Zhou. 2015. “Oil Prices, US Stock Return, and the Dependence between Their Quantiles.” Journal of Banking and Finance 55 (January): 1–8. https://doi.org/10.1016/j.jbankfin.2015.01.013.Search in Google Scholar
Sohag, K., I. Kalina, and A. H. Elsayed. 2023. “Financial Stress in Russia: Exploring the Impact of Oil Market Shocks.” Resources Policy 86: 104150. https://doi.org/10.1016/j.resourpol.2023.104150.Search in Google Scholar
Tiwari, A. K., E. J. A. Abakah, X. Shao, T.-L. Le, and M. N. Gyamfi. 2023. “Financial Technology Stocks, Green Financial Assets, and Energy Markets: A Quantile Causality and Dependence Analysis.” Energy Economics 118: 106498. https://doi.org/10.1016/j.eneco.2022.106498.Search in Google Scholar
Tiwari, A. K., M. Shahbaz, R. Khalfaoui, R. Ahmed, and S. Hammoudeh. 2024. “Directional Predictability from Energy Markets to Exchange Rates and Stock Markets in the Emerging Market Countries (E7+ 1): New Evidence from Cross‐quantilogram Approach.” International Journal of Finance & Economics 29 (1): 719–89. https://doi.org/10.1002/ijfe.2706.Search in Google Scholar
Torres, M. E., M. A. Colominas, G. Schlotthauer, and P. Flandrin. 2011. “A Complete Ensemble Empirical Mode Decomposition with Adaptive Noise.” In 2011 IEEE International Conference on Acoustics, Speech and Signal Processing (ICASSP), 4144–7.10.1109/ICASSP.2011.5947265Search in Google Scholar
Tunay, K. B., and S. Yükse. 2016. “Interact of Macroeconomic Imbalances in Vulnerable Emerging Economies: The Case of Fragile Eight.” International Congress of Management Economy and Policy: 1669–88.Search in Google Scholar
Umar, Z., A. Bossman, S. Y. Choi, and T. Teplova. 2022. “Does Geopolitical Risk Matter for Global Asset Returns? Evidence from Quantile-On-Quantile Regression.” Finance Research Letters 48 (March): 102991. https://doi.org/10.1016/j.frl.2022.102991.Search in Google Scholar
UNCTAD. 2021. State of Commodity Dependence 2021. United Nations-Geneva: UNCTAD.Search in Google Scholar
Whelan, K. 2010. Global Imbalances and the Financial Crisis. UCD Centre for Economic Research Working Paper Series (WP10/13).Search in Google Scholar
Wichmann, R. M., and W. Cordeiro. 2024. “How Financial Stress Can Impact Fiscal and Monetary Policies: Threshold VAR Analysis for Brazilian Economy.” Econometrics 12(4): 1–37, https://doi.org/10.3390/econometrics12040037.Search in Google Scholar
Wu, J., T. Zhou, and T. Li. 2020. “A Hybrid Approach Integrating Multiple ICEEMDANs, WOA, and RVFL Networks for Economic and Financial Time Series Forecasting.” Complexity 2020 (1): 9318308, https://doi.org/10.1155/2020/9318308.Search in Google Scholar
Wu, Z., and N. E. Huang. 2009. “Ensemble Empirical Mode Decomposition: A Noise-Assisted Data Analysis Method.” Advances in Adaptive Data Analysis 1 (1): 1–41. https://doi.org/10.1142/s1793536909000047.Search in Google Scholar
Yuan, X., and K. Liu. 2024. “The Impact of the Financial Cycle on the Economic Cycle and the Regulatory Role of Monetary Policy: Evidence from China.” International Journal of Emerging Markets. https://doi.org/10.1108/ijoem-03-2024-0547.Search in Google Scholar
Zaremba, A., Z. Umar, and M. Mikutowski. 2021. “Commodity Financialisation and Price Co-movement: Lessons from Two Centuries of Evidence.” Finance Research Letters 38: 101492. https://doi.org/10.1016/j.frl.2020.101492.Search in Google Scholar
Zeng, H., Q. Huang, M. Z. Abedin, A. D. Ahmed, and B. Lucey. 2024. “Connectedness and Frequency Connection Among Green Bond, Cryptocurrency and Green Energy-Related Metals Around the COVID-19 Outbreak.” Research in International Business and Finance 73: 102547. https://doi.org/10.1016/j.ribaf.2024.102547.Search in Google Scholar
Zha, H., S. Ruan, and W. Li. 2024. “The Characteristics of the New Dual-Cycle Development Pattern and Systemic Financial Risk Based on TVP-SVAR and MS-VAR Model Analyses.” Heliyon 10 (15): e34943. https://doi.org/10.1016/j.heliyon.2024.e34943.Search in Google Scholar PubMed PubMed Central
Supplementary Material
This article contains supplementary material (https://doi.org/10.1515/snde-2024-0045).
© 2025 Walter de Gruyter GmbH, Berlin/Boston