Interface transition layer interaction mechanism for ZTAP/HCCI composites
-
MoJin Zhou
 and
XiaoYu Chong
and
XiaoYu Chong

Abstract
ZrO2-toughened Al2O3 (ZTA, 40%) ceramic particles reinforced by high chromium cast iron (HCCI) matrix composites were fabricated by casting infiltration. The interaction between the ZTA ceramic particles and the matrix by the interface transition layer (ITL) was investigated. From the perspective of interfacial bonding, the ceramic particles and HCCI experienced metallurgical bonding by the ITL. Electron probe microanalysis results demonstrated that Cr, Fe, and Mn diffused from the matrix to the ITL. Transmission electron microscopy revealed that the main phases in the transition layer were glassy. The wear resistance of the composites with the transition layer was better than those without, as indicated by the three-body abrasive wear tester.
1 Introduction
Currently, traditional wear resistance materials (i.e. white cast iron, high manganese steel, alloy steel) are insufficient to meet the demands of modern industry. The structure of material composites has become a new research direction encompassing ceramic/metal matrix wear resistance composites [1], [2]. The ceramic particle reinforced metal matrix composites (CPRMMCs) involve the addition of ceramic particles to the molten metal often obtained by spontaneous reaction during liquid metal solidification [3], [4], [5], [6]. The CPRMMC materials not only exhibit high hardness and high modulus of the ceramic particles but also good toughness of the metal. However, the critical issue is how to solve the problem of the conjunction between the metal matrix and the ceramic particles. The ceramic-metal composites material of Al2O3/Fe was obtained by casting metal infiltration [7]. It reacts with alumina and generates a thin FeAl2O4 spinel layer when the molten iron infiltrates the gap between alumina particles. Tungsten carbide (WC) particles due to their high hardness can also be used as reinforcement to reinforced iron or steel matrix that is usually obtained by sintering or vacuum evaporative pattern casting and obtain the phase of Fe3W3C. However, WC cannot be widely applied due to its high price. WC has good wettability for iron and can generate Fe3W3C with iron under certain conditions, but the wetting contact angle between Al2O3 and iron is as high as 140°. The hardness of the WC particles is 2093HV30 – higher than that of Al2O3 particles (1700HV30) [8], [9], [10], [11], [12]. Ru et al. obtained alumina particles by nickel plating reinforced iron matrix composites, where the wear resistance of the alumina particles is higher than that of the matrix [13]. In this manner, interfacial-bonding improvement mainly relies on the reaction between the reinforcements and the metal matrix. However, it also affects the performance of the reinforcements. Usually, to improve the surface wettability of ceramic particles, they are often plated with a metal element. The combination is essentially a mechanical binding mode [14], [15].
In ZTA ceramic particles, zirconia is present in a metastable tetragonal phase. When the material is cooled to room temperature after sintering, the partial grain size increases above the critical particle size of ZrO2 when t-m phase transition occurs. The volume of the ZTA particles will expand such that microcracks are generated in the matrix, and the expansion of the main crack acts as a bifurcation or passivation to improve the fracture toughness of the particle. It will form a certain residual stress in the matrix after ZrO2 undergoes phase transformation. When the matrix is subjected to residual stress, the internal stress and external stress will cancel each other and the strength of the material will improve [16], [17]. Pure alumina is very brittle that a crack would be generated when phase change occurs. ZrO2-toughened Al2O3 (ZTA) ceramic particles combine high strength and high hardness that can improve the wear resistance of the composites, which makes ZTA suitable for reinforcement. In this paper, ZTA (40%) particles are used as reinforcements. Their toughness and thermal shock resistance are better than those of pure alumina ceramic particles [12], [16]. The ZTA particles should be pretreated when used, whereby the surface of the particles is covered with ceramic powder. The molten high chromium cast iron (HCCI) infiltrates the gap between the ZTA particles by gravity casting. It reacts with the powder and generates an interface transition layer (ITL) of glass phases at the interface. The ITL can improve the interfacial bonding properties. The wear resistance of the composites is also investigated using a three-body abrasive wear test.
2 Materials and methods
2.1 Preparation for the composites
Irregular ceramic particles are shown in Figure 1A. The size of the particles is 12–14 ASTM mesh. The chemical composition is displayed in Table 1. The physical and mechanical properties are shown in Table 2. Usually, the alumina particles are white; however, the ZTA ceramic is black in this paper. This is related to the preparation process of the ZTA ceramic particles. The preparation process is usually by melting, calcination, and crushing, finally obtaining the desired size of particles. It is also related to the toughened phase of ZrO2. The ZTA particles reinforced with HCCI matrix composites are synthesized by gravity casting (Figure 1C) and their honeycomb structure is shown in Figure 1B.
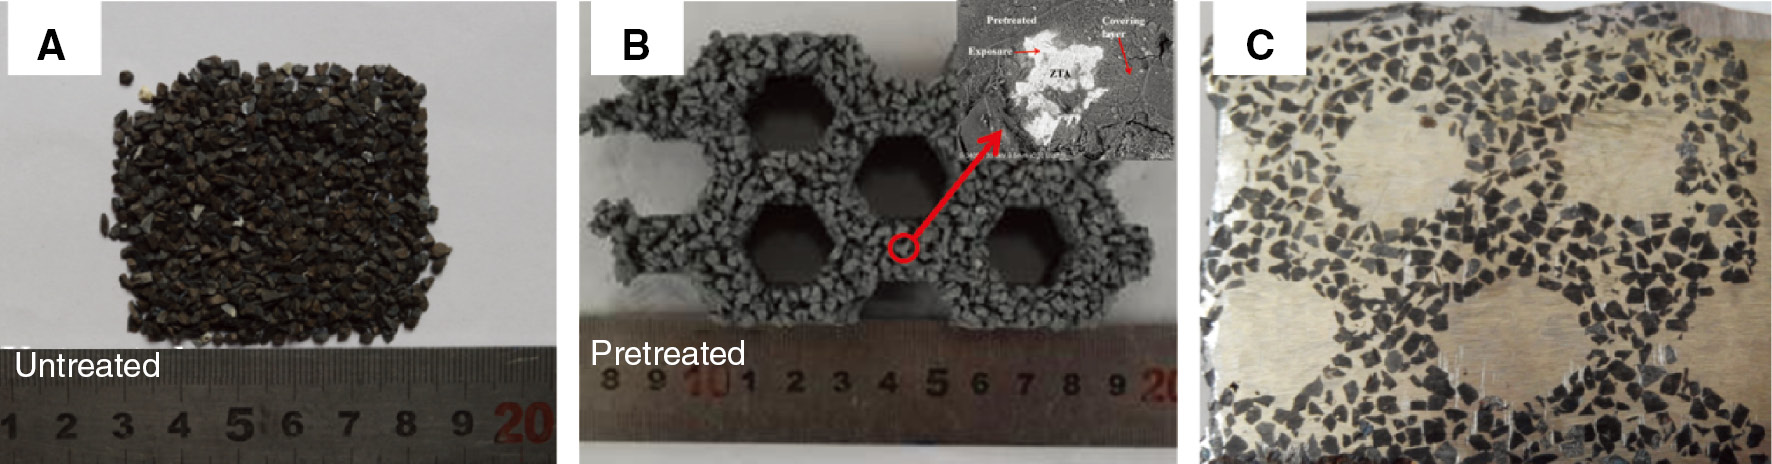
Macrographs of composite: (A) ceramic particles; (B) porous network of the preform; (C) CPRMMC.
Chemical composition of the ceramic particles.
| Composition | Al2O3 | ZrO2 | TiO2 | Fe2O3 | Others |
|---|---|---|---|---|---|
| Mass fraction (wt.%) | 55 | 40.0 | 3.0 | 0.7 | 1.3 |
Physical and mechanical properties of the ceramic particles.
| Material | Melting point (°C) | Hardness (kN/mm2) | Density (g/cm3) | Breaking strength (N) |
|---|---|---|---|---|
| ZTA (40% ZrO2) | 1800 | 19 | 4.63 | 97 |
Conventional composites are shown in Figure 2. The direction of metal infiltration is only one, which limits the material composite layer thickness. The composites of the honeycomb structure are conducive to molten metal infiltration. It is beneficial to improve the composite efficiency of metal and ceramic particles [18].
![Figure 2: Infiltration casting schematic: (A) layered composites; (B) honeycomb structure composites [8].](/document/doi/10.1515/secm-2016-0332/asset/graphic/j_secm-2016-0332_fig_002.jpg)
Infiltration casting schematic: (A) layered composites; (B) honeycomb structure composites [8].
The density of the ZTA particles is ρz; the weight of the ceramic particles is mass Mz; and their volume is V′. Through the formula Vz=Mz/ρz, the corresponding volume Vz is obtained. The porosity of the preform is calculated as follows:
The porosity of ZTA is 52%.
The composites of ZTA particle reinforced HCCI are synthesized by gravity casting. The specific processes are described as follows: (i) First, raw materials are weighed by mass ratio and then ball-milled for about 6 h with ethanol. The chemical composition and proportion of raw materials are shown in Table 3. (ii) Then, the ceramic powder (about 4 wt.% of the ceramic particles) and water glass are mixed by mass fractions in 1:1 proportion (Figure 3). Thereafter, the particles are sufficiently stirred to obtain homogeneous samples and filled into a mold. The molds are placed in a box furnace and heated at 473 K for 2 h. (iii) Third, the preforms are placed into a sand mold cavity and poured into molten HCCI. The chemical compositions of the HCCI are displayed in Table 4. The furnace used was a medium frequency induction; the weight was 150 kg and the pouring temperature was about 1723–1823 K.
Composition and proportion of ceramic powders.
| Ceramic powders | a-Al2O3 | TiO2 | ZrO2 | CaO | B4C |
|---|---|---|---|---|---|
| Mass fraction (wt.%) | 32 | 4 | 8 | 12 | 4 |
| Size (μm) | 3.8 | 0.4 | 0.4 | 3 | 3 |
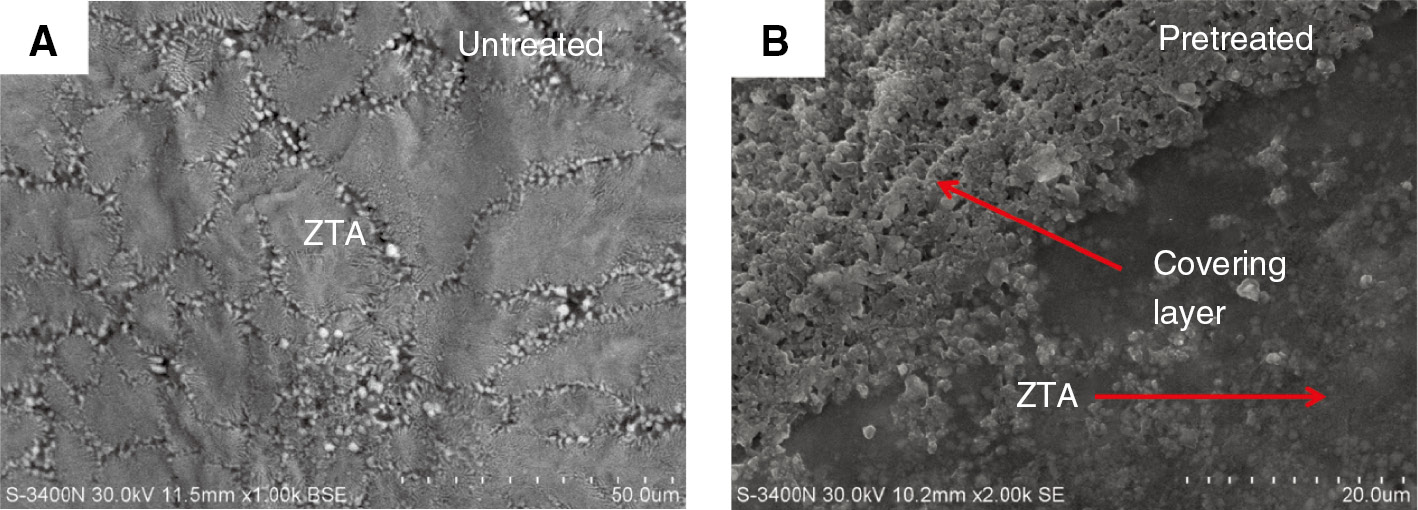
ZTA particles: (A) untreated; (B) pretreated.
Chemical composition of HCCI.
| Element | C | Cr | Mn | Si | Ni | Mo |
|---|---|---|---|---|---|---|
| Mass fraction (wt.%) | 2.8–3.2 | 25–28 | 0.8–1.2 | 0.5–0.6 | 0.3–0.5 | 0.3–0.5 |
2.2 Three-body abrasive wear test
The three-body abrasive wear behavior of the composites was investigated using a MMH-5 block-on-ring tester (Figure 4A). The abrasives used were loose quartz sands (SiO2, HV900–1300, 25–40 ASTM mesh). The rotating speed of the main axle was 50 rpm/min and the test force of the single axle was 50 N. Each sample was tested for 5 h and the time of each grinding process was 1 h. After each process, the samples were placed into a beaker containing alcohol in an ultrasonic cleaner, and the mass loss was measured by using an electronic balance with an accuracy of 0.0001 g. Figure 3B shows that the size of the wear sample was 25 mm×25 mm×15 mm.

Schematic diagram of three-body abrasive wear test: (A) diagram of wear principle; (B) size of wear samples.
The wear resistance of the material can be measured by mass loss, volume loss, relative wear resistance, and wear resistance rate. The composite area varies with the HCCI and ceramic particles. Under the same conditions of mass loss, the amount of volume loss was different. In this paper, the amount of volume loss was used. The volume loss of the material was calculated as follows.
The average density ρ of the composites was calculated as
where ρ1 and ρ2 represent the density of the particles and metal matrix, respectively; m1 and m2 represent the quality of the composites before and after abrasive wear, respectively; and f1 represents the particles-occupied volume fraction of the composites. The volume loss of the wear samples can be calculated using the following formula:
The density of the HCCI was 7.8 g/cm3 and the composite area was 6.22 g/cm3.
3 Results and discussion
3.1 Structure of interface
Figure 5A and B (S-3400N; Hitachi, Japan) show the composite samples without and with ceramic powder, respectively. From Figure 5A, it can be seen that there is no ITL in the interface, only a “gully”. Ceramic particles joined with a metal matrix depend on the wetting action and form a mechanical combination. From Figure 5B, it can be seen that there is a transition layer at the interface, which has better abrasion resistance under the same condition.
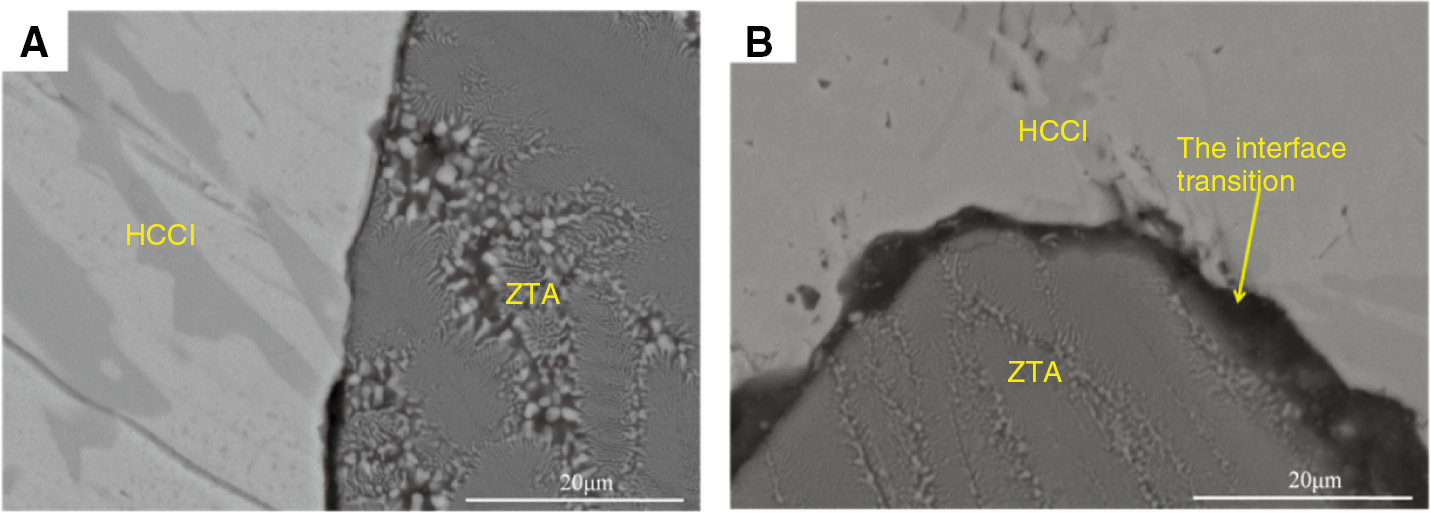
SEM images of the composite interface: (A) SN; (B) SY.
Figure 6 shows the X-ray diffraction pattern (D/max2200; Rigaku, Japan), which is the result of the reaction of the metal with the particles. This result can be calculated from the B4C reaction with the metal matrix.

X-ray diffraction pattern of the metal between ceramic particles.
From the composite interface plane energy spectrum (Figure 7), it can be seen that the main elements at the interface were Na, Al, Si, and Fe. The Fe element diffused into the ITL that led to the HCCI and the ITL bonding strongly together.

Interface plane energy spectrum of the composite.
The ITL was examined by electron probe microanalysis (EPMA; EPMA-1600; Shimadzu, Japan). In Figure 8, different colors represent different phases and the same colors represent the same phases. The energy spectral results of EPMA are shown in Table 5. From the table, it was calculated that the elements in the ITL were the Al2O3-SiO2-CaO-Na2O system. The presence of Cr, Fe, and Mn indicates that the elements in the matrix also diffused into the ITL. Figure 8 shows that the particles had the same colors as the transition layer. This indicates that the phases of the particles were similar to the phases in the transition layer, and that these phases merged together. For the same reason, the HCCI and the transition layer completed metallurgical bonding by diffusion and reaction. If the particles are combined with HCCI in the transition layer, the problem of the composite’s interface bonding between the ceramic particles and the matrix can be solved.

Interfacial transition layer by EPMA.
Energy spectrum of EPMA.
| Phases (norm%) | Na2O | Al2O3 | FeO | CaO | TiO2 | SiO2 | Cr2O3 | MnO | ZrO2 |
|---|---|---|---|---|---|---|---|---|---|
| A | 1.869 | 16.836 | 29.977 | 2.24 | 0.454 | 4.852 | 41.212 | 1.617 | 0.943 |
| B | 0.027 | 54.548 | 0.039 | 3.516 | 0.713 | 1.835 | 0.376 | 38.947 | |
| E | 9.653 | 42.193 | 0.636 | 0.487 | 34.401 | 11.712 | 0.839 | 0.08 | |
| D | 0.031 | 59.556 | 0.025 | 2.721 | 0.105 | 0.916 | 0.123 | 37.241 |
Transmission electron microscope (TEM) images of the ITL were obtained using a FEI Helios Nanolab 600i and FEI TECNAI G2 F20 S-TWIN. We obtained the TEM specimen of ITL by focused ion beam. These are shown in Figure 9. As can be seen from the figure, the ZTA particles and the ITL at the junction did not form a clear interface. Combined with the results of the electron probe microanalysis, it can be concluded that the particles and the ITL were combined together by interdiffusion between the particles and the ITL. At the same time, the main components of the particles were alumina and zirconia. The same components were present in the transition layer, which promoted wetting between the transition layer and the particles (Figure 9A). The same occurred between the HCCI and the interface transition, which were combined by diffusion (Figure 9B). By analyzing the ITL, it can be seen that the phases were amorphous and micro undissolved ceramic powder particles (Figure 9C,D). The phases in the interface transition were glass-ceramic.

TEM images of the ITL: (A) ZTA combined with the ITL; (B) HCCI combined with the ITL; (C and D) ITL.
The presence of ceramic powders in the preform can improve the interface bonding of the ZTA particles and the HCCI. The main composition of the binder is Na2O and SiO2; the main interface reaction system is Al2O3-SiO2-CaO-Na2O. The glass-ceramic phases are obtained under high-temperature conditions [19], [20], [21], [22], [23]. The molten metal that contacts the particles induces a rapid cooling effect, as the coefficient of thermal expansion between the metal and the particles is different. It will generate thermal stress at the interface of the composites due to the effects of thermal expansion and contraction [24]. The glass-ceramic phases have a good fluidity at high temperature and can absorb the thermal stress and obtain a good combination of ceramic particles and the metal matrix [18], [25]. The ceramic powders can react with Fe as follows [26], [27], [28]:
The chemical reaction is investigated by thermodynamic calculations, which are dependent on the Gibbs free energy. The reaction ΔGm is given by the Gibbs-Helmholtz equation:
Here, the conventional standard enthalpies of the phases are calculated using the following relationship:
Here, CP1 and CP2 represent different phase molar heat capacities at constant pressure; Ttr represents the transformation point; and ΔHtr represents the heat of the phase transition. Figure 10 shows the relationship between the temperature and the reaction enthalpy or Gibbs free energy. According to the basic principles of thermodynamics, a reaction will be spontaneous only if the change in Gibbs free energy (ΔGm) is negative. Figure 10B shows that the chemical reactions [Eqs. (3)–(5)] can carry on.

Relationship between temperature and reaction enthalpy or Gibbs free energy: (A) temperature and reaction enthalpy; (B) temperature and Gibbs free energy.
3.2 Mechanical properties of the transition layer
A nano-indentation test was implemented using a nano-indentation instrument (TI950; Hysitron, USA). Figure 11 is a representative load-displacement (F-h) curve, which was analyzed based on the Oliver and Pharr method. Each point had the same peak load of 10,000 mN and the loading and unloading rates were both maintained at 1 mN/s (Figure 11C). During indenting, forces and displacement were recorded to generate load-depth curves (Figure 11A). The Oliver and Pharr method was applied to calculate the hardness (H) and Young’s modulus (E), as shown in the following relations:

Representative load-displacement (F-h) curve analysis based on the Oliver and Pharr method: (A) schematic curve of the nano-indentation test; (B) micrograph of the points load area; (C) nano-indentation load-displacement curves of 1 mN/s.
where Fmax is the maximum applied load; A is the projected contact area between the indenter tip and the specimen at the maximum load; Er is the reduced modulus; and Ei (1141 GPa) and vi (0.07) are Young’s modulus and Poisson’s ratio of the diamond indenter, respectively [29]. Figure 11B shows the typical load-depth curves at 10,000 mN peak loads of the particles from the ITL to the HCCI matrix. About seven points give way to load the ITL (points 2–8), one point load particle (point 1), and matrix (point 9), respectively. Under the same peak load, the maximum penetration depth, final residual indentation depth, ITL, and matrix are different. In order to make the maximum penetration depth link with the final residual indentation depth, the relatively elastic recovery rate must be reviewed:
Figure 12 shows the results of relatively elastic recovery rate δ and recovery amount hp′. The recovery amount of the ITL was better than those of the ceramics and the matrix. The δ of particles, ITL, and matrix was about 48.88%, 61.69%, and 51.32%, respectively. It can be concluded that the ITL exhibits good elastic and plastic property.

Results of relatively elastic recovery rate δ and recovery amount hp′.
Figure 13A shows that the elastic modulus of the particles was larger than that of the HCCI matrix and ITL. Meanwhile, the elastic modulus of the HCCI matrix was larger than that of the ITL. It can therefore be concluded that the deformation capacity of the ITL under the same force is better than the particles and the HCCI matrix. It plays a very important role in bonding between the particles and the matrix; the particles and matrix possess different thermal expansion coefficients. Figure 13B contains information regarding the hardness of the composites. The hardness of the particles was higher than both the ITL and HCCI matrix. Thus, the ITL exhibits good mechanical properties. It also has good elasticity, which means it can absorb energy when the particles or the matrix thermally expand and contract. At the same time, it has a higher hardness, which means it has good wear resistance that prevents the particles from stripping.

Results of (A) Er and (B) hardness.
3.3 Wear mechanism of composite
S0, SN, SY in Figure 14A and B represent the HCCI, without powder composites and with powder composites, respectively. Figure 14A shows the total volume loss of samples. The test results indicate that the wear resistance of the composites was seven times more than that of HCCI. Comparing the results of SN and SY, the SN wear resistance instability and the wear volume loss were larger. Figure 14B shows the volume loss at each abrasive wear test process, and the results show that the SN composites appear to have undergone significant fluctuations in the fourth process.

Wear results of samples: (A) total amount of volume loss; (B) volume loss in each test process.
Figure 15 shows the scanning electron microscopy (SEM) micrographs of the abrasive wear area. Figure 15A indicates the experimental results of SN, showing that the ceramic particles experienced shedding during the wear processes. Compared with sample SY (Figure 15B), SN had a poor effect on the combined interface.

SEM micrographs of abrasive wear area: (A) samples of SN; (B) samples of SY.
The three stages of wear mechanism are initial wear, wear interim, and later period (Figure 16). Before wear (Figure 16A), the particles were completely covered by the metal matrix that it can prevent the particles from stripping from the composites. With an increase in wear time, the initial wear period arrived (Figure 16B). The matrix between the particles created serious furrows by the abrasive particles because the abrasive hardness of quartz is higher than that of HCCI (HV600–800). The mass of composites was seriously reduced and formed caving between the ceramic particles [8]. As time continued, the interim wear stage arrived (Figure 16C). The ceramic particles stood out on the matrix and formed a “microcosmic shadow effect” to protect the matrix because of its high wear resistance. At the same time, the caved surface between the particles protected the particles, preventing them from fracture and stripping [30]. During the period (Figure 16D), the mass loss of the matrix was serious. The particles’ massive exposure could not protect the matrix between the particles and the matrix could not support the particles simultaneously. Finally, the particles both fractured and stripped, and new particles then stood out and began the next cycle.
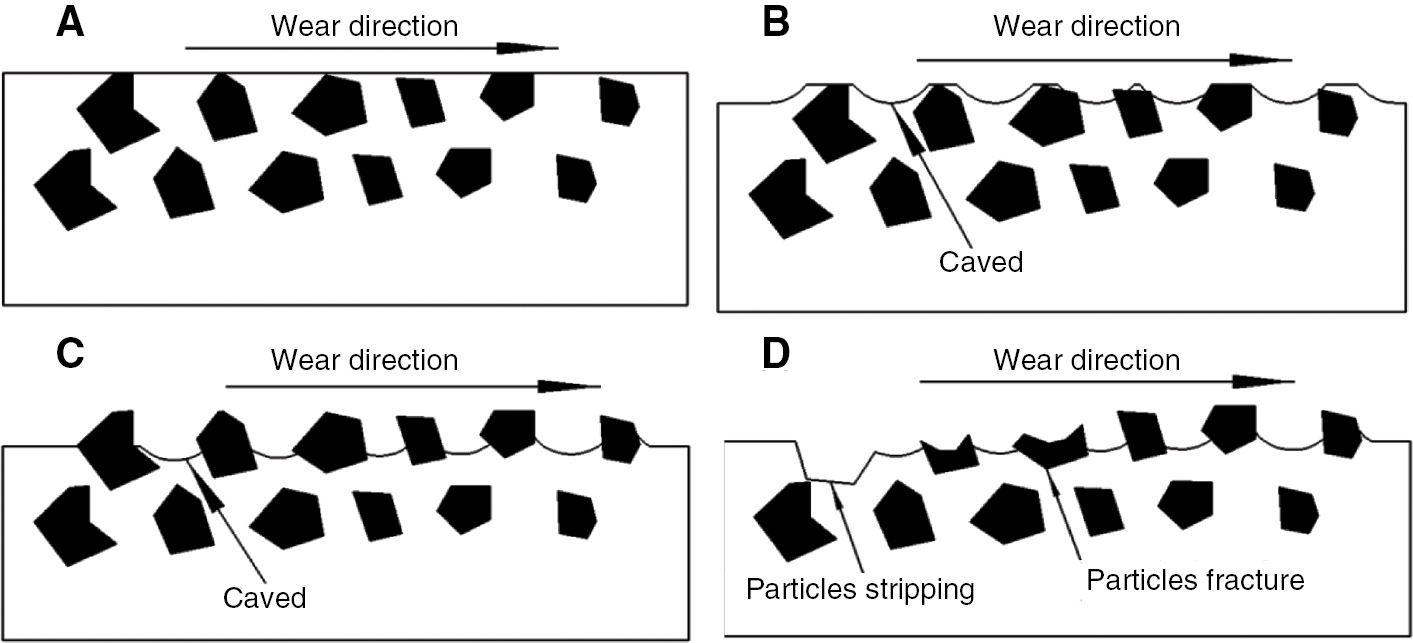
Schematic diagrams of the composite wear stages.
4 Conclusions
Ceramic particles reinforced HCCI matrix composites were successfully obtained, where the wear resistance of the composite was seven times higher than that of cast iron. The wear resistance of the composites with the transition layer was better than that without it.
HCCI and the transition layer completed metallurgical bonding through the diffusion and reaction of elements. The transition layer and the ceramic particles completed metallurgical bonding through the phases by merging together.
Funding source: National Natural Science Foundation of China
Award Identifier / Grant number: 51571103
Award Identifier / Grant number: 51501079
Funding statement: This work was supported by the National Natural Science Foundation of China (nos. 51571103, 51501079), the Yunnan Province Science Foundation for Youths (No. 2015FD009).
References
[1] Hutchings IM. Mater. Sci. Eng. A Struct. Mater. Proper. Microstruct. Process. 1994, 184, 185–195.10.1016/0921-5093(94)91031-6Search in Google Scholar
[2] Daniel BSS, Murthy VSR, Murty GS. J. Mater. Process. Technol. 1997, 68, 132–155.10.1016/S0924-0136(96)00020-9Search in Google Scholar
[3] Schlenther E, Özcoban H, Jelitto H, Faller M, Schneider GA, Graule T, Aneziris CG, Kuebler J. Mater. Sci. Eng. A 2014, 590, 132–139.10.1016/j.msea.2013.10.007Search in Google Scholar
[4] Ibrahim IA, Mohamed FA, Lavernia EJ. J. Mater. Sci. 1991, 26, 1137–1156.10.1007/BF00544448Search in Google Scholar
[5] Selvakumar S, Dinaharan I, Palanivel R, Ganesh Babu B. Mater. Sci. Eng. A 2017, 685, 317–326.10.1016/j.msea.2017.01.022Search in Google Scholar
[6] Prabhu TR, Varma VK, Vedantam S. Wear 2014, 309, 1–10.10.1016/j.wear.2013.10.006Search in Google Scholar
[7] Konopka K, Olszówka-Myalska A, Szafran M. Mater. Chem. Phys. 2003, 81, 329–332.10.1016/S0254-0584(02)00595-3Search in Google Scholar
[8] Zheng K, Gao Y, Tang S, Li Y, Ma S, Yi D, Zhang Z. Tribol. Lett. 2014, 54, 15–23.10.1007/s11249-014-0303-6Search in Google Scholar
[9] Zhang Z, Chen Y, Zhang Y, Gao K, Zuo L, Qi Y, Wei Y. J. Alloys Comp. 2017, 704, 260–268.10.1016/j.jallcom.2017.02.003Search in Google Scholar
[10] Zhou R, Jiang Y, Lu D. Wear 2003, 255, 134–138.10.1016/S0043-1648(03)00290-4Search in Google Scholar
[11] Li Z, Jiang Y, Zhou R, Lu D, Zhou R. Wear 2007, 262, 649–654.10.1016/j.wear.2006.07.009Search in Google Scholar
[12] Zheng K, Gao Y, Li Y, Zhao S, Wang J. Proc. Inst. Mech. Eng. J J. Eng. Tribol. 2013, 228, 3–10.10.1177/1350650113496700Search in Google Scholar
[13] Ru J, Jia Y, Jiang Y, Feng J, Zhou R, Hua Y, Wang D. Surf. Eng. 2017, 33, 353–361.10.1080/02670844.2016.1248119Search in Google Scholar
[14] Leon CA, Drew RAL. J. Mater. Sci. 2000, 35, 4763–4768.10.1023/A:1004860326071Search in Google Scholar
[15] Leon CA, Drew R. Compos. A Appl. Sci. Manufact. 2002, 33, 1429–1432.10.1016/S1359-835X(02)00161-6Search in Google Scholar
[16] Exare C, Kiat J-M, Guiblin N, Porcher F, Petricek V. J. Eur. Ceram. Soc. 2015, 35, 1273–1283.10.1016/j.jeurceramsoc.2014.10.031Search in Google Scholar
[17] Freim J, Mckittrick J. J. Am. Ceram. Soc. 2005, 81, 1773–1780.10.1111/j.1151-2916.1998.tb02547.xSearch in Google Scholar
[18] Chen J, Xie Z, Gui J, Wu W. Ceram. Int. 2016, 42, 17997–18003.10.1016/j.ceramint.2016.07.106Search in Google Scholar
[19] Pulgarin HLC, Albano MP. Ceram. Int. 2014, 40, 5289–5298.10.1016/j.ceramint.2013.10.102Search in Google Scholar
[20] Veit U, Rüssel C, Houet Y, Laurent D. Ceram. Int. 2015, 42, 5810–5822.10.1016/j.ceramint.2015.12.123Search in Google Scholar
[21] Partyka J, Sitarz M, Leśniak M, Gasek K, Jeleń P. Spectrochim. Acta A Mol. Biomol. Spectrosc. 2015, 134, 621–630.10.1016/j.saa.2014.06.068Search in Google Scholar PubMed
[22] Baasner A, Schmidt BC, Dupree R, Webb SL. Geochim. Cosmochim. Acta 2014, 132, 151–169.10.1016/j.gca.2014.01.041Search in Google Scholar
[23] Induja IJ, Surendran KP, Varma MR, Sebastian M. Ceram. Int. 2017, 43, 736–740.10.1016/j.ceramint.2016.10.002Search in Google Scholar
[24] Rosso M. J. Mater. Process. Technol. 2006, 175, 364–375.10.1016/j.jmatprotec.2005.04.038Search in Google Scholar
[25] Xiao Z, Tan F, Wang W, Lu H, Cai Y, Qiu X, Chen J, Qiao X. Ceram. Int. 2015, 41, 325–331.10.1016/j.ceramint.2014.08.075Search in Google Scholar
[26] Wang X. Appl. Surf. Sci. 2005, 252, 2021–2028.10.1016/j.apsusc.2005.03.171Search in Google Scholar
[27] Sharma A, Lee BK. Appl. Catal. A Gen. 2016, 523, 272–282.10.1016/j.apcata.2016.06.018Search in Google Scholar
[28] Moosavi-Khoonsari E, Jung IH. Metallurg. Mater. Trans. B 2016, 37, 1–19.Search in Google Scholar
[29] Donnelly E, Baker SP, Boskey AL, van der Meulen MCH. J. Biomed. Mater. Res. A 2006, 77, 426–435.10.1002/jbm.a.30633Search in Google Scholar PubMed PubMed Central
[30] Li Y, Gao Y. Wear 2010, 268, 511–518.10.1016/j.wear.2009.09.001Search in Google Scholar
©2018 Walter de Gruyter GmbH, Berlin/Boston
This article is distributed under the terms of the Creative Commons Attribution Non-Commercial License, which permits unrestricted non-commercial use, distribution, and reproduction in any medium, provided the original work is properly cited.
Articles in the same Issue
- Frontmatter
- Review
- Progress in the research and applications of natural fiber-reinforced polymer matrix composites
- Original articles
- Damage assessment of random multiwalled carbon nanotube-reinforced polymer nanocomposites
- A variational approach for predicting initiation of matrix cracking and induced delamination in symmetric composite laminates under in-plane loading
- Processing-structure-property correlations of in situ Al/TiB2 composites processed by aluminothermic reduction process
- Interface transition layer interaction mechanism for ZTAP/HCCI composites
- Mechanical and electrical properties of polylactic acid/carbon nanotube composites by rolling process
- Development of hydroxyapatite-polylactic acid composite bone fixation plate
- Dielectric and thermal properties of magnesium oxide/poly(aryl ether ketone) nanocomposites
- A sustainable approach to optimum utilization of used foundry sand in concrete
- Improving flame-retardant, thermal, and mechanical properties of an epoxy using halogen-free fillers
- Optimization of the PDMS/biochar nanocomposite membranes using the response surface methodology
- Preparation and characterization of low-cost high-performance mullite-quartz ceramic proppants for coal bed methane wells
- Experimental investigation and analysis on the wear properties of glass fiber and CNT reinforced hybrid polymer composites
- Preparation of polyaniline-polyvinyl alcohol-silver nanocomposite and characterization of its mechanical and antibacterial properties
- An effective approach to synthesize carbon nanotube-reinforced Al matrix composite precursor
- Effect of oxygen plasma treatment on tensile strength of date palm fibers and their interfacial adhesion with epoxy matrix
- A novel characterization method of fiber reinforced polymers with clustered microstructures for time dependent mass transfer
- Stress relaxation behavior of annealed aluminum-carbon nanotube composite
- Restrained shrinkage cracking of self-consolidating concrete roads
- The effective ellipsoid: a method for calculating the permittivity of composites with multilayer ellipsoids