Controlled Functionalization of Graphene by Oxo-addends
-
Siegfried Eigler
 and
Andreas Hirsch
and
Andreas Hirsch

Abstract
The single carbon layer graphene and especially its oxidized derivatives, such as graphene oxide (GO), are in the focus of research that started already 150 years ago [1–6]. GO is a collective term for various single layers of graphene (with lattice defects) functionalized by oxo-addends. The type of oxo-groups is not defined, but epoxy and hydroxyl groups dominate the structure in addition to in-plane lattice defects on the percent scale. Those defects are rarely considered in chemical functionalization approaches and it is impossible to distinguish between functionalization of surface oxo-groups and in-plane oxo-groups.
This chapter focuses on functionalized derivatives of graphene with an almost intact carbon framework, termed “oxo-functionalized graphene” (oxo-G1, index indicates the number of layers). Avoiding in-plane defects further allows the development of a controlled chemistry of graphene with oxo-addends. However, general approaches of conventional GO chemistry are summarized in a separate section.
1 Introduction
Graphene is currently receiving tremendous attention as a new nanomaterial with high potential for future electronic, optical and sensor applications. This interest is based on a number of unprecedented properties, such as high electron mobility, electrical conductivity, transparency, flexibility and mechanical and chemical stability. Actually, graphene exists only on the surface. In order to take advantage of this exceptional profile of combinations it is of upmost importance to tune the solubility and processibilty of graphene and at the same time to explore methods for the mass production of graphene-based materials.
This is where wet-chemical functionalization and derivatization come into play. One of the oldest modifications of graphene is graphene oxide (GO). GO is produced by the oxidation of graphite. The resulting graphite oxide is very soluble in water and can be easily exfoliated to monolayer GO. One of the disadvantages of GO in the past was the ill-defined structure including impossible-to-heal σ-defects such as holes in the carbon-lattice plane. As a consequence, the challenge arose to create, isolate and characterize GO that does not contain σ-defects but only covalently bound oxo-functionalities. Such a material would combine the advantage of high solubility with the structural integrity of graphene, provided it can be defunctionalized to the parent two-dimensional carbon allotrope. The scope of this review is to introduce the field of oxo-functionalized graphene (oxo-G1).
First a historical overview on graphite oxide and GO will be provided in Section 1. It will be demonstrated that they indeed constitute a rather old class of materials. A number of preparation methods will be discussed.
Section 2 is devoted to the structural characterization of GO. It will be outlined that normal GO is a polydisperse material that next to covalently bound oxo-functionalities also contains holes in the basal carbon lattice.
For a systematic study of the structure of GO suitable descriptors taking into account the number of layers, the substrate serving as support and the defect density are required. Such a rational nomenclature is pointed out in Section 4.
Section 5 is devoted to the oxo-functionalization of graphene. Particular emphasis is given to the recently accomplished preparation of graphite oxide and GO that is characterized by a very small amount of σ-defects. Moreover, the important role of intermediate organosulfates during the overall production process is explained.
In Section 6 analytical methods for the structural characterization are described. It is demonstrated that Raman spectroscopy, in particular statistical Raman spectroscopy, is the most important workhorse in this field.
The covalent and non-covalent chemistry of GO is summarized in Section 7. This includes binding of DNA, polymers, inorganic nanoparticles and small organic molecules. Also first approaches to C–C bond formations are discussed.
Section 8 is devoted to the controlled oxo-functionalization of graphene and also the most recently discovered wet-chemical back of GO reduction to high-quality graphene. In this regard the analysis of the stability of oxo-G1 is outlined in detail. In order to screen the suitability of GO for practical applications such as floating gate memory devices, concepts for the synthetic modifications are also described.
This chapter shows that GO chemistry not only has enormous potential for the development of new high-performance materials but also provides insights to unprecedented chemical processes at the interface of solution and solid state chemistry.
2 History of GO and Graphite Oxide
Converting black graphite by oxidation was found to lead to yellow graphite oxide, also termed “graphitic acid,” and research started already in 1840 [5, 7, 8]. The structure of the yellow compound was unexplored. Synthetic procedures developed with time and more effective procedures were described. Kohlschütter and Haenni summarized in 1919 many aspects of the chemistry of graphite oxide that had been repeated in recent years [9].
In 1855 Brodie synthesized graphite oxide in nitric acid with potassium chlorate as oxidant [10–14]. Several oxidation steps were, however, necessary and Gottschalk, Berthold and Luzi determined many graphite oxide properties [15–18]. Staudenmaier found a two-step synthesis to graphite oxide; however, he also recognized that graphite oxide is similar to humic acids and not a defined compound [19–21]. Charpy published in 1909 a one-step synthesis for graphite oxide in sulfuric acid with potassium permanganate as oxidant [22]. Hummers and Offeman published a scalable method later in the 1950s and the protocol is most often termed “Hummers method” [23].
The properties of graphite oxide were explored in the 1960s by Hofmann, Fischer, Clauss, Eckel, Boehm and Scholz [6, 24–29], and Boehm published the laboratory curiosity of GO recently; especially the reduction product was described as a single layer of carbon [4]. Boehm also compared differently prepared graphite oxide and compared some properties [28]. The yield of graphite oxide and GO production can be improved by a pretreatment of graphite persulfate and phosphorus pentoxide [30]. In addition, phosphoric acid was claimed to improve the quality of GO [31].
3 Structure of GO
The structure of GO depends on the preparation conditions and can only be described in a generalized way. A molecular formula must be determined for each preparation batch. It should be clear that every sp3-carbon of GO is a stereo center and molecular-like defined material can therefore not be expected. Graphite with a honeycomb network of C-atoms is used as starting material. During GO synthesis over-oxidation and thus formation of CO2 are not avoided and that process leads to GO. As outlined later avoiding the over-oxidation keeps the carbon framework intact and thus oxo-G1 is yielded. Most accepted is the structure model introduced by Lerf and Klinowski, termed “Lerf– Klinowski model.” Nuclear magnetic resonance spectroscopy was used to clarify that structure [32–35]. Layers of graphite are oxidized by the oxidant and oxo-functional groups are introduced. Approximately 50% of C-atoms remain sp2-carbon-forming islands that increase with time. Thus, the structure of GO is metastable and changes somewhat with time [36]. High-resolution transmission microscopy images at atomic resolution display preserved regions of ordered structures, but only with 1 nm diameter. About 80% of regions are disordered that were correlated to functionalized regions [37]. In addition, nanometer-sized holes were identified.
Epoxy and hydroxyl groups decorate both sides of the basal plane as major functional groups. Ketones and carboxyl groups are also introduced by over-oxidation. Those groups are formed by breaking C–C bonds and decorate edges of defects and flakes. In addition, in-plane hydroxyl groups must be considered as a structure motive [38–40]. Other species, such as unpaired spins, have been reported [41, 42], as well as endoperoxide groups. The latter were found as a source of toxicity toward cells [43]. Other structure models have been proposed by Dékány et al. [44], Nakajima–Matsuo [45], Hofmann [46], Ruess [47], Scholz–Boehm [48] and others (Figure 1), and all of those may be valid, depending on the preparation conditions [38].
![Figure 1: Proposed structure models of GO. Reproduced from Ref. [49] with permission from The Royal Society of Chemistry. The Hofmann model can be expected to be realized by exposure of graphene to oxygen atoms (scanning tunneling microscopy image with oxygen atoms covalently bound to graphene). Reprinted with permission from Macmillan Publishers Ltd: Nature Chemistry [50]. Copyright 2012.](/document/doi/10.1515/psr-2016-0106/asset/graphic/j_psr-2016-0106_fig_001.jpg)
Proposed structure models of GO. Reproduced from Ref. [49] with permission from The Royal Society of Chemistry. The Hofmann model can be expected to be realized by exposure of graphene to oxygen atoms (scanning tunneling microscopy image with oxygen atoms covalently bound to graphene). Reprinted with permission from Macmillan Publishers Ltd: Nature Chemistry [50]. Copyright 2012.
3.1 Considerations about the Structure of GO
It can be concluded that GO implies a partially amorphous structure of in-plane defects and observation that were already made more than 100 years earlier [21]. Currently the formation mechanisms of GO is still under investigation [51]. It can be assumed that different applications may need a type of GO with structure defects and others work best with an intact carbon framework. However, developing a structure function relation requires controlling the structure of GO and thus, reliable analysis of the product is required to enable a controlled synthesis [52].
Metal impurities in GO were quantified by inductively coupled plasma mass spectrometry (MS). Iron, cobalt, nickel and manganese were found as residues from natural graphite and used reagents. Iron concentrations >1,000 ppm were found and other metals were detected in concentrations between roughly 5 and 20 ppm. Although these concentrations are low, catalytic effect may be due to metal impurities [53]. Contaminations may also stem from the aqueous work-up process, e.g., a functionalizing work-up procedure with dodecyl amine was recently introduced [54].
4 Nomenclature of Functionalized Graphene
Polydisperse materials, such as graphene and functionalized graphene prepared from graphite, are difficult to describe and therefore a systematic formula was introduced (eq. (1)) [55, 56].
Equation (1) is a generalized systematic formula to characterize graphene and functionalized graphene. Here, S: substrate; s: size of graphene; d: structural defect density of graphene within the carbon framework; G: graphene; n: number of layers of graphene; R: addend; f: degree of functionalization; A: non-covalently bound molecules; no S: reactions applied in dispersion.
The number of layers of graphene is indicated by the index n and G1 relates to graphene, G2 to bilayer graphene, G3 to trilayer graphene and Gfew-layer or G4–10 to few-layer graphene. Graphite can be described as (Gn). Graphene on substrates, such as SiO2, is indicated as SiO2/G1 or on BN (boron nitride) as BN/G1. The size of flakes can be determined by atomic force microscopy (AFM) or directly from solution by analytical ultracentrifugation [57]. Graphene with a size of flakes of about 5 μm on a SiO2 surface can be described as SiO2/5μmG1.
The density of defects can be determined by Raman spectroscopy [58]. This means, 0.1%G1 relates to one defect on 1,000 C-atoms. Structural defects can be missing or rearranged carbon atoms or sp3-hybridized C-centers [59]. Other analytical tools are, however, necessary to distinguish these.
The regiochemistry of addends is currently not indicated and difficult to determine. Hydroxyl functionalization of graphene with every 20th C-atom functionalized would be indicated as G1-(OH)5%. Adsorbed solvents, such as N-methyl pyrrolidone (NMP), are given in mass %, e.g., few-layer graphene with 30% of adsorbed NMP is indicated as Gfew-layer/NMP30%.
5 Oxo-Functionalized Graphene
Graphene and oxide, as the name GO implies, would relate to the Hofmann model (Figure 1) [50]. Wet-chemistry, however, yields GO with a structure including manifold structure defects. Developing the chemistry of graphene with oxo-addends requires, however, an intact carbon framework. The analysis of defects in the carbon framework is therefore necessary and the formation of defects must be already avoided during oxidative functionalization. Two different approaches to oxo-G1 derivatives are introduced in the following sections.
5.1 Oxo-G1 from Graphite
Oxo-G1 with an almost intact σ-framework of C-atoms was published recently [60]. The reaction sequence to oxo-G1 is illustrated in Figure 2. Although potassium permanganate is used as oxidant, as described by Charpy in 1909 [22], the formation of permanent defects is largely avoided, maintaining the local temperature below 10°C, and also during aqueous work-up. Delamination of graphite oxide to oxo-G1 proceeds in water and can be enhanced by sonication. Raman spectroscopy indicates a density of defects that is as low as 0.01% for the best quality of chemically reduced flakes. In oxo-G1 every second carbon atom is sp3-hybridized and functional groups are located on both sides of the basal plane. Functional groups at edges of flakes play a minor role. Thus, oxo-G1 is a suitable precursor for wet-chemically synthesized graphene and for the development of a controlled chemistry.
![Figure 2: (a) Synthesis of GO with an almost intact carbon framework (oxo-G1) and graphene, starting from graphite in sulfuric acid with potassium permanganate as the oxidant [56]. With permission from Wiley-VCH Verlag GmbH & Co. Copyright 2014, (b) reflected light microscope image of natural graphite (flake size: 600 µm), (c) aqueous dispersion of oxo-G1 at 0.1 mg/ml, (d) scanning electron microscope image of graphene on Si/SiO2 and Raman spectra of (e) graphite, (f) oxo-G1 and (g) a flake of graphene obtained from oxo-G1 by chemical reduction [60]. With permission from Wiley-VCH Verlag GmbH & Co. Copyright 2013.](/document/doi/10.1515/psr-2016-0106/asset/graphic/j_psr-2016-0106_fig_002.jpg)
(a) Synthesis of GO with an almost intact carbon framework (oxo-G1) and graphene, starting from graphite in sulfuric acid with potassium permanganate as the oxidant [56]. With permission from Wiley-VCH Verlag GmbH & Co. Copyright 2014, (b) reflected light microscope image of natural graphite (flake size: 600 µm), (c) aqueous dispersion of oxo-G1 at 0.1 mg/ml, (d) scanning electron microscope image of graphene on Si/SiO2 and Raman spectra of (e) graphite, (f) oxo-G1 and (g) a flake of graphene obtained from oxo-G1 by chemical reduction [60]. With permission from Wiley-VCH Verlag GmbH & Co. Copyright 2013.
After deposition of oxo-G1 flakes onto Si/SiO2 wafers, chemical reduction to graphene was conducted. The measurement of magnetoresistance and Hall effect in magnetic fields up to 14 T, at a temperature of 1.6 K, proved the graphene-like nature. Charge carriers are hole-like (charge carrier density n = 1.6 × 1012 cm–2). The measured mobility values exceed 1,000 cm²/Vs. Furthermore, Shubnikov–de Haas (SdH) oscillations were observed and the Landau-level indices analysis confirmed the presence of SdH oscillations. They depend linearly on the inverse magnetic field as expected for SdH oscillations. The frequency of the oscillations plotted vs. the charge carrier density revealed the linear dependence due to the linear density of states. This observation is only expected for 2D graphene. An average quality of wet-chemically prepared graphene bears about 0.3% of defects but still provides mobility values of about 250 cm²/Vs. The residual defects are expected to be mainly point defects, since attempts to heal the defect by chemical vapor deposition process increased LD values up to 18 nm [61].
5.2 Oxo-G1 from Graphite Sulfate
Graphite sulfate, an acceptor-type intercalation compound, was described and investigated by Rüdorff and Hofmann in 1938. They found an idealized formula of C24(HSO4)·2H2SO4 (Figure 3(a)) [62]. Graphite sulfate is also an intermediate during the oxidation of graphite in sulfuric acid using permanganate as oxidant. Graphite sulfate can, however, be functionalized by hydroxyl groups and reverted back to graphene [63]. The positively charged C24 subunit can be reacted with water, leading to the formation of hydroxyl groups (Figure 3(a)). Single layers of oxo-G1 can subsequently be isolated, and an AFM image is shown in Figure 3(b).
![Figure 3: (a) Synthesis of graphene and few-layer graphene from graphite sulfate, followed by the reaction with water to yield oxo-G1 and graphene after reduction, (b) AFM image, UV-vis spectrum and Raman spectrum of oxo-G1, (c) TGA of oxo-G1 coupled with MS, (d) statistical Raman analysis of a film of graphene flakes (inset: histogram of Γ2D), (e) AFM image of graphene derived from G1-(OH)4%, (f) Raman spectrum of graphene obtained from G1-(OH)4% after reduction; ΓD, ΓG and Γ2D given in italic numbers [63].](/document/doi/10.1515/psr-2016-0106/asset/graphic/j_psr-2016-0106_fig_003.jpg)
(a) Synthesis of graphene and few-layer graphene from graphite sulfate, followed by the reaction with water to yield oxo-G1 and graphene after reduction, (b) AFM image, UV-vis spectrum and Raman spectrum of oxo-G1, (c) TGA of oxo-G1 coupled with MS, (d) statistical Raman analysis of a film of graphene flakes (inset: histogram of Γ2D), (e) AFM image of graphene derived from G1-(OH)4%, (f) Raman spectrum of graphene obtained from G1-(OH)4% after reduction; ΓD, ΓG and Γ2D given in italic numbers [63].
Raman spectra indicate by the broad D, G and 2D peaks a degree of chemical functionalization >3%, and thermogravimetric analysis (TGA) coupled with MS of oxo-G1 reveals water as the major cleaved compound (Figure 3(c)). Elemental bulk analysis reveals finally an idealized formula of C24(OH)·2H2O. Thus, it seems likely that C24+ reacts with water, forming a hydroxyl group on the graphene subunit. The degree of functionalization of this oxo-G1 is about 4% and indicated as G1-(OH)4%. However, since bulk analysis was conducted including few-layers the degree of pure single layers may differ to some extent. Flakes of G1 on SiO2 (SiO2/G1) can be obtained after reduction using vapor of hydriodic acid (HI) and trifluoroacetic acid (TFA). That reduction method quantitatively removes oxo-functional groups from the carbon lattice [64]. Raman analysis reveals that graphene with a density of defects of approximately 0.04% is obtained (Figure 3(d), SiO2/0.04%G1). Therefore, the defect density was assumably only 0.04% in oxo-G1 (0.04%G1-(OH)4%) and all individual Raman spectra of single layers of graphene show a sharp 2D peak (Γ2D = 33 cm–1, Figure 3(d) and (f)) [63].
5.3 Organosulfate in Oxo-G1 and GO
Oxidation of graphite in sulfuric acid introduces oxo-groups, such as epoxy groups that can form sulfate esters and organosulfate. Boehm and Scholz suggested in 1966 that some of the sulfur content may be due to sulfonic acids or sulfate esters [28]. TGA found an answer to that question by coupling with MS. Organosulfate groups (sulfate esters) were identified for GO and oxo-G1 as structure motif, indicated by a weight-loss step at 200–300°C [65]. No sulfonic acids were found. The formation of organosulfate and partial and full hydrolysis is depicted in Figure 4(a) [66]. The organosulfate groups can be used to explain the acidity of oxo-G1 and molecular architectures can be synthesized based on those groups, as shown in an example at the end of this chapter.
![Figure 4: (a) Proposed formation of cyclic organosulfate groups in GO and hydrolytic cleavage to organosulfate groups and hydroxyl groups. Acid-catalyzed epoxide formation of cis-dihydroxy groups can be assumed [49, 66]. The structure of GO therefore bears epoxy, hydroxyl and organosulfate groups as major functional groups. Defects in GO are omitted and the structure model is also valid for oxo-G1 [65], (b) TGA: left – GO; middle – GO treated with sodium hydroxide to cleave organosulfate groups; and right – GO treated with sodium hydroxide and mixed with sodium hydrogen sulfate [65]. With permission from Wiley-VCH Verlag GmbH & Co. Copyright 2013.](/document/doi/10.1515/psr-2016-0106/asset/graphic/j_psr-2016-0106_fig_004.jpg)
(a) Proposed formation of cyclic organosulfate groups in GO and hydrolytic cleavage to organosulfate groups and hydroxyl groups. Acid-catalyzed epoxide formation of cis-dihydroxy groups can be assumed [49, 66]. The structure of GO therefore bears epoxy, hydroxyl and organosulfate groups as major functional groups. Defects in GO are omitted and the structure model is also valid for oxo-G1 [65], (b) TGA: left – GO; middle – GO treated with sodium hydroxide to cleave organosulfate groups; and right – GO treated with sodium hydroxide and mixed with sodium hydrogen sulfate [65]. With permission from Wiley-VCH Verlag GmbH & Co. Copyright 2013.
6 Raman Spectroscopy of Graphene, GO and Oxo-G1
Raman spectroscopy became a characterization tool for probing the integrity of the graphene framework. Defects can be detected at concentrations between roughly 0.001% and 3%. Raman spectroscopy therefore helps in developing the controlled oxo-functionalization of graphene, because reaction conditions can be found that preserve the carbon framework. Raman spectroscopy of graphene and also the impact of defects are introduced and statistical Raman spectroscopy (SRS) and microscopy are explained, allowing a reliable characterization of prepared samples.
6.1 Raman Spectra of Graphene
Raman spectra of graphene have been published in 2006 [67]. The shape of the spectra differs from that of few Gfew-layer, reduced GO (rGO) and graphite [68]. Typically, a laser-excitation wavelength at 532 nm is used [69]. Raman spectroscopy on graphene gives information about stress and strain, the doping level and others. The interpretation of Raman spectra has been developed in recent years [70–73]. Typical Raman spectra of graphene are depicted in Figure 5(a). The physical origin of the Raman bands can be explained by the electronic structure of graphene and can be found in the literature, as well as information about Raman spectra of bilayer and few-layer graphene [58, 70–73]. Two major peaks at a Raman shift of about 1,580 cm–1 (G peak) and 2,700 cm–1 (2D peak) are found for graphene. The D peak at about 1,340 cm–1 needs activation by a defect, while the 2D peak at about 2,700 cm–1 is the corresponding overtone and needs no defect activation because of momentum conservation. The position of the D peak is dispersive due to the interaction of phonons and electrons. Its shift varies with excitation wavelength between roughly 1,310 cm–1 if excited by a red laser and 1,400 cm–1 if excited by a UV laser.
![Figure 5: (a) Raman spectra of graphene with a variable amount of defects between 0.005% and 0.77%. Reprinted with permission from Ref. [69]. Copyright (2011) American Chemical Society. (b) The ID/IG data vs. the average distance LD between defects. Defects generated by Ar+ ion bombardment. (c) Activated region ra (large radius) and disordered region rs (small region). (d) Scanning tunneling microscope images (HOPG) highly ordered pyrolytic graphite sample subjected to Ar+ ion bombardment (ion doses 1011 (1), 1012 (2), 1013 (3) and 1014 (4) Ar+ ions per cm2). Reprinted from Ref. [74]. Copyright 2010. With permission from Elsevier.](/document/doi/10.1515/psr-2016-0106/asset/graphic/j_psr-2016-0106_fig_005.jpg)
(a) Raman spectra of graphene with a variable amount of defects between 0.005% and 0.77%. Reprinted with permission from Ref. [69]. Copyright (2011) American Chemical Society. (b) The ID/IG data vs. the average distance LD between defects. Defects generated by Ar+ ion bombardment. (c) Activated region ra (large radius) and disordered region rs (small region). (d) Scanning tunneling microscope images (HOPG) highly ordered pyrolytic graphite sample subjected to Ar+ ion bombardment (ion doses 1011 (1), 1012 (2), 1013 (3) and 1014 (4) Ar+ ions per cm2). Reprinted from Ref. [74]. Copyright 2010. With permission from Elsevier.
6.2 Raman Spectra of Graphene with Defects
Introducing defects into graphene leads to an evolving D peak and line broadening for all peaks (Figure 5(b)) [74]. The nature of defects can be any type of in-plane disorder, e.g., missing atoms or sp3-carbon introduced by chemical functionalization [59, 75].
The evolution of Raman spectra was studied with Ar+ ion bombardment on perfect graphene [74]. The intensity ratio of the D peak and the G peak (ID/IG) is plotted for increasing the distance of defects in Figure 5(b). The graph follows a relation. The maximum is at LD = 3 nm. The full-width at half-maximum (Γ) of the peaks needs to be taken into account to discriminate, e.g., between LD = 2 nm and LD = 6 nm, respectively. In general, sharp peaks relate to higher LD values and broad peaks to lower LD values [69].
One carbon atom fills an area of 0.026195 nm2 and the area between defects (AD) can be calculated according to eq. (2), assuming an ideal hexagonal packing of defects. The number of C-atoms (N) within this area can be calculated by eq. (3) (LD in nm) [59].
6.3 Raman Spectra of GO, rGO, Oxo-G1 and Related Graphene
Raman spectra of GO bear broad peaks, and the D peak and G peak are the major ones. The Γ value of the D peak is roughly 100 cm–1 (Figure 6). With reduction of GO the Γ values do almost not change, although the electrical conductivity increases by orders of magnitude [76, 77]. Moreover, the 2D peak, typical for graphene, does not evolve. It is well known that rGO bears extended amounts of lattice defects of approximately >5% and thus Raman spectroscopy is not sensitive at such high defect concentrations.
![Figure 6: (a) Raman spectra of a monolayer of GO and rGO, compared to mechanically exfoliated graphene measured on a substrate of Si/SiO2, normalized to the G-peak intensity. The ID/IG ratio of GO and rGO remains almost constant. Reproduced with permission from Ref. [76]. Copyright (2008) American Chemical Society. (b) Raman spectra of oxo-G1 with a degree of functionalization of about 4% and 50%, respectively (Γ values are given in italic numbers) [63]. (c) Raman spectra of GO and rGO. The ID/IG ratio increases slightly, which indicates a minimal increase of quality. Reprinted from Ref. [78]. Copyright 2012. With permission from Elsevier.](/document/doi/10.1515/psr-2016-0106/asset/graphic/j_psr-2016-0106_fig_006.jpg)
(a) Raman spectra of a monolayer of GO and rGO, compared to mechanically exfoliated graphene measured on a substrate of Si/SiO2, normalized to the G-peak intensity. The ID/IG ratio of GO and rGO remains almost constant. Reproduced with permission from Ref. [76]. Copyright (2008) American Chemical Society. (b) Raman spectra of oxo-G1 with a degree of functionalization of about 4% and 50%, respectively (Γ values are given in italic numbers) [63]. (c) Raman spectra of GO and rGO. The ID/IG ratio increases slightly, which indicates a minimal increase of quality. Reprinted from Ref. [78]. Copyright 2012. With permission from Elsevier.
Raman spectra are not expected to change at densities of defects between 4% and 50%. In Figure 6(b) Raman spectra of two differently oxidized layers of G1 are displayed with peaks characterized by ΓD = 81 cm–1, ΓG = 61 cm–1 and Γ2D = 209 cm–1 for G1-(OH)4% (black line) [63]. The Raman spectrum of G1-(OH)4 % is superimposed to oxo-G1 with about 50% of sp3-carbon atoms [78]. The values of ΓD = 120 cm–1, ΓG = 78 cm–1 and Γ2D = 273 cm–1 are about 30%–50% larger for GO compared to G1-(OH)4%. However, up to now, there is no reliable correlation of such broad peaks to the degree of functionalization elaborated.
With reduction of oxo-G1 permanent defect can be detected by Raman spectroscopy and the heterogeneity of samples becomes visible. The density of defects is between 0.03% and 1%, as depicted in Figure 7 [79]. The model of Lucchese and Cançado is used to determine the concentration of defects [79].
![Figure 7: (a) Left: Illustration of the chemical structure of GO with structural defects on the %-scale. After chemical reduction, defects can be probed by Raman spectroscopy. Functional groups at defect sites are omitted for clarity. Right: oxo-G1 with an intact carbon framework can be chemically reduced to intact graphene [56]. With permission from Wiley-VCH Verlag GmbH & Co. Copyright 2014. (b) Raman spectra of graphene from oxo-G1 with a variable amount of defects between 0.03% and 1%. ΓD, ΓG and Γ2D values are given in italic numbers. Reprinted with permission from Ref. [79]. Copyright (2014) American Chemical Society.](/document/doi/10.1515/psr-2016-0106/asset/graphic/j_psr-2016-0106_fig_007.jpg)
(a) Left: Illustration of the chemical structure of GO with structural defects on the %-scale. After chemical reduction, defects can be probed by Raman spectroscopy. Functional groups at defect sites are omitted for clarity. Right: oxo-G1 with an intact carbon framework can be chemically reduced to intact graphene [56]. With permission from Wiley-VCH Verlag GmbH & Co. Copyright 2014. (b) Raman spectra of graphene from oxo-G1 with a variable amount of defects between 0.03% and 1%. ΓD, ΓG and Γ2D values are given in italic numbers. Reprinted with permission from Ref. [79]. Copyright (2014) American Chemical Society.
6.4 SRS and Microscopy
The reduction of flakes of oxo-G1 leads to graphene with a heterogeneous quality that can be determined by scanning Raman microscopy (SRM) and analyzed by SRS (Figure 7). This allows reliably determining the quality of the carbon framework of graphene and oxo-G1 of a whole sample. The D, G and 2D peaks can be fitted by Lorentz functions and the intensity of the peaks and the Γ values can be determined. These parameters can not only be determined for many spectra out of a scanned area [79].
A histogram of the IG values (Figure 8(a)) lets discriminating between the substrate, edges of flakes, graphene and Gfew-layer. A plot of IG vs. ΓG lets identifying the IG values that relate to graphene. The ΓG values <30 cm–1 relate to graphene with a density of defects about <0.3% (Figure 8(b)). Such values are not expected for G2 and Gfew-layer. The statistical information can be used for color-coding x–y maps as shown in Figure 8(c).
![Figure 8: (a) Histogram of IG illustrates the discrimination between G1, Gfew-layer and edges. (b) plot of IG vs. ΓG; edges (bottom region), G1 (middle region) and Gfew-layer (upper region). (c) SRM image of a film of graphene generated from oxo-G1 superimposed with the corresponding AFM image [79]. Reprinted with permission from Ref. [79]. Copyright (2014) American Chemical Society.](/document/doi/10.1515/psr-2016-0106/asset/graphic/j_psr-2016-0106_fig_008.jpg)
(a) Histogram of IG illustrates the discrimination between G1, Gfew-layer and edges. (b) plot of IG vs. ΓG; edges (bottom region), G1 (middle region) and Gfew-layer (upper region). (c) SRM image of a film of graphene generated from oxo-G1 superimposed with the corresponding AFM image [79]. Reprinted with permission from Ref. [79]. Copyright (2014) American Chemical Society.
SRS and SRM are powerful tools to visualize the quality of graphene films (Figure 8(c), overlaid with AFM image). Moreover, the statistical approach can be used to determine reliable information about changes of the quality of the carbon framework of oxo-G1 upon processing. Therefore, SRM and SRS are essential tools, developing the controlled chemistry of oxo-G1.
7 Conventional Chemistry of GO
General approaches to functionalize GO are briefly summarized in this section. Further insights into the chemistry of GO and its functionalization protocols can be found in comprehensive review articles [7, 37, 56, 80–83]. The functionalization approaches of rGO are given in recent review articles [56, 84].
7.1 Non-Covalent and Covalent Approaches
Non-covalent and covalent functionalization principles were exploited to functionalize GO. The residual π-system of GO interacts with π-conjugated molecules non-covalently (Figure 9). Also polar interactions, such as hydrogen bonding, can be exploited to adsorb molecules on GO, such as water in the simplest case. In accordance with these concepts, fluorescent dye-labeled single strand DNA (ssDNA) interacts with GO by polar and π-interactions which leads to the quenching of fluorescence. It could be observed that the fluorescence is restored upon addition of a complementary target, because of the stronger target–ssDNA interaction compared to ssDNA–GO interaction (Figure 9) [85].
![Figure 9: Non-covalent approaches to functionalized GO with π-interactions or polar interactions. Example of ssDNA conjugated with a fluorophor (FL, quenched) adsorbed on GO exploiting polar and π-interactions. Complementary target leads to desorption and restores fluorescence [85].](/document/doi/10.1515/psr-2016-0106/asset/graphic/j_psr-2016-0106_fig_009.jpg)
Non-covalent approaches to functionalized GO with π-interactions or polar interactions. Example of ssDNA conjugated with a fluorophor (FL, quenched) adsorbed on GO exploiting polar and π-interactions. Complementary target leads to desorption and restores fluorescence [85].
In another approach a dispersion of GO was first non-covalently stabilized by the polymer poly(diallyldimethylammonium chloride) (PDDA) and subsequent chemical reduction of the composite with sodium borohydride led to a stable dispersion of rGO/PDDA [86]. The interaction of the polymer with GO and rGO, respectively, yields the stable dispersion of single layers of rGO. RGO would have formed a precipitate without the stabilizing polymer. It can be assumed that the interactions of GO and PDDA are polar interactions of oxo-functional groups of GO with the cationic groups of PDDA. After reduction, the interaction of rGO and PDDA is due to van-der-Waals interactions and in part polar groups located at edges of defects that are responsible for polar interactions (Figure 10).
![Figure 10: Non-covalent polar interaction of PDDA with GO as stabilizing agent, followed by deoxygenation with NaBH4 to yield stabilized rGO [86].](/document/doi/10.1515/psr-2016-0106/asset/graphic/j_psr-2016-0106_fig_010.jpg)
Non-covalent polar interaction of PDDA with GO as stabilizing agent, followed by deoxygenation with NaBH4 to yield stabilized rGO [86].
Moreover, it was reported that hydroxyl groups of GO sheets can be cross-linked by condensation with benzene-1,4-diboronic acid forming boronic esters. This approach yields a porous network that is attractive for gas adsorption [87, 88]. Furthermore, organic isocyanates were used for functionalization [89].
Porous materials are of significant importance for applications, such as for charge storage or adsorption materials. Aerogels can be synthesized by various methods and those approaches are summarized in the recent literature [87, 88, 90, 91]. Moreover, ketones, which are functional groups of edges of flakes and edges of defect sites, were found to be reducible by zinc and an acid-forming C–H bonds [92]. Deuterium labeling leads to the conclusion that nascent hydrogen reduces functional groups on both sides of the carbon lattice. In contrast, the direct contact of ketones with zinc leads to the formation of C–H bonds. It can be assumed that selective engineering of functional groups at defect sites, e.g., by exchanging polar ketones to alkyl bonds, can modulate properties of rGO.
There are efforts to selectively react functional groups of GO. It was found that epoxy groups that are located at the basal plane are preferably reduced using a combination of In/InCl [93]. The π-system of GO can be increased by such a method and the residual functional groups make the product dispersible in solvents. However, the deoxygenation is also in part accompanied by the cleavage of hydroxyl groups and also metal impurities may be introduced. The direct reaction of amines with graphite oxide and GO, respectively, was also reported and this approach leads to partially reduced and functionalized materials [94, 95]. Although the products are dispersible in organic solvents, such as tetrahydrofuran, and although they can be mixed with polymers, the type of binding of amines to GO can only be assumed and functionalized polar edges of defect sites may play a crucial role. It can be expected that ketones at edges form hydrazones. Following this approach, stearyl amine-treated GO was incorporated in composite materials with styrene [96].
Ethylene diamine and GO can also react with each other and form partially reduced GO as a hydrogel. Freeze-drying yields a porous and solvent-free material that can be further processed by microwave irradiation to form a hydrogel with a density of only 3 mg/cm3. The hydrogel has the ability to fully recover the volume after 90% of compression. Several review articles summarize approaches to functionalized and dispersible GO and rGO [37, 49, 97–99]. As described in the latter example, those materials provide distinct properties compared to as-synthesized GO.
Also nanoparticles (NPs) can be formed and deposited onto the sheets of GO and rGO, respectively, to form metal–graphene composites [100]. In a typical approach to composites, GO is dispersed in ethylene glycol together with, e.g., H2PtCl6 or RuCl3 and after heating the mixture at 130°C the product is isolated and tested in applications. The electrocatalytic activity of those composites is beneficial for methanol or ethanol oxidation [100]. The NPs have typically a diameter less than 10 nm. Along these lines, the binding of Fe ions with GO was facilitated to prepare magnetic Fe3O4 particles that are bound to GO using NH4OH to prepare the rGO hybrid (Figure 11) [101]. Those dispersed GO/NP materials can be attracted by a magnet, as illustrated in Figure 11(c). However, crucial questions about the binding and growth mechanism of particles arise. The interaction between rGO and the metal particle remains uncertain. The particles may be non-covalently bound or alternatively a metal–carbon bond may be formed. Residual oxygen moieties of rGO can also form metal–O–C bonds. It can be assumed that defects play a crucial role in those wet-chemical approaches to anchor NPs or to limit the NP growth.
![Figure 11: (a) GO functionalized with NPs. For instance, magnetic Fe3O4 NPs are prepared by redox reaction. Fe2+ ions are adsorbed on GO and the NPs are formed in the presence of NH4OH at pH = 9. (b) dispersion of GO. (c) image of the dispersion after redox reaction. Reproduced from Ref. [101] with permission of The Royal Society of Chemistry.](/document/doi/10.1515/psr-2016-0106/asset/graphic/j_psr-2016-0106_fig_011.jpg)
(a) GO functionalized with NPs. For instance, magnetic Fe3O4 NPs are prepared by redox reaction. Fe2+ ions are adsorbed on GO and the NPs are formed in the presence of NH4OH at pH = 9. (b) dispersion of GO. (c) image of the dispersion after redox reaction. Reproduced from Ref. [101] with permission of The Royal Society of Chemistry.
Edge groups, such as ketones or carboxyl groups of GO, can be used for functionalization reactions [49, 102]. Most chemical functionalization approaches use protocols suitable for reactions with carboxyl groups that are activated and subsequently converted to esters or amides [103–105]. Activation agents for carboxylic acids, such as SOCl2 or carbodiimides, were reported. Especially the reaction of SOCl2 with alcohols, forming eventually instable C–Cl bonds on the surface according to the SNi mechanism, may be a concurrent reaction that cannot be ruled out in most approaches (Figure 12).
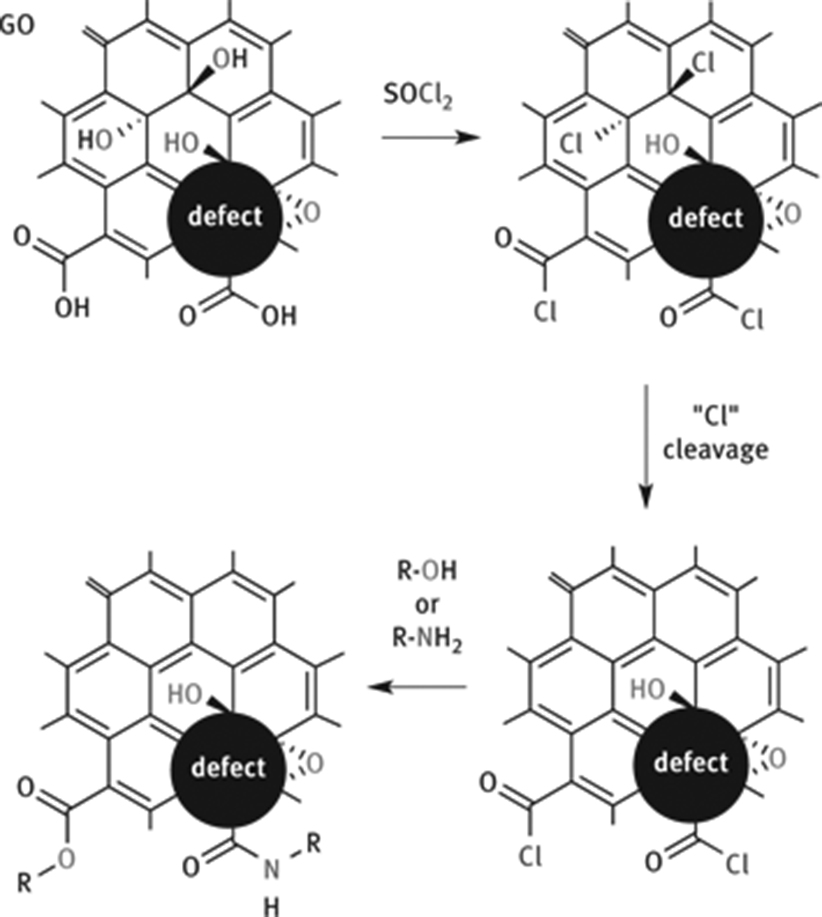
Functionalization of GO at carboxylic acids, located at edges of flakes or defect sites. Activation of carboxylic acids by thionyl chloride can also activate surface OH groups and cause elimination or other side reactions. Acid chlorides can subsequently react with alcohol or amines.
After activation of carboxylic acids, alcohols or amines are added to form esters and amides (Figure 12). Although this approach is manifold facilitated, it remains challenging to quantify the exact concentration of covalent bonds. Moreover, it is difficult to distinguish between carbonyl and carboxyl groups in X-ray photoelectron spectra (XPS), and therefore, quantification of ester groups and amides remains challenging, respectively. Although it is plausible that reactions can only occur at defect sites, proving the localization with precision remains challenging.
7.2 Considerations about Carbon–Carbon Bond Formation
It was also reported that C–C bonds from addends to the carbon framework of GO could be formed. This approach is facilitated because approximately 50% of C-atoms in GO are sp2-hybridized. The formation of C–C bonds on the surface of graphene is highly desired for the synthesis of molecular architectures, as depicted in Figure 13.
![Figure 13: Illustration of the reaction of hydroxyl groups of GO to form C–C bonds by Johnson–Claisen rearrangement. The yielded ester can be saponified, activated and undergoes amidation with various amines, including propagyl amine that can be further exploited for alkine–azide reactions. The addition of various groups with ethylene glycol moieties or sulfonate groups was reported. Terminal amines can also be protonated to yield positively charged derivatives suitable for layer-by-layer assembly [113].](/document/doi/10.1515/psr-2016-0106/asset/graphic/j_psr-2016-0106_fig_013.jpg)
Illustration of the reaction of hydroxyl groups of GO to form C–C bonds by Johnson–Claisen rearrangement. The yielded ester can be saponified, activated and undergoes amidation with various amines, including propagyl amine that can be further exploited for alkine–azide reactions. The addition of various groups with ethylene glycol moieties or sulfonate groups was reported. Terminal amines can also be protonated to yield positively charged derivatives suitable for layer-by-layer assembly [113].
One approach toward C–C bond formation in GO was reported using partially reduced GO and the aim was to make soluble graphene. The concept involves the increase of the π-system by partial deoxygenation, followed by the addition of an aryldiazonium salt that also bears a sulfonic acid group to provide water solubility [106]. Although this approach is appealing and black dispersions were yielded, crucial questions could not be addressed at that time. The quantification of defects and the determination of the degrees of functionalization remained unaddressed. Moreover, it is plausible that aryl ether groups can be formed by the reaction of the aryldiazonium salt and residual hydroxyl groups at the surface or at edges [107]. Ether formation with OH groups at edges of defects may even be the major reaction and C–C bond formation could have been a side reaction. Edges of graphene flakes have been demonstrated to be more reactive than the graphene basal plane, an effect that is not well investigated for GO or rGO [108]. Moreover, the adsorption of aryldiazonium salts on carbon surfaces is known and such additional adsorption also alters the surface properties [109]. The reaction of carbon–nucleophiles or C–C bond formation by rearrangement reactions are reported as well [110–112]. Generally black dispersions are yielded, which give evidence for deoxygenation of the surface instead of functionalization. It can be expected that the addition of any addend to the π-system of GO would rather lead to a brighter material than a darker one. Anyhow, it was demonstrated that soluble defective graphene can be prepared, e.g., by a chemical approach using rearrangement reactions, based on the Claisen reaction, as illustrated in Figure 13 by the Johnson–Claisen approach [113, 114].
The triethyl orthoacetate is activated by an acid and then an alcohol group of GO forms first a C–O bond. The ether bond is then formed after ethanol cleavage and formation of the C=C double bond. In the second step a [3, 0] sigmatropic rearrangement occurs if a C=C double bond of the carbon framework was in the right conformation. Subsequently, carboxylic acids are formed under basic conditions, as illustrated in Figure 13. However, side reactions may also occur, because some carboxylic acids may also generate at plane defects under basic conditions and the influence of functional groups at defect sites on this reaction protocol is not clear. Nevertheless, it could be demonstrated that carboxylic acids can be formed and that the reduction product forms stable dispersions in water. Moreover, X-ray diffraction measurements indicate an increased sheet distance in films of flakes, in contrast to as-synthesized GO. The surface properties of GO can be widely altered by this approach (Figure 13). The formation of a series of amide bonds was reported as anchor for carbon-rich molecules or molecules with triple bonds. The triple bonds were even further used to make click reactions to functionalize the surface. However, from the perspective of organic chemistry, it seems to be illusive to prove the direct bond formation between one sp2-C-atom of the carbon framework and the C-atom of the addend. Thus, analytical tools must be developed or improved to quantify the amount of formed C–C bonds and to evaluate the regiochemistry.
It is desirable to distinguish between edge functionalization, adsorption and functionalization on the intact carbon framework. The chemistry of GO is dominated by intrinsic properties of GO and functionalization is mostly based on C–O bond formation. In contrast to that the chemistry of graphene concentrates on C–C bond formation. Thus, these two worlds merge with C–C bond formation to GO. Overcoming structural defects in GO would possibly lead to graphene derivatives that cannot be distinguished from derivatives directly prepared from graphene.
8 Controlled Oxo-Functionalization of Graphene
Conventional approaches to functionalize GO do not account for the reactivity of in-plane defects. Recent reviews with focus on that type of chemistry can be found in the literature [7, 37, 56, 80–84]. Well-known reaction protocols are often applied on GO and the success of the reaction is evaluated by the analysis of, e.g., the performance in applications or by the stability of dispersions. GO and rGO have already performed well in many applications; however, it remains illusive to find structure property relations without knowing the used structure. This lack of knowledge hampers further development but overcoming this problem by controlled chemistry will enable further enhancement of applications.
The instability of the carbon framework of GO and oxo-G1 during reactions is an important issue and the thermodynamically very stable CO2 molecule might be formed, leading to an undefined structure. An instable starting material would exclude further functionalization in a controlled way. Thus, establishing the controlled chemistry of oxo-G1 requires answers for those stability issues that are given in the next sections.
8.1 Stability of GO
Boehm and Scholz investigated the thermal decomposition of GO and found large variations [27]. Impurities and metal salts can dramatically decrease the thermal stability. The main weight loss due to decomposition of heated samples of GO (prepared by oxidation with permanganate) occurs between about 180°C and 200°C. The decomposition can proceed and is enhanced by potassium impurities and even explosive decomposition reactions were described [115–117].
TGA can detect the main decomposition temperature of GO detected by weight loss. Combing TGA with a mass spectrometer allows the identification of the evolving gases. Adsorbed water is released up to 120°C followed by CO2 formation. The main weight loss occurs at a temperature of about 180°C. However, the decomposition of GO with lattice defects on the %-scale already starts at a temperature of 45°C. This information was found by placing films of GO on ZnSe followed by temperature-dependent infrared spectroscopy. In contrast oxo-G1 with 0.3% of defects in average is more stable as outlined below [118]. Spectra measured in transmission mode on ZnSe between 25°C and 150°C reveal a new absorption at 2,336 cm–1 that can be related to CO2 trapped between layers with the maximum intensity at 120°C. The formed CO2 is forming nanometer-sized blisters that were visualized in the films of GO during annealing using AFM. The CO2 signal reveals the decomposition of GO with the carbon lattice as carbon source. The trapping of CO2 prevents the detection by MS in the thermogravimetric experiment [118]. The CO2 concentration could be determined and the results indicate that one CO2 molecule is formed every 2 nm. Moreover, the role of water in the decarboxylation process of GO was investigated by 18O labeling of water. Indeed, 18O is incorporated into evolving CO2, which could be detected by MS. That result can be explained by carbonyl chemistry by the formation of hydrates from ketones or carboxylic acids.
Dimiev et al. described the lack of stability of GO. Pristine graphite oxide, a type of graphite oxide that was treated with alcohols instead of water during work-up, was described to bear cyclic organosulfate groups that hydrolyze during water impact. Moreover, it was determined that there is approximately one carbonyl group on 10–12 carbon atoms. This high amount of carbonyl groups can only stem from functional groups at edges of defects and not only from functional groups of the edges of flakes that possess diameters of several micrometer. It was further determined that about one CO2 molecule is formed on 35–55 carbon atoms during the synthesis. The formation of CO2 and the formation of carbonyl groups within the carbon lattice require breaking of C–C bonds [66]. Dimiev et al. proposed a formation mechanism for CO2 that originates from the carbon lattice of GO. The mechanism is illustrated in Figure 14, starting from vicinal diols 1. The reaction of diols in GO with hydroxide causes C–C bond cleavage (2, 3) and further base treatment may form carboxylic acids and facilitate CO2 formation (8–10). The carbon lattice can then be further degraded by subsequent reactions. The degradation of GO can lead to acidic functional groups and describe the acidity of conventional GO as illustrated by the reaction of 2 to 7. A new dynamic structure model of GO was therefore proposed by Dimiev et al. that accounts also for the origin of acidity of GO, taking the degradation of the carbon lattice toward humic acid into account [119]. This instability of GO toward base treatment was further demonstrated to lead to oxidative debrides that are formed upon etching of flakes of GO. The disintegration of flakes upon base treatment is depicted in Figure 14.
![Figure 14: (a) Scanning electron microscope (SEM) image of flakes of GO with smooth edges. (b) SEM image of a base-treated GO flake that starts to disintegrate, forming oxidative debrides. (c) Schematic model of the disintegration of flakes of GO. Reprinted from Ref. [120]. Copyright 2015. With permission from Elsevier. (d) Proposed reaction schemes for the degradation of GO by water and base [66, 119, 120].](/document/doi/10.1515/psr-2016-0106/asset/graphic/j_psr-2016-0106_fig_014.jpg)
(a) Scanning electron microscope (SEM) image of flakes of GO with smooth edges. (b) SEM image of a base-treated GO flake that starts to disintegrate, forming oxidative debrides. (c) Schematic model of the disintegration of flakes of GO. Reprinted from Ref. [120]. Copyright 2015. With permission from Elsevier. (d) Proposed reaction schemes for the degradation of GO by water and base [66, 119, 120].
Chemical reactions are generally driven by overcoming the activation barrier. Those reaction conditions must not be too harsh; otherwise the carbon framework becomes ruptured. Therefore, synthetic protocols that allow the transformation of functional groups must be developed, preserving the integrity of the carbon lattice.
8.2 Stability of Oxo-G1
Oxo-G1 bears few defects, at least below 1%. The thermal stability was found to be higher than that of GO. However, since the carbon framework of oxo-G1 was less damaged by the oxidation protocol than GO, SRS can be used to more precisely determine the thermal stability of the carbon framework.
Thus, SRS on thermally treated and subsequently chemically reduced films of flakes was conducted and the thermal stability of the σ-framework of C-atoms up to 100°C was identified (Figure 15(a)). The plot of ID/IG ratio vs. Γ2D in Figure 15(b) illustrates the thermal stability. The Γ2D values are between 60 and 70 cm–1 and remain almost constant up to 100°C. Heating oxo-G1 to 150°C and subsequent reduction reveals the decomposition of the carbon framework. The Γ2D values detected are between 90 and 300 cm–1. The worst quality of thermally processed oxo-G1 is measured for samples heated to 500°C. That type of graphene, better termed “thermally processed oxo-G1,” is amorphous and a 2D peak is hardly detectable with Γ2D = 300 cm–1. Thermal processing of oxo-G1 to 1,000°C is found to partially increase the quality of the carbon lattice. However, the original quality is not recovered as quantified by SRS. The Γ2D values are between 90 and 190 cm–1 and do not reach the low values of 60–70 cm–1 determined without thermal processing (Figure 15(b)).
![Figure 15: (a) The carbon framework of oxo-G1 is thermally stable up to 100°C, but it is instable at higher temperatures [121]. (b) SRS of graphene derived from oxo-G1 after thermal treatment [121].](/document/doi/10.1515/psr-2016-0106/asset/graphic/j_psr-2016-0106_fig_015.jpg)
It can be concluded that the carbon framework of oxo-G1 is stable enough for chemical reactions. However, it must be kept in mind that chemicals can reduce the thermal stability of the carbon framework. This issue is discussed and illustrated in the synthetic modification section below.
8.3 Reduction of Oxo-G1
SRS can also quantify the efficiency of reducing agents toward reduction of oxo-G1 to graphene, because the density of defects is within the sensitivity of Raman spectroscopy [122]. In the case of GO, were defects exclude SRS, the success of the reduction is quantified by means of the C/O ratio, determined by XPS or by electrical conductivity measurements of films of flakes [123, 124]. The latter methods must be used for rGO with defects of several percent. However, with concentrations of defects far below 1%, as for oxo-G1, contaminations may affect XPS results and SRS is beneficial.
The quality of generated graphene from oxo-G1 can be determined by SRS and plots of ID/IG vs. Γ2D values illustrate the results for four reducing methods (Figure 16(a)). The most efficient method identified is a mixture of HI and TFA. The slightly less efficient AS (vitamin C) can also produce graphene of high quality. However, as AFM images reveal, there remains a lot of AS adsorbed in the surface (Figure 16(b)). Vapor of hydrazine, which is often used in the literature for making rGO, is less efficient, and thermal processing of oxo-G1 forms the worst quality of graphene. The latter method produced amorphous graphene, dominated by defect sites. The efficiency of reducing agents is thus ranked like HI/TFA > AS > hydrazine > 200°C [122].
![Figure 16: (a) Statistical Raman analysis of graphene from oxo-G1 using different reducing agents. (b) AFM images of graphene from oxo-G1 obtained after thermal reduction or reduction with vitamin C (ascorbic acid (AS)), hydrazine or HI/TFA [122].](/document/doi/10.1515/psr-2016-0106/asset/graphic/j_psr-2016-0106_fig_016.jpg)
(a) Statistical Raman analysis of graphene from oxo-G1 using different reducing agents. (b) AFM images of graphene from oxo-G1 obtained after thermal reduction or reduction with vitamin C (ascorbic acid (AS)), hydrazine or HI/TFA [122].
Is the quality of the formed graphene limited by the efficiency of the reducing agent or by the quality of oxo-G1? The study described above demonstrates the influence of different reducing agents on the quality of graphene; thus the reducing agent is the limit. However, the quality of graphene should also be limited by the in-plane defects of oxo-G1. Oxo-G1 is usually deposited on a Si/300 nm SiO2 substrate by, e.g., Langmuir–Blodgett technique. After deposition, the film of oxo-G1 flakes is reduced by the reducing agents, but the reducing agent can only access the upper surface of oxo-G1. The lower side is blocked by the substrate [64]. Oxo-G1 was therefore placed on the aqueous subphase with a reducing agent like AS placed in the subphase to ensure that the reducing agent has access to the lower side of the flakes of oxo-G1 (Figure 17).
![Figure 17: (a) Mechanism of the reduction of oxo-G1 by an electron donor, such as iodide and a strong acid. Successive protonation and electron transfer steps remove oxygen functional groups to form graphene on a substrate. (b) Reduced oxo-G1 on substrate by vapor of HI/TFA (GHI/TFA), (c) reduced by AS from the reductive subphase (GAS) and (d) reduced by the combination of both reduction methods (GASHI/TFA) [64].](/document/doi/10.1515/psr-2016-0106/asset/graphic/j_psr-2016-0106_fig_017.jpg)
(a) Mechanism of the reduction of oxo-G1 by an electron donor, such as iodide and a strong acid. Successive protonation and electron transfer steps remove oxygen functional groups to form graphene on a substrate. (b) Reduced oxo-G1 on substrate by vapor of HI/TFA (GHI/TFA), (c) reduced by AS from the reductive subphase (GAS) and (d) reduced by the combination of both reduction methods (GASHI/TFA) [64].
Now the reduction is also ensured to proceed from the lower side. The surface turns gray after several minutes and graphene starts to form and is floating on the aqueous subphase. After transfer of that graphene on a substrate the quantification of the reduction efficiency by SRS is allowed. The graphene, yielded after subphase reduction, can be further reduced by HI/TFA. The compared results reveal that the direct reduction of oxo-G1 on the substrate without a reducing agent in the subphase is the most efficient one. The two-step reduction process with the reducing agent in the subphase followed by HI/TFA reduction is less efficient. These results may indicate the hindrance of reaction pathways leading to graphene by adsorption of unreactive species.
A reduction mechanism was derived for the reduction of oxo-G1, neglecting effects by defects. About every second carbon atom of oxo-G1 is sp3-hybridized (hydroxyl, epoxy and organosulfate groups) and there is a residual π-system. The functional groups can be protonated by the acid to form oxonium ions. It can be expected that the electron affinity of oxo-G1 (π-system) increases with protonation to promote the electron transfer from iodide. Subsequently, water and sulfuric acid are cleaved to form graphene (Figure 17(a)). Since oxo-G1 is a 2D material, electrons can be transferred to the π-system from the upper side. Cleaving functional groups from the lower side can be facilitated by protonation of oxo-groups between the substrate and the oxo-G1 as a consequence of proton hopping from edges of flakes. It can be concluded that the reduction of oxo-G1 is limited rather by in-plane using a potent reducing agent system such as HI/TFA than by the reducing agent [64].
8.4 Synthetic Modification of Oxo-G1
The functionalization of graphene leads to novel graphene derivatives and also the modification of oxo-G1. The current status of functionalization is summarized in the following. Full control over the type and density of functional groups, as well as their conversion, is not yet fully elaborate since the field of controlled chemical oxo-functionalization of graphene is a very young discipline. Hydroxyl, epoxy and organosulfate groups of oxo-G1 are the major functional groups in addition to sp2-carbon. The size of flakes is on the micrometer-scale and thus edges play a minor role. The density of in-plane defects is about 0.3% in average and thus edges of defects should also play a minor role.
The integrity of the carbon framework upon chemical reactions is necessary to elaborate novel preparation protocols that allow avoiding the rupture of the carbon framework [126]. It was demonstrated that functional groups of oxo-G1, such as epoxy, hydroxyl and organosulfate, are stable in aqueous HCl at the pH of about 1 at 10°C (Figure 18). But at a temperature of 40°C, organosulfate groups are cleaved, while hydroxyl and epoxy groups remain chemically bound.
![Figure 18: Illustration of the reactivity of oxo-G1. Reactivity at 10°C and 40°C, respectively, upon treatment with HCl or NaOH is shown. Also the substitution of organosulfate by azide is possible under controlled reaction conditions [125].](/document/doi/10.1515/psr-2016-0106/asset/graphic/j_psr-2016-0106_fig_018.jpg)
Illustration of the reactivity of oxo-G1. Reactivity at 10°C and 40°C, respectively, upon treatment with HCl or NaOH is shown. Also the substitution of organosulfate by azide is possible under controlled reaction conditions [125].
GO is decomposed by base treatment as outlined above. Thus, the chemical reactivity of oxo-G1 against sodium hydroxide was of interest. The reaction conditions were found to be controllable to cleave organosulfate and possibly also epoxy groups to diols upon hydroxide treatment at 10°C. The SRS proves that the carbon framework remains stable under those reaction conditions. In contrast, treating oxo-G1 with sodium hydroxide at 40°C not only cleaves functional groups, but also raptures the carbon framework and introduces therefore permanent defects into the carbon framework (Figure 18). SRS indicates the rupture by the increase of Γ2D from 72 to 120 cm–1. It can be concluded that the reaction conditions must be well controlled to enable the chemistry on the surface of graphene, which leads to new derivatives of graphene. In that many derivatives, such as hydroxylated graphene (G1-OH) can be prepared.
The reactivity of the organosulfate group of oxo-G1 was investigated and it was found that azide groups can be introduced by substitution of organosulfate. This substitution reaction preserved thermally instable groups due to the mild reaction with sodium azide that proceeded in the solid state upon freeze-drying (Figure 18) [125]. The carbon–nitrogen bonds formation could be proved by Fourier transform infrared spectroscopy (FTIR), TGA coupled with MS, elemental analysis and 15N nuclear magnetic resonance (NMR) spectroscopy measured in the solid state. Azide is predominantly located on the surface of oxo-G1 and not on the edges. The C–N stretching vibration of azide was found at 2,123 cm–1 and shifted by 11 cm–1 upon binding of 15N14N2 to the carbon framework (Figure 19(a)). The substitution of organosulfate was also indicated by TGA (Figure 19(b)). The weight-loss step at 200–300°C is only detected for oxo-G1 but not for the substitution product. The decomposition of azide was indicated by the signal of m/z 29, which is related to 15N14N formation (Figure 19(b)). Moreover, wet-chemically cleaved sulfate could be identified by precipitation of BaSO4.
![Figure 19: (a) Infrared spectra of GO-N3 and GO-15N14N2 (here GO is oxo-G1). (b) TGA of GO and GO-15N14N2, m/z 29 of GO-N3 and GO-15N14N2. (c) simplified model of GO-N3 with an azide and a hydroxyl group connected to the carbon lattice in trans-configuration. 15N NMR shifts are calculated by ab initio methods (107.4 ppm and 225.8 ppm), (d) 15N ssNMR magic angle spinning spectrum of GO-15N14N2 with two peaks (1:1 ratio) [125].](/document/doi/10.1515/psr-2016-0106/asset/graphic/j_psr-2016-0106_fig_019.jpg)
(a) Infrared spectra of GO-N3 and GO-15N14N2 (here GO is oxo-G1). (b) TGA of GO and GO-15N14N2, m/z 29 of GO-N3 and GO-15N14N2. (c) simplified model of GO-N3 with an azide and a hydroxyl group connected to the carbon lattice in trans-configuration. 15N NMR shifts are calculated by ab initio methods (107.4 ppm and 225.8 ppm), (d) 15N ssNMR magic angle spinning spectrum of GO-15N14N2 with two peaks (1:1 ratio) [125].
Also NMR spectroscopy in solids could be conducted on 15N-labeled compounds (Figure 19(d)). Two signals at 107.4 and 225.8 ppm were found which relate to the two possible binding states of 15N14N14N (R-15N14N14N or R14-N14N15N). The two signals could also be confirmed by calculated predictions based on ab initio methods (Figure 19(c)). The quantification of N-content revealed one azide group on every 30th carbon atoms. The azide group in GO-N3 is hydrolytically stable up to 60°C and thus, GO-N3 can be expected as a suitable precursor for other reactions, opening the field of azide chemistry for graphene-based materials. In another approach oxo-groups are in part removed, while keeping the azide groups chemically bound, an approach that, if complete, would lead to graphene azide [127].
The following example demonstrates an oxo-G1-based molecular architecture as floating gate memory device working at an exceptional low voltage of 3 V (Figure 20(e)) [128]. The synthesis and characterization are outlined in more detail in this example to illustrate the efforts necessary to prove the proposed structure on the complex graphene system.
![Figure 20: (a) Reaction scheme illustrating the reaction of oxo-G1 with dodecylamine (oxo-G1/DA) followed by non-covalent functionalization with a block copolymer of styrene and ethylene oxide (PSEO). Solid state NMR spectra of oxo-G1/DA, (b) 13C NMR, (c) 15N NMR, (d) 1H-13C correlation NMR. (e) Device structure of a floating gate memory device with oxo-G1/DA/PSEO as charge storage material. (f) Device characteristic; write signal at –3 V, erase signal at 2 V and read voltage at –0.5 V. (g) AFM image of flakes of oxo-G1/DA/PSEO composite [128].](/document/doi/10.1515/psr-2016-0106/asset/graphic/j_psr-2016-0106_fig_020.jpg)
(a) Reaction scheme illustrating the reaction of oxo-G1 with dodecylamine (oxo-G1/DA) followed by non-covalent functionalization with a block copolymer of styrene and ethylene oxide (PSEO). Solid state NMR spectra of oxo-G1/DA, (b) 13C NMR, (c) 15N NMR, (d) 1H-13C correlation NMR. (e) Device structure of a floating gate memory device with oxo-G1/DA/PSEO as charge storage material. (f) Device characteristic; write signal at –3 V, erase signal at 2 V and read voltage at –0.5 V. (g) AFM image of flakes of oxo-G1/DA/PSEO composite [128].
A very thin dielectric is necessary to separate the charge storage layer from the gate and the semiconductor to enable low-voltage operation. The used oxo-G1 bears epoxy and hydroxyl groups in addition to organosulfate groups. The latter are complexed with hydronium ions and about 50% of C-atoms are sp2-hybridized (Figure 20(a)). Titration of oxo-G1 with dodecyl amine exchanges the hydronium ion by DA and the electrostatic complex of DA bound to organosulfate is formed.
This oxo-G1/DA was thoroughly analyzed by combustion EA (elemental analysis), TGA (thermogravimetric analysis) coupled with FTIR, GC and MS. The data revealed that organosulfate and DA are structure motifs. TGA analysis reveals that SO2 originates from organosulfate. Also signals of alkyl species could be detected. Moreover, the alkyl signals, identified by TGA–FTIR, stem from DA and could be detected by GC–MS analysis due to the identification of dodecene, the expected elimination product of DA. In addition, ssNMR spectroscopy was performed (Figure 20(b–d)). The combination of ssNMR with ab initio calculations proves that alkyl-ammonium is the only one major nitrogen-containing species of the structure. The data are consistent with the proposed electrostatic binding of DA to organosulfate. The alkyl chain of DA was further found to interact with the π-system, as evidenced 2D ssNMR measuring 13C-1H correlation spectra (Figure 20(d)).
Single layers of the complex of oxo-G1/DA are soluble in THF (tetrahydrofuran) and can therefore be mixed with soluble polymers. Here, the block PSEO was used. Thus, oxo-G1/DA flakes become non-covalently functionalized and form the composite of oxo-G1/DA/PSEO. The AFM image in Figure 20(g) proves the absence of free polymer particles. TGA gives further evidence for the decomposition of the adsorbed polymer at about 450°C and FTIR signals stemming from aryl groups could be traced. The block copolymer functions as dielectric layer with a thickness of only 1–2 nm on each side of the flakes. The oxo-G1/DA/PSEO composite is also the charge storage material and enables the function of the floating gate memory device. Imidazolium-terminated self-assembled monolayer enables the deposition of the charge storage layer and efficient isolation of the substrate (Figure 20(e)). A sexithiophene derivative is used as semiconductor. A gate voltage of –3 V is sufficient to introduce charge carriers and the charge carriers can be erased at +2 V. Thus, information can be stored and the current can be “read” at –0.5 V (Figure 20(f)). Reference experiments reveal that the memory device working at 3 V can only be constructed with the defined composite of oxo-G1/DA/PSEO. Other precursors or less-defined systems all fail, e.g., oxo-G1, oxo-G1/DA, defective GO, defective GO mixed with DA and PSEO, or reference systems that bear excess of PSEO. Other examples that relate to self-assembly processes and device fabrication with increased performance can be found in the literature [129–131].
9 Conclusions
The classical disciplines of organic chemistry and materials science mingle with conducting graphene chemistry. While functionalization of C60 is verified by molecular analysis, the functionalization of graphene requires novel methods. Especially the functionalization of graphene starting from graphite by oxo-addends requires well-controlled reaction conditions, not to over-oxidize and rupture the carbon framework. Avoiding in-plane lattice defects, the reactivity of functional groups on the basal plane can be explored and first experimental results are summarized in this chapter. Analytical tools were developed to probe reaction conditions and their impact on the integrity of the carbon framework. Introduced functional groups can be analyzed, e.g., by FTIR, EA, TGA coupled with FTIR, MS or GC–MS. In contrast to carbon nanotubes that are contaminated by paramagnetic impurities, functionalized graphene can be analyzed by ssNMR. Although that method is advancing, specialists are still required; however, with ssNMR more insights into the regiochemistry of addends will be gained. With controlling the chemistry of graphene, novel graphene derivatives will be accessible with specialized properties. It can be expected that those materials will enable new applications with increased performance.
Acknowledgment
This article is also available in: Muellen, Feng, Chemistry of Carbon Nanostructures. De Gruyter (2016), isbn 978–3–11–028450–8.
References
[1] Dreyer DR, Ruoff RS, Bielawski CW. Ein Konzept und seine Umsetzung: Graphen gestern, heute und morgen. Angew Chem 2010;122(49):9524–32.10.1002/ange.201003024Search in Google Scholar
[2] Dreyer DR, Ruoff RS, Bielawski CW. From conception to realization: an historical account of graphene and some perspectives for its future. Angew Chem Int Ed 2010;49(49):9336–44.10.1002/anie.201003024Search in Google Scholar PubMed
[3] Boehm H-P. Graphen – wie eine Laborkuriosität plötzlich äußerst interessant wurde. Angew Chem 2010;122(49):9520–3.10.1002/ange.201004096Search in Google Scholar
[4] Boehm HP. Graphene – how a laboratory curiosity suddenly became extremely interesting. Angew Chem Int Ed 2010;49(49):9332–5.10.1002/anie.201004096Search in Google Scholar PubMed
[5] Eigler S. Transparent and electrically conductive films from chemically derived graphene. In: Mikhailov S, editor. Physics and applications of graphene – experiments. NewYork: InTech, 2011:109–30.Search in Google Scholar
[6] Boehm HP, Clauss A, Fischer GO, Hofmann U. Dünnste Kohlenstoff-Folien. Z Naturforsch B 1962;17(3):150–3.10.1515/znb-1962-0302Search in Google Scholar
[7] Dreyer DR, Park S, Bielawski CW, Ruoff RS. The chemistry of graphene oxide. Chem Soc Rev 2010;39(1):228–40.10.1039/B917103GSearch in Google Scholar
[8] Schafhaeutl C. Ueber die Verbindungen des Kohlenstoffes mit Silicium, Eisen und andern Metallen, welche die verschiedenen Gattungen von Gusseisen, Stahl und Schmiedeeisen bilden. J Prakt Chem 1840;21(1):129–57.10.1002/prac.18400210117Search in Google Scholar
[9] Kohlschütter V, Zur HP. Kenntnis des graphitischen Kohlenstoffs und der Graphitsäure. Z Anorg Allg Chem 1919;105(1):121–44.10.1002/zaac.19191050109Search in Google Scholar
[10] Brodie BC. Note sur un nouveau procédé pour la purification et la désagrégation du graphite. Ann Chim Phys 1855;45:351–3.Search in Google Scholar
[11] Brodie BC. On the atomic weight of graphite. Philos Trans R Soc London 1859;149:249–59.10.1098/rstl.1859.0013Search in Google Scholar
[12] Brodie BC. On the atomic weight of graphite. Proc Roy Soc Lond 1859;10:11–12.Search in Google Scholar
[13] Brodie BC. Sur le poids atomique du grafite. Ann Chim Phys 1860;59:466–72.Search in Google Scholar
[14] Brodie BC. Ueber das Atomgewicht des Graphits. Ann Chem Pharm 1860;114(1):6–24.10.1002/jlac.18601140103Search in Google Scholar
[15] Gottschalk F. Beiträge zur Kenntniss der Graphitsäure. J Prakt Chem 1865;95(1):321–50.10.1002/prac.18650950136Search in Google Scholar
[16] Berthelot M. Méthode universelle pour réduire et saturer d’hydrogène les composés organiques. Ann Chim Phys 1870;19(4er):392.Search in Google Scholar
[17] Luzi W. Über Allotropie des amorphen Kohlenstoffes. Ber Dtsch Chem Ges 1892;25(1):1378–85.10.1002/cber.189202501205Search in Google Scholar
[18] Ueber LW. Graphit und Graphitit. Ber Dtsch Chem Ges 1893;26(1):890–5.10.1002/cber.189302601182Search in Google Scholar
[19] Staudenmaier L. Verfahren zur Darstellung der Graphitsäure. Ber Dtsch Chem Ges 1898;31(2):1481–7.10.1002/cber.18980310237Search in Google Scholar
[20] Staudenmaier L. Verfahren zur Darstellung der Graphitsäure. Ber Dtsch Chem Ges 1899;32(2):1394–9.10.1002/cber.18990320208Search in Google Scholar
[21] Staudenmaier L. Untersuchungen über den Graphit. Ber Dtsch Chem Ges 1899;32(3):2824–34.10.1002/cber.18990320340Search in Google Scholar
[22] Charpy G. Sur la formation de l’oxyde graphitique et la définition du graphite. C R Hebd Séances Acad Sci 1909;148(5):920–3.Search in Google Scholar
[23] William S, Hummers J, Offeman RE. Preparation of graphitic oxide. J Am Chem Soc 1958;80(6):1339–39.10.1021/ja01539a017Search in Google Scholar
[24] Boehm HP, Clauss A, Fischer GO, Das HU. Adsorptionsverhalten sehr dünner Kohlenstoff-Folien. Z Anorg Allg Chem 1962;316(3–4):119–27.10.1002/zaac.19623160303Search in Google Scholar
[25] Scholz W, Boehm HP. Die Ursache der Dunkelfärbung des hellen Graphitoxids. Z Anorg Allg Chem 1964;331(3–4):129–32.10.1002/zaac.19643310303Search in Google Scholar
[26] Scholz W, Boehm HP. Die thermische Zersetzung von Graphitoxyd. Naturwissenschaften 1964;51:160–60.10.1007/BF00622288Search in Google Scholar
[27] Boehm HP, Der SW. Verpuffungspunkt” des Graphitoxids. Z Anorg Allg Chem 1965;335(1–2):74–9.10.1002/zaac.19653350107Search in Google Scholar
[28] Boehm H-P SW. Vergleich der Darstellungsverfahren für Graphitoxyd. Liebigs Ann Chem 1966;691(1):1–8.10.1002/jlac.19666910102Search in Google Scholar
[29] Boehm HP, Eckel M, Scholz W. Über den Bildungsmechanismus des Graphitoxids. Z Anorg Allg Chem 1967;353(5–6):236–42.10.1002/zaac.19673530503Search in Google Scholar
[30] Kovtyukhova NI, Ollivier PJ, Martin BR, Mallouk TE, Chizhik SA, Buzaneva EV, et al. Layer-by-layer assembly of ultrathin composite films from micron-sized graphite oxide sheets and polycations. Chem Mater 1999;11(3):771–8.10.1021/cm981085uSearch in Google Scholar
[31] Marcano DC, Kosynkin DV, Berlin JM, Sinitskii A, Sun Z, Slesarev A, et al. Improved synthesis of graphene oxide. ACS Nano 2010;4(8):4806–14.10.1021/nn1006368Search in Google Scholar
[32] He H, Riedl T, Lerf A, Klinowski J. Solid-state NMR studies of the structure of graphite oxide. J Phys Chem 1996;100:19954–8.10.1021/jp961563tSearch in Google Scholar
[33] Lerf A, Heb H, Riedl T, Forster M, Klinowskib J. 13C and 1H MAS NMR studies of graphite oxide and its chemically modified derivatives. Solid State Ionics 1997;101–103(2):857–62.10.1016/S0167-2738(97)00319-6Search in Google Scholar
[34] He H, Klinowski J, Forster M, Lerf A. A new structural model for graphite oxide. Chem Phys Lett 1998;287:53–6.10.1016/S0009-2614(98)00144-4Search in Google Scholar
[35] Lerf A, He H, Forster M, Klinowski J. Structure of graphite oxide revisited. J Phys Chem B 1998;102(23):4477–82.10.1021/jp9731821Search in Google Scholar
[36] Kim S, Zhou S, Hu Y, Acik M, Chabal YJ, Berger C, et al. Room-temperature metastability of multilayer graphene oxide films. Nat Mater 2012;11(6):544–9.10.1038/nmat3316Search in Google Scholar PubMed
[37] Chen D, Feng H, Li J. Graphene oxide: preparation, functionalization, and electrochemical applications. Chem Rev 2012;112(11):6027–53.10.1021/cr300115gSearch in Google Scholar
[38] Gao W, Alemany LB, Ci L, Ajayan PM. New insights into the structure and reduction of graphite oxide. Nat Chem 2009;1(5):403–8.10.1038/nchem.281Search in Google Scholar
[39] Cai W, Piner RD, Stadermann FJ, Park S, Shaibat MA, Ishii Y, et al. Synthesis and solid-state NMR structural characterization of 13C-labeled graphite oxide. Science 2008;321(5897):1815–17.10.1126/science.1162369Search in Google Scholar
[40] Casabianca LB, Shaibat MA, Cai WW, Park S, Piner R, Ruoff RS, et al. NMR-based structural modeling of graphite oxide using multidimensional 13C solid-state NMR and Ab initio chemical shift calculations. J Am Chem Soc 2010;132(16):5672–6.10.1021/ja9030243Search in Google Scholar
[41] Hou X-L, Li J-L, Drew SC, Tang B, Sun L, Wang X-G. Tuning radical species in graphene oxide in aqueous solution by photoirradiation. J Phys Chem C 2013;117(13):6788–93.10.1021/jp311727tSearch in Google Scholar
[42] Yang L, Zhang R, Liu B, Wang J, Wang S, Han MY, et al. Pi-conjugated carbon radicals at graphene oxide to initiate ultrastrong chemiluminescence. Angew Chem Int Ed 2014;53(38):10109–13.10.1002/anie.201405295Search in Google Scholar
[43] Pieper H, Chercheja S, Eigler S, Halbig C, Filipovic MR, Mokhir A. Endoperoxides revealed as origin of the toxicity of graphene oxide. Angew Chem Int Ed 2016;55(1), 405-407; Angew. Chem. 2016;128(1), 413–416.Search in Google Scholar
[44] Szabó T, Berkesi O, Forgó P, Josepovits K, Sanakis Y, Petridis D, et al. Evolution of surface functional groups in a series of progressively oxidized graphite oxides. Chem Mater 2006;18(11):2740–9.10.1021/cm060258+Search in Google Scholar
[45] Nakajima T, Matsuo Y. Formation process and structure of graphite oxide. Carbon 1994;32(3):469–75.10.1016/0008-6223(94)90168-6Search in Google Scholar
[46] Clause A, Plass R, Boehm HP, Hofmann U. Untersuchungen zur Struktur des Graphitoxyds. Z Anorg Allg Chem 1957;291(5–6):205–20.10.1002/zaac.19572910502Search in Google Scholar
[47] Ruess G. Über das Graphitoxyhydroxyd (Graphitoxyd). Monatsh Chem 1947;76(3–5):381–417.10.1007/BF00898987Search in Google Scholar
[48] Scholz W, Boehm HP. Betrachtungen zur Struktur des Graphitoxids. Z Anorg Allg Chem 1969;369(3–6):327–40.10.1002/zaac.19693690322Search in Google Scholar
[49] Dreyer DR, Todd AD, Bielawski CW. Harnessing the chemistry of graphene oxide. Chem Soc Rev 2014;43(15):5288–301.10.1039/C4CS00060ASearch in Google Scholar PubMed
[50] Hossain MZ, Johns JE, Bevan KH, Karmel HJ, Liang YT, Yoshimoto S, et al. Chemically homogeneous and thermally reversible oxidation of epitaxial graphene. Nature Chem 2012;4:305–9.10.1038/nchem.1269Search in Google Scholar PubMed
[51] Kang JH, Kim T, Choi J, Park J, Kim YS, Chang MS, et al. The hidden second oxidation step of Hummers’ method. Chem Mater 2016;28(3), 756-764.10.1021/acs.chemmater.5b03700Search in Google Scholar
[52] Kozhemyakina NV, Eigler S, Dinnebier RE, Inayat A, Schwieger W, Hirsch A. Effect of the structure and morphology of natural, synthetic and post-processed graphites on their dispersibility and electronic properties. Fuller Nanotub Car N 2013;21(9):804–23.10.1080/1536383X.2012.702162Search in Google Scholar
[53] Wang L, Ambrosi A, Pumera M. Metal-free catalytic oxygen reduction reaction on heteroatom-doped graphene is caused by trace metal impurities. Angew Chem Int Ed 2013;52(51):13818–21.10.1002/anie.201309171Search in Google Scholar PubMed
[54] Feicht P, Kunz DA, Lerf A, Breu J. Facile and scalable one-step production of organically modified graphene oxide by a two-phase extraction. Carbon 2014;80:229–34.10.1016/j.carbon.2014.08.061Search in Google Scholar
[55] Koehler FM, Stark WJ. Organic synthesis on graphene. Acc Chem Res 2013;46(10):2297–306.10.1021/ar300125wSearch in Google Scholar PubMed
[56] Eigler S, Hirsch A. Chemistry with graphene and graphene oxide-challenges for synthetic chemists. Angew. Chem. 2014;126(30), 7852–7872.10.1002/anie.201402780Search in Google Scholar PubMed
[57] Walter J, Nacken TJ, Damm C, Thajudeen T, Eigler S, Peukert W. Determination of the lateral dimension of graphene oxide nanosheets using analytical ultracentrifugation. Small 2015;11(7):814–25.10.1002/smll.201401940Search in Google Scholar PubMed
[58] Ferrari AC, Basko DM. Raman spectroscopy as a versatile tool for studying the properties of graphene. Nat Nanotech 2013;8(4):235–46.10.1038/nnano.2013.46Search in Google Scholar PubMed
[59] Englert JM, Vecera P, Knirsch KC, Schafer RA, Hauke F, Hirsch A. Scanning-Raman-microscopy for the statistical analysis of covalently functionalized graphene. ACS Nano 2013;7(6):5472–82.10.1021/nn401481hSearch in Google Scholar PubMed
[60] Eigler S, Enzelberger-Heim M, Grimm S, Hofmann P, Kroener W, Geworski A, et al. Wet chemical synthesis of graphene. Adv Mater 2013;25(26):3583–7.10.1002/adma.201300155Search in Google Scholar PubMed
[61] Grimm SB, Schweiger M, Eigler S, Zaumseil J. High-quality reduced graphene oxide by CVD-assisted annealing. J Phys Chem C 2016;120(5), 3036–3041.10.1021/acs.jpcc.5b11598Search in Google Scholar
[62] Rüdorff W, Hofmann U. Über Graphitsalze. Z Anorg Allg Chem 1938;238(1):1–50.10.1002/zaac.19382380102Search in Google Scholar
[63] Eigler S. Graphite sulphate – a precursor to graphene. Chem Commun 2015;51(15):3162–5.10.1039/C4CC09381JSearch in Google Scholar
[64] Eigler S. Mechanistic insights into the reduction of graphene oxide addressing its surfaces. Phys Chem Chem Phys 2014;16(37):19832–5.10.1039/C4CP03168GSearch in Google Scholar PubMed
[65] Eigler S, Dotzer C, Hof F, Bauer W, Sulfur HA. Species in graphene oxide. Chem Eur J 2013;19(29):9490–6.10.1002/chem.201300387Search in Google Scholar PubMed
[66] Dimiev A, Kosynkin DV, Alemany LB, Chaguine P, Tour JM. Pristine graphite oxide. J Am Chem Soc 2012;134(5):2815–22.10.1021/ja211531ySearch in Google Scholar PubMed
[67] Ferrari AC, Meyer JC, Scardaci V, Casiraghi C, Lazzeri M, Mauri F, et al. Raman spectrum of graphene and graphene layers. Phys Rev Lett 2006;97(18):187401.10.1103/PhysRevLett.97.187401Search in Google Scholar PubMed
[68] Graf D, Molitor F, Ensslin K, Stampfer C, Jungen A, Hierold C, et al. Spatially resolved Raman spectroscopy of single- and few-layer graphene. Nano Lett 2007;7(2):238–42.10.1021/nl061702aSearch in Google Scholar PubMed
[69] Cançado LG, Jorio A, Ferreira EHM, Stavale F, Achete CA, Capaz RB, et al. Quantifying defects in graphene via Raman spectroscopy at different excitation energies. Nano Lett 2011;11(8):3190–6.10.1021/nl201432gSearch in Google Scholar PubMed
[70] Ni ZH, Yu T, Lu YH, Wang YY, Feng YP, Shen ZX. Uniaxial strain on graphene: Raman spectroscopy study and band-gap opening. ACS Nano 2008;2(11):2301–5.10.1021/nn800459eSearch in Google Scholar PubMed
[71] Wang YY, Ni ZH, Yu T, Shen ZX, Wang HM, Wu YH, et al. Raman studies of monolayer graphene: the substrate effect. J Phys Chem C 2008;112(29):10637–40.10.1021/jp8008404Search in Google Scholar
[72] Das A, Pisana S, Chakraborty B, Piscanec S, Saha SK, Waghmare UV, et al. Monitoring dopants by Raman scattering in an electrochemically top-gated graphene transistor. Nat Nanotech 2008;3(4):210–15.10.1038/nnano.2008.67Search in Google Scholar PubMed
[73] Casiraghi C, Hartschuh A, Qian H, Piscanec S, Georgi C, Fasoli A, et al. Raman spectroscopy of graphene edges. Nano Lett 2009;9(4):1433–41.10.1021/nl8032697Search in Google Scholar PubMed
[74] Lucchese MM, Stavale F, Ferreira EH, Vilani C, Moutinho MV, Capaz RB, et al. Quantifying ion-induced defects and Raman relaxation length in graphene. Carbon 2010;48(5):1592–7.10.1016/j.carbon.2009.12.057Search in Google Scholar
[75] Koehler FM, Jacobsen A, Ensslin K, Stampfer C, Stark WJ. Selective chemical modification of graphene surfaces: distinction between single- and bilayer graphene. Small 2010;6(10):1125–30.10.1002/smll.200902370Search in Google Scholar PubMed
[76] Jung I, Dikin DA, Piner RD, Ruoff RS. Tunable electrical conductivity of individual graphene oxide sheets reduced at “low” temperatures. Nano Lett 2008;8(12):4283–7.10.1021/nl8019938Search in Google Scholar PubMed
[77] Eda G, Chhowalla M. Chemically derived graphene oxide: towards large-area thin-film electronics and optoelectronics. Adv Mater 2010;22(22):2392–415.10.1002/adma.200903689Search in Google Scholar PubMed
[78] Eigler S, Dotzer C, Hirsch A. Visualization of defect densities in reduced graphene oxide. Carbon 2012;50(10):3666–73.10.1016/j.carbon.2012.03.039Search in Google Scholar
[79] Eigler S, Hof F, Enzelberger-Heim M, Grimm S, Müller P, Hirsch A. Statistical-Raman-microscopy atomic-force-microscopy on heterogeneous graphene obtained after reduction of graphene oxide. J Phys Chem C 2014;118(14):7698–704.10.1021/jp500580gSearch in Google Scholar
[80] Allen MJ, Tung VC, Kaner RB. Honeycomb carbon: a review of graphene. Chem Rev 2010;110(1):132–45.10.1021/cr900070dSearch in Google Scholar PubMed
[81] Wu D, Zhang F, Liu P, Feng X. Two-dimensional nanocomposites based on chemically modified graphene. Chem Eur J 2011;17(39):10804–12.10.1002/chem.201101333Search in Google Scholar PubMed
[82] Huang X, Qi X, Boey F, Zhang H. Graphene-based composites. Chem Soc Rev 2012;41(2):666–86.10.1039/C1CS15078BSearch in Google Scholar
[83] Zhu Y, Murali S, Cai W, Li X, Suk JW, Potts JR, et al. Graphene and graphene oxide: synthesis, properties, and applications. Adv Mater 2010;22(35):3906–24.10.1002/adma.201001068Search in Google Scholar PubMed
[84] Park J, Yan M. Covalent functionalization of graphene with reactive intermediates. Acc Chem Res 2013;46(1):181–9.10.1021/ar300172hSearch in Google Scholar PubMed
[85] Lu CH, Yang HH, Zhu CL, Chen X, Chen GN. A graphene platform for sensing biomolecules. Angew Chem Int Ed 2009;48(26):4785–7.10.1002/anie.200901479Search in Google Scholar PubMed
[86] Wang S, Yu D, Dai L, Chang DW, Baek JB. Polyelectrolyte-functionalized graphene as metal-free electrocatalysts for oxygen reduction. ACS Nano 2011;5(8):6202–9.10.1021/nn200879hSearch in Google Scholar PubMed
[87] Burress JW, Gadipelli S, Ford J, Simmons JM, Zhou W, Yildirim T. Graphene oxide framework materials: theoretical predictions and experimental results. Angew Chem Int Ed 2010;49(47):8902–4.10.1002/anie.201003328Search in Google Scholar PubMed
[88] Burress JW, Gadipelli S, Ford J, Simmons JM, Zhou W, Yildirim T. Graphene oxide framework materials: theoretical predictions and experimental results. Angew Chem 2010;122(47):9086–8.10.1002/ange.201003328Search in Google Scholar
[89] Stankovich S, Piner RD, Nguyen ST, Ruoff RS. Synthesis and exfoliation of isocyanate-treated graphene oxide nanoplatelets. Carbon 2006;44(15):3342–7.10.1016/j.carbon.2006.06.004Search in Google Scholar
[90] Sun H, Xu Z, Gao C. Multifunctional ultra-flyweight, synergistically assembled carbon aerogels. Adv Mater 2013;25(18):2554–60.10.1002/adma.201204576Search in Google Scholar PubMed
[91] Chabot V, Higgins D, Yu A, Xiao X, Chen Z, Zhang J. A review of graphene and graphene oxide sponge: material synthesis and applications to energy and the environment. Energ Environ Sci 2014;7(5):1564–96.10.1039/c3ee43385dSearch in Google Scholar
[92] Sofer Z, Jankovsky O, Libanska A, Simek P, Novacek M, Sedmidubsky D, et al. Definitive proof of graphene hydrogenation by Clemmensen reduction: use of deuterium labeling. Nanoscale 2015;7(23):10535–43.10.1039/C5NR01356ASearch in Google Scholar PubMed
[93] Chua CK, Pumera M. Regeneration of a conjugated sp(2) graphene system through selective defunctionalization of epoxides by using a proven synthetic chemistry mechanism. Chem Eur J 2014;20(7):1871–7.10.1002/chem.201304131Search in Google Scholar PubMed
[94] Bourlinos AB, Gournis D, Petridis D, Szabó T, Szeri A, Dékány I. Graphite oxide chemical reduction to graphite and surface modification with primary aliphatic amines and amino acids. Langmuir 2003;19(15):6050–5.10.1021/la026525hSearch in Google Scholar
[95] Yang H, Shan C, Li F, Han D, Zhang Q, Niu L. Covalent functionalization of polydisperse chemically-converted graphene sheets with amine-terminated ionic liquid. Chem Commun 2009;19(26):3880–2.10.1039/b905085jSearch in Google Scholar PubMed
[96] Beckert F, Rostas AM, Thomann R, Weber S, Schleicher E, Friedrich C, et al. Self-initiated free radical grafting of styrene homo- and copolymers onto functionalized graphene. Macromolecules 2013;46(14):5488–96.10.1021/ma400895fSearch in Google Scholar
[97] Kim J, Cote LJ, Huang J. Two dimensional soft material: new faces of graphene oxide. Acc Chem Res 2012;45(8):1356–64.10.1021/ar300047sSearch in Google Scholar PubMed
[98] Loh KP, Bao Q, Ang PK, Yang J. The chemistry of graphene. J Mater Chem 2010;20(12):2277–89.10.1039/b920539jSearch in Google Scholar
[99] Kuila T, Bose S, Mishra AK, Khanra P, Kim NH, Lee JH. Chemical functionalization of graphene and its applications. Prog Mater Sci 2012;57(7):1061–105.10.1016/j.pmatsci.2012.03.002Search in Google Scholar
[100] Dong L, Gari RRS, Li Z, Craig MM, Hou S. Graphene-supported platinum and platinum–ruthenium nanoparticles with high electrocatalytic activity for methanol and ethanol oxidation. Carbon 2010;48(3):781–7.10.1016/j.carbon.2009.10.027Search in Google Scholar
[101] Xue Y, Chen H, Yu D, Wang S, Yardeni M, Dai Q, et al. Oxidizing metal ions with graphene oxide: the in situ formation of magnetic nanoparticles on self-reduced graphene sheets for multifunctional applications. Chem Commun 2011;47(42):11689–91.10.1039/c1cc14789gSearch in Google Scholar PubMed
[102] Liu Z, Robinson JT, Sun X, Dai H. PEGylated nanographene oxide for delivery of water-insoluble cancer drugs. J Am Chem Soc 2008;130(33):10876–7.10.1021/ja803688xSearch in Google Scholar PubMed PubMed Central
[103] Zhang X, Huang Y, Wang Y, Ma Y, Liu Z, Chen Y. Synthesis and characterization of a graphene–C60 hybrid material. Carbon 2009;47(1):334–7.10.1016/j.carbon.2008.10.018Search in Google Scholar
[104] Xu Y, Liu Z, Zhang X, Wang Y, Tian J, Huang Y, et al. A Graphene Hybrid Material Covalently Functionalized with Porphyrin: Synthesis and Optical Limiting Property. Adv Mater 2009;21(12):1275–9.10.1002/adma.200801617Search in Google Scholar
[105] Yu D, Yang Y, Durstock M, Baek JB, Dai L. Soluble P3HT-grafted graphene for efficient bilayer-heterojunction photovoltaic devices. ACS Nano 2010;4(10):5633–40.10.1021/nn101671tSearch in Google Scholar PubMed
[106] Si Y, Samulski ET. Synthesis of water soluble graphene. Nano Lett 2008;8(6):1679–82.10.1021/nl080604hSearch in Google Scholar PubMed
[107] DeTar DF, Kosuge T. Mechanisms of diazonium salt reactions. VI. The reactions of diazonium salts with alcohols under acidic conditions; evidence for hydride transfer1. J Am Chem Soc 1958;80(22):6072–7.10.1021/ja01555a044Search in Google Scholar
[108] Sharma R, Baik JH, Perera CJ, Strano MS. Anomalously large reactivity of single graphene layers and edges toward electron transfer chemistries. Nano Lett 2010;10(2):398–405.10.1021/nl902741xSearch in Google Scholar PubMed PubMed Central
[109] Pinson J, Podvorica F. Attachment of organic layers to conductive or semiconductive surfaces by reduction of diazonium salts. Chem Soc Rev 2005;34(5):429–39.10.1039/b406228kSearch in Google Scholar PubMed
[110] Xiao L, Liao L, Liu L. Chemical modification of graphene oxide with carbethoxycarbene under microwave irradiation. Chem Phys Lett 2013;556:376–9.10.1016/j.cplett.2012.11.084Search in Google Scholar
[111] Collins WR, Lewandowski W, Schmois E, Walish J, Swager TM. Claisen rearrangement of graphite oxide: a route to covalently functionalized graphenes. Angew Chem Int Ed 2011;50(38):8848–52.10.1002/anie.201101371Search in Google Scholar PubMed
[112] Collins WR, Schmois E, Swager TM. Graphene oxide as an electrophile for carbon nucleophiles. Chem Commun 2011;47(31):8790–2.10.1039/c1cc12829aSearch in Google Scholar PubMed
[113] Sydlik SA, Swager TM. Functional graphenic materials via a Johnson−Claisen rearrangement. Adv Funct Mater 2013;23(15):1873–82.10.1002/adfm.201201954Search in Google Scholar
[114] Johnson WS, Werthemann L, Bartlett WR, Brocksom TJ, Li T-T, Faulkner DJ, et al. Simple stereoselective version of the Claisen rearrangement leading to trans-trisubstituted olefinic bonds. Synthesis of squalene. J Am Chem Soc 1970;92(3):741–3.10.1021/ja00706a074Search in Google Scholar
[115] Kim F, Luo JY, Cruz-Silva R, Cote LJ, Sohn K, Huang JX. Self-propagating domino-like reactions in oxidized graphite. Adv Funct Mater 2010;20(17):2867–73.10.1002/adfm.201000736Search in Google Scholar
[116] Krishnan D, Kim F, Luo J, Cruz-Silva R, Cote LJ, Jang HD, et al. Energetic graphene oxide: challenges and opportunities. Nano Today 2012;7(2):137–52.10.1016/j.nantod.2012.02.003Search in Google Scholar
[117] Qiu Y, Guo F, Hurt R, Kulaots I. Explosive thermal reduction of graphene oxide-based materials: mechanism and safety implications. Carbon 2014;72:215–23.10.1016/j.carbon.2014.02.005Search in Google Scholar PubMed PubMed Central
[118] Eigler S, Dotzer C, Hirsch A, Enzelberger M, Müller P. Formation and decomposition of CO2 intercalated graphene oxide. Chem Mater 2012;24(7):1276–82.10.1021/cm203223zSearch in Google Scholar
[119] Dimiev AM, Alemany LB, Tour JM. Graphene oxide. Origin of acidity, its instability in water, and a new dynamic structural model. ACS Nano 2013;7(1):576–88.10.1021/nn3047378Search in Google Scholar PubMed
[120] Dimiev AM, Polson TA. Contesting the two-component structural model of graphene oxide and reexamining the chemistry of graphene oxide in basic media. Carbon 2015;93:544–54.10.1016/j.carbon.2015.05.058Search in Google Scholar
[121] Eigler S, Grimm S, Hirsch A. Investigation of the thermal stability of the carbon framework of graphene oxide. Chem Eur J 2014;20(4):984–9.10.1002/chem.201304048Search in Google Scholar PubMed
[122] Eigler S, Grimm S, Enzelberger-Heim M, Müller P, Hirsch A. Graphene oxide efficiency of reducing agents. Chem Commun 2013;49(67):7391–3.10.1039/c3cc43612hSearch in Google Scholar PubMed
[123] Chua CK, Pumera M. Chemical reduction of graphene oxide: a synthetic chemistry viewpoint. Chem Soc Rev 2014;43(1):291–312.10.1039/C3CS60303BSearch in Google Scholar
[124] Pei S, Cheng H-M. The reduction of graphene oxide. Carbon 2012;50(9):3210–28.10.1016/j.carbon.2011.11.010Search in Google Scholar
[125] Eigler S, Hu Y, Ishii Y, Hirsch A. Controlled functionalization of graphene oxide with sodium azide. Nanoscale 2013;5(24):12136–9.10.1039/c3nr04332kSearch in Google Scholar PubMed PubMed Central
[126] Eigler S, Grimm S, Hof F, Hirsch A. Graphene oxide: a stable carbon framework for functionalization. J Mater Chem A 2013;1(38):11559–62.10.1039/c3ta12975fSearch in Google Scholar
[127] Halbig C, Rietsch P, Eigler S. Towards the synthesis of graphene azide from graphene oxide. Molecules 2015;20(12):21050–7.10.3390/molecules201219747Search in Google Scholar PubMed PubMed Central
[128] Wang Z, Eigler S, Ishii Y, Hu Y, Papp C, Lytken O, et al. A facile approach to synthesize an oxo-functionalized graphene/polymer composite for low-voltage operating memory devices. J Mater Chem C 2015;3(33):8595–604.10.1039/C5TC01861GSearch in Google Scholar
[129] Wang Z, Eigler S, Halik M. Scalable self-assembled reduced graphene oxide transistors on flexible substrate. Appl Phys Lett 2014;104(24):243502.10.1063/1.4884064Search in Google Scholar
[130] Kirschner J, Wang Z, Eigler S, Steinrück HP, Jager CM, Clark T, et al. Driving forces for the self-assembly of graphene oxide on organic monolayers. Nanoscale 2014;6(19):11344–50.10.1039/C4NR02527JSearch in Google Scholar
[131] Wang Z, Mohammadzadeh S, Schmaltz T, Kirschner J, Khassanov A, Eigler S, et al. Region-selective self-assembly of functionalized carbon allotropes from solution. ACS Nano 2013;7(12):11427–34.10.1021/nn405488nSearch in Google Scholar PubMed
© 2017 Walter de Gruyter GmbH, Berlin/Boston