
Determination of the degree of recrystallization of a microalloyed HSLA steel by using metallographic methods
-
S. Monschein
Stefan Monschein was born 1992 in Bruck an der Mur (Austria) and studied materials science at the Montanuniversität Leoben (Austria). He is now working on his PhD thesis about the improvement of the properties of high performance wire products.Nikolaus Kostwein was born 1996 in Klagenfurt (Austria) and studies materials science at the Montanuniversität Leoben (Austria). He is currently working on his master’s thesis dealing with the solubility and precipitation of Niobium in thermomechanically processed steel plates.

Abstract
On the one hand, this work aims at describing the grain elongation of compressed samples of a microalloyed high-strength steel using appropriate parameters. On the other hand, the degree of recrystallization is to be determined based on the samples’ grain elongation. For this purpose, single-hit compression tests were performed with varying test parameter settings using a deformation dilatometer to generate samples characterized by various degrees of recrystallization. Three parameters were chosen to describe the grain elongation. It was found that the parameter defining the ratio length/ width of the original grain provides the highest sensitivity regarding changes in the grain elongation. Aiming at determining the degree of recrystallization, a critical grain elongation threshold value was determined below which it is assumed that a grain is recrystallized. The results show that choosing the right threshold value allows an automated determination of the degree of recrystallization of a microalloyed high-strength steel in the light microscope.
Kurzfassung
Ziel dieser Arbeit war es einerseits die Kornstreckung von gestauchten Proben eines mikrolegierten hochfesten Stahls durch geeignete Parameter zu beschreiben und andererseits anhand der Kornstreckung den Rekristallisationsgrad der Proben zu ermitteln. Hierfür wurden mit Hilfe eines Umformdilatometers Einzelstauchversuche mit variierenden Versuchsparametern durchgeführt, um Proben mit unterschiedlichen Rekristallisationsgraden zu erzeugen. Für die Beschreibung der Kornstreckung wurden drei Parameter gewählt, wobei sich zeigte, dass jener Parameter, der das Längen-zuBreiten-Verhältnis des Originalkorns beschreibt, die größte Sensitivität im Hinblick auf Veränderungen der Kornstreckung liefert. Für die Bestimmung des Rekristallisationsgrads wurde ein kritischer Grenzwert der Kornstreckung ermittelt, unter welchem ein Korn als rekristallisiert angenommen wurde. Die Ergebnisse zeigen, dass die Wahl des richtigen Grenzwerts eine automatisierte lichtmikroskopische Bestimmung des Rekristallisationsgrads eines mikrolegierten hochfesten Stahls ermöglicht.
1 Introduction
High-strength low-alloyed (HSLA) steels belong to the group of microalloyed steels. Owing to a combination of thermomechanical rolling processes and the addition of microalloying elements such as niobium, titanium or vanadium, they are characterized by excellent strength and toughness while also providing good weldability and processability [1]. Thermomechanical rolling processes are to provide a possibly finegrained microstructure which has a positive impact on both strength and toughness [2]. When niobium is added, the non-recrystallization temperature (TNR), the temperature below which no complete recrystallization of the microstructure occurs between the rolling steps, will rise [3]. This can be explained by the solute-drag effect [3, 4] as well as by the formation of strain-induced NbC precipitates [3, 5]. During thermomechanical rolling, these effects are deliberately sought to obtain a non-recrystallized, flattened post finish rolling “pancake structure”. Owing to the great number of nucleation sites, subsequent cooling induces a fine-grained microstructure. As early as when choosing the furnace temperature, attention must be paid to bring into solution the niobium present in the alloy to take full advantage of the positive effect of niobium during the thermomechanical rolling process. The material is therefore typically annealed in the range of about 1200 °C thus increasing the risk of grain coarsening. For this reason, titanium is used as an additional alloying element. On the one hand, it forms thermally stable TiN precipitates which, at elevated temperatures, inhibit the grain growth. On the other hand, due to its high affinity for nitrogen, titanium inhibits the formation of Nb(C,N) which facilitates the dissolution of NbC precipitates [2, 6]. The kinetics of the microalloying precipitates as well as the recrystallization behavior are highly dependent on the choice of parameters for the rolling process. Another aspect to be taken into account is the fact that the microalloying elements may themselves interact. Studies already provide evidence for such interactions of niobium and titanium [7, 8, 9, 10]. It is therefore imperative to understand the effect of microalloying elements on the precipitation kinetics and the recrystallization behavior to choose the optimum rolling parameters.
In the past, double-hit compression tests have proven their worth in investigating the influence of the temperature, the degree of deformation, and the rate of deformation on the static recrystallization and the precipitation behavior of microalloyed steels [8, 11, 12, 13, 14, 15]. These tests represent an indirect method for the determination of the statistical recrystallization based on analyzing the flow curves of two consecutive compressions. However, these tests have the disadvantage of an elaborate sample preparation and the fact that the degree of recrystallization of rolled products cannot be directly determined in the as-rolled condition.
Therefore, other indirect and direct methods, such as metallographic methods using the light optical microscopy (LOM) [16, 17, 18, 19], microhardness measurements [20, 21], or electron backscatter diffraction, provide an alternative for the determination of the degree of recrystallization [20, 21, 22].
Light microscopes are part of the standard metallography equipment. Determining the degree of recrystallization using light-optical methods is thus the simplest and cheapest of the above mentioned possibilities. The basic principle of this technique used to determine the recrystallization degree of steels is to “freeze” the deformed austenitic microstructure by direct quenching from the austenite region which induces the formation of a martensitic microstructure. A suitable etching methodology using picric acid offers the possibility to reveal the prior austenite grain boundaries (PAGB) [23, 24]. In previous works, the degree of recrystallization was determined from the ratio of the recrystallized grains’ intersections to the total number of all intersections using a line intercept method [17, 19]. However, one disadvantage of this method is the fact that one must decide for each and every single grain whether it is considered a recrystallized or a non-recrystallized grain which complicates an automated evaluation of the degree of recrystallization.
As part of this work, deformation dilatometer compression tests were performed on a microalloyed HSLA steel aiming at producing samples with different degrees of recrystallization. Here, the main objective was to develop a methodology to directly determine the degree of recrystallization of compressed samples in the light microscope. For this purpose, a grain elongation threshold value was used as a measure to decide whether a grain is considered as recrystallized or non-recrystallized. Therefore, this work also aims at defining the grain elongation based on appropriate parameters and at comparing these parameters. The timedependent degree of recrystallization of the steel examined in this work was already subject of prior double-hit compression tests and investigations by the authors [8]. Thus, the results of the prior published work could be used to determine suitable parameters to determine the recrystallization degree from the analysis of the grain elongation.
2 Experimental Work
Table 1 outlines the chemical composition of the examined microalloyed steel.
Chemical composition of the examined microalloyed steel.
Tabelle 1 Chemische Zusammensetzung des untersuchten mikrolegierten Stahls.
| C | Mn | Ni | Cr | Mo | Si | Nb | Ti | Fe | |
|---|---|---|---|---|---|---|---|---|---|
| m% | 0.22 | 1.27 | 0.48 | 0.49 | 0.24 | 0.22 | 0.026 | 0.015 | bal. |
Single-hit compression tests were performed applying varying test parameters to produce samples with various degrees of recrystallization. The single-hit compression tests were carried out using a TA Instruments dilatometer DIL 805 A/D. The samples had a diameter of 5 mm and a length of 10 mm. They were manufactured by machining from rolled starting material. A type S thermocouple was welded to the samples to control the temperature during the test.
Figure 1 is a schematic illustration of the time-temperature-deformation schedule of the single-hit compression tests. In the first series of tests, the samples were heated to an annealing temperature (Ta) of 1100 °C at a heating rate of +10 °Cs-1. After an annealing time (ta) of 300 s, they were cooled down to the deformation temperature (Tdef) of 850 °C at a cooling rate of -10 °Cs-1. After a holding time of 30 s, which was to ensure a uniform temperature profile along the sample cross section, the samples were compressed up to a degree of deformation (φ) of 0.2 at a strain rate
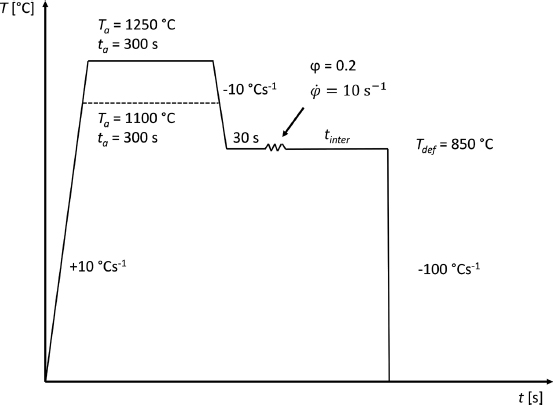
Schematic representation of the time-temperature-deformation schedule for the single-hit compression tests. Step 1: heating the sample to the annealing temperature Ta = 1100 °C or 1250 °C at a heating rate of +10 °Cs-1; step 2: holding time for the annealing temperature ta = 300 s; step 3: cooling down to the deformation temperature Tdef of 850 °C at a cooling rate of -10 °Cs-1; step 4: holding time of 30 s to ensure a uniform heating of the sample cross section; step 5: compression of the sample at a degree of deformation φ of 0,2 and a rate of deformation
Bild 1 Schematische Darstellung des Zeit-Temperatur-Umform-Verlaufs der Einzelstauchversuche. Schritt 1: Aufheizen der Probe auf Glühtemperatur Ta = 1100 °C, bzw. 1250 °C mit einer Aufheizrate von +10 °Cs-1; Schritt 2: Haltezeit der Glühtemperatur ta = 300 s; Schritt 3: Abkühlen auf die Umformtemperatur Tdef = 850 °C mit einer Kühlrate von -10 °Cs-1; Schritt 4: Haltezeit von 30 s, um eine gleichmäßige Durchwärmung des Probenquerschnitts zu gewährleisten; Schritt 5: Stauchung der Probe mit einem Umformgrad φ = 0,2 und einer Umformrate
After the single-hit compression tests, the samples were cut in longitudinal direction to examine the microstructure of the compressed and quenched samples. The cut samples were mounted with the aid of a hot mounting press. They were ground up to a grit of 4000 using SiC grinding paper and subsequently polished up to a grit of 1 μm with diamond suspension. The polished samples were etched using the CRIDA CHEMIE etchant CRIDA QT plus to reveal the PAGB structure within the martensitic microstructure. For this purpose, the freshly polished samples were thoroughly cleaned using isopropanol and immersed in the etching solution for 15 minutes at room temperature. When the etching attack was weak or insufficient, the samples were cleaned using isopropanol and re-polished for a minute using a 1 μm diamond suspension. Subsequent to a second isopropanol cleaning process, the re-polished samples were immersed in the etching solution for another 5–10 minutes. The structure of the PAGB was made visible using a ZEISS light microscope Axio Imager M1. At least three LOM images were acquired of adjacent positions of the compressed samples for the quantitative evaluation of the grain elongation to obtain statistical information on the determined grain elongation values (see Figure 2). In this context, the magnification of the microscope was chosen such that the image contained between 400 and 600 grains.
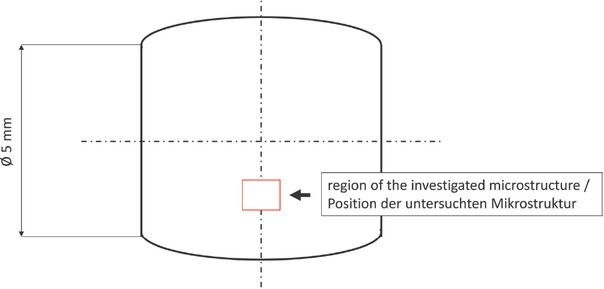
Schematic representation of the compressed samples to illustrate the position of the examined microstructure.
Bild 2 Skizze der gestauchten Proben zur Beschreibung der Position der untersuchten Mikrostruktur.
The quantitative evaluation of the grain elongation was carried out using the image analysis software MIPAR 3.3.4. The software not only allows an automated identification of individual grains but also provides a description of the grains’ shape based on various parameters. Three different parameters were applied in the present work to quantitatively determine the grain elongation: the Y/X aspect ratio (ARY/X) described in formula 1, the a/b aspect ratio (ARa/b) described in formula 2, and the eccentricity (E) described in formula 3.
In formula 1, Y and X describe the maximum grain diameters in the vertical and horizontal image direction of the respective grain. In order for ARY/X to be used, the LOM image needs to be oriented in a way such that the samples’ compression plane in the longitudinal section runs parallel to the vertical image axis. An ellipse was fitted into each grain using the evaluation software in order to determine ARa/b and E, where a describes the length of the major axis and b the length of the minor axis of the fitted ellipse. Figure 3 shows a LOM image of an etched sample section subsequent to a single-hit compression test after a Ta of 1250 °C and a tinter of 10 s as well as a schematic illustration of the grain shape using the grain parameters Y, X, a, and b.
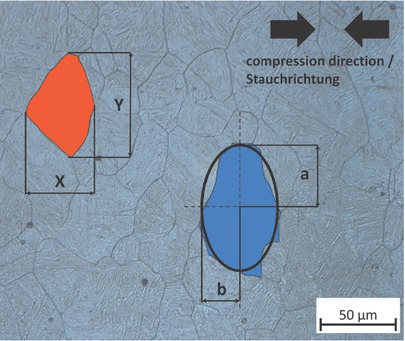
LOM image of an etched section of a compressed sample after a Ta = 1250 °C and tinter = 10 s. The red and blue grains are to illustrate the grain parameters Y, X, a, and b.
Bild 3 LIMI-Aufnahme eines geätzten Schliffs einer gestauchten Probe nach einer Ta = 1250 °C und tinter = 10 s. Das rote und blaue Korn dienen zur Veranschaulichung der Kornparameter Y, X, a und b.
The curves were normalized in order to improve the comparability of the time-dependent profile of the grain elongation (see formula 4).
Formula 4 describes the determination of the normalized grain elongation (eg.norm), where eg,i is the grain elongation after tinter = i and eg,t0 is the mean grain elongation after a tinter of 0 s (direct quenching after compression).
In [8], the recrystallization behavior was indirectly determined from the flow curve of two successive compressions. The tests in the present work differ only in that the samples were directly quenched after tinter. As the degree of recrystallization is a function of tinter, the same degree of recrystallization was obtained, regardless of whether a second compression was carried out. Therefore, the recrystallization values indirectly determined by the authors [8] can be used in this work to determine appropriate parameters for the light microscope analysis of the degree of recrystallization.
Similar to what Chen et al. [20] described for the examination of an aluminum alloy, a criterion was introduced in this work which defines when a grain is considered as recrystallized. A critical threshold value (fcrit) was defined as a criterion for the three parameters of the grain elongation (ARY/X, ARa/b, and E). The degree of recrystallization (Rxx) of the microstructure is subsequently obtained from formula 5:
Here, ARxx describes the total area of all recrystallized grains in the respective LOM image, whereas Atotal is the total area of all grains, regardless of whether they are recrystallized or not.
The aim of the work was to choose fcrit for ARY/X, ARa/b, and E such that a difference between the recrystallization values determined from formula 5 and the values previously determined by the authors [8] is as small as possible. For this purpose, fcrit was varied and the results were plotted together with the results of the double-hit compression test. In order for the deviation of the curves showing the recrystallization values of the double-hit compression tests [8] and the recrystallization values of the light microscope examinations after the single-hit compression tests to be quantified, the Euclidean distance (dE) between the measurement values was used. This process is described in formula 6:
Thus, the degree of recrystallization after the double-hit compression tests at the time i (Rxxi,DH) and the mean value of the degree of recrystallization after the single-hit compression tests at the same instant (Rxxi,SH) is required in order to determine dE between the results of the double-hit compression tests and the single-hit compression tests. In general, the progression of the curves becomes increasingly similar with decreasing dE.
3 Results
3.1 Quantitative determination of the grain elongation
Figure 4 shows the progression of the eg.norm curve over time after the single-hit compression tests, described by the three parameters ARY/X, ARa/b, and E for different Ta, respectively. Figure 4a shows the value chart for a Ta of 1100 °C in which a temporal decrease of the grain elongation can be observed for all three parameters. The highest decrease of eg.norm = 0.92 at a tinter of 10 s to 0.70 at a tinter of 2000 s can be observed for ARY/X, whereas the grain elongation for ARa/b only decreases from 0.95 to 0.80 and from 0.97 to 0.90 for E. For a tinter of between 100 s and 300 s, the eg.norm curves for ARa/b and Eflatten. Figure 4b shows the progression of the eg.norm curve for Ta = 1250 °C over time. Here, eg.norm remains approximately constant for all three parameters up to a tinter of 100 s, while values subsequently decrease and a plateau is formed for a tinter of between 100 and 400 s. As already outlined for a Ta of 1100 °C, the ARY/X curve progression over time shows the largest decrease of eg.norm for a Ta of 1250 °C resulting in the most pronounced plateau formation in the curves’ progression.
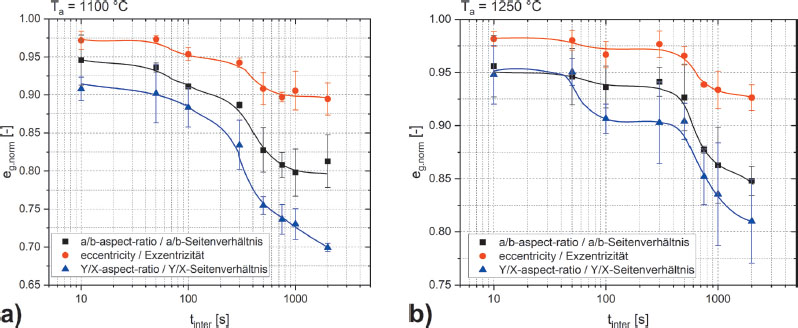
Profile of eg.norm over time after the single compression tests, described by the parameters ARY/X, Ara/b, and E for a Ta of a) 1100 °C and b) 1250 °C.
Bild 4a und b zeitlicher Verlauf von eg.norm nach den Einzelstauchversuchen, beschrieben durch die Parameter ARY/X, ARa/b und E für eine Ta von a) 1100 °C und b) 1250 °C.
![Figure 5a to f Profile of the recrystallization over time as a function of fcrit for the different grain elongation parameters and different Ta as well as the profile of the recrystallization previously determined by the authors [8] in double-hit compression tests. a) ARY/X, Ta = 1100 °C; b) ARY/X, Ta = 1250 °C; c) ARa/b, Ta = 1100 °C; d) ARa/b, Ta = 1250 °C; e) E, Ta = 1100 °C; f) E, Ta = 1250 °C.Bild 5a bis f zeitlicher Verlauf der Rekristallisation abhängig von fcrit für die unterschiedlichen Kornstreckparameter und unterschiedliche Ta, sowie der von den Autoren [8] vorab durch Doppelstauchversuche ermittelte Verlauf der Rekristallisation. a) ARY/X, T a = 1100 °C; b) ARY/X, T a = 1250 °C; c) ARa/b, Ta = 1100 °C; d) ARa/b, Ta = 1250 °C; e) E, Ta = 1100 °C; f) E, Ta = 1250 °C.](/document/doi/10.1515/pm-2022-1007/asset/graphic/j_pm-2022-1007_fig_005.jpg)
Profile of the recrystallization over time as a function of fcrit for the different grain elongation parameters and different Ta as well as the profile of the recrystallization previously determined by the authors [8] in double-hit compression tests. a) ARY/X, Ta = 1100 °C; b) ARY/X, Ta = 1250 °C; c) ARa/b, Ta = 1100 °C; d) ARa/b, Ta = 1250 °C; e) E, Ta = 1100 °C; f) E, Ta = 1250 °C.
Bild 5a bis f zeitlicher Verlauf der Rekristallisation abhängig von fcrit für die unterschiedlichen Kornstreckparameter und unterschiedliche Ta, sowie der von den Autoren [8] vorab durch Doppelstauchversuche ermittelte Verlauf der Rekristallisation. a) ARY/X, T a = 1100 °C; b) ARY/X, T a = 1250 °C; c) ARa/b, Ta = 1100 °C; d) ARa/b, Ta = 1250 °C; e) E, Ta = 1100 °C; f) E, Ta = 1250 °C.
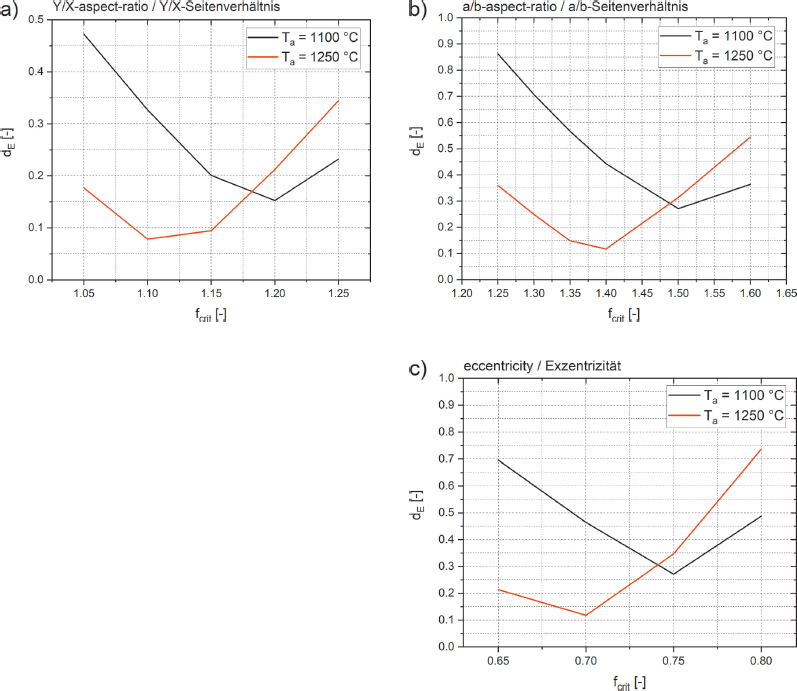
Profile of dE over fcrit for various Ta. a) grain elongation parameter: ARY/X b) grain elongation parameter: ARa/b c) grain elongation parameter: E.
Bild 6 Verlauf von dE über fcrit für unterschiedliche Ta. a) Kornstreckungsparameter: ARY/X b) Kornstreckungsparameter: ARa/b c) Kornstreckungsparameter: E.
3.2 Determination of the degree of recrystallization
Figure 5 shows the profiles for the degree of recrystallization for different annealing temperatures (1100 °C and 1250 °C) over time determined by the authors in [8] in doublehit compression tests’ as well as the recrystallization degree after the single-hit compression tests determined from formula 5 as a function of the grain elongation parameter and fcrit. Figure 5a shows the curves for the recrystallization established from ARY/X after a Ta of 1100 °C and a variation of fcrit between 1.05 and 1.25. For tinter < 300 s, a fcrit of 1.20 corresponds most closely to the recrystallization curve after the double-hit compression tests. For longer tinter, a better agreement is obtained for fcrit = 1.15. In Figure 5b, the curve for ARY/X and a fcrit of 1.10 shows the best agreement with the values of the double-hit compression tests after a Ta of 1250 °C up to a tinter of 500 s. For tinter > 500 s, a better agreement is obtained for a fcrit of 1.15. After a Ta of 1250 °C, the double-hit compression tests result in the formation of a plateau for tinter between 100 s and 500 s. This could be attributed to the formation of strain-induced Nb(C,N) precipitates [8]. All curves in Figure 5b show the formation of a plateau at the same position, regardless of fcrit. dE was used as a measure to quantify the similarity of the recrystallization profiles as a function of fcrit after the double-hit compression tests [8] and single-hit compression tests (see formula 6). Figure 6a shows the progression of dE as a function of Ta and fcrit, where ARY/X was included as a grain elongation parameter. After a Ta of 1100 °C, the progression of dE shows a minimum at a fcrit of 1.20, whereas a rise in Ta to 1250 °C leads to a further reduction of the minimum to fcrit = 1.10.
Figure 5c shows the recrystallization profiles for a Ta of 1100 °C determined from ARa/b. It is found that a fcrit of 1.50 gives the best agreement with the recrystallization curve of the double-hit compression tests, this is further confirmed by a minimum of dE in Figure 6b. Figure 5d shows the profiles for a Ta of 1250 °C determined from ARa/b. Except for a tinter of 10 s and 100 s, the profile for a fcrit = 1.40 gives the best agreement with the curve after the double-hit compression tests. This is also confirmed by the occurrence of a minimum at the aforementioned fcrit in the profile of dE in Figure 6b.
The recrystallization curves over time in which the eccentricity of the fitted ellipse was used as a grain elongation parameter are shown in Figure 5e (Ta = 1100 °C) and Figure 5f (Ta = 1250 °C). A Ta of 1100 °C gives the best agreement for a fcrit of 0.75, though there are two outliers at a tinter of 10 s and 2000 s. After a Ta = 1250 °C, the profile for a fcrit = 0.70 gives the best agreement, whereas two outliers occurred after a tinter of 10 s and 100 s (here, a fcrit of 0.65 gives a better agreement). In Figure 6c the minima of the dE curves can be found at a fcrit of 0.75 for a Ta of 1100 °C and at a fcrit of 0.70 for a Ta of 1250 °C. The dE curves thus confirm the visual assessment of the profiles described above.
4 Discussion
The present work mainly aimed at determining the degree of recrystallization of a microalloyed steel by analyzing compressed samples using a light microscope. For that, single-hit compression tests were carried out with the aid of a deformation dilatometer to produce compressed samples with different degrees of recrystallization.
In previous works, for example those by Gomez et al. [17] and Fernandez et al. [19], a line intercept method was used to analyze the degree of recrystallization of microalloyed steels. In both works, the degree of recrystallization was calculated from the ratio of line intersections of recrystallized grains to the number of intersections of all grains. However, both works do not provide any detailed information on which grains were considered recrystallized and which were not. Chen et al. [20] investigated the recrystallization behavior of an aluminum alloy. However, they chose another approach. In their work, they arbitrarily chose a threshold value of the ARY/X of 1.75 as a criterion to decide whether a grain was recrystallized or not. Again, the grounds for choosing this threshold value were not specified. The degree of recrystallization was subsequently calculated from the ratio of the surface area of recrystallized grains and the total surface area of all grains.
A similar approach was chosen in the present work to determine the degree of recrystallization of a microalloyed steel. Three parameters were defined in a first step to describe the grain elongation, namely ARY/X, ARa/b, and E, where ARY/X is the Y/X aspect-ratio of the elongated grain. In this context, it must be made sure that the LOM image is oriented in such a way that the samples’ compression plane runs parallel to the image axis. However, using ARY/X has the advantage over using ARa/b and E in that the ellipses do not have to be fitted into each and every grain. Thus, the grain shape directly provides information on the grain elongation.
In the next step, the profile of the grain elongation over time was normalized and the results were plotted (see Figure 4) in order to compare the curves. The same tendency can be observed for all profiles. However, it can also be observed that the ARY/X curves show the largest temporal decrease after a Ta of 1100 °C and a Ta of 1250 °C. The results of these analyses thus suggest that the ARY/X provides the highest sensitivity with regard to changes in the grain elongation. The time-dependent degree of recrystallization of the examined steels was already previously determined by the authors in double-hit compression tests. The results were published in [8]. In that work, the authors could show that a plateau formed in the recrystallization curves after a Ta of 1250 °C and between a tinter of 100 s to 500 s. This can be attributed to the formation of straininduced Nb(C,N)-precipitates. Other authors could also observe this effect in works investigating the recrystallization behavior of microalloyed steels [12, 13, 14, 15]. The profile of eg.norm in Figure 4b shows the formation of a plateau at the same position. Hence, the presented methodology is also suitable to indicate the formation of strain-induced microalloying precipitates.
In order to extrapolate the degree of recrystallization from the grain elongation, a grain elongation threshold value (fcrit) was taken as a criterion to define if a grain is considered as recrystallized or non-recrystallized. Figure 5 shows the determined recrystallization profiles for the different grain elongation parameters, as well as for the two varying annealing temperatures of 1100 °C and 1250 °C. Not only the recrystallization curves determined from the single-hit compression tests were plotted but also those based on the double-hit compression tests published by the authors in [8]. In a comparison of the curves after a Ta of 1100 °C and those after a Ta of 1250 °C, those representing the values after a higher annealing temperature are characterized by a slower recrystallization. As has already been stated above, this can be attributed to the formation of strain-induced Nb(C,N)-precipitates after a Ta = 1250 °C. In addition to that, an increase in the austenite grain size can be observed during annealing after the rise of Ta from 1100 °C to 1250 °C, which has a decelerating effect on the recrystallization owing to the lower number of nucleation sites.
The similarity of the recrystallization curves of the single-hit and the double-hit compression tests was quantified based on dE. The curves for dE plotted over fcrit shown in Figure 6 confirm the optically determined agreements of the profiles in Figure 5. The Euclidean distance is a single value. It thus does not allow any statement on the occurrence of curve outliers. Taking a closer look at the curve profiles, some isolated deviations of the degrees of recrystallization in the single-hit compression tests and the profiles of the double-hit compression tests can be observed. For ARa/b after a Ta of 1100 °C (Figure 5c), this is evidenced by a dropping degree of recrystallization between a tinter of 1000 s and 2000 s. After a Ta of 1250 °C (Figure 5d), the degrees of recrystallization of the single-hit compression tests after a tinter of 10 s and 100 s show higher values than the profiles after the double-hit compression tests. The same tendency can be observed in Figure 5e and Figure 5f where the eccentricity is used as a measure for the grain elongation. The smallest deviations between the profiles of the single-hit and the double-hit compression tests can be observed for the curves in which ARY/X is taken as a grain elongation parameter. See Figures 5a and 5b. The results of this work demonstrate that, owing also to its increased sensitivity regarding changes in the grain elongation, using ARY/X as a parameter for the grain elongation is best suited to analyze the degree of recrystallization of microalloyed steels. Figure 5a, Figure 5b, and Figure 6 thus show that a fcrit of 1.20 after a Ta of 1100 °C and a fcrit of 1.10 after a Ta of 1250 °C provide the best results when ARY/X was used as a grain elongation parameter. In concrete terms, this means that grains whose ratio grain length to grain width fall below 1.10 or 1.20, respectively, are considered as recrystallized.
In this work, it could be shown that fcrit is a function of the grain elongation parameter and that it is also slightly dependent of the deformation parameters. However, once fcrit is determined for a deformation process, the method presented here allows an automated analysis of the degree of recrystallization in microalloyed steels using the light microscope.
5 Summary
This work aimed at directly determining the degree of recrystallization of compressed samples of a microalloyed HSLA steel in the light microscope. For this purpose, singlehit compression tests were performed with varying test parameters using a deformation dilatometer to produce samples with various degrees of recrystallization. The time-dependent degree of recrystallization of the examined steels was already previously determined by the authors in doublehit compression tests. Based on the respective results, the evaluation parameters for the direct light microscope analysis of the degree of recrystallization could be adjusted in order to obtain the best possible agreement between the recrystallization curves of the single-hit and the double-hit compression tests. A critical grain elongation threshold value (fcrit) was taken as a measure to decide whether the respective grains were recrystallized or not. Three parameters were chosen to describe the grain elongation, namely the Y/X aspect-ratio (ARY/X), the a/b aspect-ratio (ARa/b), and the eccentricity (E). The results of this work can be summarized as follows:
After an annealing temperature (Ta) of 1100 °C, the curves for the normalized grain elongation (eg.norm) for all three grain elongation parameters are characterized by a temporal decrease. The most pronounced decrease can be observed for the ARY/X curve, followed by ARa/b, and E. After a Ta = 1250 °C, the profile of eg.norm over time shows a constant progression for all grain elongation parameters up to a holding time (tinter) of 100 s. A plateau is subsequently formed between a tinter of 100 s to 400 s. For this annealing temperature, the profile of ARY/X over time also shows the strongest decrease of eg.norm as well as the most pronounced plateau.
The double-hit compression tests previously performed [8] indicated that straininduced Nb(C,N) precipitates formed after a Ta = 1250 °C and a tinter of 100 s. This is evidenced by the formation of a plateau in the recrystallization diagram. With regard to the profile of eg.norm after a Ta of 1250 °C and a tinter of 100 s, all three grain elongation parameters are characterized by the same trend. The profile of eg.norm over time is therefore also suited to show the beginning of the formation of strain-induced precipitates. The most pronounced plateau is formed for ARY/X, followed by ARa/b and E.
After a Ta of 1100 °C, the recrystallization profiles for which ARY/X is chosen as a grain elongation parameter show that the best agreement of the recrystallization profiles between the double-hit and the single-hit compression tests is obtained for a fcrit of 1.20 up to a tinter of 300 s. For tinter > 300 s, a fcrit of 1.15 shows the best agreement. The Euclidean distance (dE), taken as a measure to quantify the similarity of the curves, shows the best agreement of the recrystallization profiles for a fcrit of 1.20. The curves determined from ARa/b as well as dE show that the greatest similarity for the recrystallization profiles is obtained for fcrit = 1.50 For the recrystallization profiles in which E is used as a grain elongation parameter, the best agreement is obtained after a fcrit = 0.75, though two outliers occur after a tinter of 10 s and 2000 s. dE likewise has a minimum at fcrit = 0.75, indicating the best curve agreement.
After a Ta of 1250 °C, the recrystallization profiles for which ARY/X was taken as a grain elongation parameter show that the best agreement is obtained for a fcrit of 1.10 up to a tinter of 500 s. A fcrit of 1.15 provides the best agreement for tinter > 500 s, whereas dE shows the best agreement of the recrystallization profiles for a fcrit of 1.10. dE, as well as the profiles determined from the ARa/b, show that, apart from two outliers after a tinter of 10 s and 100 s, the best agreement of the recrystallization profiles is obtained for a fcrit = 1.40. For the recrystallization profiles in which E is used as a grain elongation parameter, the best curve agreement is obtained after a fcrit = 0.70, though two outliers occur after a tinter of 10 s and 100 s. dE also has a minimum for fcrit = 0.70, indicating the best agreement of the curves.
After a Ta of 1250 °C, recrystallization profiles over time are characterized by the formation of a plateau for a tinter of between 100 s to 400 s for all three grain elongation parameters. Hence, a light microscope analysis of the grain elongation is suited for indicating the recrystallization inhibiting properties of strain-induced microalloying precipitates.
Taking the ARY/X as a grain elongation parameter is best suited for the determination of the degree of recrystallization in the light microscope. No ellipse must be fitted into each and every grain so that the grain shape itself provides information on the grain elongation. Furthermore, the ARY/X is characterized by the highest sensitivity regarding changes in the grain elongation and presents the lowest number of outliers among the recrystallization profiles.
The results of this work show that fcrit is a function of the deformation parameters and the grain elongation parameters. However, once fcrit is determined for a deformation process, this methodology allows an automated evaluation of the degree of recrystallization in the light microscope.
1 Einleitung
Hochfeste niedriglegierte (HSLA, „engl.: highstrength low-alloyed“) Stähle zählen zur Gruppe der mikrolegierten Stähle und erreichen durch eine Kombination von thermomechanischen Walzprozessen und der Zugabe von Mikrolegierungselementen, wie zum Beispiel Niob, Titan oder Vanadium, hervorragende Festigkeiten und Zähigkeiten bei ebenso guter Schweiß- und Verarbeitbarkeit [1]. Das Ziel der thermomechanischen Walzprozesse besteht darin, ein möglichst feinkörniges Gefüge nach dem Walzen zu erhalten, da dieses gleichzeitig sowohl die Festigkeit, als auch Zähigkeit positiv beeinflusst [2]. Durch die Zugabe von Niob steigt die Rekristallisationsstopptemperatur (TNR, „engl.: non-recrystallization temperature“) an, die jene Temperatur ist, unter der es zu keiner vollständigen Rekristallisation des Gefüges zwischen den Walzschritten kommt [3]. Erklärt werden kann dies einerseits durch den „Solute-Drag“-Effekt [3, 4], als auch durch die Bildung dehnungsinduzierter NbC-Ausscheidungen [3, 5]. Beim thermomechanischen Walzen werden diese Effekte bewusstgewählt, um nach dem Endwalzen eine nicht rekristallisierte, flachgedrückte Gefügestruktur („engl.: pancake structure“) zu erhalten. Bei der anschließenden Abkühlung resultiert daraus, aufgrund der großen Anzahl an Keimstellen, ein feinkörniges Gefüge. Um die positive Wirkung von Niob beim thermomechanischen Walzen optimal nutzen zu können, muss bereits durch die Wahl der Ofentemperatur darauf geachtet werden, das in der Legierung befindliche Niob in Lösung zu bringen. Üblicherweise wird daher im Bereich um 1200 °C geglüht, wodurch das Risiko von Kornvergröberung erhöht wird. Aus diesem Grund kommt Titan als weiteres Legierungselement zum Einsatz. Dieses bildet einerseits thermisch stabile TiN-Ausscheidungen, welche das Kornwachstum bei erhöhten Temperaturen hemmen. Andererseits hindert Titan aufgrund der hohen Affinität zu Stickstoff die Bildung von Nb(C,N), was das Auflösen von NbC-Ausscheidungen begünstigt [2, 6]. Die Kinetik der Mikrolegierungsausscheidungen als auch das Rekristallisationsverhalten sind stark abhängig von der Wahl der Parameter während des Walzprozesses. Ebenfalls muss berücksichtigt werden, dass es zu einer Wechselwirkung der Mikrolegierungselemente selbst kommen kann, die für Niob und Titan bereits in Studien gezeigt wurde [7, 8, 9, 10]. Für die Wahl der optimalen Walzparameter ist ein Verständnis der Wirkungsweise der Mikrolegierungselemente auf die Ausscheidungskinetik und das Rekristallisationsverhalten daher essentiell.
In der Vergangenheit haben sich Doppelstauchversuche („engl.: double-hit deformation tests“) bewährt, um den Einfluss von Temperatur, Umformgrad und Umformrate auf die statische Rekristallisation sowie das Ausscheidungsverhalten mikrolegierter Stähle zu untersuchen [8, 11, 12, 13, 14, 15]. Bei diesen Versuchen handelt es sich um eine indirekte Methode zur Bestimmung der statischen Rekristallisation durch Analyse der Fließkurven zweier aufeinanderfolgender Stauchungen. Ein Nachteil dieser Versuche ist jedoch einerseits die aufwendige Probenfertigung und andererseits, dass der Rekristallisationsgrad von gewalzten Produkten nicht direkt im walzharten Zustand ermittelt werden kann.
Als Alternative bieten sich daher weitere indirekte sowie direkte Methoden für die Bestimmung des Rekristallisationsgrads an, wie beispielsweise lichtmikroskopische (LIMI) metallographische Methoden [16, 17, 18, 19], Mikrohärtemessungen [20, 21] oder die Elektronenrückstreubeugung („engl.: electron backscatter diffraction“) [20, 21, 22].
Ein Lichtmikroskop zählt zum Standardrepertoire in der Metallographie, weswegen die Ermittlung des Rekristallisationsgrads durch lichtoptische Methoden die vergleichsweise einfachste und günstigste der oben genannten Möglichkeiten bietet. Das Grundprinzip dieser Technik bei der Ermittlung des Rekristallisationsgrads von Stählen besteht darin, das verformte austenitische Gefüge durch direktes Abschrecken aus dem Austenitgebiet einzufrieren, wodurch es zur Ausbildung eines martensitischen Gefüges kommt. Durch die Wahl einer geeigneten, auf Pikrinsäure basierenden Ätzmethodik ist es anschließend möglich, die ehemaligen Austenitkorngrenzen (PAGB, „engl.: prior austenite grain boundaries“) sichtbar zu machen [23, 24]. Mittels eines Linienschnittverfahrens wurde in vergangenen Arbeiten [17, 19] der Rekristallisationsgrad aus dem Verhältnis der Schnittpunkte der rekristallisierten Körner zur Gesamtzahl aller Schnittpunkte ermittelt. Ein Nachteil dieser Methodik besteht jedoch darin, dass für jedes einzelne Korn individuell bestimmt werden muss, ob dieses zu den rekristallisierten oder nicht rekristallisierten Körnern gezählt wird. Dies erschwert eine automatisierte Auswertung des Rekristallisationsgrads.
In dieser Arbeit wurden mit einem Umformdilatometer Einzelstauchversuche an einem mikrolegierten HSLA-Stahl durchgeführt, mit dem Ziel, Proben mit unterschiedlichen Rekristallisationsgraden zu erzeugen. Das Hauptziel dieser Arbeit war es, eine Methodik zu entwickeln, um den Rekristallisationsgrad von gestauchten Proben direkt lichtmikroskopisch zu ermitteln. Hierfür wurde ein Grenzwert der Kornstreckung als Maß herangezogen, um zu entscheiden, ob ein Korn als rekristallisiert oder nicht rekristallisiert angenommen wird. Aus diesem Grund war es ein weiteres Ziel dieser Arbeit, die Kornstreckung über geeignete Parameter zu definieren und diese miteinander zu vergleichen. Der zeitabhängige Rekristallisationsgrad des in dieser Arbeit untersuchten Stahls wurde von den Autoren bereits vorab durch Doppelstauchversuche untersucht [8], weswegen die Ergebnisse der vorab publizierten Arbeit verwendet werden konnten, um geeignete Parameter für die Ermittlung des Rekristallisationsgrads aus der Analyse der Kornstreckung zu ermitteln.
2 Experimentelle Arbeit
Die chemische Zusammensetzung des untersuchten mikrolegierten Stahls befindet sich in Tabelle 1.
Um Proben mit unterschiedlichen Rekristallisationsgraden zu erzeugen wurden Einzelstauchversuche mit variierenden Versuchsparametern durchgeführt. Die Einzelstauchversuche wurden mit einem Dilatometer DIL 805 A/D der Firma TA Instruments realisiert. Die Proben hatten einen Durchmesser von 5 mm und eine Länge von 10 mm und wurden durch zerspanende Methoden aus dem gewalzten Ausgangsmaterial gefertigt. Um die Temperatur während des Versuchs zu steuern wurde ein Thermoelement Typ S an den Proben angeschweißt.
Bild 1 zeigt schematisch den Temperatur-Zeit-Umform-Verlauf der durchgeführten Einzelstauchversuche. Die Proben wurden in der ersten Versuchsreihe mit einer Heizrate von +10 °Cs-1 auf eine Glühtemperatur (Ta) von 1100 °C aufgeheizt und nach einer Glühzeit (ta) von 300 s mit einer Abkühlrate von -10 °Cs-1 auf die Umformtemperatur (Tdef) von 850 °C abgekühlt. Nach einer Haltezeit von 30 s, welche einen gleichmäßigen Temperaturverlauf entlang des Probenquerschnitts gewährleisten sollte, wurden die Proben mit einer Dehnrate
Um die Mikrostruktur der gestauchten und abgeschreckten Proben untersuchen zu können, wurden diese nach den Einzelstauchversuchen in Längsrichtung zerteilt. Die zerteilten Proben wurden mit einer Warmeinbettpresse eingebettet, mit SiC-Schleifpapier bis zu einer Körnung von 4000 geschliffen und anschließend bis zu einer Körnung von 1 μm mit Diamantsuspension poliert. Um die Struktur der PAGB innerhalb des martensitischen Gefüges sichtbar zu machen, wurden die polierten Proben mit dem Ätzmittel CRIDA QT plus der Firma CRIDA CHEMIE geätzt. Hierzu wurden die frisch polierten Proben gründlich mit Isopropanol gereinigt und bei Raumtemperatur für 15 Minuten in die Ätzlösung gelegt. Im Fall eines schwachen, beziehungsweise unzureichenden Ätzangriffs, wurden die Proben mit Isopropanol gereinigt und circa eine Minute mit einer Diamantsuspension von 1 μm nachpoliert. Nach einer erneuten Reinigung mit Isopropanol wurden die nachpolierten Proben für weitere 5-10 Minuten in die Ätzlösung getaucht. Die Struktur der PAGB wurde mittels Lichtmikroskopie unter Verwendung eines ZEISS Axio Imager M1 Mikroskops sichtbar gemacht. Für die quantitative Auswertung der Kornstreckung wurden mindestens drei LIMI-Aufnahmen an benachbarten Positionen der gestauchten Proben angefertigt, um eine statistische Aussage über die ermittelten Werte der Kornstreckung zu erhalten (siehe Bild 2). Dabei wurde die Vergrößerung des Mikroskops so gewählt, dass sich innerhalb der Aufnahme zwischen 400 und 600 Körner befanden.
Die quantitative Auswertung der Kornstreckung erfolgte mit der Bildanalysesoftware MIPAR 3.3.4. Diese Software ermöglicht einerseits eine automatisierte Erkennung der einzelnen Körner und ermöglicht andererseits die Kornform durch unterschiedliche Parameter beschreiben zu können. In vorliegender Arbeit wurden für die quantitative Bestimmung der Kornstreckung drei unterschiedliche Parameter herangezogen: das Y/X-Seitenverhältnis (ARY/X, „engl.: Y/X-aspect-ratio“), welches durch Formel 1 beschrieben wird; das a/b-Seitenverhältnis (ARa/b, „engl.: a/b-aspect-ratio“), welches durch Formel 2 beschrieben wird und die Exzentrizität (E), welche durch Formel 3 beschrieben wird.
In Formel 1 beschreiben Y und X die maximalen Korndurchmesser in vertikaler sowie horizontaler Bildrichtung des jeweiligen Korns. Für die Verwendung des ARY/X war es daher erforderlich, die LIMI-Aufnahme so auszurichten, dass die Stauchebene der Proben im Längsschliff parallel zur vertikalen Bildachse war. Für die Bestimmung von ARa/b sowie von E wurde durch die Auswertesoftware eine Ellipse in jedes Korn gefittet, wobei a die Länge der Hauptachse und b die Länge der Nebenachse der gefitteten Ellipse beschreibt. Bild 3 zeigt eine LIMI-Aufnahme eines geätzten
Schliffs einer Probe nach einem Einzelstauchversuch nach einer Ta = 1250 °C und einer tinter = 10 s, sowie schematisch die Beschreibung der Kornform durch die Kornparameter Y, X, a und b.
Um die zeitabhängigen Verläufe der Kornstreckung besser vergleichbar zu machen, wurden die Kurven normiert (siehe Formel 4).
Formel 4 beschreibt die Ermittlung der normierten Kornstreckung (eg.norm, „engl.: normalized grain elongation“), wobei eg,i die Kornstreckung nach einer tinter = i und eg,t0 die mittlere Kornstreckung nach einer tinter = 0 s beschreibt (direktes Abschrecken nach der Stauchung).
In [8] wurde das Rekristallisationsverhalten indirekt über den Verlauf der Fließspannung von zwei aufeinanderfolgenden Stauchungen ermittelt. Die Versuche in vorliegender Arbeit unterscheiden sich dahingehend lediglich darin, dass die Proben nach tinter direkt abgeschreckt wurden. Da der Rekristallisationsgrad abhängig ist von tinter, hat sich unabhängig davon ob eine zweite Stauchung durchgeführt wurde, in beiden Fällen der gleiche Rekristallisationsgrad eingestellt. Aus diesem Grund können die von den Autoren [8] indirekt ermittelten Rekristallisationswerte herangezogen werden, um geeignete Parameter für die lichtmikroskopische Analyse des Rekristallisationsgrads in dieser Arbeit zu ermitteln.
Ähnlich wie von Chen et al. [20] für die Untersuchung einer Aluminium-Legierung beschrieben, wurde in dieser Arbeit ein Kriterium eingeführt, welches definiert, wann ein Korn als rekristallisiert angesehen wird. Als Kriterium wurde für die drei Parameter der Kornstreckung (ARY/X, ARa/b und E) ein kritischer Grenzwert (fcrit) definiert. Der Rekristallisationsgrad (Rxx) des Gefüges ergibt sich anschließend aus Formel 5:
Hierbei beschreibt ARxx die Gesamtfläche aller in der jeweiligen LIMI-Aufnahme rekristallisierten Körner und Atotal die Gesamtfläche aller Körner, unabhängig ob rekristallisiert, oder nicht.
Ziel dieser Arbeit war es für ARY/X, ARa/b und E fcrit so zu wählen, dass zwischen den aus Formel 5 ermittelten Rekristallisationswerten und den vorab von den Autoren [8] ermittelten Werten eine möglichst geringe Differenz besteht. Hierfür wurde fcrit variiert und die Ergebnisse gemeinsam mit den Ergebnissen der Doppelstauchversuche geplottet. Um die Abweichung der Kurven der Rekristallisationswerte der Doppelstauchversuche [8] und der Rekristallisationswerte der lichtmikroskopischen Untersuchungen nach den Einzelstauchversuchen quantifizierbar zu machen, wurde der euklidische Abstand (dE) zwischen den Messwerten als Maß hierfür herangezogen. Dies ist in Formel 6 beschrieben:
Für die Bestimmung von dE zwischen den Ergebnissen der Doppelstauchversuche und der Einzelstauchversuche benötigt man dem nach den Rekristallisationsgrad nach den Doppelstauchversuchen zum Zeitpunkt i (Rxxi,DH) sowie den Mittelwert des Rekristallisationsgrads nach den Einzelstauchversuchen zum jeweils selben Zeitpunkt (Rxxi,SH). Generell gilt, dass der Verlauf der Kurven mit sinkendem dE ähnlicher wird.
3 Ergebnisse
3.1 Quantitative Bestimmung der Kornstreckung
Bild 4 zeigt den zeitlichen Verlauf der eg.norm nach den Einzelstauchversuchen, jeweils beschrieben durch die drei Parameter ARY/X, ARa/b und E für unterschiedliche Ta. Bild 4a zeigt den Verlauf für eine Ta von 1100 °C, wobei eine zeitliche Abnahme der Kornstreckung für alle drei Parameter ersichtlich wird. Die stärkste Abnahme der eg.norm von 0,92 bei einer t inter von 10 s auf 0,70 bei einer tinter von 2000 s ist für ARY/X zu beobachten, wohingegen die Kornstreckung für ARa/b lediglich von 0,95 auf 0,80 und bei E von 0,97 auf 0,90 abnimmt. Der eg.norm-Verlauf des ARa/b und der E zeigt zwischen einer tinter von 100 s bis 300 s ein Abflachen. Bild 4b zeigt den zeitlichen Verlauf von eg.norm für eine Ta von 1250 °C. Hierbei zeigt sich für alle drei Parameter, dass bis zu einer tinter von 100 s die eg.norm annähernd konstant bleibt und es anschließend zu einer Abnahme und der Ausbildung eines Plateaus zwischen tinter von 100-400 s kommt. Wie bereits für eine Ta von 1100 °C beschrieben, zeigt auch bei einer Ta von 1250 °C der zeitliche Verlauf von ARY/X die größte Verringerung von eg.norm, was zur deutlichsten Ausprägung des Plateaus im Kurvenverlauf führt.
3.2 Ermittlung des Rekristallisationsgrads
Bild 5 zeigt die anhand von Doppelstauchversuchen von den Autoren in [8] ermittelten zeitlichen Verläufe des Rekristallisationsgrads für unterschiedliche Glühtemperaturen (1100 °C und 1250 °C) sowie die aus Formel 5 ermittelten Rekristallisationsgrade nach den Einzelstauchversuchen abhängig vom Kornstreckungsparameter und fcrit. Bild 5a zeigt die aus ARY/X ermittelten Verläufe der Rekristallisation nach einer Ta von 1100 °C und einer Variation von fcrit zwischen 1,05 und 1,25. Für tinter > 300 s zeigt ein fcrit von 1,20 die größte Übereinstimmung zum Rekristallisationsverlauf nach den Doppelstauchversuchen. Für längere tinter gibt es eine bessere Übereinstimmung für fcrit = 1,15. Nach einer Ta von 1250 °C zeigt in Bild 5b jene Kurve von ARY/X und fcrit von 1,10 bis zu einer tinter von 500 s die beste Übereinstimmung zu den Werten der Doppelstauchversuche. Für tinter > 500 s zeigt sich eine bessere Übereinstimmung bei einem fcrit von 1,15. Die Ergebnisse der Doppelstauchversuche zeigen nach einer Ta von 1250 °C die Bildung eines Plateaus für tinter zwischen 100 s und 500 s, was auf die Bildung dehnungsinduzierter Nb(C,N) Ausscheidungen zurückzuführen war [8]. Unabhängig von fcrit zeigen alle Kurven in Bild 5b die Formation eines Plateaus an derselben Stelle. Um die Ähnlichkeit der Rekristallisationsverläufe nach den Doppelstauchversuchen [8] und Einzelstauchversuchen, abhängig von fcrit, zu quantifizieren, wurde dE als Maß herangezogen (siehe Formel 6). Bild 6a zeigt den Verlauf von dE, abhängig von Ta und fcrit, wobei ARY/X als Kornstreckungsparameter herangezogen wurde. Nach einer Ta von 1100 °C zeigt der Verlauf von dE ein Minimum bei einem fcrit von 1,20, wobei eine Erhöhung der Ta auf 1250 °C das Minimum auf fcrit = 1,10 senkt.
In Bild 5c sind die aus ARa/b ermittelten Verläufe der Rekristallisation für eine Ta von 1100 °C abgebildet. Es zeigt sich, dass ein fcrit von 1,50 die größte Übereinstimmung mit dem Rekristallisationsverlauf der Doppelstauchversuche liefert, was ebenfalls durch ein Minimum von dE in Bild 6b bestätigt wird. Bild 5d zeigt die aus ARa/b ermittelten Verläufe für eine Ta von 1250 °C. Bis auf eine tinter von 10 s und 100 s zeigt der Verlauf bei einem fcrit = 1,40 die beste Übereinstimmung mit dem Verlauf nach den Doppelstauchversuchen. Dies bestätigt auch der Verlauf von dE in Bild 6b durch das Auftreten eines Minimums bei besagtem fcrit.
Die zeitlichen Verläufe der Rekristallisation, in denen die Exzentrizität der gefitteten Ellipse als Kornstreckungsparameter herangezogen wurde, sind in Bild 5e (Ta = 1100 °C) und Bild 5f (Ta = 1250 °C) abgebildet. Bei einer Ta von 1100 °C gibt es die beste Übereinstimmung für ein fcrit von 0,75, wobei es zwei Ausreißer bei einer tinter von 10 s und 2000 s gibt. Nach einer Ta = 1250 °C zeigt jene Kurve mit einem fcrit = 0,70 die beste Übereinstimmung mit zwei Ausreißern nach einer tinter von 10 s und 100 s (Hier liefert ein fcrit von 0,65 eine bessere Übereinstimmung.). Die Minima in den dE-Verläufen in Bild 6c befinden sich bei einer Ta von 1100 °C bei einem fcrit von 0,75 und bei einer Ta von 1250 °C bei einem fcrit von 0,70. Die dE-Verläufe bestätigen demnach die weiter oben beschriebene optische Begutachtung der Kurvenverläufe.
4 Diskussion
Das Hauptziel der vorliegenden Arbeit war es, den Rekristallisationsgrad eines mikrolegierten Stahls durch eine lichtmikroskopische Analyse von gestauchten Proben zu ermitteln. Hierfür wurden Einzelstauchversuche mit einem Umformdilatometer durchgeführt, um gestauchte Proben mit unterschiedlichen Rekristallisationsgraden zu erzeugen.
In vergangenen Arbeiten, beispielsweise von Gomez et al. [17] und Fernandez et al. [19], wurde ein Linienschnittverfahren angewendet, um den Rekristallisationsgrad mikrolegierter Stähle zu untersuchen. Der Rekristallisationsgrad errechnete sich in beiden Arbeiten aus dem Verhältnis der Linienschnittpunkte rekristallisierter Körner zur Anzahl der Schnittpunkte aller Körner. Jedoch wurde in beiden zitierten Arbeiten nicht näher erläutert, welche Körner als rekristallisiert angenommen wurden und welche nicht. Chen et al. [20] untersuchten das Rekristallisationsverhalten einer Aluminium-Legierung und wählten einen anderen Ansatz. In deren Arbeit diente ein willkürlich gewählter Grenzwert des ARY/X von 1,75 als Kriterium, um zu entscheiden, ob es sich um ein rekristallisiertes oder nicht rekristallisiertes Korn handelte. Auch hier wurde nicht näher erläutert, weshalb gerade dieser Grenzwert für die Entscheidung herangezogen wurde. Der Rekristallisationsgrad errechnete sich anschließend aus dem Verhältnis der Fläche der rekristallisierten Körner zur Gesamtfläche aller Körner.
In der vorliegenden Arbeit wurde für die Bestimmung des Rekristallisationsgrads eines mikrolegierten Stahls ein ähnlicher Ansatz gewählt. Im ersten Schritt wurden drei Parameter definiert, um die Kornstreckung zu beschreiben, nämlich das ARY/X, das ARa/b und die E. Beim ARY/X handelt es sich um das Y/X-Seitenverhältnis des gestreckten Korns. Hierbei muss darauf geachtet werden, die LIMI-Aufnahme so auszurichten, dass die Stauchebene der Proben parallel zur Bildachse ist. Die Verwendung des ARY/X hat jedoch gegenüber dem ARa/b und der E den Vorteil, dass keine Ellipse virtuell in jedes Korn gefittet werden muss und somit die Kornform direkt eine Auskunft über die Kornstreckung liefert.
Im nächsten Schritt wurden die zeitlichen Verläufe der Kornstreckung normiert und die Ergebnisse geplottet (siehe Bild 4), um die Verläufe untereinander zu vergleichen. Hier zeigt sich einerseits, dass alle Verläufe den selben Trend haben. Es zeigt sich aber auch andererseits, dass sowohl nach einer Ta von 1100 °C,
als auch nach einer Ta von 1250 °C die Verläufe des ARY/X die größte zeitliche Abnahme aufweisen. Die Ergebnisse dieser Untersuchungen legen daher nahe, dass das ARY/X die größte Sensitivität im Hinblick auf Veränderungen der Kornstreckung liefert. Der zeitabhängige Rekristallisationsgrad des untersuchten Stahls wurde von den Autoren bereits vorab durch Doppelstauchversuche bestimmt und die Ergebnisse in [8] publiziert. Die Autoren konnten dort zeigen, dass es nach einer Ta von 1250 °C sowie zwischen einer tinter von 100 s bis 500 s zur Ausbildung eines Plateaus in den Rekristallisationskurven kam. Verantwortlich hierfür war die Bildung dehnungsinduzierter Nb(C,N)-Ausscheidungen. Diesen Effekt konnten auch andere Autoren bei der Untersuchung des Rekristallisationsverhaltens mikrolegierter Stähle beobachten [12, 13, 14, 15]. Der eg.norm-Verlauf in Bild 4 b) zeigt die Ausbildung eines Plateaus an derselben Stelle, weswegen sich diese Methodik ebenfalls eignet, um die Bildung dehnungsinduzierter Mikrolegierungsausscheidungen anzuzeigen.
Um von der Kornstreckung auf den Rekristallisationsgrad schließen zu können, wurde ein Grenzwert der Kornstreckung (fcrit) als Kriterium herangezogen, unter welchem ein Korn als rekristallisiert, beziehungsweise über welchem ein Korn als nicht rekristallisiert gilt. Bild 5 zeigt die dadurch ermittelten Rekristallisationsverläufe für die unterschiedlichen Kornstreckungsparameter sowie die zwei variierenden Glühtemperaturen von 1100 °C und 1250 °C. Neben den aus den Einzelstauchversuchen ermittelten Rekristallisationsverläufen sind ebenfalls die von den Autoren in [8] veröffentlichten Verläufe der Doppelstauchversuche geplottet. Vergleicht man die Kurven nach einer Ta von 1100 °C mit jenen von 1250 °C zeigen die Verläufe nach einer höheren Glühtemperatur eine verlangsamte Rekristallisation. Dies liegt, wie bereits weiter oben beschrieben, an der Formation dehnungsinduzierter Nb(C,N)-Ausscheidungen nach einer Ta = 1250 °C. Des Weiteren kommt es nach einer Erhöhung der Ta von 1100 °C auf 1250 °C
während der Glühung zu einer Erhöhung der Austenitkorngröße, was in weiterer Folge auf Grund der geringeren Anzahl an Keimstellen ebenfalls einen rekristallisationsverzögernden Effekt verursacht.
Die Ähnlichkeit der Verläufe der Rekristallisationskurven der Einzelstauch- und Doppelstauchversuche wurde mit Hilfe dem dE quantifiziert. Die in Bild 6 abgebildeten Verläufe des dE über dem fcrit bestätigen die optischen Übereinstimmungen der Kurven in Bild 5. Bei dem euklidischen Abstand handelt es sich um einen Einzelwert, welcher demnach keine Aussage über das Auftreten von Ausreißern zwischen den Kurvenverläufen liefert. Bei genauer Betrachtung der Kurvenverläufe zeigen sich jedoch teilweise punktuelle Abweichungen der Rekristallisationsgrade der Einzelstauchversuche und den Verläufen der Doppelstauchversuche. Dies zeigt sich für das ARa/b nach einer Ta von 1100 °C (Bild 5c) in einer Abnahme des Rekristallisationsgrads zwischen einer tinter von 1000 s und 2000 s. Nach einer Ta von 1250 °C (Bild 5d) liefern die Rekristallisationsgrade der Einzelstauchversuche nach einer tinter von 10 s sowie 100 s höhere Werte als die Verläufe nach den Doppelstauchversuchen. Der gleiche Trend ist zu beobachten, wenn die Exzentrizität als Maß für die Kornstreckung herangezogen wird, was sich in Bild 5e und Bild 5f zeigt. Die geringsten Abweichungen zwischen den Verläufen der Einzelstauch- und Doppelstauchversuche zeigen jene Kurven, in denen ARY/X als Kornstreckungsparameter verwendet wurde, was in Bild 5a und Bild 5b ersichtlich wird. In Kombination mit der erhöhten Sensitivität, welches das ARY/X im Hinblick auf Veränderungen der Kornstreckung zeigt, zeigen die Ergebnisse dieser Arbeit, dass sich die Verwendung des ARY/X als Parameter der Kornstreckung am besten eignet um den Rekristallisationsgrad mikrolegierter Stähle zu untersuchen. Bild 5a, Bild 5b und Bild 6 zeigen demnach, dass in den Verläufen in denen ARY/X als Kornstreckungsparameter verwendet wurde, nach einer Ta von 1100 °C ein fcrit = 1,20 und nach einer Ta von
1250 °C ein fcrit = 1,10 die besten Resultate liefert. Konkret bedeutet dies, dass in besagtem Fall Körner als rekristallisiert gelten, in denen das Kornlänge-zu-Kornbreite-Verhältnis unter 1,10, beziehungsweise 1,20 liegt.
Bezüglich fcrit konnte in dieser Arbeit gezeigt werden, dass dieser Wert abhängig ist vom Kornstreckungsparameter sowie ebenfalls geringfügig von den Umformparametern. Wird fcrit für einen Umformprozess jedoch einmal bestimmt, ermöglicht die hier gezeigte Methode eine automatisierte lichtmikroskopische Analyse des Rekristallisationsgrads mikrolegierter Stähle.
5 Zusammenfassung
Diese Arbeit hatte das Ziel, den Rekristallisationsgrad von gestauchten Proben eines mikrolegierten HSLA-Stahls direkt lichtmikroskopisch zu ermitteln. Hierfür wurden mittels eines Umformdilatometers Einzelstauchversuche mit variierenden Versuchsparametern durchgeführt, um Proben mit unterschiedlichem Rekristallisationsgrad zu erzeugen. Der zeitabhängige Rekristallisationsgrad des untersuchten Stahls wurde von den Autoren bereits vorab durch Doppelstauchversuche bestimmt [8]. Anhand dieser Ergebnisse war es möglich, die Auswerteparameter für die direkte lichtmikroskopische Analyse des Rekristallisationsgrads anzupassen, um eine bestmögliche Übereinstimmung zwischen den Rekristallisationsverläufen der Einzelstauch- und Doppelstauchversuche zu erhalten. Ein kritischer Grenzwert der Kornstreckung (fcrit) wurde als Maß herangezogen, um zu entscheiden, ob es sich bei den jeweiligen Körnern um rekristallisierte oder nicht rekristallisierte Körner handelt. Um die Kornstreckung zu beschreiben wurden drei Parameter ausgewählt, nämlich das Y/X-Seitenverhältnis (ARY/X), das a/b-Seitenverhältnis (ARa/b) und die Exzentrizität (E). Die Ergebnisse der Arbeit lassen sich wie folgt zusammenfassen:
Nach einer Glühtemperatur (Ta) von 1100 °C zeigen die Verläufe der normierten Korn streckung (eg.norm) für alle drei Kornstreckungsparameter eine zeitliche Abnahme. Die stärkste Abnahme zeigt die Kurve des ARY/X, gefolgt vom ARa/b und der E. Nach einer Ta = 1250 °C zeigt der zeitliche Verlauf der eg.norm für alle Kornstreckungsparameter bis zu einer Haltezeit (tinter) von 100 s einen konstanten Verlauf, wobei es im Anschluss zur Ausbildung eines Plateaus zwischen einer tinter von 100 s bis 400 s kommt. Der zeitliche Verlauf der ARY/X-Kurve zeigt auch bei dieser Glühtemperatur die stärkste zeitliche Abnahme von eg.norm sowie die deutlichste Ausprägung des Plateaus.
Die vorab durchgeführten Doppelstauchversuche [8] zeigten, dass es nach einer Ta = 1250 °C und einer tinter von 100 s zur Bildung dehnungsinduzierter Nb(C,N)-Ausscheidungen kam. Dies zeigte sich durch die Ausbildung eines Plateaus im Rekristallisationsdiagramm. Alle drei Kornstreckungsparameter weisen für den Verlauf der eg.norm denselben Trend nach einer Ta von 1250 °C und einer tinter von 100 s auf, weswegen sich der zeitliche Verlauf der eg.norm ebenfalls eignet, um den Beginn der Formation dehnungsinduzierter Ausscheidungen anzuzeigen. Am deutlichsten ausgeprägt ist die Plateaubildung für das ARY/X, gefolgt von dem ARa/b und der E.
Nach einer Ta von 1100 °C zeigen die Rekristallisationsverläufe, in denen das ARY/X als Kornstreckungsparameter gewählt wurde, dass es bei einem fcrit von 1,20 bis zu einer tinter von 300 s die beste Übereinstimmung der Rekristallisationsverläufe zwischen den Doppelstauch- und den Einzelstauchversuchen gibt. Für tinter > 300 s zeigt ein fcrit von 1,15 die beste Übereinstimmung. Die euklidische Distanz (dE), welche als Maß herangezogen wurde, um die Ähnlichkeit der Kurven zu quantifizieren, zeigt bei einem fcrit von 1,20 die größte Übereinstimmung der Rekristallisationsverläufe. Die aus den ARa/b ermittelten Verläufe, sowie die dE, zeigen, dass bei einem fcrit = 1,50 die größte Ähnlichkeit für die Rekristallisationsverläufe besteht. Für die Verläufe der Rekristallisation, in denen E als Kornstreckungsparameter herangezogen wurde, zeigt sich die beste Übereinstimmung in den Kurvenverläufen nach einem fcrit = 0,75, wobei es zwei Ausreißer nach einer tinter von 10 s und 2000 s gibt. Auch der dE weist bei einem fcrit = 0,75 ein Minimum auf, was die beste Übereinstimmung der Kurven anzeigt.
Nach einer Ta von 1250 °C zeigen die Rekristallisationsverläufe, in denen das ARY/X als Kornstreckungsparameter gewählt wurde, dass es bei einem fcrit von 1,10 bis zu einer tinter von 500 s die beste Übereinstimmung der Rekristallisationsverläufe gibt. Für tinter > 500 s zeigt ein fcrit von 1,15 die beste Übereinstimmung. dE zeigt bei einem fcrit von 1,10 die größte Übereinstimmung der Rekristallisationsverläufe. Die dE sowie die aus dem ARa/b ermittelten Verläufe zeigen, dass es bis auf zwei Ausreißer nach einer tinter von 10 s und 100 s, die beste Übereinstimmung der Rekristallisationsverläufe bei einem fcrit = 1,40 gibt. Für die Rekristallisationsverläufe, in denen E als Kornstreckungsparameter herangezogen wurde, zeigt sich die beste Übereinstimmung in den Kurvenverläufen nach einem fcrit = 0,70, wobei es zwei Ausreißer nach einer tinter von 10 s und 100 s gibt. Auch die dE weist bei einem fcrit = 0,70 ein Minimum auf, was die beste Übereinstimmung der Kurven anzeigt.
Nach einer Ta = 1250 °C weisen die zeitlichen Rekristallisationsverläufe für alle drei Kornstreckungsparameter das Ausbilden eines Plateaus zwischen einer tinter von 100 bis 400 s auf. Durch eine lichtmikroskopische Analyse der Kornstreckung ist es daher möglich, die rekristallisationshemmenden Eigenschaften von dehnungsinduzierten Mikrolegierungsausscheidungen zu zeigen.
Die Verwendung des ARY/X als Kornstreckungsparameter eignet sich am besten für die lichtmikroskopische Ermittlung des Rekristallisationsgrads. Einerseits muss keine Ellipse in jedes einzelne Korn gefittet werden, wodurch bereits die Kornform selbst eine Aussage über die Kornstre ckung liefert. Andererseits weist das ARY/X die größte Sensitivität im Hinblick auf Veränderungen der Kornstreckung auf und liefert die geringste Zahl an Ausreißern in den Rekristallisationsverläufen.
Die Ergebnisse dieser Arbeit zeigen, dass fcrit abhängig ist von den Umformparametern und dem Kornstreckungsparameter. Wurde fcrit für einen Umformprozess jedoch einmal bestimmt, ermöglicht diese Methodik eine automatisierte lichtmikroskopische Auswertung des Rekristallisationsgrads.
About the authors
Stefan Monschein was born 1992 in Bruck an der Mur (Austria) and studied materials science at the Montanuniversität Leoben (Austria). He is now working on his PhD thesis about the improvement of the properties of high performance wire products.
Nikolaus Kostwein was born 1996 in Klagenfurt (Austria) and studies materials science at the Montanuniversität Leoben (Austria). He is currently working on his master’s thesis dealing with the solubility and precipitation of Niobium in thermomechanically processed steel plates.

6 Acknowledgement
This work was supported by: the Austrian Federal Ministry of Climate Action and Energy, BMK, (846933) under the program “Produktion der Zukunft” (Production for the Future) of the “BMK Stiftungsprofessur für Industrie” (BMK Endowed Professorship for Industry); Austrian Research Promotion Agency GmbH (FFG:885187); Austrian Research Promotion Agency GmbH (FFG:873200).
6 Danksagung
Diese Arbeit wurde unterstützt durch: Österreichisches BMK (846933) im Rahmen des Programms “Produktion der Zukunft” der “BMK Stiftungsprofessur für Industrie”; Österreichische Forschungsförderungs GmbH (FFG:885187); Österreichische Forschungsförderungs GmbH (FFG:873200).
-
Translation: E. Engert
References / Literatur
[1] Baker, T. N.: Ironmaking & Steelmaking 43 (2016) 4, pp. 264–307. DOI: 10.1179/1743281215Y.000000006310.1179/1743281215Y.0000000063Search in Google Scholar
[2] Vervynckt, S.; Verbeken, K.; Lopez, B.; Jonas, J. J.: International Materials Reviews 57 (2012) 4, pp. 187–207. DOI: 10.1179/1743280411Y.000000001310.1179/1743280411Y.0000000013Search in Google Scholar
[3] DeArdo, A. J.: International Materials Reviews 48 (2003) 6, pp. 371–402. DOI: 10.1179/09506600322500883310.1179/095066003225008833Search in Google Scholar
[4] Cahn, J. W.: Acta Metallurgica 10 (1962) 9, pp. 789–798. DOI: 10.1016/0001-6160(62)90092-510.1016/0001-6160(62)90092-5Search in Google Scholar
[5] Dutta, B.; Sellars, C. M.: Materials Science and Technology 3 (1987) 3, pp. 197–206. DOI: 10.1179/mst.1987.3.3.19710.1179/mst.1987.3.3.197Search in Google Scholar
[6] Baker, T. N.: Ironmaking & Steelmaking 46 (2019) 1, pp. 1–55. DOI: 10.1080/03019233.2018.144649610.1080/03019233.2018.1446496Search in Google Scholar
[7] Hong, S. G.; Kang, K. B.; Park, C. G.: Scripta Materialia 46 (2002), pp. 163–168. DOI: 10.1016/S1359-6462(01)01214-310.1016/S1359-6462(01)01214-3Search in Google Scholar
[8] Monschein, S.; Kapp, M.; Zügner, D.; Fasching, J.; Landefeld, A.; Schnitzer, R.: steel research int. 92 (2021) 9, p. 2100065 DOI: 10.1002/srin.20210006510.1002/srin.202100065Search in Google Scholar
[9] Hegetschweiler, A.; Borovinskaya, O.; Staudt, T.; Kraus, T.: Analytical chemistry 91 (2019) 1, pp. 943–950. DOI: 10.1021/acs.analchem.8b0401210.1021/acs.analchem.8b04012Search in Google Scholar PubMed
[10] Webel, J.; Herges, A.; Britz, D.; Detemple, E.; Flaxa, V.; Mohrbacher, H.; Mücklich, F.: Metals 10 (2020) 2, p. 243. DOI: 10.3390/met1002024310.3390/met10020243Search in Google Scholar
[11] Homsher, C. N.: Determination of the non-recrystallization temperature (TNR) in multiple microalloyed steels, 2013.Search in Google Scholar
[12] Esterl, R.; Sonnleitner, M.; Schnitzer, R.: Steel Research International 90 (2019) 3, 1800500.10.1002/srin.201800500Search in Google Scholar
[13] Medina, S. F.; Mancilla, J. E.: ISIJ International 33 (1993) 12, pp. 1257–1264. DOI: 10.2355/isijinternational.33.125710.2355/isijinternational.33.1257Search in Google Scholar
[14] Medina, S. F.; Mancilla, J. E.: Acta Metallurgica et Materialia 42 (1994) 12, pp. 3945–3951. DOI: 10.1016/0956-7151(94)90172-410.1016/0956-7151(94)90172-4Search in Google Scholar
[15] Medina, S. F.; Mancilla, J. E.: ISIJ Int. 36 (1996) 8, pp. 1063–1069. DOI: 10.2355/isijinternational.36.106310.2355/isijinternational.36.1063Search in Google Scholar
[16] Rossi, P. L. O.; Sellars, C. M.: Acta Materialia 45 (1997) 1, pp. 137–148. DOI: 10.1016/S1359-6454(96)00167-X10.1016/S1359-6454(96)00167-XSearch in Google Scholar
[17] Gómez, M.; Rancel, L.; Fernández, B. J.; Medina, S. F.: Materials Science and Engineering: A 501 (2009) 1-2, 188–196. DOI: 10.1016/j.msea.2008.09.07410.1016/j.msea.2008.09.074Search in Google Scholar
[18] Perttula, J. S.; Karjalainen, L. P.: Materials Science and Technology 14 (1998) 7, 626–630. DOI: 10.1179/mst.1998.14.7.62610.1179/mst.1998.14.7.626Search in Google Scholar
[19] Fernandez A. I.; Lopez, B.; Rodriguez-Ibabe, J. M.: Scripta Materialia Vol. 40 (1999) 5, pp. 543–549. DOI: 10.1016/S1359-6462(98)00452-710.1016/S1359-6462(98)00452-7Search in Google Scholar
[20] Chen, S. P.; Hanlon, D. N.; van der Zwaag, S.; Pei, Y. T.; Dehosson, J. T. M.: J Mater Sci 37 (2002) 5, pp. 989–995. DOI: 10.1023/A:101435611605810.1023/A:1014356116058Search in Google Scholar
[21] Malta, P. O.; Alves, D. S.; Ferreira, A. O. V.; Moutinho, I. D.; Dias, C. A. P.; Santos, D. B.: Metall and Mat Trans A 48 (2017) 3, pp. 1288–1309. DOI: 10.1007/s11661-016-3935-310.1007/s11661-016-3935-3Search in Google Scholar
[22] Black, M. P.; Higginson, R. L.: Scripta Materialia 41 (1999) 2, pp. 125–129. DOI: 10.1016/s1359-6462(99)00051-210.1016/s1359-6462(99)00051-2Search in Google Scholar
[23] Béchet, S.; Beaujard, L.: Rev. Met. Paris 52 (1955) 10, pp. 830–836. DOI: 10.1051/metal/19555210083010.1051/metal/195552100830Search in Google Scholar
[24] Esterl, R.; Sonnleitner, M.; Stadler, M.; Wölger, G.; Schnitzer, R.: Practical Metallography 55 (2018) 4, pp. 203–222. DOI: 10.3139/147.11049110.3139/147.110491Search in Google Scholar
© 2022 S. Monschein, N. Kostwein, K. S. Ragger, D. Zügner, J. Fasching, R. Schnitzer, published by De Gruyter
This work is licensed under the Creative Commons Attribution 4.0 International License.
Articles in the same Issue
- Contents
- Editorial
- Editorial
- Quantification of methods used in field metallography using the example of quality assurance measures for a circular economy for high-alloy steels
- Determination of the degree of recrystallization of a microalloyed HSLA steel by using metallographic methods
- Failure Analysis
- Fatigue Fracture of the Copper Bridge in a Medium Voltage Make Switch
- Picture of the Month
- Picture of the Month
- News
- News
- Meeting diary
- Meeting diary