Mapping Research Trends in Cloud Computing Applications for Libraries: A Bibliometric Approach
-
Mohammad Nasir

 und
Basudeb Jana
und
Basudeb Jana

Abstract
With a focus on bibliometric analysis, this article intends to analyze patterns in the literature regarding Cloud Computing and its uses in libraries. The authors employed the Boolean operator “AND” while searching Scopus with the terms “Cloud Computing” and “Library” to discover studies that were mainly focused on the subject of this work. The research report that was presented included a bibliometric analysis of Cloud Computing publications. A total of 1,083 articles about Cloud Computing and libraries were obtained from the Scopus Database. The retrieved data was analyzed using Biblioshiny and VosViewer software. The relationship between Cloud Computing and library development was examined using bibliometric analysis, which revealed a number of themes, significant authors, highly referenced publications, well-known organizations, and significant countries. The study also demonstrated how the relationship between Cloud Computing and libraries has evolved and how it could work with academic libraries to give them an ongoing competitive advantage. The study reveals that 2022 was the most prolific year for publications on Cloud Computing within the field of Library and Information Science. Globally, only Venezuela, the United States, and China retained their place as the most productive nations by producing the highest number of documents. Wang and Zhang are the foremost authors, while Lecture Notes in Computer Science and ACM International Conference Proceedings are the leading sources.
1 Introduction
A variety of metrics has been developed as a result of bibliometric analysis which integrates various frameworks, instruments, and techniques to examine and analyze citations of academic publications. This has allowed researchers to assess the influence of scientific journals, studies, and researchers and also gain insights into the intellectual structure of a wide range of academic disciplines (Akhavan et al. 2016). Bibliometrics is a quantitative discipline that is closely linked to the sociology of science, science policy, and the evaluation of research programs. Hicks and Melkers (2013) examine the widespread application of bibliometrics in program evaluation. They place particular emphasis on the interpretation of citation counts. Bibliometric methods have become well-established techniques for analysis and are being utilized to assess the advancement of research fields (Ellegaard and Wallin 2015). These days, databases like Web of Science (WoS) and Scopus make it considerably more straightforward to find papers and conduct analyses (Zupic and Čater 2015). The field’s developments make it easier to analyze the influence and development of scientific literature (Ellegaard and Wallin 2015). Researchers worldwide have recently shown a great deal of interest in the application of bibliometric approaches in systematic literature reviews. This has been impacted by a number of factors including the use of software to assist researchers in conducting systematic reviews, the cross-disciplinary methodology that can be utilized by users from a variety of scientific fields, and the system’s capacity to manage massive amounts of data (Donthu et al. 2021). These studies primarily used a qualitative technique to analyze the design field. To our knowledge, no researcher has used a quantitative approach to review design research (Chai and Xiao 2012). Bibliometrics citations imply a meaningful association between a study and the reference (Adam et al. 2002; Lawrence 2003; Traynor and Rafferty 2001). Bibliometric strategies can be categorized as evaluative or relational. Scientific research evaluation strategies aim to compare the relative impact of research collaboration between individuals or groups (Güzeller and Çeliker 2018).
Although the potential of Cloud Computing to improve library services is becoming more widely acknowledged, there aren’t many thorough bibliometric studies that chart the research trends in this field. A comprehensive picture of the development of the area is sometimes lacking in the literature that currently exists which frequently concentrates on individual case studies or particular applications (Alhassan et al 2020; Kaur and Kaur 2021). The impact of Cloud Computing on library operations and user engagement is also not well examined, which restricts library professionals’ ability to plan and execute strategic initiatives (Mokhtar et al 2021). This study methodically examines the scientific landscape in an effort to close these gaps.
According to Mabawonku et al. (2024), library staff are cognizant of Cloud Computing technology, which could facilitate its efficient application in libraries. Cloud Computing technology is implemented to enable collaboration among staff and users, enhance accessibility, and provide storage for digital content, which illustrates its potential value in libraries.
The purpose of Cloud Computing applications in academic libraries is to investigate how they affect user experiences, intellectual cooperation, and library operations. Examining the different applications of Cloud Computing in academic libraries, evaluating its advantages and disadvantages, and seeing areas for further growth are the goals of the study. Cloud-based solutions are used for scalable storage, digital preservation, collaborative research platforms, online catalogs, and digital asset management (Karthika et al. 2024). Several Cloud Computing practices were identified in this study, such as cloud-based library automation systems, email services, social media apps, cloud storage (Dropbox), consortium services, digital libraries, and file sharing. The cost-effectiveness, storage capacity, user-friendliness, flexibility and scalability, time-saving nature, lack of in-house expertise, and pervasiveness of the technology are the main reasons why libraries have embraced Cloud Computing (Asim et al. 2024).
2 Concept of Bibliometrics
Over the past 10 years, bibliometrics has become a crucial topic of study. It is essential for analyzing scientific research through quantitative analysis of research papers, studying the results of scientific publications, and evaluating research in the fields of academics and library and information science (LIS) (Rehn and Kronman 2008). Bibliometrics, as defined by the Karolinska Institute, refers to the utilization of statistical and mathematical techniques in analyzing books and other forms of communication as well as a collection of quantitative tools used to analyze scholarly publications. Bibliometric research can encompass any measurable component of a publication such as the word count of a paper or the time it takes for a submission to be published. Although the quantitative facts related to a particular paper may seem dull, they gain significance when comparing several publications or conducting statistical analyses on extensive collections.
3 Objective of the Study
To analyze the growth and publication trends in research on Cloud Computing applications in libraries over the past decade, patterns in the overall volume of literature that features in the comprehensive study are identified. The objectives of this study are as follows:
Identify the annual production and citation pattern of Cloud Computing research in the library.
Identify author collaboration with country and affiliation through three-factor plots.
Identify the most relevant sources and their production over time.
Identify the relevant author and their co-citation network, among others.
Indicate the most prolific country in production, citation, and collaboration, among other countries.
Define the reference spectroscopy of the complete documents over the course of a decade.
Identify the most frequent keywords through analysis and a word cloud.
4 Methodology
Bibliometric analysis is a technique for evaluating and comprehending scientific publications that makes use of quantitative measurements. The method is based on the idea that patterns and trends in the literature can provide essential details about the state of a specific field, including its development, research trends, and essential figures (Donthu et al. 2021).
In this study, we use the quantitative method of bibliometric analysis to analyze and categorize the research conducted on Cloud Computing in library services between 2002 and 2023. The steps in this bibliometric analysis are as follows: (i) conducting a keyword search in the SCOPUS database; (ii) choosing full articles that were released between 2002 and 2023; (iii) removing items that are duplicates or do not cover Cloud Computing and library services; and (iv) using a list of the articles with the highest citations R and VosViewer software for the remaining analysis (Santos et al 2017).
Bibliometric analysis is prepared by taking into account the organization and presentation of the systematic items. It usually involves collecting a data set of publications, such as books, patents, or articles, and then analyzing and interpreting the data using a variety of quantitative metrics (McBurney and Novak 2002).
Citation counts: This indicator shows how frequently a publication has been cited in other works. It is employed to determine the most prominent authors and institutions.
Co-citation analysis: This measure examines how similar the citation styles of several publications are. It is employed to identify groups of articles with closely related themes and research topics.
Co-authorship analysis: This measure counts the number of articles that multiple authors co-authored. It is employed to identify the writers and organizations that work together most frequently on a given topic (Table 1).
Overview of complete data from 2002 to 2023.
| Description | Results |
|---|---|
| Main information about data | |
|
|
|
| Timespan | 2002–2023 |
| Sources (journals, books, etc.) | 697 |
| Documents | 1,083 |
| Annual growth rate % | 28.12 |
| Document average age | 3.98 |
| Average citations per doc | 19.93 |
| References | 34,188 |
|
|
|
| Document contents | |
|
|
|
| Keywords plus (ID) | 6,428 |
| Author’s keywords (DE) | 2,974 |
|
|
|
| Authors | |
|
|
|
| Authors | 3,762 |
| Authors of single-authored docs | 124 |
|
|
|
| Authors’ collaboration | |
|
|
|
| Single-authored docs | 128 |
| Co-authors per doc | 4.16 |
| International co-authorships % | 18.84 |
|
|
|
| Document types | |
|
|
|
| Article | 426 |
| Book | 20 |
| Book chapter | 48 |
| Conference paper | 501 |
| Conference review | 39 |
| Editorial | 1 |
| Erratum | 4 |
| Note | 3 |
| Retracted | 1 |
| Review | 39 |
Network analysis: This type of analysis evaluates the relationships among different publications, authors, and organizations. It is employed to determine the key players and research questions in a field (Figures 1 and 2).

Methodology structure.
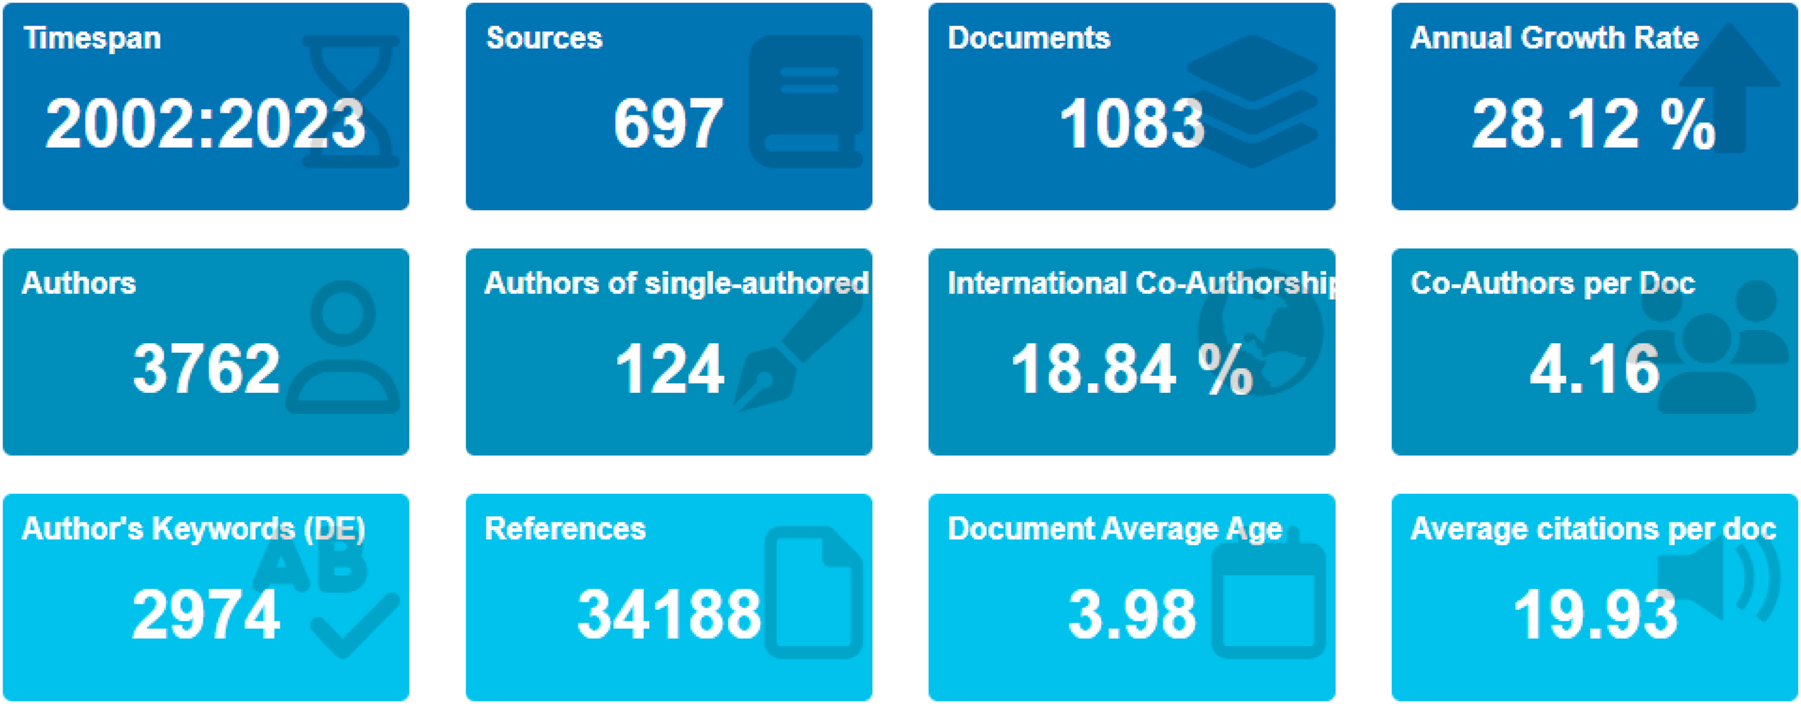
Main information.
The data has been collected from the SCOPUS database and analyzed through Biblioshiny and VosViewer. The overview of total publications is given below. A total of 1,083 documents were collected from SCOPUS on the topic of “Cloud Computing” in “Library Services.” Data was collected as of July 11, 2024, the total timespan was 2002–2023, and annual growth rate was 28.12 %. The total number of authors involved until 2023 is 3,762. The international collaboration with authors is 18.84 %, and the average number of co-authors per document is 4.16. The average citation per document is 19.93, which shows good, impactful articles; the total number of citations of until 2023 is 21,584.
5 Data Analysis and Interpretation
Annual Production: The annual production denotes the productivity of scholarly articles on the topic of Cloud Computing in libraries. Table 2 indicates all 22 years from 2002 to 2023. It is observed that maximum publication happened in 2022 (217, 20.04 %), followed by 2021 (207, 19.11 %), 2023 (182, 16.81 %), 2020 (174, 16.06 %), and 2019 (162, 15 %) (Figure 3).
Year-wise scholarly production.
| Year | No. of publication | Average citation per year | Year | No. of publication | Average citation per year |
|---|---|---|---|---|---|
| 2002 | 1 | 0.09 | 2013 | 0 | 0 |
| 2003 | 4 | 0.36 | 2014 | 0 | 0 |
| 2004 | 0 | 0 | 2015 | 0 | 0 |
| 2005 | 2 | 0.18 | 2016 | 0 | 0 |
| 2006 | 0 | 0 | 2017 | 0 | 0 |
| 2007 | 2 | 0.18 | 2018 | 59 | 5.44 |
| 2008 | 3 | 0.28 | 2019 | 162 | 15 |
| 2009 | 16 | 1.48 | 2020 | 174 | 16.06 |
| 2010 | 45 | 4.16 | 2021 | 207 | 19.11 |
| 2011 | 9 | 0.83 | 2022 | 217 | 20.04 |
| 2012 | 0 | 0 | 2023 | 182 | 16.81 |

Annual production.
5.1 Three-Factor Plots (Country, Author, and Affiliation)
Figure 4 illustrates that countries engage in cloud computing research based on specific domains, often influenced by the availability of domain experts Researchers denote the top 10 authors in their country with affiliated institutions for research in the field of libraries. For instance, China has a significant impact on the respective research. Similarly, the USA also contributes a significant research output on Cloud Computing in libraries. Only two countries give less contribution to this research, France and Spain.

Three-field plot. AU_CO, author country; AU, author; AU_UN, author affiliation.
5.2 Most Relevant Sources
The top 10 most relevant sources have the highest number of cited articles from the complete body of research. The source with the most documents is Lecture Notes in Computer Science (Including SUBSE) with 29 papers, followed by the ACM International Conference Proceeding Series with 24 documents and Library Philosophy and Practice with 23 documents. The source with the fewest documents is Proceedings of SPIE – The International Society for Optical Engineering, with eight documents. This information is shown in Figure 5.

Most relevant sources.
5.3 Sources’ Production Over Time
Figure 6 represents the scholarly production that happened over the studied period. We take five samples to describe this output. It was observed that Lecture Notes in Computer Science produces scholarly articles every year. The ACM International Conference Proceeding Series started its contribution on the topic in 2018 and continued on an upward trend until 2023. Elsewhere, Library Philosophy and Practice is one of the journals which continuously provided a contribution from 2019.

Sources’ production over time.
5.4 Most Relevant Authors
The most pertinent authors who have contributed to the research area of cloud computing in libraries are displayed in Figure 7. Wang has the most publications (16), followed by Zhang (13). The least amount of documents were published by Li and Lu, who only published seven documents during the period.

Most relevant authors.
5.5 Author’s Co-Citation Network
The authors’ co-citation relationship network chart in Figure 8 illustrates that only 94 of a selected 5,616 authors met the threshold. A node represents an author, and co-authorship is shown by lines joining two authors. A total of 338 links, with eight clusters, describe the collaboration of authors. The first cluster describes the cooperation of 26 links, the second shows 10 links, and so on.

Authors’ collaboration network.
5.6 Countries’ Scientific Production and Collaboration
The world map below in Figure 9 shows countries’ scholarly production during the time studied. The dark spots indicate a high number of material contributed and light spots indicate a smaller number of publications. The maximum number of documents are produced by the USA and China, followed by India, Brazil, Canada, and others.

Countries’ scientific production.
A country collaboration map is a geographical representation of the relationships between countries with published data in bibliometric analysis. Co-authorship amongst the nations is shown in Figure 10 with circles and labels. Each circle’s diameter corresponds to the total number of papers that each author has authored (Almulhim et al. 2021). Forty-two countries meet the requirement of a country having a minimum of five papers. Six clusters are indicated, each represented by a distinct color. With these six clusters there are a total of 259 links and 474 link strengths combined. Thirteen documents are noted in the first cluster, 10 in the second, six in the third, five in the fourth, four in the fifth, and only four in the sixth.

Country collaboration.
5.7 Countries’ Most Cited Document
Figure 11 illustrates the most cited documents, and thus the research productivity, of countries. Citation is an essential component of an article. Without citation, one cannot judge whether the article is good or its impact on the journal. An impact factor varies for a journal based on citations. The most productive country on this list is Venezuela, with 8,212 times citations. The UK has 2,657 citations, its 204.4 average article citations. Among the list of countries, UAE only has 372 citations, but has 372 average article citations, which means one article they have published receives more citations than others. Table 3 indicates the countries and their total and average citations.

Most cited country.
Most cited documents, country-wise.
| Country | TC | Average article citations | Country | TC | Average article citations |
|---|---|---|---|---|---|
| VENEZUELA | 8,212 | 8,212.00 | FINLAND | 32 | 10.70 |
| UNITED KINGDOM | 2,657 | 204.40 | NETHERLANDS | 29 | 29.00 |
| CHINA | 1,661 | 8.90 | SOUTH AFRICA | 28 | 14.00 |
| USA | 1,660 | 20.50 | GREECE | 20 | 3.30 |
| IRAQ | 467 | 233.50 | BELGIUM | 18 | 9.00 |
| UNITED ARAB EMIRATES | 372 | 372.00 | JORDAN | 16 | 8.00 |
| INDIA | 346 | 5.50 | BANGLADESH | 15 | 3.00 |
| GERMANY | 307 | 18.10 | INDONESIA | 15 | 3.80 |
| AUSTRALIA | 221 | 27.60 | BAHRAIN | 11 | 11.00 |
| KOREA | 197 | 9.80 | CANADA | 11 | 5.50 |
| MALAYSIA | 179 | 22.40 | IRELAND | 10 | 10.00 |
| ITALY | 164 | 8.60 | NORWAY | 8 | 8.00 |
| TURKEY | 148 | 21.10 | ARGENTINA | 7 | 1.40 |
| FRANCE | 135 | 15.00 | CZECH REPUBLIC | 6 | 6.00 |
| SERBIA | 129 | 64.50 | HUNGARY | 6 | 3.00 |
| SAUDI ARABIA | 125 | 31.20 | KUWAIT | 6 | 6.00 |
| EGYPT | 121 | 20.20 | PERU | 6 | 6.00 |
| POLAND | 110 | 12.20 | UKRAINE | 6 | 1.50 |
| PORTUGAL | 90 | 18.00 | YEMEN | 6 | 6.00 |
| GHANA | 81 | 40.50 | MEXICO | 4 | 2.00 |
| PAKISTAN | 79 | 11.30 | ALGERIA | 3 | 3.00 |
| CYPRUS | 78 | 39.00 | SWITZERLAND | 3 | 1.00 |
| MOROCCO | 71 | 17.80 | THAILAND | 3 | 3.00 |
| SPAIN | 64 | 9.10 | MONTENEGRO | 2 | 2.00 |
| JAMAICA | 58 | 29.00 | SLOVENIA | 2 | 2.00 |
| JAPAN | 53 | 3.80 | GEORGIA | 1 | 0.50 |
| IRAN | 52 | 5.80 | ISRAEL | 1 | 1.00 |
| ECUADOR | 45 | 11.20 | TUNISIA | 1 | 1.00 |
| NIGERIA | 43 | 8.60 | |||
| ROMANIA | 39 | 7.80 | |||
| SWEDEN | 38 | 12.70 | |||
| BRAZIL | 37 | 9.20 |
5.8 Most Productive Countries
Table 4 describes the countries with the highest amount of scholarly production over the years. The maximum output in the Cloud Computing field is from China (17.3 %), followed by the USA (7.5 %), India (5.8 %), and others (Figure 12).
Country-wise scholarly production.
| Country | Articles | Articles % | SCP | MCP | MCP % | Country | Articles | Articles % | SCP | MCP | MCP % |
|---|---|---|---|---|---|---|---|---|---|---|---|
| CHINA | 187 | 17.3 | 151 | 36 | 19.3 | COLOMBIA | 1 | 0.1 | 1 | 0 | 0 |
| USA | 81 | 7.5 | 69 | 12 | 14.8 | CZECH REPUBLIC | 1 | 0.1 | 1 | 0 | 0 |
| INDIA | 63 | 5.8 | 59 | 4 | 6.3 | IRELAND | 1 | 0.1 | 0 | 1 | 100 |
| KOREA | 20 | 1.8 | 11 | 9 | 45 | ISRAEL | 1 | 0.1 | 1 | 0 | 0 |
| ITALY | 19 | 1.8 | 14 | 5 | 26.3 | KENYA | 1 | 0.1 | 1 | 0 | 0 |
| GERMANY | 17 | 1.6 | 12 | 5 | 29.4 | KUWAIT | 1 | 0.1 | 0 | 1 | 100 |
| JAPAN | 14 | 1.3 | 12 | 2 | 14.3 | MONTENEGRO | 1 | 0.1 | 1 | 0 | 0 |
| UNITED KINGDOM | 13 | 1.2 | 7 | 6 | 46.2 | NETHERLANDS | 1 | 0.1 | 1 | 0 | 0 |
| FRANCE | 9 | 0.8 | 8 | 1 | 11.1 | NIGER | 1 | 0.1 | 1 | 0 | 0 |
| IRAN | 9 | 0.8 | 6 | 3 | 33.3 | NORWAY | 1 | 0.1 | 1 | 0 | 0 |
| POLAND | 9 | 0.8 | 6 | 3 | 33.3 | PERU | 1 | 0.1 | 1 | 0 | 0 |
| AUSTRALIA | 8 | 0.7 | 2 | 6 | 75 | SLOVENIA | 1 | 0.1 | 1 | 0 | 0 |
| MALAYSIA | 8 | 0.7 | 3 | 5 | 62.5 | THAILAND | 1 | 0.1 | 1 | 0 | 0 |
| PAKISTAN | 7 | 0.6 | 5 | 2 | 28.6 | TUNISIA | 1 | 0.1 | 1 | 0 | 0 |
| SPAIN | 7 | 0.6 | 7 | 0 | 0 | UNITED ARAB EMIRATES | 1 | 0.1 | 0 | 1 | 100 |
| TURKEY | 7 | 0.6 | 5 | 2 | 28.6 | VENEZUELA | 1 | 0.1 | 0 | 1 | 100 |
| EGYPT | 6 | 0.6 | 3 | 3 | 50 | YEMEN | 1 | 0.1 | 1 | 0 | 0 |
| GREECE | 6 | 0.6 | 4 | 2 | 33.3 | ROMANIA | 5 | 0.5 | 5 | 0 | 0 |
| ARGENTINA | 5 | 0.5 | 5 | 0 | 0 | BRAZIL | 4 | 0.4 | 2 | 2 | 50 |
| BANGLADESH | 5 | 0.5 | 5 | 0 | 0 | ECUADOR | 4 | 0.4 | 2 | 2 | 50 |
| NIGERIA | 5 | 0.5 | 3 | 2 | 40 | INDONESIA | 4 | 0.4 | 4 | 0 | 0 |
| PORTUGAL | 5 | 0.5 | 3 | 2 | 40 | MOROCCO | 4 | 0.4 | 4 | 0 | 0 |
| FINLAND | 3 | 0.3 | 3 | 0 | 0 | SAUDI ARABIA | 4 | 0.4 | 3 | 1 | 25 |
| SWEDEN | 3 | 0.3 | 2 | 1 | 33.3 | UKRAINE | 4 | 0.4 | 4 | 0 | 0 |

Relevant countries.
5.9 Reference Spectroscopy
Reference spectroscopy refers to the historical origins of the study of Cloud Computing in libraries and the influence of publications on specific groups of publications. Figure 13 illustrates referred sources from 1947 to 2022. The maximum number of references is counted in 2018 (3,140), followed by 2019 (3,103).

Reference spectroscopy.
5.10 Word Cloud
A word cloud is a visual representation of textual data where every word measure corresponds to how frequently or how important it appears in the text. Bibliometric analysis utilizes word clouds to ascertain the most prevalent terms and topics within a collection of documents such as research articles or patents. Figures 14 and 15 show the most used keywords by an author. Cloud Computing is the most used keyword (279 times), followed by machine learning (58 times). Artificial intelligence (24 times) and virtualization (19 times) are lesser used keywords.

Author’s keywords.

Author’s keywords.
5.11 Keyword Analysis
It is possible to gain insight into a field’s central theme and research direction by analyzing the co-occurrence of keywords. Consequently, we imported our data into VOSViewer and, using the derived keyword information, produced a visual map of keyword co-occurrence (Bhuyan et al 2021). After extracting 464 keywords (author keywords and others), a threshold requirement of appearing more than five times was applied to include the keywords in the visualization map. The nine clusters on 464 items are linked to 14,344 occurrences of the keywords. Figures 16 and 17 shows the clusters and their co-occurrence.

Keyword analysis.

Keyword analysis.
6 Discussion and Conclusion
Performance analysis and scientific mapping of Cloud Computing in library publications indicate various concerns significant to Cloud Computing research (Waghmare 2020). After 2017, research on the subject of libraries developed gradually. The adoption of Cloud Computing is growing, which is attributed to its numerous benefits for libraries (Yu et al. 2018).
The assessment of research output in the domains of LIS can be assisted by this bibliometric study on citation measurements. The results let users learn about research projects carried out by earlier researchers on a national and international scale (Naveed et al. 2023).
This study is helpful for trying to comprehend what has been published on Cloud Computing in LIS domains. The analysis indicates that 2022 was the most productive year for papers on Cloud Computing in LIS (Yip et al. 2020). Worldwide, only Venezuela, the United States, and China maintained their status as the most prolific nations by generating a maximum number of documents on Cloud Computing in library services; elsewhere, citations amount are as high as 8,212, and vary to 2,657, 1,661, and so on. The most prominent publications from 2002 to 2023 were produced in China (247), the USA (232), and India (136) (Zhou et al. 2019).
Washington University School, Stanford University, and Harvard Medical School are the most prolific institutions in publishing on the field of Cloud Computing in libraries (Chen 2019). Elsewhere, the research of Lecture Notes in Computer Science, ACM International Conference Proceeding Series was identified as the most prolific source in Cloud Computing within the domains of LIS (Harisanty et al. 2022).
The study demonstrates that “Assessing the determinants of cloud computing adoption and analysis of the manufacturing and services sectors” is the most cited research paper, with 8,212 citations. The focus on country collaboration among researchers indicates most links are with the United States, with 32, followed by India with 22 and China with 20.
The study also analyzed data on scientific publications related to the topic of “cloud computing in the library” and found that there are many publications on the subject, with keywords such as “cloud computing,” “big data,” and “cloud services.” China and the United States had the most significant amount of publications (n = 187, n = 81), with the maximum number of citations from Venezuela and the UK (TC = 8,212, TC = 2,657), with the most frequently used keyword being “cloud computing.” The study used a three-factor analysis: Country, Author, and Affiliation. The graph indicates that China and the USA are the most productive countries in research output.
The Lecture Notes in Computer Science (Including SUBSE) is the most prominent source for the production of scholarly articles from 2002 to 2023. The sources have been produced differently over the years, while production has gradually increased since 2010, with the authors Wang and Zhang noteworthy in constantly producing scholarly content on Cloud Computing research. In summary, this study provides valuable insights into the current state of research on organizational politics and offers suggestions for future research directions.
Acknowledgments
We would like to express our heartfelt gratitude to everyone who contributed to the development and completion of this article. We are especially thankful to our parents and our university for their invaluable support and insights throughout the research process. A special acknowledgment goes to Dr. Appasaheb Naikal for his assistance and guidance, which greatly enhanced the quality of this research.
-
Research ethics: Not applicable.
-
Informed consent: Not applicable.
-
Author contributions: All authors have accepted responsibility for the entire content of this manuscript and approved its submission.
-
Use of Large Language Models, AI and Machine Learning Tools: Not applicable.
-
Conflict of interest: Not applicable.
-
Research funding: Not applicable.
-
Data availability: Not applicable.
References
Adam, G., K. Gamoh, D. G. Morrison, and H. Duncan. 2002. “Effect of Alcohol Addition on the Movement of Petroleum Hydrocarbon Fuels in Soil.” Science of the Total Environment 286 (1–3): 15–25. https://doi.org/10.1016/S0048-9697(01)00956-1.Suche in Google Scholar
Akhavan, P., N. A. Ebrahim, M. A. Fetrati, and A. Pezeshkan. 2016. “Major Trends in Knowledge Management Research: A Bibliometric Study.” Scientometrics 107 (3): 1249–64. https://doi.org/10.1007/s11192-016-1938-x.Suche in Google Scholar
Alhassan, I., K. Agyekum, and A. Osei. 2020. “Cloud Computing in Libraries: A Systematic Review of the Literature.” Library Management 41 (6): 421–34. https://doi.org/10.1108/LM-01-2020-0012.Suche in Google Scholar
Almulhim, A. I., M. Aqil, S. Ahmad, and I. M. Abdel-Magid. 2021. “Sustainable Water Planning and Management Research in Saudi Arabia: A Data-Driven Bibliometric Analysis.” Arabian Journal of Geosciences 14 (18). https://doi.org/10.1007/s12517-021-08353-z.Suche in Google Scholar
Asim, M., M. Arif, M. Rafiq, and R. Ahmad. 2024. “Investigating Applications of Artificial Intelligence in University Libraries of Pakistan: An Empirical Study.” The Journal of Academic Librarianship 49 (6): 102803. https://doi.org/10.1016/j.acalib.2023.102803.Suche in Google Scholar
Bhuyan, A., K. Sanguri, and H. Sharma. 2021. “Improving the Keyword Co-occurrence Analysis: An Integrated Semantic Similarity Approach.” In 2021 IEEE International Conference on Industrial Engineering and Engineering Management (IEEM), 482–7. Singapore: IEEE.10.1109/IEEM50564.2021.9673030Suche in Google Scholar
Chai, K., and X. Xiao. 2012. “Understanding Design Research: A Bibliometric Analysis of Design Studies (1996–2010).” Design Studies 33 (1): 24–43. https://doi.org/10.1016/j.destud.2011.06.004.Suche in Google Scholar
Chen, S.-C. 2019. “Undergraduate Students Use of Mobile Apps to Search Library Catalogs.” Library Hi Tech 37 (4): 721–34. https://doi.org/10.1108/LHT-12-2018-0198.Suche in Google Scholar
Donthu, N., S. Kumar, D. Mukherjee, N. Pandey, and W. M. Lim. 2021. “How to Conduct a Bibliometric Analysis: An Overview and Guidelines.” Journal of Business Research 133: 285–96. https://doi.org/10.1016/j.jbusres.2021.04.070.Suche in Google Scholar
Ellegaard, O., and J. A. Wallin. 2015. “The Bibliometric Analysis of Scholarly Production: How Great Is the Impact?” Scientometrics 105 (3): 1809–31. https://doi.org/10.1007/s11192-015-1645-z.Suche in Google Scholar
Güzeller, C. O., and N. Çeliker. 2018. “Bibliometric Analysis of Tourism Research for the Period 2007–2016.” Advances in Hospitality and Tourism Research 6 (1): 1–22. https://doi.org/10.30519/ahtr.446248.Suche in Google Scholar
Harisanty, D., N. E. V. Anna, T. E. Putri, A. A. Firdaus, and N. A. Noor. 2022. “Leaders, Practitioners and Scientists’ Awareness of Artificial Intelligence in Libraries: A Pilot Study.” Library Hi Tech 42 (3): 809–25. https://doi.org/10.1108/LHT-10-2021-0356.Suche in Google Scholar
Hicks, D., and J. Melkers. 2013. “Bibliometrics as a Tool for Research Evaluation.” In Handbook on the Theory and Practice of Program Evaluation, edited by A. N. Link. Edward Elgar Publishing.10.4337/9780857932402.00019Suche in Google Scholar
Karthika, S., J. Dominic, S. Sivankalai, and K. Sivasekaran. 2024. “Applications of Cloud Computing in Academic Libraries.” In 2024 International Conference on Advances in Computing, Communication and Applied Informatics (ACCAI), 1–4.10.1109/ACCAI61061.2024.10601745Suche in Google Scholar
Kaur, R., and S. Kaur. 2021. “Trends in Cloud Computing Applications in Libraries: A Bibliometric Analysis.” The Journal of Academic Librarianship 47 (2): 102–10. https://doi.org/10.1016/j.acalib.2020.102123.Suche in Google Scholar
Lawrence, P. A. 2003. “The Politics of Publication.” Nature 422: 259–61. https://doi.org/1010138/422259a.10.1038/422259aSuche in Google Scholar
Mabawonku, T. O., J. Babatope, P. C. Anyanwu, and E. B. Akintunde. 2024. “Adoption of Cloud Computing in Academic Libraries in Lagos and Ogun States.” Preservation Digital Technology & Culture 53 (4): 259–66. https://doi.org/10.1515/pdtc-2024-0039.Suche in Google Scholar
McBurney, M., and P. Novak. 2002. “What Is Bibliometrics and Why Should You Care?” In IEEE Xplore. Professional Communication Conference, 2002. IPCC 2002. Proceedings, 108–14. IEEE International.10.1109/IPCC.2002.1049094Suche in Google Scholar
Mokhtar, I. A., S. M. Alshahrani, and I. Alhassan. 2021. “The Role of Cloud Computing in Enhancing Library Services: A Review.” Information Technology and Libraries 40 (3): 1–15. https://doi.org/10.6017/ital.v40i3.12345.Suche in Google Scholar
Naveed, M., N. Ali, S. A. Khan, and K. Shahzad. 2023. “A Bibliometric Analysis of Library Automation Software Research from 2001–2022: Evidence from the Web of Science (WoS).” Global Knowledge, Memory and Communication. https://doi.org/10/1108/GKMC-06-2023-0194.10.1108/GKMC-06-2023-0194Suche in Google Scholar
Rehn, C., and U. Kronman. 2008. Bibliometric Handbook for Karolinska Institutet. Karolinska Institutet University Library.Suche in Google Scholar
Santos, R., A. A. Costa, and A. Grilo. 2017. “Bibliometric Analysis and Review of Building Information Modelling Literature Published between 2005 and 2015.” Automation in Construction 80: 118–36. https://doi.org/10.1016/j.autcon.2017.03.005.Suche in Google Scholar
Traynor, M., and A. M. Rafferty. 2001. “Bibliometrics and a Culture of Measurement.” Journal of Advanced Nursing 36 (2): 167–8. https://doi.org/10.1046/j.1365-2648.2001.02017.x.Suche in Google Scholar
Waghmare, P. B. 2020. “Indian Research Contribution in Cloud Computing: A Bibliometric Analysis and Visualization of Journal Articles from Scopus Database.” Library Philosophy and Practice 4354.Suche in Google Scholar
Yip, K. H. T., P. Lo, K. K. W. Ho, and D. K. W. Chiu. 2020. “Adoption of Mobile Library Apps as Learning Tools in Higher Education: A Tale between Hong Kong and Japan.” Online Information Review 45 (2): 389–405. https://doi.org/10.1108/oir-07-2020-0287.Suche in Google Scholar
Yu, J., Z. Yang, S. Zhu, B. Xu, S. Li, and M. Zhang. 2018. “A Bibliometric Analysis of Cloud Computing Technology Research.” In 2018 IEEE 3rd Advanced Information Technology, Electronic and Automation Control Conference (IAEAC), 2353–8. IEEE.10.1109/IAEAC.2018.8577750Suche in Google Scholar
Zhou, H., D. Zheng, Y. Li, and J. Shen. 2019. “User-opinion Mining for Mobile Library Apps in China: Exploring User Improvement Needs.” Library Hi Tech 37 (3): 325–37. https://doi.org/10.1108/LHT-2018-0066.Suche in Google Scholar
Zupic, I., and T. Čater. 2015. “Bibliometric Methods in Management and Organization.” Organizational Research Methods 18 (3): 429–72, https://doi.org/10.1177/1094428114562629.Suche in Google Scholar
© 2025 the author(s), published by De Gruyter, Berlin/Boston
This work is licensed under the Creative Commons Attribution 4.0 International License.
Artikel in diesem Heft
- Frontmatter
- Editorial
- Editorial: Bridging Innovation and Heritage in Digital Preservation
- Articles
- Mapping Research Trends in Cloud Computing Applications for Libraries: A Bibliometric Approach
- Evaluating the Impact of Optimizer Hyperparameters on ResNet in Hanacaraka Character Recognition
- Analysis of Software Requirement Specification and Use Case Diagram of Metaverse Museum Muhammadiyah
- Using Digital Technologies for Indigenous Sociocultural Advancement in an Era of AI: A Systematic Critical Synthesis
- Digital Preservation and Access to Cultural Heritage in South Africa: The Case of the African Rock Art Digital Archive
- Sustaining Community Archives in the Post-Custodial Digital Environment
- Automated Prediction of Preservation Index in Library Environments through Multiple Regression Analysis