From Drawing into Digital: On the Transformation of Knowledge Production in Postexcavation Processing
-
Felix Rösch


Abstract
Digital methods have undoubtedly become an integral part of archaeology in recent decades. This has had a major impact on how archaeological knowledge is produced. Accordingly, there has been a recent increase in the number of studies addressing this issue and calling for a reflexive approach. Although studies have so far focused on the changes in knowledge production in fieldwork practices, studies of postexcavation processes are rare. This way of archaeological knowledge production is described using the analysis of old excavation documentation of the medieval waterfront of Schleswig, northern Germany, through geographic information system. It is achieved by an approach that combines the methodological tool of a chaîne opératoire with concepts based on the actor-network theory, whereby the production of knowledge is understood as a translation network. The approach reveals the individual processing steps and how the data change. Accordingly, for each step, not only are the applied practices described in detail, but also the influence of actors, devices, and documents is mentioned. This allows not only a critical reflection of the approach and a review of the interpretation, but also demonstrates that profound archaeological findings are possible despite data alteration through digital methods.
1 Introduction
In the late 1960s and early 1970s, the largest excavation campaigns to date were launched at the Viking Age emporium of Hedeby, now a UNESCO World Heritage site, and its medieval successor Schleswig. The declared goal was to learn as much as possible about the topography of the (proto-)urban sites. For this purpose, an excavation methodology was developed, which should enable a large-scale uncovering of the excellently preserved organic features (Schietzel, 1981, 2014, pp. 35–84; Vogel, 1983). For this purpose and with the help of prisoners, levelings 15 cm deep were carried out with the so-called planum method. The resulting artificial plana were then documented in drawings, while the finds were literally “abgebaut [mined] (Schietzel, 2014, p. 47)” in large 25 m2 quadrants and only measured in individual cases (Figure 1). Although this method led to hoped-for quick results about the topography and provided a range of the find spectrum of the site, it proved difficult to get a fine chronological depth into the settlement topography because the original stratigraphy of the site could hardly be reconstructed from the drawings. This is a problem that has been widespread due to the common use of comparable excavation standards in Germany and beyond.

Schema of the fieldwork workflow conducted in Hedeby and Schleswig: (a) digging off a quadrant, (b) prepared quadrant, (c) measuring individual finds, and (d) drawing the features (after Schietzel, 2014, p. 53).
Although the excavation methodology in German town centers has meanwhile been adapted to the more precise and internationally applied stratigraphic method, the problem of the impossibility of in-depth evaluations of excavations conducted to standards that are insufficient from today’s point of view remained for a long time. With the digital revolution, however, tools have become increasingly available that allow a detailed analysis of these analog data but also entail a changed archaeological knowledge production.
Since the 1980s, and increasingly since the 1990s, digital methods and applications have entered archaeology. This affects many, though not all, areas of archaeology: although excavation itself, that is to say, uncovering, is still done through common practices, and work such as sieving and washing finds still follows conventional practices, most other areas of archaeological or archaeology-related practices (Huvila & Huggett, 2018, p. 94) have been affected by digitization to varying degrees: from correspondence, which has changed to the digital almost everywhere, to documentation and surveying on excavations using total stations, GPS and GNSS receivers, to digital photography and structure-from-motion, to laser scanners and digital drawings using CAD software or tablets. Hybridization can also still be observed in the field of find documentation, where drawings, which at least in German-speaking countries still enjoy a high reputation (Czysz, Dietrich, Ebner, Köglmeier, & Nadler, 2006, p. 390), exist in parallel to digital photography and meanwhile also 3D scans (Eve, 2018), but in the end are transferred to digital by means of scanners and software. It is hard to imagine excavation processing without digital applications. If geographic information system (GIS), CAD and database, and statistics applications are not used for evaluation and presentation, at least graphics-processing programs and simple table calculation software are used. Even in publishing, manuscripts have become a rarity – word processing programs are part of the standard repertoire. A condition that M. Kersel sums up as follows: “I believe we live a semi-digital kinda life” (Kersel, 2016, p. 477).
This continuous transformation of archaeological practices through digital methods has been perceived as a challenge early on (Huggett, 2000). However, it is only in recent years that the number of studies on the topic has been growing and voices have been raised to make the study of knowledge production in the digital age a major topic, as the changes are profound and are proceeding at great speed. Last but not least, the COST Action ARKWORK and this volume are a result of this awareness.
This is also happening against the background of an increasing number of critical voices accusing the users of digital methods of technodeterminism or even technology fetishism (Huggett, 2004, 2015, p. 87; Huvila & Huggett, 2018; Olsen, Witmore, Shanks, & Webmoor, 2012, p. 123). In many cases, archaeologists are no longer guided by cultural–historical questions (as long as they are not subject to the dictates of contract archaeology), but by the availability and the hype surrounding a method. In addition to new documentation and presentation possibilities, such as 3D models and interactive maps, the economization of processes is often cited as a legitimization of the choice of method (Berggren & Hodder, 2003; Kansa, 2016, p. 443). However, it is often forgotten that the introduction of new digital applications and technologies does not necessarily make (archaeological) work easier and more pleasant, but also brings with it high expectations and increased demands on the users (Woods & Dekker, 2000). For example, it is necessary to acquire basic knowledge of a whole range of software programs, some of which are highly complex. Keeping up to date with updates, extensions, successor versions, and changed user interfaces requires a considerable amount of time – in addition to the actual archaeological work and research. A challenge that does not apply to the practice of archaeological drawing, for example.
Even if digital methods are not rejected in principle, concepts like the idea of a “Slow Archaeology” (Caraher, 2016) have criticized the technodeterminism and the speed and effectivization often implied here, as the critical and profound examination of the method and thus the core of archaeological knowledge production often falls by the wayside. In Caraher’s view, the problem with the use of digital tools can be well understood with Latour’s “black box” concept (Latour, 1987; Latour & Woolgar, 1986), where processes and actions of knowledge production are obscured by routine, their complexity, or by a lack of expertise in the subject. In many ways, digital applications give the appearance of being the perfect black box (Olsen et al., 2012, p. 130), which means that it is rarely disclosed what happens to the data in the first place and how it is changed. The focus is on the result.
To force a critical and reflexive engagement with archaeological practice in the digital age, Huvila and Huggett (2018) called for a foundational discussion on the definition of archaeological practice in a recent position paper and advocate a separation between archaeological or archaeology-related practices that makes it possible to also describe methods and sources of neighboring disciplines.
Without question, the archaeological practice has expanded through digital applications. Meanwhile “the act of [archaeological] discovery” (cf. Edgeworth, 1991) is now also possible on the screen without ever setting foot in the field, as shown by the remarkable ethnological field study by Edgeworth (2014). With reference to GIS, Hacιgüzeller states that “walking across the landscape or excavating a site is not the only legitimate way to create archaeological knowledge” (Hacιgüzeller, 2012, p. 257).
As mentioned, the number of critical discussions of digital methods and reflections in archaeology is steadily increasing – even if sometimes the impression arises that they seem to get lost in the mass of publications on digital applications. The emphasis of studies of the emergence of archaeological knowledge, as in the case of studies without a focus on the digital (Davidović, 2009; Edgeworth, 1991; Hodder, 1997; Lucas, 2001, 2012; Yarrow, 2003) is still clearly on the fieldwork practices (Averett, Gordon, & Counts, 2016). A further limitation is that the objects of study are mostly well-funded research excavations at exceptional sites (Poehler, 2016; Taylor et al., 2018) while excavations from contract archaeology, which account for the lion’s share of the investigations, have so far only been subjected to critical examination in exceptional cases (Berggren & Hodder, 2003).
Reflections on specific digital applications are also increasing. Here, GISs that have been introduced in archaeology since the 1990s and play a central role in this paper are to be discussed in more detail. Since then, GISs have enjoyed steadily increasing popularity due to their diverse possibilities. Initially received by the archaeological community primarily as a tool for distribution mapping, there was soon a proliferation of work that focused on the potential of GIS in terms of landscape analysis and modeling (Hacιgüzeller, 2019, p. 263; Wheatley & Gillings, 2002). In addition, GIS is used in the postexcavation process and now also in the field (Rösch, 2016, 2019; Schultze, 2008; Tripcevich & Wernke, 2010; Van Riel, 2016). From the beginning, the application was met with much criticism, for example, that it promoted a positivist approach because, among other things, it did not reflect sensory perceptions of space, but abstracted and simplified it, and allowed results without understanding the processes behind them (Huggett, 2000, 2015, p. 91; Sheppard, 2005, p. 6; Wheatley, 1993, p. 133) – which brings us back to the black box. This was countered with reflexive approaches. GIS is just as much a tool as other methods and requires a corresponding examination of its function (Wheatley & Gillings, 2002, p. 9). Furthermore, it can stimulate critical thinking: “In many ways, learning GIS involves learning to think – learning to think about patterns, about space and about processes that act in space” (Eastman, 2003, p. 20). Even if Witmore still had to state in 2013 “It is remarkable, given the necessity of maps for the work of archaeology, that so little has been written on what it is they actually do in the context of archaeological knowledge production” (Witmore, 2013, p. 128), the view on GISs as interactive mapping tools has recently been increasingly directed toward the aspect of archaeological knowledge production (Gillings, Hacιgüzeller, & Lock, 2019, 2020a; Hacιgüzeller, 2012) – “it is crucial to stress from the very start that underlying any application of these techniques [in GIS] must be the why we do it” (Gillings, Hacιgüzeller, & Lock, 2020b, p. 1).
Thus, fieldwork practices and a number of digital methods have already become the subject of critical debates and studies on knowledge production. It has been pointed out that “the ‘digital turn’ fundamentally changes how ‘data’ are achieved” and that is not just “any one-to-one media turnover with the updating of equipment” (Olsen et al., 2012, p. 123). However, as far as the transfer of analog excavation documentation – be it from old excavations or from current, semidigitally conducted fieldwork – into the digital is concerned, the author is hardly aware of any studies to date that (cf. Gupta, 2020), apart from a more extensive source criticism, deal more intensively with the practices carried out and the changes in the data in the course of an (old) excavation analysis. Especially in the 1960–1980s and driven by economic upswings of the postwar period such as the Wirtschaftswunder in Germany, sometimes huge areas with highly complex feature structures were uncovered and documented, particularly in the old towns of Europe. At that time, only a fraction of these excavations were systematically evaluated, which was, on the one hand, due to the nature of the questions (Müller, 2013; Scholkmann, 1997/1998); for example, in Haithabu and Schleswig, it was mainly a matter of uncovering features (Schietzel, 2014, p. 48; Vogel, 1983, pp. 10–11). On the other hand, it was due to the lack of technical implementation possibilities: the data were simply too extensive and multidimensional to be able to relate them to each other using analog techniques (see below).
With the digital revolution and the accompanying implementation of computer applications, it has now become possible to fully analyze these data. In the field of medieval early urban centers alone, numerous works can be cited from the last two decades, including Hedeby (Kalmring, 2010; Schultze, 2008), Schleswig (Rösch, 2018a), Dorestad (Van Es & Verwers, 2009), Bergen (Hansen, 2005), and Wolin (Rębkowski, 2019). They sometimes resulted in ground-breaking findings and encouraged the deconstruction of established narratives and their replacement by more differentiated understandings.
The knowledge potential of (re-)evaluations of old excavations can thus be classified as particularly high, but the detailed manner of knowledge production often remains obscured.
Their traces have been swept clean in the final professional publications, thus “tracking down these traces and way-finding with them to discover the original datum points can be daunting” (Olsen et al., 2012, p. 130).
This desideratum is going to be met by the approach presented in the following, which aims to disclose all steps of data transformation and interpretation in the evaluation of an old excavation and analog excavation documentation. This is not so much a systematic study as a kind of tool that raises awareness of the interpretative moment of the steps in the analysis: on the one hand, to understand the production of archaeological knowledge through digital methods applied and on the other to be able to retrace the (cultural–historical) interpretation of the features en détail.
The subject and background of this approach were the author’s evaluation of the so-called harbor excavations in the medieval town center of Schleswig that were carried out in the 1970s and 1980s according to uniform standards (Figure 2(6–10)). The scientists involved never succeeded in evaluating the excavations. A synopsis of findings that were considered important only took place in short articles, whereby it remained completely open as to which data the interpretations were based on and what evaluation practices were used (Vogel, 1983, 1992, 1999). In his own evaluation of the harbor excavations, the author contrasted those statements that were difficult to comprehend with the approach presented later (Vogel, 1971).

Schleswig old town. Excavations conducted until today (red = excavated area known; orange = excavated area insecure). Nos. 1–5 designate various old town excavations, 6–12 designate the harbour excavations, and no. 6 is the Plessenstraße 83/3 (Graphics: F. Rösch based on © GeoBasis-DE/LVermGeo SH (www.LVermGeoSH.schleswig-holstein.de) ATKIS®Basis-DLM 2013, DTK 5).
2 Archaeological Research in Schleswig
Schleswig, the medieval successor to Hedeby, was founded in the second half of the eleventh century and reached its heyday as an economic superior center shortly after. The town, which was also the center of a bishopric and royal town of the Danish king, prospered as a trading hub between North Sea and Baltic and Continent and Scandinavia until the thirteenth century. Due to a slight increase in groundwater and thus the covering and sealing of the oldest layers as well as the absence of deeply founded constructions, wooden structures and numerous finds of organic material from early Schleswig are excellently preserved in the soil.
Larger archaeological investigations did not begin until the late 1960s. In the course of a large restoration campaign, several excavations were conducted in the old part of the town until the mid-1980s. In those years, almost 10% of the historical old town of Schleswig was investigated by archaeologists (Figure 2). The excavation and documentation standard applied was the same as in Hedeby. After a local measurement system was set up, the area of interest was divided into trenches that could be covered by a mobile tent all year long. Each trench was dug down through 15 cm of artificial layers. Each layer was then drawn on a scale of 1:20 by using a standardized color scheme and complemented by written information such as measurements, samples, heights, and extraordinary soil components. The same procedure was used for the profiles when the natural soil was reached (Figure 1). Unlike today’s standards, no written documents such as feature descriptions, context sheets, or lists were completed. Also, no systematic photographic documentation was undertaken; the same applied to keeping a diary. The excavators were convinced that all information necessary was recorded on the drawings (Figure 3).

Extract of a planum drawing from trench 9 of the Plessenstraße 83/3 excavation (Archive of the Archaeological Museum Schloss Gottorf).
The finds were collected in large 25 m² grids per layer while only special finds were calibrated exactly. This means that they were, in most cases, taken out of context. Although soil sampling was done just in exceptional cases, a large amount of wood was subjected to dendrochronological sampling, resulting in an excellent basis to answer questions of absolute chronological dating.
Although the processing of many find categories was strongly promoted in Schleswig – focusing on mainly technical and chronological aspects and not considering the context – the archaeological features were only briefly published. The author attempted to meet this desideratum from 2012 to 2015. The major task was to investigate the almost 10,000 wooden features that have been recorded in the largest excavation in Schleswig, the Plessenstraße 83/3 (Figure 2(6)). It was carried out during the 1970s in the former transition area between the old town peninsula and the Schlei bay and presented features that were associated with the former harbor. The author faced almost 250 large-scale drawings stemming from 19 trenches as well as more than 500 dendro samples. To manage this huge number of drawings and gain as much information as possible from them, a GIS (ArcGis 10.2) linked with a MS Access database was used. The different archaeological features were digitized, processed, and visualized in 2D as well as in 3D. This approach led to a basis for the analysis of the wooden features and adjoined features of the Plessenstraße 83/3, which finally resulted in the cultural–historical interpretation of the medieval Schleswig waterfront (Rösch, 2018a, 2018b).
3 Approaches to the Study of Archaeological Knowledge Production
In the 1980s, in the context of Science and Technology Studies, scholars such as Callon (2001) and Latour (1987, 1999) developed the actor-network theory (ANT), which was to prove viable in the following decades, especially for the study of archaeological knowledge production.
ANT is not so much an explanatory theory in the classical sense, but rather a method or approach that makes it possible to explore relationships in a network (Latour, 1996, p. 374). Essential is the integration of things, because the ANT assumes that social networks develop not only between people but also between people and things as well as between things. According to Latour, things are also to be understood as acting entities, which are called actants as distinct from human actors. ANT thereby assumes that people and things only acquire their attributes and properties in their relationship to other entities. The actor network itself arises from the fact that actions of actors always occur in dependence on other actors or entities and are never detached from each other. The networks are short-lived and, to last, relationships have to be repeated regularly (Latour, 1987, 1999; Latour & Woolgar, 1986).
ANT has been referenced by archaeologists to study the production of knowledge during archaeological excavations. For example, Yarrow examined “how people and things modify one another in the act of excavation” (Yarrow, 2003, p. 66), concluding that excavation leads to the modification of not only things but also of people. In Germany, excavations were analyzed in detail by Davidović (2009), who traced the steps from planning to the final excavation report. She examined knowledge production as a translation network, which in ANT means the whole process of interaction and connection between heterogeneous elements within the establishment of an actor network. Part of this translation network is the transformation of the complexity and ambiguity of features into unambiguous statements – so-called inscriptions. This includes all types of fixations on the object of research that are generated through the interaction of people and instruments. These can be written documents, drawings (cf. Figure 3), photographs, graphs, tables, notes, sketches, reports, and publications (Davidović, 2009, pp. 24–25; Latour, 1999, pp. 306–307; Lucas, 2012, pp. 254–256). This aspect of transformation, one might call it a translation network in a narrower sense, will be particularly referred to in the approach presented in this article.
The actor network of excavation consists of the human actors, who are characterized by a wide range of individual knowledge, skills, conventions, and traditions. Especially in the act of excavation itself, tacit knowledge (Polanyi, 1958, p. 92) plays a major role, an implicit knowledge that can only be passed on orally and in common actions – for example, the recognition of features. Through this individual conditioning, each actor influences archaeological practice in a unique way. On the other hand, the network includes nonhuman actants such as features with their climatic, soil-forming and ecological conditions, excavation equipment, instruments, and tools as well as the inscriptions. However, it must be noted that not everywhere a distinction is made between actor and actant. Often, it is simply spoken of actors, in which case nonhuman entities are also implied. In this article, the dichotomous pair of terms is applied.
The process in the translation network as applied in this paper can be vividly illustrated by the example of the identification of strata in the profile. Using a tool, an actant, in Germany often a measuring needle, the layer boundaries identified by the actor are carved into the profile, a second actant. Layer recognition depends both on the knowledge of the actor – for example, how familiar he is with the local soil structure and whether he is already familiar with layer compositions and findings – and on the type of profile, in which layers can be differentiated to varying degrees depending on soil, light, and moisture conditions. The result is an engraved profile, a temporal inscription, in which debatable and ambiguous stratifications are given unambiguous boundaries and microstratified strata are generally not considered. Thus, the stratum composition is represented in a simplified way, a process to be understood as “explizite Inskriptionspraxis [explicit inscription practice]” (Davidović, 2009, p. 106). In a further step, the engraved profile is then drawn, that is to say, transformed into a further inscription, the drawing, where, starting with the choice of crayons, numerous other actants and the drawing actor influence the result, which is to be understood as a radical simplification of the profile.
The production of archaeological or scientific knowledge is thus always preceded by a selection or interpretation with each step of its generation. By transforming ambiguities into unambiguities in many cases, by fading out practice and decisions made, a reduction in the complexity of the original findings takes place (Davidović, 2009, p. 125f). However, new information is integrated into the inscription by the actor too, a process that Latour (1999, p. 64) calls transubstantiation. Thus, “wissenschaftliches Wissen ist ein soziales Produkt, das im Spannungsfeld von Praktiken, Übersetzungsprozessen und Interaktionen entsteht [scientific knowledge is a social product that emerges in the stress field between practices, translation processes, and interactions]” (Davidović, 2009, p. 61; Lucas, 2012, pp. 253–256). And, as the example has demonstrated, this is true not only for cultural–historical classifications but also for simple technical operations, which are often misunderstood as “objective” neglecting their nature as social product and its interpretative constitution (cf. also Yarrow, 2003).
Moreover, Latour’s concept of the “circulating reference” has found broad acceptance in the study of archaeological knowledge creation. First introduced in 1993 (Latour, 1993), it enjoys great relevance until today (Fowler, 2013; Grunwald, 2016; Hofmann, 2018; Olsen et al., 2012). The concept was based on Latour’s observations of interdisciplinary fieldwork in the South American jungle and description of knowledge production from forest to expedition report.
Through standardized, conventionalized, and (reversible) practices of transforming the world into representations, material and linguistic changes or translations are produced. Here, too, the transformation from matter to form (Latour, 1999, pp. 69–74), as exemplified earlier by the example of the identification of strata, is central. The transformation process is designed as a chain, which from link to link represents a trade-off, because with each information-producing step there is a lossy but not sharp break (gap). Thus, locality, particularity, materiality, multiplicity, and continuity can be lost – it comes to a reduction. But there is also a gain inherent in each step, which is expressed in compatibility, standardization, text, calculation, circulation, and relative universality – that is to say, an amplification takes place (Latour, 1999, pp. 70–71, Figure 2.22). Inscriptions resulting from these steps are thus both affected by a reduction and provided with a gain of information. Because the chain links refer to each other in both directions, the sequence is principally reversible; “chains of reference are created” (Olsen et al., 2012, p. 98). To prevent the chain from breaking, the references must make the transformation process traceable.
How this traceability is achieved depends on the type of knowledge production. In archaeological edition projects, this is attempted through a system of references that allows for control of the data (Hofmann, 2018, pp. 200–201). In the Teotihuacan Mapping Project (TMP), the authors describe the result of the map created like this: “Instead of a correspondence of the TMP map to the ruins of Teotihuacan, we have an actively manipulated transformation that holds something of the reality of the site” (Olsen et al., 2012, p. 97). In her study of early archaeological mapping in Germany, Grunwald (2016) again uses the concept of the “circulating reference” to illustrate the loss of information involved in transferring finds to maps.
The concept is also suitable for digital media, but according to Olsen et al. (2012, pp. 122–128, Figure 6.4) it needs to be “upgraded.” This is because the digital performs differently when the material world is transformed into a binary code. Thus, the numerous individual computational operations cannot be broken down individually and are subsumed under operational steps in the chains of transformation. For the user, the reference to the material can only be grasped at the level of units such as pixels or polygons, which can be combined to form large entities but retain their independence. Thus, while the transformation of the material world into much smaller constituents occurs compared to analog references, the digital representation can be more substantial overall, so that each step toward amplification does not necessarily result in a reduction.
4 Revealing the Translation Network – A Chaîne Opératoire of Interpretation
For the investigation of knowledge production and data transformation in the context of the digital analysis of Plessenstraße 83/3, the concept of the ANT following Latour’s work was considered an appropriate framing. In particular, Davidovic’s study served as orientation for the methodological approach, while the concept of circulating reference provided further foundations for understanding how the archaeological interpretation was achieved.
To make the transformation process easier to trace and more accessible, the concepts outlined were merged with a chaîne opératoire. The chaîne opératoire, which was introduced in 1964 by the anthropologist Leroi-Gourhan (1964), is a methodological tool to explain technical processes and the social acts involved. It helps to analyze and describe the processes step by step to understand not only technical operations but also the social contexts, actions, and cognitions in the production (Darvill, 2008, p. 78). In archaeological contexts, it has frequently been used to reveal workflows such as lithic reduction (Soressi & Geneste, 2011) or in the field of archaeometallurgy (Stöllner, 2008, 2014, pp. 134–135).
However, the tool chaîne opératoire can also help to highlight and examine the steps of knowledge production. This becomes obvious when one considers the “series of transformations” described by Latour (1999, p. 70, Figure 2.21). As both concepts work with single steps or chain links, they can be complemented to form an approach. In this way, the chaîne opératoire enables one to look at the process of translation, highlighting the interpretation in detail. Every chain link parallelizes with a work step in which the data are changed through the interplay of actor and actant and results in a new inscription. The results of the interpretational chaîne opératoire can easily be depicted as a matrix that summarizes the findings and serves as a guide through the steps of knowledge production (Figure 4).

Chaîne opératoire depicting the steps in the production of archaeological knowledge from the analysis of the Plessenstraße 83/3 excavation (Graphics: F. Rösch).
4.1 The Excavation
To reveal the individual steps, the first task was to trace the historical excavation process from planning to the first reports and publications. As it is not the topic of this article, it will only be briefly described. First, the sequence of events had to be deduced from the documentation, publications, and oral interviews with, among others, the former archaeologist in charge, Vogel, and the draftsman, Karrasch (Rösch, 2018a, pp. 55–66, com. 51). This meant that the individual work steps in the excavation could be only roughly reconstructed. For the subsequent evaluation and publication of the findings by the archaeologist, it was not possible, due to a lack of information, to understand what interpretations were made and why, and what inscriptions were used here. It is important to note that for these reasons the interpretive steps of this part of the translation network are rather broad and cannot claim to have revealed all transformations.
The chaîne opératoire (Figure 4) begins at the planning level of urban planners and archaeological actors, who designed the scientific question and provided the necessary financial means with a project design. This was followed by the first preliminary soil investigations, the determination of the excavation area, and the excavation preparations until earthworks began in the fifth interpretation step, which culminated in the seventh step in the drawing and photographic documentation as well as sampling (Figure 5). Based on these inscriptions and the recovered finds, first evaluations were carried out: steps 8 and 9 (Rösch, 2018a, pp. 45–59). Numerous aspects that had a clear influence on the production of knowledge could be identified. For example, the strict hierarchization, which is, despite some weakening, still the rule in Germany today, with the exception perhaps of research excavations undertaken by universities (Carver, 2004, p. 135; Davidović, 2009, p. 101). In principle, it is divided into “data-producing” actors, technicians, and workers, whose activity is often understood as a technical–mechanical process for objective data acquisition, and “data-evaluating” scientific actors, whose activity is associated with higher prestige (Davidović, 2009, p. 99). This hierarchization, which was reinforced in Schleswig by the use of prisoners who were forbidden even to wash finds, left much individual knowledge unconsidered. This applies both to the “tacit knowledge” and to the “local knowledge” (cf. Gardin, 1989), which is the result of working on an archaeological situation for a longer period of time.

Workers and the draftsman in trench 10 in front of a mobile tent in the second half of the 1970s. In the background, the St. Petri cathedral is visible (Archive of the Archaeological Museum Schloss Gottorf).
4.2 The Analysis
As it was no longer possible to check the information recorded in the documentation against the original situation, the author had to rely on the inscriptions for the evaluation. Here, validity of the data can arise if inscriptions can be repeatedly compared with situations observed with one’s own eyes or records of other features (Lucas, 2001, p. 213).
The evaluation of the excavation findings using digital applications began in the 10th step of the chaîne opératoire. According to the updated concept of the circular reference by Olsen et al. (2012, pp. 126–127) described earlier, the single steps were not fragmented to the level of every computational process but stayed on the level of digital inscriptions that technically resulted from these. In many steps, several operations have been undertaken in parallel. For a better understanding, there is a focus on the processing of the plana drawings, which is represented by the middle root of the chaîne opératoire between 10 and 13 (Figure 4). It started with the scanning of 181 original planum drawings (Figure 3). For this purpose, the drawings, which were drawn on transparent film so that they could be analyzed on a light table, were scanned with a large-format scanner. The hand-drawn plans were thus translated into a digital image format (TIF with 600 dpi), which resulted in a slight change in the colors. The color representation not only depends on the scanner, the software used, and the parameters selected, such as the choice between RGB and CMYK, which is often used for print products, but it is also strongly determined by the choice of the monitor and the graphics card. Depending on the selection and composition of the hardware and software, over which the scientific actor often has only limited influence, the chromaticity on the screen changes.
In the same step, a local coordinate system was set up in the GIS, based on the specifications of the excavation. Here, the scanned drawings, on which the local coordinates were noted, could now be referenced, that is to say, located in the coordinate system. As up to 18 layers were excavated per trench, there were consequently up to 18 referenced drawings on top of each other. The sequence of the layers per section was simulated in the layer window, in which the arrangement of the layers, at this processing stage the referenced drawings, was defined in their height ratio. By selecting and deselecting the individual layers, it was possible to follow the progress of the excavation and documentation.
After this preliminary work, the actual digitization of the analog excavation documentation began. A technician experienced in the use of GIS and excavation documentation digitized the planum drawings, not as a whole, but according to three previously defined categories: wood, stone, and soil layers. The digitization was done using vector graphics saved in shape format, which can be points, lines, or closed polygons. These differ from the raster files represented as pixels, which also include the TIF format used for the scanned plans, in that they consist of nodes connected by lines that are recalculated for each zoom level. They, therefore, never appear “blurred.” Each shapefile can contain any number of features, that is to say, individual elements. For the digitization of Plessenstraße 83/3, the features assigned to the earlier categories in the drawing were drawn as polygon features. The “drawing off” was initially done by means of a mouse on the screen, which in a narrower sense can be described as “clicking off,” as nodes are set along the identified boundaries of a feature. Here, it was at the judgment of the technician how many nodes she set per object. Depending on the number and size of the element, the feature then appears angular or round to the human observer. Curves and arcs, however, are only simulated by a larger number of nodes. Here, the technical nature of this file format provides a limiting framework. This did not change when the use of other actants was introduced – a digitizing screen with a pen. This made it possible to “delineate” the drawn elements in arcs, but automatically set a node point at regular intervals (Figure 6).

Executing step 10: planum drawing from trench 9 with polygon layer of the wooden features on top (Graphics: F. Rösch).
As it must always be closed, the technical nature of the polygon feature “forces” the editor to define boundaries even if they are not present on the drawing. For example, if one timber lies above another and the dimension of the lower one is not indicated, a decision must be made on how the outline of the timber is to be completed. The same applies to the layer boundaries. Often these are not precisely defined and are only marked by color transitions. Different color signatures within an outlined layer also force the editor to decide. Hence, two particularly impressive examples of transubstantiation. An observation that was also made by Olsen et al. (2012, p. 126): “The decision as to where to ‘break down’ the stratigraphic profile into polygons remains relevant to archaeological interpretation and intervention.”
In addition to altering the form, this practice of digitizing individual elements also results in a complete leveling of plasticity. This is usually indicated by shading on archaeological drawings and thus allows curves, flattenings, indentations, signs of wear, fractures, and the like to be graphically represented or deliberately emphasized. The same applies to inclinations and slopes. The representation as polygons in a shapefile, on the other hand, leaves only two-dimensional outlines from which only little additional information can be derived visually. The original archaeological findings have thus been simplified yet again.
However, this is where a key strength of GIS comes into play – the linking of spatial data with attribute data. While raster data can contain only one additional piece of information per pixel, usually color or height value, vector data in shape format can be provided with any number of attributes. The attributes are each represented as individual columns in tabular form, with the same attributes applying to each feature of the shape (Figure 7). Various number formats, as well as text and dates of up to 240 characters in length, are possible as attributes. For each feature type, a set of attributes was defined in preparation for this purpose, and these were queried after each feature was completed. Although the information recorded in writing on the drawings, such as dimensions, sample numbers, height values, and layer descriptions, could be transferred 1:1, the challenge was to convert graphically transported information into a matchable numerical or textual form. This resulted in a complex translation process that demanded numerous interpretations from the actor. Among other things, directions of inclination represented by arrows were replaced by compass directions and it was determined whether the timber was standing or lying and what its cross-section was. It was more difficult with sloping elements with several height values or constructive elements such as nails, grooves, and recesses, whose size and nature could be noted, but their exact location on the wood could not be broken down uniformly due to the wealth of variants.
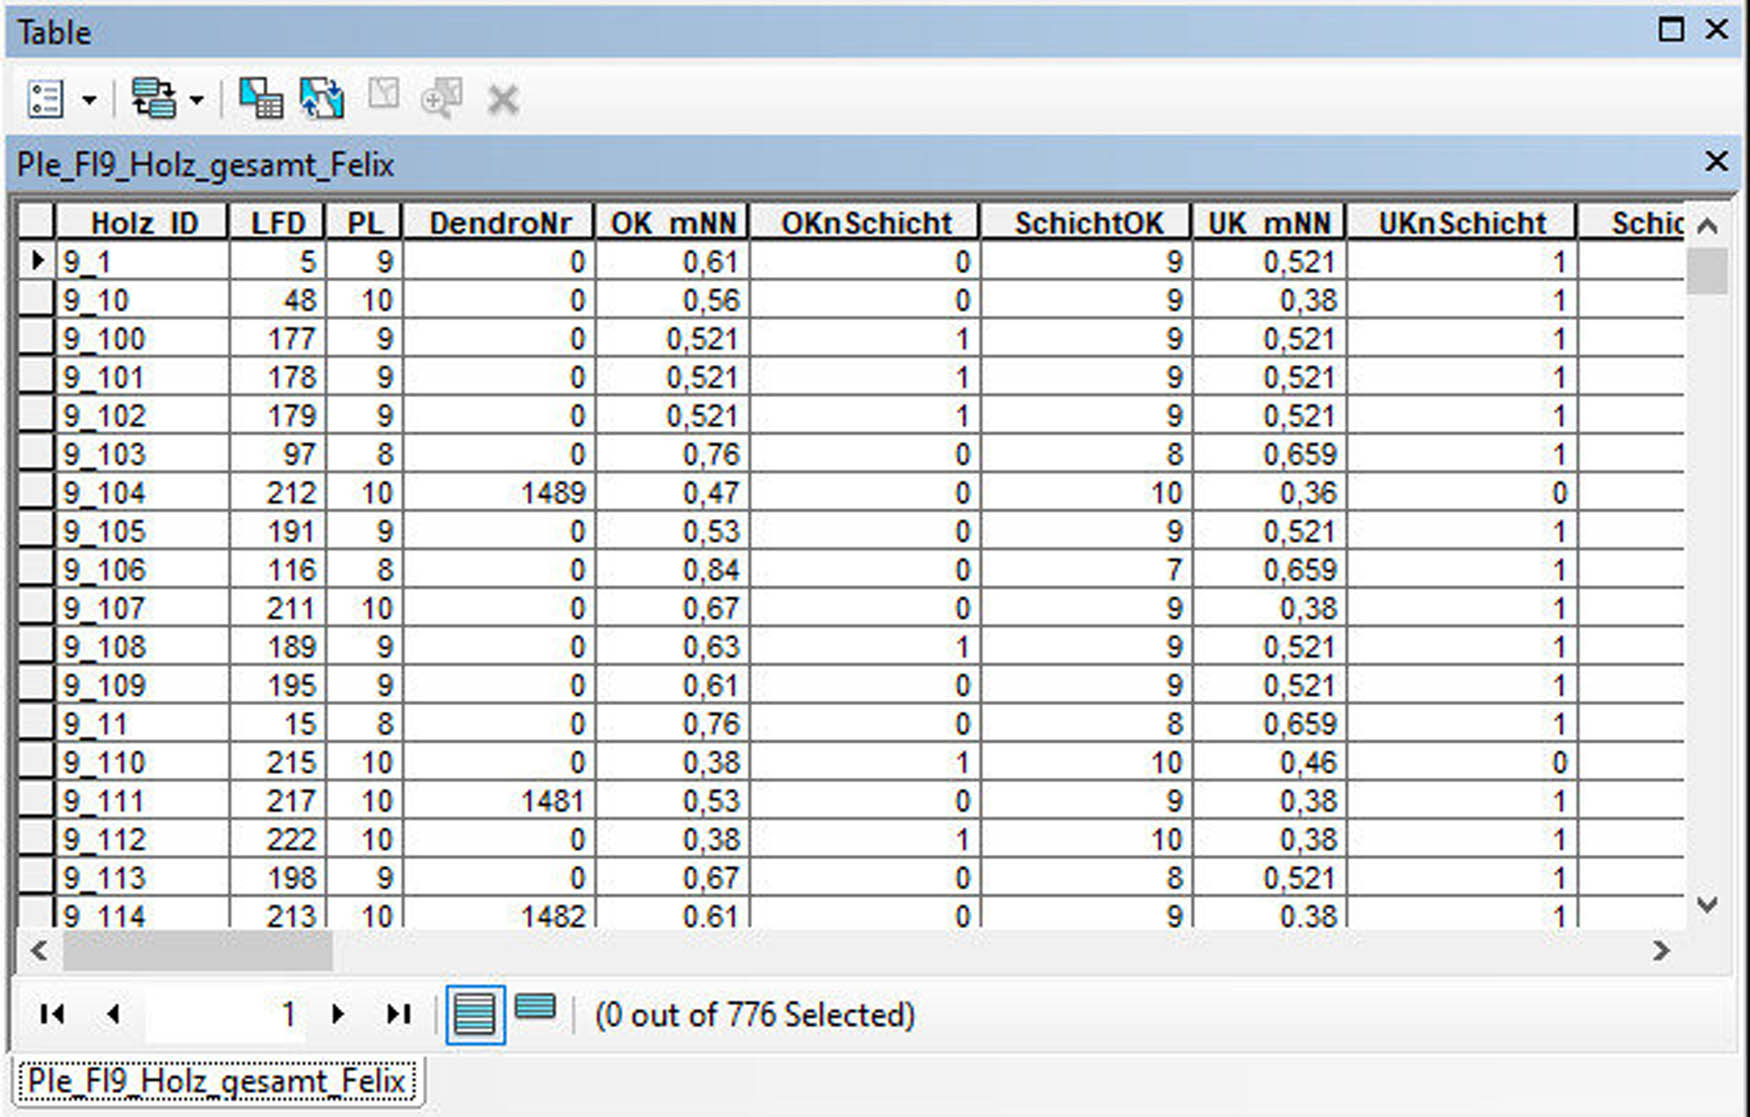
Extract of the attribute table of the shapefile containing wooden features (Graphics: F. Rösch).
This transformation resulted in a reduction in locality, diversity, and continuity, but gained compatibility and standardization (through unification), text (descriptively recorded attribute values), relative universality (better possibility of comparison among each other), and circulation (in between GIS users). Later (in step 12), calculations do also enter (cf. Latour, 1999, pp. 70–71, Figure 2.22).
As the 10th step of the chaîne opératoire should have shown, numerous data transformations and interpretations are inherent in the process, often succinctly described as digitization. Although the scanning of the drawings still entailed a comprehensible change, the decision to define individual element types and to convert each of these into individual vector graphics and attributes resulted in numerous interpretations and transformations. The technical nature of the actants GIS and the file formats used played a weighty role. They specified the limits within which the data could be changed. The actor was subject to these limits and had to orient his scope of interpretation to them. The result of this step was three types of inscriptions, the drawings in TIF format, the polygon features as a derived visual representation, and the associated attribute table in written and numerical form. In the end, 24,336 m² of drawn planum resulted in almost 20,000 wood polygon features with nearly 50 attributes.
After step 10, the files were passed to the author. In the following step 11, the task was to summarize a large number of wood features to determine how many timbers were present in absolute terms (Figure 4). This was necessary because almost all of the standing and some of the horizontal timbers had been drawn repeatedly over several layers, and no timbers had ever been given IDs, let alone described.
For this purpose, all wood features of a section were merged into a shapefile. Then, the author did what was originally intended as work for the light table – define pieces of wood/polygons lying on top of each other as belonging together. The main criterion for this was the spatial position one above the other as well as a comparable cross-section. In the case of displaced and inclined objects, of which there were many due to bulkhead-like dam constructions built in shallow water (cf. Rösch, 2018a, pp. 112–130, 239–262, 2018b, pp. 335–339), it was necessary to trace them against their direction of displacement. The fact that many timbers were pointed and their cross-section increasingly tapered at the lower ends also had to be considered (Figure 8).

After completion of step 10 and before step 11: all wooden features in trench 9 have been digitized. Each color equals a layer (Graphics: F. Rösch).
Due to numerous ambiguities, the author was forced to include a great deal of information based on his own knowledge in this step as well. If vertical timbers stood in close rows next to each other, it was not always possible to make a doubtless assignment. Especially in the case of thin wood, usually the stakes of wattle fences, which were documented in thousands, tracing proved to be difficult. Furthermore, in the case of vertical timbers, it was necessary to decide on a cross-section that would later be representative of the entire object. Here, the deepest and most informative cross-section was chosen. This was based on the premise that the last and therefore deepest drawing of the object was closest to the original location. If, on the other hand, the object was a horizontal timber that had been drawn over several layers, the polygons were possibly also adjusted or combined. Furthermore, the attributes were also merged in this step. Thus, top and bottom edge properties as well as the respective height values were often only noted on the drawing when they appeared for the first or last time.
The resulting inscription was a shapefile of all the wooden findings from Plessenstraße 83/3, which amounted to 9,017 specimens after the assignment of identification numbers. Thus, a reduction in the complexity of the original finds can also be noted for this step of the evaluation. While the textual inscription is merged, the graphic representation is reduced to a polygon, which is representative of the entire feature. Only height values and information on individual details in the attribute table now provide information about the condition (Figure 9).

After completion of step 11: all 9018 digitized wooden features on display in the 19 trenches of the Plessenstraße 83/3 excavation (Graphics: F. Rösch).
Step 12 in the chaîne opératoire regarding the processing of the plana was again undertaken by the technician. This contained the adding of further and completing of missing information to the attribute table of the wood shapefile to prepare it for 3D visualization (Figure 4). These are data on the wood that were not available in written form on the drawings and could only be drawn from the document at this processing point. For this purpose, special surveying shapes were created that allowed semiautomated recording of information such as the length and width of horizontal timbers. This was supplemented by automated calculations of the lengths and diameters of upright timbers (cf. Schultze, 2008, pp. 36–40). However, numerous missing values had to be derived from other data. On the one hand, this applies to the thickness of the horizontal timbers, which was often not recorded. Here, the difference between the top edge value of the wood and the mean leveling of the corresponding layer was used as a basis. Top and bottom edge values, on the other hand, were also often missing for many of the thinner vertical timbers. This problem was also solved by assigning the average values of the corresponding surface leveling. Thus, these are makeshift solutions that do not equal the actual values of the feature. The result was a new and, in the attributable, further supplemented shapefile, whose features in the metadata now also had z-values, that is to say, height values, in addition to x and y coordinates, which serve as the basis for the 3D visualization. As was shown, this inscription required adding data based on interpolations, which was partially automated. Both the GIS as an actor and the human actor participated in this transubstantiation.
The digital inscription now contains all the information gathered from the analog documents in a condensed and standardized form. It is a preliminary endpoint of the process, the “series of transformations” (Latour, 1999, p. 70, Figure 2.21). It does not reflect the excavation but is the product of a wide variety of tools, actors, and practices that were applied in the course of the individual processing steps. “It takes the place of the original situation” (Latour, 1999, p. 67) of the Plessenstraße 83/3 or as Olsen et al. put it for the resulting map of the TMP: “It stands in (Olsen et al., 2012, p. 97)” for the site.
Based on this 3D shapefile, the wood features could be displayed in three dimensions in the ArcGIS application ArcScene in the next, the 13th step of the chaîne opératoire (Figure 4). For this, it was only necessary to define in a user interface by which value each feature should be extended (“extruded”) into space: the length values (and, for the horizontal timbers, the thicknesses). As a result, it was possible to view the timbers in their spatial arrangement. In addition to this possibility, which was essential for further analysis, the representation also involved a number of risks that must be considered. This is due to the fact that the three-dimensionality is automatically generated on the basis of measured values and thus only simulates a distorted image of the formerly real finding situation. In addition, the 3D design and display options of the software are very limited. All timbers are displayed exactly vertically or horizontally and different cross-sections are not visible in the object; nor are special shapes such as grooves. Horizontal timbers are thus exclusively displayed in an angular manner. As thicknesses and lengths often had to be interpolated (see step 12), many timbers are at exactly the same height and only show approximate values here. Although the software is able to tilt timbers individually, this process requires a disproportionate amount of effort, so that it was not used (Figure 10). Although the exclusively vertical and simplified representation of the timbers caused a significant distortion and abstraction of the archaeological situation, a certain advantage can also be attributed to it. The fact that many timbers, which had become inclined due to compression processes, were depicted vertically above the lowest cross-section, means that they most closely reflect the orientation and position that was intended for them at the time of construction.
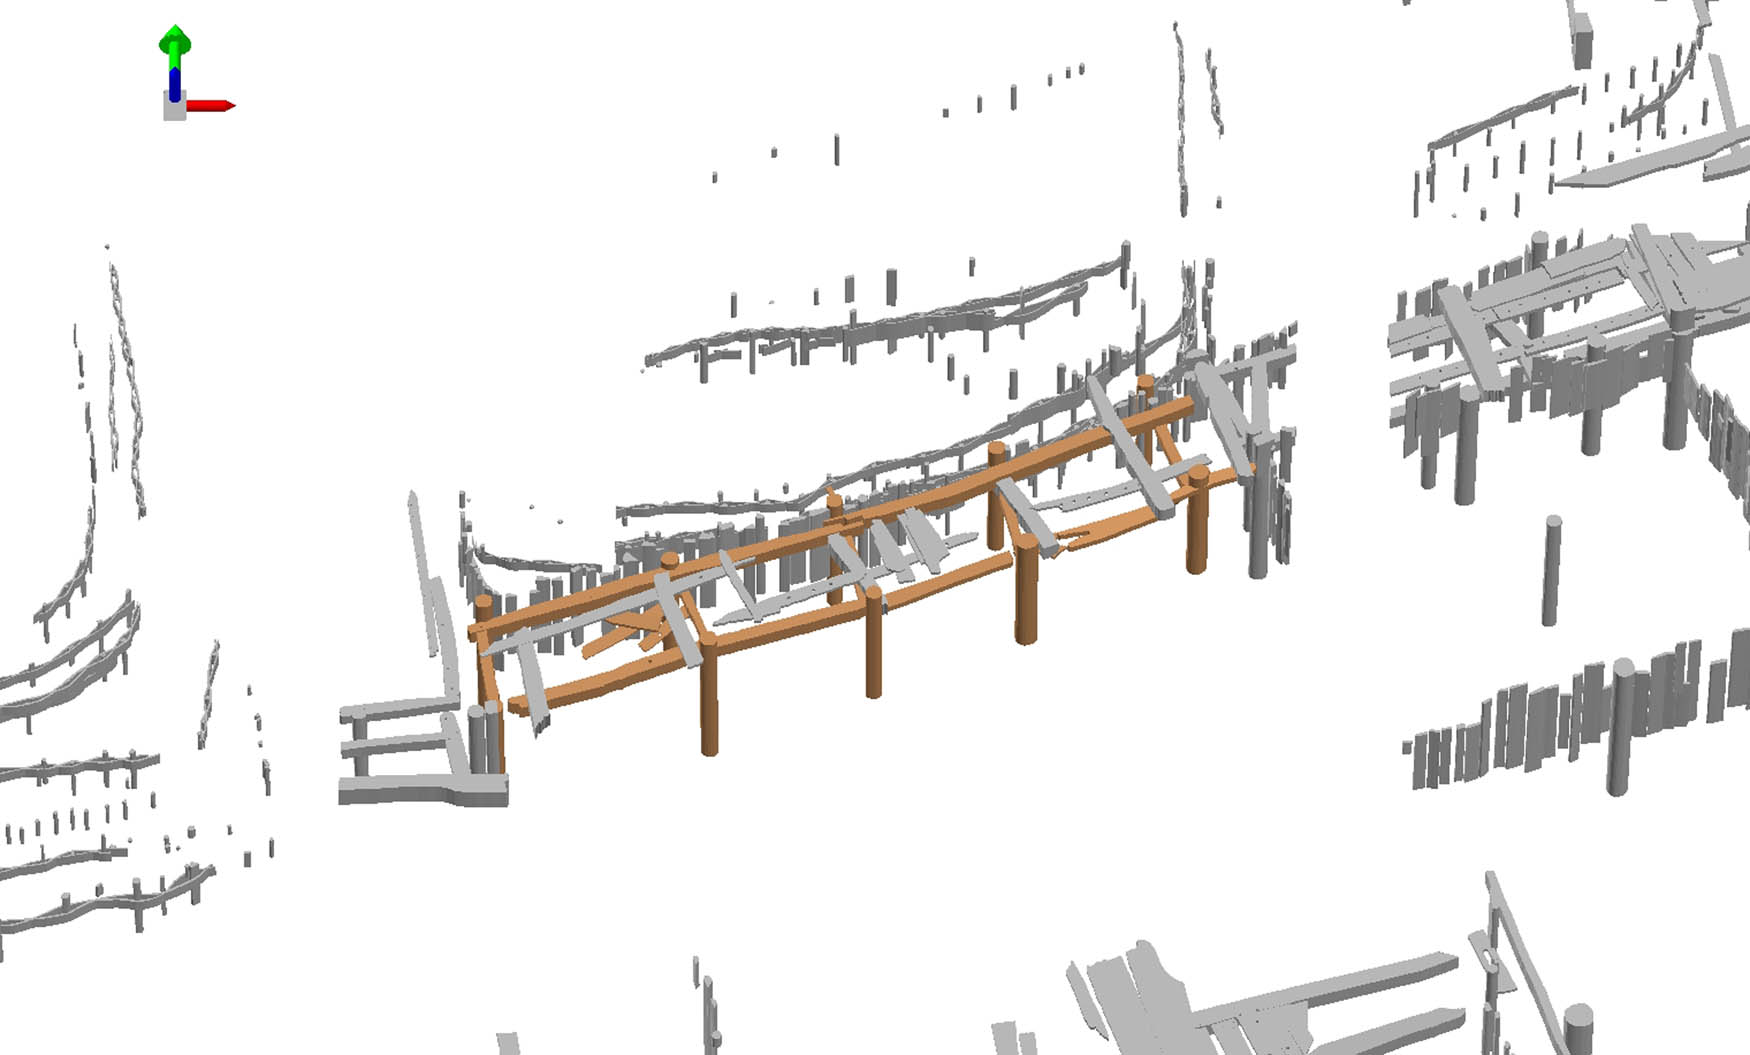
Executing step 13: extract of a 3D visualization of wood groups. A structure consisting of several groups, the first phase of a corduroy street, is highlighted in brown (Graphics: F. Rösch).
Steps 12 and 13 reveal the characteristics of digital references described by Olsen et al. (2012, pp. 102–135), which function differently from the analog references originally used in Latour’s model. This is because the production of the digital inscriptions brings about a reapproximation to the original situation that had been lost in the analog drawings. By merging the digital copies, on the one hand, a previously created particularity was removed again and, on the other hand, the timbers were given back (at least partially) the plasticity that had previously been completely removed. This in turn means that the steps of transformation do not necessarily lead to a reduction, but that, in addition to amplification, a richer and more continuous manifestation is given (Olsen et al., 2012, pp. 126–127).
The actual task in step 13 was to define timbers as belonging to each other, that is to say, as being erected at the same time. The aim was on the one hand to recognize built structures, and on the other hand to bundle the timbers into groups for a renewed age determination by means of dendrochronology. The background of this procedure was the refined tree ring curve since the 1970s and the possibility to date all other timbers of the group, for which often only heartwood or sapwood data were available, by timbers with wane.
For the identification, in addition to the 3D shape files, all other inscriptions, from photos to drawings, were used. However, the individual knowledge and the knowledge of the author are to be mentioned as essential for recognition. This is difficult to put in a nutshell in a special case as it is made up of a multitude of experiences, observations, and learnings from personal and professional life and cognitive abilities. Particularly noteworthy is the acquired knowledge of hydraulic and urban structures in the medieval settlements and towns of Europe inscribed in publications. Although the identification of regularly arranged or interconnected timbers did not present any difficulties for the most part, it proved to be a challenge in the case of disturbed, displaced, and incomplete structures. As an example, the remains of buildings were mostly fragmentary and had numerous phases built on top of each other in short succession (cf. Rösch, 2018a, pp. 130–148). Deciding on a coherence here often required hours of looking at different inscriptions, switching different layers on and off and repeatedly changing the view of the 3D shape in ArcScene by rotating and zooming. A practice that is comparable to the activity that Edgeworth (2014) describes in detail in his study as he observes a landscape archaeologist working with GIS and aerial imagery. The identification of structures caused the author to feel elated. A real sense of excitement and exhilaration set in especially when more complex relationships across multiple trenches had been identified and could be presented to colleagues. Certainly, an act of discovery, a moment of archaeological knowledge production (cf. Edgeworth, 1991, 2014).
Once a group was identified as such, the timbers were assigned a group ID, which was inscribed in an additional column of the attribute table. This allowed the groups to be color-coded or made invisible using the layer symbology. Even if changes were made to the groups in the next steps, the definition of a group generally remained unchanged. Thus, the essential inscription for the cultural–historical interpretation of the site was laid here.
After the redating of the timbers by dendrochronology was done in step 14 (Rösch, 2018a, pp. 66–67), all digital and analog inscriptions were used to interpret the defined groups by analogical conclusion (Ickerodt, 2010; Wylie, 1985) in step 15 (Figure 4). By dating and evaluating the profiles, a process that also took place in steps 10–13 and which has not been discussed in detail here (Rösch, 2018a, pp. 63–66), the stratigraphic and chronological framework for the timber groups could also be established. The interpretation of one or more timber groups (in the work defined as structures) as a built feature such as a house, a bulkhead, a dam, a corduroy street, was essentially based on drawing parallels. The results as well as the description and information on dating were then recorded in the features catalog both in writing and graphically. The discussion, on the other hand, took place in the continuous text of the actual work, structured according to type. To make the comparisons included in the interpretation quickly accessible to the reader, a distribution map with a table was prepared (Figure 11). By the reference “map” created in the network of author, GIS, and publications, the knowledge and focus of the author were to some extent revealed. This enables the professional reader to grasp tendencies and deficiencies in the analogy conclusions and makes it therefore possible to judge the validity of the interpretation. This is obtained exclusively via inscriptions, which are used for comparison as well as their parallelization with features that could be observed with one’s own eyes (Lucas, 2001, p. 213). However, it depends foremost on the future degree of citation in literature, if the interpretations will become established as narratives or even “facts” (Latour, 1987; Lucas, 2012, pp. 252–254).

Parallels used for the interpretation of the Plessenstraße 83/3 features in step 15. It enables the critical reader to understand absences and tendencies (Graphics: F. Rösch/A. Heitmann, symbols by Freepik, www.flaticon.com).
Steps 16 and 17 were the last steps of the chaîne opératoire of the analysis of the Plessenstraße 83/3 excavation and comprise the writing of the final chapters of the work. In step 16, the wood findings were summarized and evaluated, for which also the find material and investigations into the historical natural area as well as numerous publications were consulted. Again, analogies play an important role as well as the individual knowledge of the author. Step 17 represents the final synthesis and the historical contextualization of the results and addresses the question of whether the investigations are required to make statements that go beyond the site (Figure 4).
5 Conclusion
If the emergence of archaeological knowledge is to be comprehensible, a central role must be given not only to the question of why, but also to the question of how – why a method is used and how exactly it is carried out. This is even truer for digital methods that often stand for themselves in their mode of operation and procedures and inevitably lead to black boxing and notions of “findings with a mouse click.” Even though the number of critical articles on digital archaeological practices is continuously increasing, many methods and processes in knowledge production are still unexplored. One of these fields represents the evaluation of analog excavation documentation by means of digital applications.
The method of a chaîne opératoire of interpretation in archaeological knowledge production was presented using the example of the evaluation of the medieval wooden features of the medieval Schleswig waterfront with the help of a GIS. It combines the step-by-step approach with the concepts developed by B. Latour to reveal the production of scientific knowledge. Particularly the “circulating reference” has proven to be very suitable for the study of archaeological practice.
On the one hand, the chaîne opératoire of interpretation disclosed the workflow, enabling the reader to follow every single interpretive step. It was laid open in detail which data were used, which tools were applied, and how the data were changed every time: simplifications, the transformation of ambiguous information into clear statements, and how information was added by the actor or the application. In this way, awareness of advantages and disadvantages of the methodology and the interpretation is raised. Another advantage of the approach is that it empowers the reader to draw their own conclusions. One can get into the work at every step and add one’s own or other sources of knowledge. Accordingly, the chaîne opératoire of interpretation constituted the basic framework for the outline of the author’s work on the Schleswig waterfront (Rösch, 2018a).
Even if the steps have not been broken down to the level of computer-internal computational processes, which would require a study of its own, the creation of archaeological knowledge by means of the digital methods applied here has been revealed.
It is the key to the otherwise “closed” representation of the final professional publication. Thus, the often demanded reflexive approach should have been satisfied (Eggert, 1998, p. 370; Hodder, 2000; Huvila & Huggett, 2018, pp. 94–95).
Especially, the example used here should have shown that the use was not based on technofetishism or the need for the fastest possible data evaluation, but many steps were obviously necessary to deal with the complexity of an excavation such as Plessenstraße 83/3. It contributes through its detailed disclosure to the understanding of how the results were obtained (cf. Gupta, 2020). The fact that data were changed and simplified for this purpose is inherent in the archaeological evaluation practice (cf. Lucas, 2001, p. 152), but it also became more compatible, standardized, and universal (Latour, 1999, p. 70) and, through the digital, has the opportunity to keep a continuity to the original situation (Olsen et al., 2012, pp. 124–127).
Last but not least it should become clear that this evaluation practice is a decidedly archaeological practice, as it requires a profound knowledge of archaeological structures, which leads to equivalent discoveries and insights.
Acknowledgments
The work was inspired by the COST Action ARKWORK and especially Tonia Davidović, who awoke my interest in the study of archaeological knowledge production. The author’s work on the Schleswig waterfront was part of the project “Zwischen Wikingern und Hanse. Kontinuität und Wandel des zentralen Umschlagplatzes Haithabu/Schleswig im 11. Jahrhundert [Between Vikings and Hanseatic League. Continuity and change of the central trading place Hedeby/Schleswig in the 11th century],” which was based at the Institute of Pre- and Protohistory at Kiel University and the Archaeological Museum Schloss Gottorf. The author would like to thank the Volkswagen Foundation and all project members, Ulrich Müller, Ralf Bleile, Volker Hilberg, and Michaela Schimmer and especially GIS technician Kerstin Greve. This work would not have been possible without her contribution. Furthermore, I thank the reviewers and editors for some very helpful suggestions.
-
Funding information: The project “Zwischen Wikingern und Hanse. Kontinuität und Wandel des zentralen Umschlagplatzes Haithabu/Schleswig im 11. Jahrhundert [Between Vikings and Hanseatic League. Continuity and change of the central trading place Hedeby/Schleswig in the 11th century],” has been generously funded by the Volkswagen Foundation (2012–2015).
-
Conflict of interest: The author states no conflict of interest.
-
Data availability statement: Most data that support the findings of this study are available in the final publication (Rösch, 2018a). Some additional data are available from the Archaeological Museum Schloss Gottorf but restrictions apply to the availability of these data and so are not publicly available. Data are however available from the author upon reasonable request and with permission of the Archaeological Museum Schloss Gottorf.
Abbreviations
- GIS
-
geographic information system
- ANT
-
actor-network theory
References
Averett, E. W. , Gordon, J. M. , & Counts, D. B. (Eds.). (2016). Mobilizing the past for a digital future: The potential of digital archaeology. Grand Forks, ND: Digital Press at the University of North Dakota.10.31356/dpb008Search in Google Scholar
Berggren, Å. , & Hodder, I. (2003). Social practice, method, and some problems of field archaeology. Antiquity, 68(3), 421–434. 10.2307/3557102.Search in Google Scholar
Callon, M. (2001). Four models for the dynamics of science. In S. Jasanoff , G. E. E. Markle , J. C. C. Peterson , & T. J. Pinch (Eds.), Handbook of science and technology studies (pp. 29–63). Thousand Oaks: SAGE Publications.Search in Google Scholar
Caraher, W. (2016). Slow archaeology: Technology, efficiency, and archaeological work. In E. W. Averett , J. M. Gordon , & D. B. Counts (Eds.), Mobilizing the past for a digital future: The potential of digital archaeology (Open access e-Books, pp. 421–442). Grand Forks, ND: Digital Press at the University of North Dakota.Search in Google Scholar
Carver, G. (2004). Method and theory in German archaeology: Preliminary findings. In G. Carver (Ed.), Digging in the dirt: Excavation in a new millennium (Bar International Series, Vol. 1256, pp. 135–139). Oxford: J. and E. Hedges Ltd. 10.30861/9781841713694Search in Google Scholar
Czysz, W. , Dietrich, H. , Ebner, D. , Köglmeier, S. , & Nadler, M. (2006, July). Empfehlungen zur zeichnerischen Darstellung von archäologischen Funden im Bereich des Bayerischen Landesamts für Denkmalpflege. Berichte Bayerische Bodendenkmalpflege, 47/48, 385–394.Search in Google Scholar
Darvill, T. C. (2008). The concise Oxford dictionary of archaeology (2nd ed., Oxford paperback reference). Oxford: Oxford University Press. 10.1093/acref/9780199534043.001.0001.Search in Google Scholar
Davidović, A. (2009). Praktiken archäologischer Wissensproduktion: Eine kulturanthropologische Wissenschaftsforschung. Altertumskunde des Vorderen Orients (Vol. 13). Münster: Ugarit-Verlag.Search in Google Scholar
Eastman, J. R. (2003). IDRISI kilimanjaro: Guide to GIS and image processing. Worcester, Massachusetts: Clark Labs, Clark University.Search in Google Scholar
Edgeworth, M. (2014). From spade-work to screen-work: New forms of archaeological discovery in digital space. In A. Carusi , A. Sissel Hoel , T. Webmoor , & S. Woolgar (Eds.), Visualization in the age of computerization (1st ed., pp. 40–58). New York: Routledge.10.4324/9780203066973-3Search in Google Scholar
Edgeworth, M. (1991). The act of discovery: An ethnography of the subject-object relation in archaeological practice. (PhD Thesis). University of Durham, Durham.Search in Google Scholar
Eggert, M. K. H. (1998). Theorie in der ur-und frühgeschichtlichen Archäologie: Erwägungen über und für die Zukunft. In M. K. H. Eggert & U. Veit (Eds.), Theorie in der Archäologie: Zur englischsprachigen Diskussion (Tübinger Archäologische Taschenbücher, Vol. 1, pp. 357–377). Münster: Waxmann.Search in Google Scholar
Eve, S. (2018). Losing our senses, an exploration of 3D object scanning. Open Archaeology, 4(1), 114–122. 10.1515/opar-2018-0007.Search in Google Scholar
Fowler, C. (2013). The emergent past: A relational realist archaeology of early Bronze Age mortuary practices (1. ed., 1. impression). Oxford: Oxford University Press. 10.1093/acprof:osobl/9780199656370.001.0001.Search in Google Scholar
Gardin, J.-C. (1989). The rôle of ‘local knowledge’ in archaeological interpretation. In S. Shennan (Ed.), Archaeological approaches to cultural identity (One world archaeology, Vol. 10, 1st ed., pp. 110–122). London: Unwin Hyman.Search in Google Scholar
Gillings, M. , Hacιgüzeller, P. , & Lock, G. R. (Eds.). (2019). Re-mapping archaeology: Critical perspectives, alternative mappings. London, New York: Routledge.10.4324/9781351267724Search in Google Scholar
Gillings, M. , Hacιgüzeller, P. , & Lock, G. R. (Eds.). (2020a). Archaeological spatial analysis: A methodological guide. London, New York: Routledge Taylor & Francis Group.10.4324/9781351243858Search in Google Scholar
Gillings, M. , Hacιgüzeller, P. , & Lock, G. R. (2020b). Archaeology and spatial analysis. In M. Gillings , P. Hacιgüzeller , & G. R. Lock (Eds.), Archaeological spatial analysis: A methodological guide (pp. 1–16). London, New York: Routledge Taylor & Francis Group.10.4324/9781351243858-1Search in Google Scholar
Grunwald, S. (2016). “Riskante Zwischenschritte”. Archäologische Kartographie in Deutschland zwischen 1870 und 1900. In K. P. Hofmann , T. Meier , D. Mölders , & S. Schreiber (Eds.), Massendinghaltung in der Archäologie: Der material turn und die Ur- und Frühgeschichte (pp. 111–142). Havertown: Sidestone Press.Search in Google Scholar
Gupta, N. (2020). Preparing archaeological data for spatial analysis. In M. Gillings , P. Hacιgüzeller , & G. R. Lock (Eds.), Archaeological spatial analysis: A methodological guide (pp. 17–40). London, New York: Routledge Taylor & Francis Group.10.4324/9781351243858-2Search in Google Scholar
Hacιgüzeller, P. (2012). GIS, critique, representation and beyond. Journal of Social Archaeology, 12(2), 245–263. 10.1177/1469605312439139.Search in Google Scholar
Hacιgüzeller, P. (2019). Archaeology, digital cartography and the question of progress: The case of Çatalhöyük (Turkey). In M. Gillings , P. Hacιgüzeller , & G. R. Lock (Eds.), Re-mapping archaeology: Critical perspectives, alternative mappings (pp. 281–300). London, New York: Routledge.10.4324/9781351267724-12Search in Google Scholar
Hansen, G. (2005). Bergen C 800–C 1170: The emergence of a town. The Bryggen papers. Main series (Vol. 6). Bergen: Fagbokforl.10.15845/bryggen.v60Search in Google Scholar
Hodder, I. (1997). ‘Always momentary, fluid and flexible’: Towards a reflexive excavation methodology. Antiquity, 71(273), 691–700.10.1017/S0003598X00085410Search in Google Scholar
Hodder, I. (2000). Developing a reflexive method in archaeology. In I. Hodder (Ed.), Towards reflexive method in archaeology: The example at Çatalhöyük (McDonald institute monographs, Vol. 2, pp. 3–14). Cambridge: McDonald Institute for Archaeological Research.Search in Google Scholar
Hofmann, K. P. (2018). Dingidentitäten und Objekttransformationen: Einige Überlegungen zur Edition von archäologischen Funden. In M. Hilgert , K. P. Hofmann , & H. Simon (Eds.), Objektepistemologien: Zur Vermessung eines transdisziplinären Forschungsraums (Berlin Studies of the Ancient World, Vol. 59, 1st ed., pp. 179–215). Berlin: Excellence Cluster 264 TOPOI. 10.17171/3-59-8.Search in Google Scholar
Huggett, J. (2000). Computers and archaeological culture change. In G. Lock & K. Brown (Eds.), On the theory and practice of archaeological computing (Vol. 51, pp. 5–22). Oxford: Oxford University Committee for Archaeology.Search in Google Scholar
Huggett, J. (2004). Archaeology and the new technological fetishism. Archeologia e Calcolatori, 15, 81–92.Search in Google Scholar
Huggett, J. (2015). A manifesto for an introspective digital archaeology. Open Archaeology, 1(1), 86–95. 10.1515/opar-2015-0002.Search in Google Scholar
Huvila, I. , & Huggett, J. (2018). Archaeological practices, knowledge work and digitalisation. Journal of Computer Applications in Archaeology, 1(1), 88–100. 10.5334/jcaa.6.Search in Google Scholar
Ickerodt, U. F. (2010). Einführung in das Grundproblem des archäologisch-kulturhistorischen Vergleichens und Deutens: Analogien-bildung in der archäologischen Forschung. Frankfurt am Main, Berlin, Bern, Wien: Lang.10.3726/978-3-653-01213-2Search in Google Scholar
Kalmring, S. (2010). Der Hafen von Haithabu. Die Ausgrabungen in Haithabu (Vol. 14). Neumünster: Wachholtz.Search in Google Scholar
Kansa, E. C. (2016). Click here to save the past. In E. W. Averett , J. M. Gordon , & D. B. Counts (Eds.), Mobilizing the past for a digital future: The potential of digital archaeology (Open access e-Books, pp. 443–472). Grand Forks, ND: Digital Press at the University of North Dakota.Search in Google Scholar
Kersel, M. M. (2016). Living a semi-digital kinda life. In E. W. Averett , J. M. Gordon , & D. B. Counts (Eds.), Mobilizing the past for a digital future: The potential of digital archaeology (Open access e-Books, pp. 475–492). Grand Forks, ND: Digital Press at the University of North Dakota.Search in Google Scholar
Latour, B. (1987). Science in action: How to follow scientists and engineers through society. Cambridge, Massachusetts: Harvard University Press.Search in Google Scholar
Latour, B. (1993). Le topofil de Boa-Vista ou la référence scientifique-montage photo-philosophique. In B. Conein , N. Dodier , & L. Thévenot (Eds.), Les objets dans l’action: De la maison au laboratoire (Raisons pratiques, Vol. 4, pp. 187–216). Paris: Éd. de l'École des Hautes Études de Sciences Sociales.10.4000/books.editionsehess.9918Search in Google Scholar
Latour, B. (1996). On actor-network theory: A few clarifications. Soziale Welt, 47(4), 369–381.Search in Google Scholar
Latour, B. (1999). Pandora’s hope: Essays on the reality of science studies. Cambridge, Massachusetts: Harvard University Press.Search in Google Scholar
Latour, B. , & Woolgar, S. (1986). Laboratory life: The construction of scientific facts. Princeton paperbacks (Princeton paperback ed.). Princeton, NJ: Princeton University Press.Search in Google Scholar
Leroi-Gourhan, A. (1964). Le geste et la parole. Sciences d’aujourd’hui. Paris: Michel.Search in Google Scholar
Lucas, G. (2001). Critical approaches to fieldwork: Contemporary and historical archaeological practice. London, New York: Routledge. Retrieved from http://www.loc.gov/catdir/enhancements/fy0650/00032213-d.html 10.4324/9780203170007Search in Google Scholar
Lucas, G. (2012). Understanding the archaeological record. Cambridge: Cambridge University Press. 10.1017/CBO9780511845772.Search in Google Scholar
Müller, U. (2013). Die Archäologie des Mittelalters und der Neuzeit im Gefüge der historischen Archäologien. In K. Ridder & S. Patzold (Eds.), Die Aktualität der Vormoderne: Epochenentwürfe zwischen Alterität und Kontinuität (Europa im Mittelalter, Vol. 23, pp. 67–95). Berlin: Akademie-Verl.10.1524/9783050063997.67Search in Google Scholar
Olsen, B. , Witmore, C. , Shanks, M. , & Webmoor, T. (2012). Archaeology: The discipline of things. Berkerley: University of California Press. 10.1525/j.ctt1ppvhk.Search in Google Scholar
Poehler, E. E. (2016). Digital Pompeii: Dissolving the fieldwork-library research divide. In E. W. Averett , J. M. Gordon , & D. B. Counts (Eds.), Mobilizing the past for a digital future: The potential of digital archaeology (Open access e-Books, pp. 201–220). Grand Forks, ND: Digital Press at the University of North Dakota.Search in Google Scholar
Polanyi, M. (1958). Personal knowledge: Towards a post-critical philosophy. Chicago, Illinois: University of Chicago Press.Search in Google Scholar
Rębkowski, M. (Ed.). (2019). Wolin – The old town: Vol. I: Settlement structure, stratigraphy & chronology (P. Barford & K. Płoska, Trans.). Szczecin: Institute of Archaeology and Ethnology of the Polish Academy of Science.Search in Google Scholar
Rösch, F. (2016). Analysed by GIS: The topography of the Schleswig waterfront in the late eleventh century. Arkæologie I Slesvig. Archäologie in Schleswig, 16, 69–84.Search in Google Scholar
Rösch, F. (2018a). Das Schleswiger Hafenviertel im Hochmittelalter: Entstehung – Entwicklung – Topographie. Zeitschrift für Archäologie des Mittelalters. Beiheft (Vol. 26). Bonn: Habelt.Search in Google Scholar
Rösch, F. (2018b). The eleventh century schleswig waterfront: Formation, development and actors of a commercial hotspot. In C. v. Carnap-Bornheim , F. Daim , P. Ettel , & U. Warnke (Eds.), Harbours as objects of interdisciplinary research – archaeology + history + geosciences (RGZM-Tagungen Band 34 zugl, Interdisziplinäre Forschungen zu den Häfen von der Römischen Kaiserzeit bis zum Mittelalter in Europa Band 5, pp. 329–352). Mainz: Verlag des Römisch-Germanischen Zentralmuseums.Search in Google Scholar
Rösch, F. (2019). GIS als Werkzeug archäologischer Grabungsdokumentation – Zwei Fallbeispiele aus Sachsen-Anhalt. LSA VERM. Zeitschrift für das Öffentliche Vermessungswesen des Landes Sachsen-Anhalt, 25(1), 39–50.Search in Google Scholar
Schietzel, K. (1981). Stand der siedlungsarchäologischen Forschung in Haithabu: Ergebnisse und Probleme. Berichte über die Ausgrabungen in Haithabu (Vol. 16). Neumünster: Wachholtz.Search in Google Scholar
Schietzel, K. (2014). Spurensuche Haithabu: Dokumentation und Chronik 1963–2013. Neumünster: Wachholtz.Search in Google Scholar
Scholkmann, B. (1997/1998). Archäologie des Mittelalters und der Neuzeit heute: Eine Standortbestimmung im interdisziplinären Kontext. Zeitschrift Für Archäologie Des Mittelalters, 25/26, 7–18.Search in Google Scholar
Schultze, J. (2008). Haithabu – die Siedlungsgrabungen I: Methoden und Möglichkeiten der Auswertung. Ausgrabungen in Haithabu (Vol. 13). Neumünster: Wachholtz.Search in Google Scholar
Sheppard, E. (2005). Knowledge production through critical GIS: Genealogy and prospects. Cartographica: The International Journal for Geographic Information and Geovisualization, 40(4), 5–21. 10.3138/GH27-1847-QP71-7TP7.Search in Google Scholar
Soressi, M. , & Geneste, J.-M. (2011). The history and efficacy of the chaîne opératoire approach to lithic analysis: Studying techniques to reveal past societies in an evolutionary perspective. PaleoAnthropology, 2011, 334–350. 10.4207/PA.2011.ART63.Search in Google Scholar
Stöllner, T. (2008). Montan-archaeology and research on old mining: Just a contribution to economic history? In Ü. Yalçın (Ed.), Der Anschnitt, Beiheft: Anatolian metal IV (Vol. 21, pp. 149–178). Bochum: Bergbau-Museum.Search in Google Scholar
Stöllner, T. (2014). Methods of mining archaeology (Montanarchäologie). In B. Roberts & C. Thornton (Eds.), Archaeometallurgy in global perspective: Methods and syntheses (pp. 133–159). New York: Springer.10.1007/978-1-4614-9017-3_7Search in Google Scholar
Taylor, J. , Issavi, J. , Berggren, Å. , Lukas, D. , Mazzucato, C. , Tung, B. , & Dell’Unto, N. (2018). ‘The rise of the machine’: The impact of digital tablet recording in the field at Çatalhöyük. Journal of Field Archaeology, 94(47), 57. 10.11141/ia.47.1.Search in Google Scholar
Tripcevich, N. , & Wernke, S. A. (2010). On-site recording of excavation data using mobile GIS. Journal of Field Archaeology, 35(4), 380–397. 10.1179/009346910X12707321242511.Search in Google Scholar
Van Es, W. A. , & Verwers, W. J. H. (2009). Hoogstraat 0, II–IV. Nederlandse oudheden: Vol. 16.2. Amersfort: Rijksdienst voor Archeologie Cultuurlandschap en Monumenten.Search in Google Scholar
Van Riel, S. (2016). Exploring the use of 3D GIS as an analytical tool in archaeological excavation practice. (M. A. Thesis). Lund University, Lund.Search in Google Scholar
Vogel, V. (1971). Die Nicolaikirche in Schleswig: Bericht über die Ausgrabung 1970. Offa, 28, 181–224.Search in Google Scholar
Vogel, V. (1983). Archäologische Stadtkernforschung in Schleswig 1969–1982. Ausgrabungen in Schleswig. Berichte und Studien, 1, 9–54.Search in Google Scholar
Vogel, V. (1992). Der Schleswiger Hafen im Mittelalter. In Verein Schleswiger Briefmarkensammler e.V. (Ed.), 900 Jahre Hafen Schleswig 1092–1992 (pp. 23–36). Schleswig.Search in Google Scholar
Vogel, V. (1999). Der Schleswiger Hafen im hohen und späten Mittelalter. In J. Bill & B. L. Clausen (Eds.), Maritime topography and the medieval town: papers from the 5th International Conference on Waterfront Archaeology in Copenhagen, 14–16 May, 1998 (Publications from the National Museum, Studies in archaeology & history (Vol. 4, pp. 187–196). Copenhagen: National Museum of Denmark, Department of Danish Collections.Search in Google Scholar
Wheatley, D. (1993). Going over old ground: GIS, archaeological theory and the act of perception. In J. Andresen , T. Madsén , & I. Scollar (Eds.), Computing the past: Computer applications and quantitative methods in archaeology (pp. 133–138). Aarhus: Aarhus University Press.Search in Google Scholar
Wheatley, D. , & Gillings, M. (2002). Spatial technology and archaeology: The archaeological applications of GIS. London: Taylor & Francis. 10.4324/9780203302392.Search in Google Scholar
Witmore, C. L. (2013). The world on a flat surface: Maps from the archaeology of Greece and beyond. In S. Bonde & S. D. Houston (Eds.), Re-presenting the past: Archaeology through text and image (Joukowsky Institute publication, Vol. 2, pp. 125–149). Oxford: Oxbow Books.10.2307/j.ctvh1dr6h.11Search in Google Scholar
Woods, D. , & Dekker, S. (2000). Anticipating the effects of technological change: A new era of dynamics for human factors. Theoretical Issues in Ergonomics Science, 1(3), 272–282. 10.1080/14639220110037452.Search in Google Scholar
Wylie, A. (1985). The reaction against analogy. Advances in Archaeological Method and Theory, 8, 63–111.10.1016/B978-0-12-003108-5.50008-7Search in Google Scholar
Yarrow, T. (2003). Artefactual persons: The relational capacities of persons and things in the practice of excavation. Norwegian Archaeological Review, 36(1), 65–73. 10.1080/00293650307296.Search in Google Scholar
© 2021 Felix Rösch, published by De Gruyter
This work is licensed under the Creative Commons Attribution 4.0 International License.
Articles in the same Issue
- Editorial
- Science in a Time When the World Is Growing Apart and Coming Together
- Research Articles
- Exploring the Cave Rock Art of Siberian Trans-Baikal: Fertility, Shamanism, and Gender
- Wild Resources in the Economy of Bronze and Early Iron Ages Between Oder and Bug Rivers – Source Overview
- Communities Beyond Society: Divergence of Local Prehistories on the Bothnian Arc, Northern Europe
- A New Method for the Large-Scale Documentation of Pottery Sherds Through Simultaneous Multiple 3D Model Capture Using Structure from Motion: Phoenician Carinated-Shoulder Amphorae from Tell el-Burak (Lebanon) as a Case Study
- Settlement Patterns and Urbanization in the Yautepec Valley of Central Mexico
- Waterscape and Floods Management of Greek Selinus: The Cottone River Valley
- Review Article
- Andronovo Problem: Studies of Cultural Genesis in the Eurasian Bronze Age
- Rapid Communication
- Microscopic Re-Examination of an Unique Bone Artefact: The Figure of a Theatrical Actor Found at The Roman Fort Iža/Leányvár (Slovakia)
- Erratum
- Erratum to “On the Emerging Supremacy of Structured Digital Data in Archaeology: A Preliminary Assessment of Information, Knowledge and Wisdom Left Behind”
- Special Issue on at the Crossroads of the Mediterranean: Malta and the Central Mediterranean During the Roman Period, edited by Davide Tanasi, David Cardona, & Robert Brown
- A Most Notable Dwelling: The Domus Romana and the Urban Topography of Roman Melite
- Melite Civitas Romana in 3D: Virtualization Project of the Archaeological Park and Museum of the Domus Romana of Rabat, Malta
- Revisiting Ramla l-Ħamra Villa – New Discoveries and Observations on the Roman Villa Complex in Xagħra, Gozo
- A Diachronic Maltese Islandscape: Rural Ta’ Qali and ix-Xarolla
- The Perseverance of Archaeology: New Data from a Rescue Investigation at Triq Fejġel in Rabat and its Contribution to the Punic and Roman Maltese Funerary Context
- Past, Present, Future: An Overview of Roman Malta
- The Melite Civitas Romana Project: The Case for a Modern Exploration of the Roman Domus, Malta
- Special Issue ‘The Black Gold That Came from the Sea. Advances in the Studies of Obsidian Sources and Artifacts of the Central Mediterranean Area’, edited by Franco Italiano, Franco Foresta Martin & Maria Clara Martinelli - Part II
- Obsidian from the Site of Piano dei Cardoni, Ustica (Palermo, Italy): Preliminary Results on the First Occupation of the Island
- Obsidian from the Neolithic Layers of “Grotta di San Michele Arcangelo di Saracena” (Cosenza), Italy. A Preliminary Report
- Special Issue on Art, Creativity and Automation. Sharing 3D Visualization Practices in Archaeology, edited by Loes Opgenhaffen, Martina Revello Lami, Hayley Mickleburgh
- Art, Creativity and Automation. From Charters to Shared 3D Visualization Practices
- Track and Trace, and Other Collaborative Art/Archaeology Bubbles in the Phygital Pandemic
- 3D Reconstructions as Research Hubs: Geospatial Interfaces for Real-Time Data Exploration of Seventeenth-Century Amsterdam Domestic Interiors
- Dynamic Collections: A 3D Web Infrastructure for Artifact Engagement
- Visualizing Archaeologists: A Reflexive History of Visualization Practice in Archaeology
- The Use of 3D Photogrammetry in the Analysis, Visualization, and Dissemination of the Indigenous Archaeological Heritage of the Greater Antilles
- A Theoretical Framework for Informal 3D Rendered Analysis of the Roman Lararium from Apollonia-Arsuf
- Heritage Artefacts in the COVID-19 Era: The Aura and Authenticity of 3D Models
- Virtual Archaeology of Death and Burial: A Procedure for Integrating 3D Visualization and Analysis in Archaeothanatology
- Expanding Field-Archaeology Education: The Integration of 3D Technology into Archaeological Training
- Born-Digital Logistics: Impacts of 3D Recording on Archaeological Workflow, Training, and Interpretation
- Filling the Void in Archaeological Excavations: 2D Point Clouds to 3D Volumes
- Evaluation of an Online 360° Virtual Reality World Heritage Site During COVID-19
- C.A.P.I. Project in the Making: 3D Applications at Poggio Imperiale Between Materiality and Virtual Reality (Poggibonsi, IT)
- Special Issue on Archaeological Practice on Shifting Grounds, edited by Åsa Berggren and Antonia Davidovic-Walther
- Algorithmic Agency and Autonomy in Archaeological Practice
- Provenance Illusions and Elusive Paradata: When Archaeology and Art/Archaeological Practice Meets the Phygital
- Skeuomorphism in Digital Archeological Practice: A Barrier to Progress, or a Vital Cog in the Wheels of Change?
- Worlding Excavation Practices
- From Drawing into Digital: On the Transformation of Knowledge Production in Postexcavation Processing
- Choreographies of Making Archaeological Data
- Legacy in the Making – A Knowledge Infrastructural Perspective on Systems for Archeological Information Sharing
- Tradition in Transition: Technology and Change in Archaeological Visualisation Practice
- On the Emerging Supremacy of Structured Digital Data in Archaeology: A Preliminary Assessment of Information, Knowledge and Wisdom Left Behind
- Figurations of Digital Practice, Craft, and Agency in Two Mediterranean Fieldwork Projects
- Special Issue on THE EARLY NEOLITHIC OF EUROPE, edited by F. Borrell, I. Clemente, M. Cubas, J. J. Ibáñez, N. Mazzucco, A. Nieto-Espinet, M. Portillo, S. Valenzuela-Lamas, & X. Terradas - Part I
- Mineral Resources, Procurement Strategies, and Territories in the Linear Pottery Culture in the Aisne Valley (Paris Basin, France)
- Disruption, Preference Cascades, Contagion, and the Transition to Agriculture in Northern Europe
- Timing and Pace of Neolithisation in the Dutch Wetlands (c. 5000–3500 cal. BC)
- Models of Neolithisation of Northeastern Iberian Peninsula: New Evidence of Human Occupations During the Sixth Millennium cal BC
- Social Rules and Household Interactions Within the LBK: Long-Standing Debates, New Perspectives
- Ceramic Traditions in the Forest-Steppe Zone of Eastern Europe
- The Mechanisms of Neolithisation of Western Europe: Beyond a South/North Approach
- Early Neolithic Settlement Patterns in Northern Dalmatia
- New Evidence from Galeria da Cisterna (Almonda) and Gruta do Caldeirão on the Phasing of Central Portugal’s Early Neolithic
- The Use of Rock Shelters During the Early Neolithic in the North of Alicante (Spain). The Site of Penya Roja de Catamarruc (Alicante, Spain) as a Case Study
- Stone and Osseous Adornments in the Mesolithic and Early Neolithic of the Iron Gates
- The Neolithisation of the Adriatic: Contrasting Regional Patterns and Interactions Along and Across the Shores
- A Very Early “Fashion”: Neolithic Stone Bracelets from a Mediterranean Perspective
- Anthropomorphic Symbols on Neolithic Vessels from Puglia
- Decorated or Undecorated: Analysis of the Early-Middle Neolithic Transition in Western Iberia Through the Ceramic’s Stylist Techniques and Decorative Motifs
- Animist Ontologies in the Third Millennium BCE? Hunter-Gatherer Persistency and Human–Animal Relations in Southern Norway: The Alveberget Case
- Neolithization Processes of East Belgium: Supra-Regional Relationships Between Groups Highlighted by Technological Analysis of Lithic Industry
- Territoriality and Settlement in Southern France in the Early Neolithic: Diversity as a Strategy?
- The Cardial–Epicardial Early Neolithic of Lower Rhône Valley (South-Eastern France): A Lithic Perspective
- Funerary Practices as a Testimony of Ideology in Western Linearbandkeramik Culture
- A Quantitative Study of the Linear Pottery Culture Cemetery “Aiterhofen-Ödmühle”
- An Operative Sequences Network: The Technical Organization at Casa Montero Early Neolithic Flint Mine (Madrid, Spain)
- The Routes of Neolithisation: The Middle Struma Valley from a Regional Perspective
- Mountains, Herds and Crops: Notes on New Evidence from the Early Neolithic in the Southern Central Pyrenees
- Developing a Reference Collection for Starch Grain Analysis in Early Neolithic Western Temperate Europe
- Reflections on the Other Side. A Southern Iberia Origin for the First Pottery Production of Northern Morocco?
- Early Neolithic Settlement Patterns in the Polish Lowlands – A Case Study of Selected Micro-Regions in Eastern Kuyavia
- Domesticated Water: Four Early Neolithic Wells in Moravia (CZ)
- Exploring the Broad Spectrum: Vegetal Inclusions in Early Neolithic Eastern Balkan Pottery
- A Multidisciplinary Approach to the Study of Early Neolithic Pyrotechnological Structures. The Case Study of Portonovo (Marche, Italy)
- Socialising the Landscape in the Early Neolithic of Thessaly, Greece
- Early Neolithic Husbandry in the Pre-Pyrenean Area. The Management of Herds at the Cova Colomera (Serra del Montsec, Spain) and Its Implications for the Early Occupation of the Region
- Transition from Swifterbant to Funnelbeaker: A Bayesian Chronological Model
- Keeping the Frontier: Steps “Towards Neolithization” in the Eastern Gulf of Finland
- Pastoral Practices, Bedding and Fodder During the Early Neolithic Through Micromorphology at Cova Colomera (Southeastern Pre-Pyrenees, Iberia)
- Similarities and Differences Between Italian Early Neolithic Groups: The Role of Personal Ornaments
- The Phenomena La Hoguette and Limburg – Technological Aspects
- Setting the Boundaries of Early Neolithic Settlement Sites: The Ditch-Digging Practices in the Eastern Balkans
- Geoarchaeological and Paleo-Hydrological Overview of the Central-Western Mediterranean Early Neolithic Human–Environment Interactions
- The First Italian Farmers: The Role of Stone Ornaments in Tradition, Innovation, and Cultural Change
- Distribution of Organic-Tempered Pottery in Southeast Europe and the Near East: A Complex Picture. The Case of Northern Greece
- The Loom Weight, the Spindle Whorl, and the Sword Beater – Evidence of Textile Activity in the Early Neolithic?
- The Subsistence Strategy of Linear Pottery Culture in Moravia (Czech Republic): Current State of Knowledge
- The First Neolithic Occupation of La Cova del Randero (Pedreguer, Alicante, Spain)
- Innovations of the Beginning of the Sixth Millennium BC in the Northern Pontic Steppe
- Herders and Pioneers: The Role of Pastoralism in the Neolithization of the Amblés Valley (Ávila, Central Iberia)
- Sign-Objects Among Neolithic Faunal Remains, Visible Symbols
- Different Paths of Neolithisation of the North-Eastern Part of Central Europe
- “New Kids on the Block?” Reappraising Pottery Styles, aDNA, and Chronology from Western Iberia Early Neolithic
- Neolithic Long Barrows and Enclosures as Landmarks of Ritual Landscape of Central and North Bohemia