Rheumatoid arthritis drugs and the risk of Parkinson’s disease – a meta-analysis
-
Abdelrahman Mady
 ,
Muataz Kashbour
,
Omar Abu-Qare’e
,
Rana Jaffal
,
Ahmed Khaled
,
Asma Daoud
,
Mahmoud Samir
,
Abdelbassat Belakhdar
,
Sara Adel Awwad
,
Hend Mansour
,
Muataz Kashbour
,
Omar Abu-Qare’e
,
Rana Jaffal
,
Ahmed Khaled
,
Asma Daoud
,
Mahmoud Samir
,
Abdelbassat Belakhdar
,
Sara Adel Awwad
,
Hend Mansour


Abstract
Introduction
Several observational studies reported an association between Rheumatoid Arthritis (RA) and the subsequent risk of developing Parkinson’s disease (PD). However, whether the drugs commonly prescribed for RA contribute to this association remains controversial.
Content
We sought to summarize all the published evidence regarding the association between the drugs used for RA and the risk of developing PD as well as to explore the potential neuroprotective and therapeutic potential of these drugs for PD patients. We searched three electronic biomedical databases (namely, PubMed, Scopus, and Web of Science) to find potentially relevant studies. The outcome of interest was the relative risk (RR) of developing PD in individuals taking any of these drugs: (1) non-steroidal anti-inflammatory drugs (NSAIDs), (2) acetaminophen, (3) corticosteroids, and (4) disease-modifying anti-rheumatoid drugs (DMARDs), compared to individuals not taking them.
Summary and outlook
26 studies (15 case-control and 11 cohort) were included in the analysis with a total number of 4,321,104 participants including 150,703 PD cases. Analysis showed a statistically significant lower risk of developing PD among individuals who received corticosteroids (RR 0.80, 95% CI 0.77 – 0.84, P<0.00001) and DMARDs (RR 0.69, 95% CI 0.55 – 0.86, P<0.001). Subgroup analysis by individual drugs showed a decreased risk with dexamethasone (RR 0.69, 95% CI 0.60 – 0.79, P<0.00001) and hydroxychloroquine (RR 0.77, 95% CI 0.66 – 0.90, P<0.001). Our findings showed that individuals who were treated with corticosteroids (especially dexamethasone) and DMARDs (especially hydroxychloroquine) have reduced risk of developing PD compared to those not receiving these medications.
Introduction
Parkinson’s disease (PD) is a chronic neurodegenerative disorder characterized by the progressive loss of dopaminergic neurons in the substantia nigra, leading to a variety of motor and non-motor symptoms [1]. It is the second most common neurodegenerative disorder, affecting millions of individuals worldwide, and its prevalence is expected to rise with the aging population. The hallmark motor symptoms of PD include bradykinesia, rigidity, resting tremors, and postural instability [2].
While the exact cause of PD remains elusive, multiple pathogenic mechanisms have been proposed, involving both genetic and environmental factors [3], [4], [5]. One of the potential contributors to the disease is chronic inflammation and immune dysregulation [6], [7], [8]. This has led researchers to explore the potential role of the drugs traditionally used to treat autoimmune and inflammatory conditions in modifying the course of PD [9], [10], [11].
In recent years, there has been increasing interest in investigating the effects of RA drugs, such as nonsteroidal anti-inflammatory drugs (NSAIDs), on PD. Additionally, other drugs commonly used for RA, such as corticosteroids and disease-modifying antirheumatic drugs (DMARDs) have also been found to exhibit immunomodulatory properties that may influence the neuroinflammatory processes and provide neuroprotection in PD [12], [13], [14].
Despite the promising findings, there remains a gap in our understanding of the potential benefits and risks of RA drugs in the context of PD. This study aims to systematically review the existing literature on RA drugs in the context of PD. By critically evaluating the available evidence, we seek to provide a comprehensive and up-to-date analysis of the potential role of RA drugs as a therapeutic avenue for PD management. Such insights could offer valuable guidance to clinicians and researchers in the development of novel treatment approaches for this debilitating neurological condition.
Methods
The study was prospectively registered on the International Prospective Register of Systematic Reviews (PROSPERO: CRD42023447780). We followed the Preferred Reporting Items for Systematic Reviews and Meta-Analyses (PRISMA 2020) guidelines [15].
Search strategies
To identify relevant observational studies investigating the potential link between the medications used for RA and the development of PD, we searched three medical databases: PubMed, Web of Science, and Scopus. We used combinations of the following terms in our search strategy: rheumatoid arthritis, rheumat*, antirheum*, anti-rheum*, DMARD*, and parkinson’s disease. By adding an * to the end of a term, the search engines pick out other forms of the word. We searched databases from inception until August 2023.
Inclusion and exclusion criteria
Inclusion Criteria
Study Design: prospective and retrospective observational studies, including cohort and case series.
Population: Adults without a prior PD diagnosis.
Exposure: exposure to any of the following drugs: NSAIDs, Glucocorticoids, and Disease-modifying anti-rheumatoid drugs (DMARDs).
Outcome: PD occurrence over the course of the follow-up period.
Exclusion Criteria
Studies not published in English.
Case reports, case series, and cross-sectional studies
Non-human studies.
Papers that do not provide any original information, such as reviews and meta-analyses.
Studies with inaccessible or insufficient data.
Data extraction
We extracted data on patients’ demographics and study characteristics including study design, number of PD cases, effect estimates, and variables adjusted. Two independent reviewers extracted data to a uniform Google sheet. A third independent reviewer further checked the retrieved data to confirm data accuracy. All disagreements were resolved through discussion.
Quality assessment
Two independent groups of authors assessed the quality of the retrieved 26 observational studies according to the Newcastle-Ottawa Scale (NOS). NOS uses a star system (with a maximum of nine stars) to evaluate a study in three domains: (a) selection of participants (4 stars); (b) comparability of study groups (2 stars); (c) the ascertainment of outcomes of interest (3 stars). A study was considered to be at low-risk bias if it received a score of nine stars; subsequently, a study was considered to be at medium and high-risk bias if it received a score of seven to eight and less than seven stars respectively [16].
Statistical analysis
The odds ratios (ORs) and relative risks (RRs) with 95 % confidence interval (CIs) were pooled in meta-analysis models. A RR value >1 indicates an increased risk of PD, and a RR value <1 indicates a decreased risk of PD. The p-value was used to evaluate whether the results were statistically significant. If the p-value was less than 0.05, then it was considered statistically significant.
In cases where multiple effect estimates, such as RRs, were provided due to different methodologies, we prioritized “ever use” over other categories like “past use” or “current use.” When faced with various RRs associated with different durations of drug exposure, we selected the RR corresponding to the longest exposure duration. Furthermore, we favored the effect estimate from the main analyses over sensitivity analyses and preferred the one associated with a lag period over the one that was not.
Dealing with missing data
When a cohort study [17] didn’t provide RR for a specific drug, we calculated RR and its 95 % CI from the provided numbers of exposed and non-exposed cohorts according to Altman [18] using MedCalc statistical software for Windows, version 19.4 (MedCalc software, Ostend, Belgium; https://www.medcalc.org). When another case-control study [19] plotted the RRs and 95 % CI for different drugs on a graph but didn’t report them as numbers, the data were extracted from the graph using the PlotDigitzer software (https://plotdigitizer.com).
Assessment of heterogeneity
We quantified the heterogeneity using the I2 statistic, and determined its significance based on the accompanying p-value of the Cochran Q test. An I2 value of 0 % indicates no observed heterogeneity, and I2 values of 25 %, 50–75 %, and >75 % indicate low, moderate, and high levels of heterogeneity, respectively [20]. In case of significant heterogeneity (Chi-Square p<0.1), a random effects model of meta-analysis was used [21].
Publication bias
To assess publication bias across studies, funnel plots were generated using RevMan software, plotting the pooled effect estimate against its standard error (SE). The presence of publication bias was evaluated based on the symmetry of these funnel plots. Additionally, two statistical tests, namely Egger’s regression test and the Begg and Mazumdar rank correlation test (Kendall’s tau), were employed to further examine the evidence of publication bias. A low p-value (>0.05) suggests evidence against the null hypothesis, indicating the presence of publication bias.
Results
Study selection
Following the screening of 3,255 titles from 3 databases, 448 studies were eliminated as duplicates, and another 2,718 were eliminated through the review of the titles and abstract as they did not seem to be related to the topic. A total of 89 studies were qualified for full-text screening, and 26 studies were eventually included in the analysis. Figure 1 illustrates the flow diagram of the study selection process and a detailed justification for the study’s ineligibility. For example, a Danish cohort study was excluded because it used osteoarthritis diagnosis as a surrogate for NSAID use [22].

PRISMA flow diagram of the study selection process.
Description of the included studies
Twenty-six studies with a total number of 4,321,104 participants including 150,703 PD cases were included. Table 1 shows the characteristics of the included studies. Fifteen studies that were included in the final analysis were case-control studies [10], 19], [23], [24], [25], [26], [27], [28], [29], [30], [31], [32], [33], [34], [35], 11 were cohort studies [9], 17], [36], [37], [38], [39], [40], [41], [42], [43], [44]. Among the studies included, 11 studies were conducted in the USA [9], 17], 31], 34], [36], [37], [38], [39], [40, 42], 43], 3 in Canada [25], 26], 41], 3 in Taiwan [29], 33], 35], 2 in the Netherlands [23], 44], 2 in Finland [28], 30], 1 in Norway [24], 1 in Denmark [19], 1 in the United Kingdom [27], and 1 in South Korea [10].
Baseline characteristics of included studies.
| Study | Year | Country | Design | Number of participants | PD cases | Age mean (SD) | Male/female | Adjustment/matching |
|---|---|---|---|---|---|---|---|---|
| Becker et al. | 2011 | Netherlands | Case-control | 19,995 | 4,026 | >40 | 11,726/8,269 | 1–15 |
| Bornebroek et al. | 2007 | USA | Cohort | 6,512 | 88 | 68.7 (8.6) | 2,667/3,845 | 1–3, 16–19 |
| Bower et al. | 2006 | Norway | Case-control | 392 | 196 | 71 (9.3) | 242/150 | 1, 2 |
| Brakedal et al. | 2021 | USA | Cohort | 1,153,914 | 7,580 | 70.6 (9.2) | 531,657/622,257 | 1, 2 |
| Chen et al. | 2003 | USA | Cohort | 142,902 | 415 | NA | 44,057/98,845 | 1, 3, 16, 20 |
| Chen et al. | 2005 | USA | Cohort | 146,948 | 413 | 62 | 65,657/81,291 | 1–3, 16, 20, 21 |
| Driver et al. | 2011 | Canada | Case-control | 3,696 | 616 | 59 (7.5) | 3,696 | 1, 3, 4, 20, 22, 23 |
| Etminan et al. | 2006 | Canada | Case-control | 13,849 | 1,259 | 73.9 (10.3) | 7,491/6,358 | 1, 2, 24, 25 |
| Etminan et al. | 2008 | USA | Cohort | 697,078 | 5,010 | 46.5(22.0)a 50.7 (20.9)b | 298,543/398,535 | 1, 2, 24, 26 |
| Gao et al. | 2011 | USA | Cohort | 136,197 | 291 | 66 | 74,908/61,289 | 1–4, 16, 20 |
| Hancock et al. | 2007 | UK | Case-control | 673 | 356 | 66.1 (10.7)c 63.7 (12.3)d |
374/299 | 1, 2 |
| Hernan et al. | 2006 | Finland | Case-control | 7,896 | 1,258 | 70.7 68.7 |
4,668/3,208 | 1–3, 7, 27 |
| Koponen et al. | 2022 | Taiwan | Case-control | 155,970 | 22,189 | 70.8 (9.7)c 70.5 (9.6)d |
86,142/69,828 | 1–3, 5–9, 10, 16, 28 |
| Lin et al. | 2013 | Canada | Cohort | 33,388 | 32 | NA | 16,753/16,634 | 1–3, 15, 16, 29 |
| Maclagan et al. | 2020 | Denmark | Case-control | 89,196 | 14.866 | 78.0 (5.4)c | 50,286/38,910 | 1, 2, 26 |
| Manthripragada et al. | 2011 | Finland | Case-control | 11,582 | 1,931 | 72.2 (10.5)d | 6,724/4,858 | 1, 2, 6, 7, 26 |
| Paakinaho et al. | 2022 | South Korea | Case-control | 1,886 | 315 | 73.1 (8) | 655/1,231 | 1, 2, 18 |
| Park et al. | 2019 | USA | Cohort | 155,444 | 226 | 39.9 (16.6) | 950,056/60,721 | 1, 2, 26 |
| Peter et al. | 2018 | USA | Cohort | 864,108 | 1,796 | 51 (17) | 380,208/483,901 | 1, 2 |
| Powers et al. | 2008 | USA | Case-control | 2,114 | 1,186 | 68 | NA | 1–3, 16 |
| Racette et al. | 2018 | Denmark | Case-control | 100,619 | 48,295 | 78.6 (6.1)c 76.4 (6.3)d |
39,145/61,474 | 1–3, 5, 6, 30 |
| Song et al. | 2023 | Taiwan | Case-control | 377,272 | 28,679 | 78.4 (6.1)c 76.6 (6.2)d |
136,183/241,089 | 1, 2, 6–10, 15, 18, 19, 30–33 |
| Sung et al. | 2016 | USA | Cohort | 166,105 | 2,741 | 53.9 (14) | 37,195/128,910 | 1, 2, 7–10, 15 |
| Ton et al. | 2005 | USA | Case-control | 589 | 206 | 69 (9) | 360/229 | 1–3, 7–10, 27 |
| Wahner et al. | 2007 | Taiwan | Case-control | 579 | 293 | 70.0 (10.7)c 69.0 (12.9)d |
303/276 | 1–3, 30, 34 |
| Yeh et al. | 2020 | Netherlands | Cohort | 32,200 | 6,440 | 47.3 (17.1)a 47.6 (16.9)b |
15,495/16,705 | 1, 2, 7–10, 15, 32 |
-
aExposure cohort, bnon-exposure cohort, ccases, dcontrols. 1 age, 2 sex, 3 smoking, 4 BMI, 5 asthma, 6 COPD, 7 cardiovascular disease, 8 HTN, 9 stroke, 10 diabetes, 11 dementia, 12 constipation, 13 sleep disorders, 14 urinary dysfunction, 15 depression, 16 caffeine, 17 gout, 18 rheumatoid, 19 osteoarthritis, 20 alcohol, 21 vitamin supplement, 22 aspirin, 23 exercise, 24 antipsychotics, 25 anti-rheumatic medication other than NSAIDs, 26 comorbidity, 27 arthritis, 28 substance abuse, 29 ibuprofen, 30 race/ethnicity, 31 cancer, 32 chronic kidney disease, 33 eye disease, 34 education.
Methodological quality of the included studies
After applying NOS to the 26 included studies, we categorized the studies into high, medium, or low quality, with scores of 9, 7–8, and <7, respectively. 2 studies were found to be of high quality, 11 studies were found to be of medium quality, and 13 studies were found to be of low quality. The NOS assessment and score of each study is detailed in Table 2.
The quality assessment of the included studies.
| Study (cohort) | Representativeness of exposed cohort | Selection of non-exposed cohort | Ascertainment of exposure | Outcome not present before study | Comparability | Assessment of outcome | Follow-up long enough | Adequacy of follow up | Quality score |
|---|---|---|---|---|---|---|---|---|---|
| Chen 2003 | * | * | * | * | * | * | * | 7 | |
| Chen 2005 | * | * | * | * | * | * | * | 7 | |
| Bornebroek 2007 | * | * | * | * | * | * | 6 | ||
| Etminan 2008 | * | * | * | * | * | * | * | * | 8 |
| Gao 2011 | * | * | * | * | * | 5 | |||
| Lin 2013 | * | * | * | * | * | * | 6 | ||
| Sung 2016 | * | * | * | * | * | * | 6 | ||
| Peter 2018 | * | * | * | * | * | * | 6 | ||
| Yeh 2020 | * | * | * | * | * | * | 6 | ||
| Brakedal 2021 | * | * | * | * | * | * | 6 | ||
| Ton 2005 | * | * | * | * | * | * | 6 | ||
| Bower 2006 | * | * | * | * | * | * | 6 | ||
| Etminan 2006 | * | * | * | ** | * | * | * | 8 | |
| Hernaan 2006 | * | * | * | ** | * | * | 7 | ||
| Hancock 2007 | * | * | * | ** | * | 6 | |||
| Powers 2007 | * | * | * | * | * | 5 | |||
| Wahner 2007 | * | * | * | * | * | 5 | |||
| Becker 2011 | * | * | * | * | ** | * | * | * | 9 |
| Manthripragada 2011 | * | * | * | * | * | * | 6 | ||
| Driver 2011 | * | * | * | ** | * | * | 7 | ||
| Racette 2018 | * | * | * | * | * | 5 | |||
| Park 2019 | * | * | * | * | * | * | 6 | ||
| Maclagan 2020 | * | * | * | * | * | * | * | 7 | |
| Koponen 2022 | * | * | * | * | * | * | * | 7 | |
| Paakinaho 2022 | * | * | * | ** | * | * | 7 | ||
| Song 2023 | * | * | * | * | * | * | 6 |
Description of the included drugs
The included studies reported an association between the PD risk and many classes of drugs. These included NSAIDs (18 studies), acetaminophen (6 studies), corticosteroids (5 studies), and DMARDs (6 studies). Individual NSAIDs included aspirin (9 studies), ibuprofen (6 studies), diclofenac (2 studies), and naproxen (2 studies). Individual corticosteroids included prednisolone (2 studies), dexamethasone (2 studies), hydrocortisone (2 studies), prednisone (1 study), methylprednisolone (1 study). Individual DMARDs included methotrexate (4 studies), anti-tumor necrosis factor (anti-TNF) agents (2 studies), chloroquine/hydroxychloroquine (2 studies), sulfasalazine (2 studies), and other DMARDs (azathioprine, leflunomide, mycophenolate, mesalamine; 1 study). Table 3 shows the pooled RRs and 95 % CIs for each of these drugs.
The included drugs and their association with the risk of Parkinson’s disease.
| Drug | Studies no. | References of the pooled studies | Pooled RR (95 % CI) | p-Value | Chi2 p-value, I2 |
|---|---|---|---|---|---|
| NSAIDs | 18 studies | [9], 17], [23], [24], [25], [26], [27], [28, 30], 31], [34], [35], [36], [37], [38], [39], [40, 44] | 0.96 (0.83–1.11) | 0.57 | <0.00001, 87 % |
| Aspirin | 9 studies | [17], 23], 24], 28], 30], 34], 35], 37], 40] | 1.06 (0.91–1.25) | 0.45 | 0.00001, 84 % |
| Ibuprofen | 6 studies | [17], 23], 30], 34], 40], 41] | 1.00 (0.78–1.28) | 1.00 | 0.0003, 78 % |
| Diclofenac | 2 studies | [17], 23] | 1.11 (0.82–1.49) | 0.51 | 0.01, 84 % |
| Naproxen | 2 studies | [17], 23] | 0.96 (0.83–1.12) | 0.64 | 0.90, 0 % |
| Acetaminophen | 6 studies | [23], 28], 30], 37], 38], 40] | 1.09 (1.01–1.18) | 0.02 | 0.30, 80 % |
| Corticosteroids | 5 studies | [10], 19], 29], 32], 42] | 0.80 (0.77–0.84) | <0.00001 | 0.28, 21 % |
| Prednisolone | 2 studies | [29], 32] | 0.87 (0.24–3.21) | 0.84 | 0.02, 82 % |
| Dexamethasone | 2 studies | [19], 32] | 0.69 (0.60–0.79) | <0.00001 | 0.27, 17 % |
| Hydrocortisone | 2 studies | [19], 32] | 0.89 (0.69–1.15) | 0.38 | 0.40, 0 % |
| Prednisone | 1 study | [32] | 0.81 (0.77–0.86) | N/A | |
| Methylprednisolone | 1 study | [32] | 0.80 (0.74–0.87) | N/A | |
| DMARDs | 6 studies | [9], 10], 32], 33], 43] | 0.69 (0.55–0.86) | 0.001 | 0.01, 66 % |
| Methotrexate | 4 studies | [10], 29], 32], 33] | 0.92 (0.78–1.08) | 0.29 | 0.07, 58 % |
| Anti-TNF agents | 2 studies | [32], 43] | 0.75 (0.42–1.33) | 0.32 | 0.12, 54 % |
| Chloroquine/hydroxychloroquine | 2 studies | [10], 32] | 0.77 (0.66–0.90) | 0.001 | 0.27, 19 % |
| Sulfasalazine | 2 studies | [10], 32] | 1.00 (0.82–1.22) | 0.98 | 0.94, 0 % |
| Azathioprine | 1 study | [32] | 0.79 (0.54–1.16) | N/A | |
| Leflunomide | 1 study | [32] | 0.71 (0.47–1.08) | N/A | |
| Mycophenolate | 1 study | [32] | 0.55 (0.28–1.08) | N/A | |
| Mesalamine | 1 study | [32] | 0.89 (0.70–1.13) | N/A |
NSAIDs and risk of PD
Main analysis
A total of 18 studies were included in the analysis to assess the overall effect of NSAIDs on the risk of PD (Figure 2). The RR with a 95 % CI was 0.96 (0.83–1.11), with a p-value of 0.57. This suggests that there is no statistically significant association between the use of NSAIDs and the risk of PD.

Forest plot for the association between overall NSAID use and the risk of Parkinson’s disease.
Subgroup analysis by individual NSAIDs
We examined individual NSAIDs, including aspirin, ibuprofen, diclofenac, and naproxen, to explore their specific associations with the risk of PD (Figure 3).

Forest plots for the association between individual NSAIDs use and the risk of Parkinson’s disease.
Aspirin: Nine studies were included in this analysis, and the pooled RR with a 95 % CI was 1.06 (0.91–1.25) with a p-value of 0.45. These results suggest that there is no statistically significant association between Aspirin use and the risk of PD.
Ibuprofen: A total of six studies were included, and the pooled RR was 1.00 (0.78–1.28) with a p-value of 1.00. This indicates no significant association between Ibuprofen and PD.
Diclofenac: The analysis of two studies yielded a pooled RR of 1.11 (0.82–1.49) with a p-value of 0.51. These findings do not suggest a significant association between Diclofenac and PD.
Naproxen: Two studies were included in this analysis, and the pooled RR was 0.96 (0.83–1.12) with a p-value of 0.64. This implies that there is no statistically significant association between Naproxen and PD.
Sensitivity analyses
To test the robustness of the findings, we repeated the analysis for each drug an equal number of times to the number of studies that reported it. This was done by excluding one study each time to test its effect on the result. These analyses did not reveal any substantial changes in the associations between NSAIDs and PD risk, further supporting the overall results.
Acetaminophen and risk of PD
A total of six studies were included in this analysis [23], 28], 30], 37], 38], 40]. The pooled RR with a 95 % CI was 1.09 (1.01–1.18), and the p-value was 0.02 (Figure 4). These results suggest that there is a statistically significant association between acetaminophen use and an increased risk of PD.

Forest plot for the association between acetaminophen use and the risk of Parkinson’s disease.
Corticosteroids and risk of PD
We began by examining the overall effect of corticosteroids on the risk of PD using data from five studies [10], 19], 29], 32], 42]. The pooled RR with a 95 % CI was 0.80 (0.77–0.84), and the associated p-value was <0.00001 (Figure 5). These results indicate a statistically significant association between corticosteroid use and a reduced risk of PD.
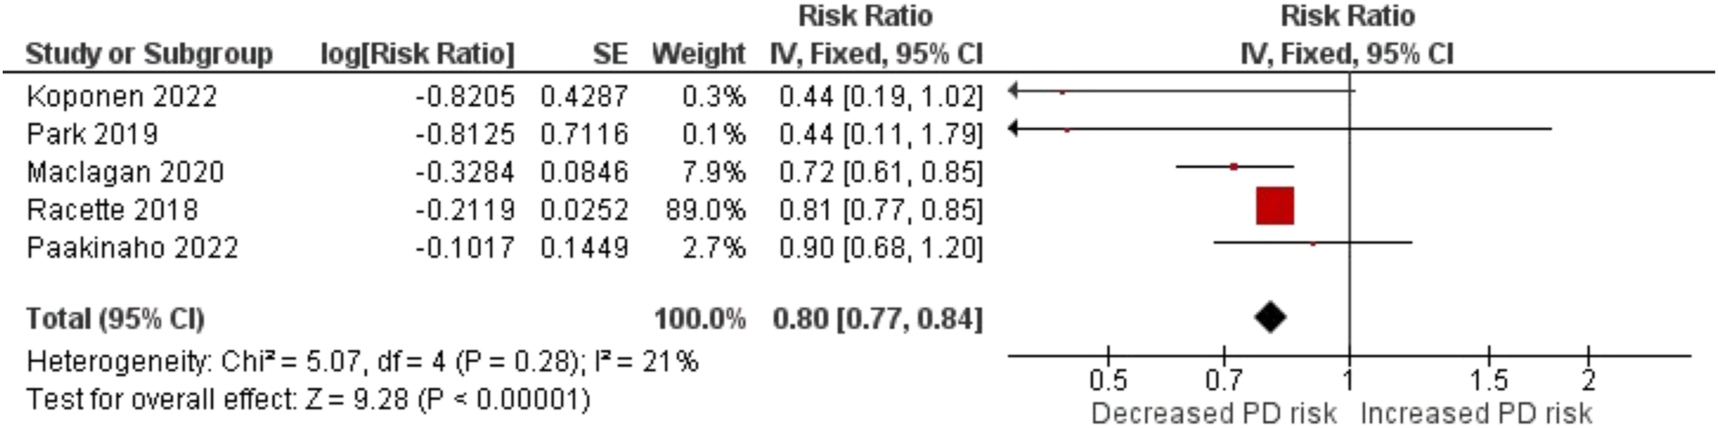
Forest plot for the association between corticosteroids use and the risk of Parkinson’s disease.
To provide a more comprehensive understanding, we conducted subgroup analyses for individual corticosteroids (Figure 6), including:

Forest plots for the association between individual corticosteroids use and the risk of Parkinson’s disease.
Prednisolone: Data from two studies showed a pooled RR of 0.87 (0.24–3.21), with a p-value of 0.84. While the point estimate suggests a reduced risk, the wide confidence interval indicates uncertainty regarding the association.
Dexamethasone: Analysis of two studies resulted in a pooled RR of 0.69 (0.60–0.79), with a p-value of <0.00001. This suggests a statistically significant association between dexamethasone use and a reduced risk of PD.
Hydrocortisone: Our analysis of two studies yielded a pooled RR of 0.89 (0.69–1.15), with a p-value of 0.38. These results do not indicate a statistically significant association between hydrocortisone and PD.
DMARDs and risk of PD
We started by assessing the overall effect of DMARDs on the risk of PD using data from six studies [9], 10], 32], 33], 43]. The pooled RR with a 95 % CI was 0.92 (0.78–1.08), and the associated p-value was 0.29 (Figure 7). These results indicate that there is no statistically significant association between the use of DMARDs and the risk of PD. To provide a comprehensive analysis, we further explored the effects of specific DMARDs (Figure 8), including:

Forest plot for the association between DMARDs use and the risk of Parkinson’s disease.

Forest plot for the association between individual DMARDs use and the risk of Parkinson’s disease.
Synthetic DMARDs
Methotrexate: Data from four studies showed a pooled RR of 0.92 (0.78–1.08), with a p-value of 0.29. These results indicate no statistically significant association between Methotrexate use and the risk of PD.
Chloroquine/Hydroxychloroquine: Analysis of two studies resulted in a pooled RR of 0.77 (0.66–0.90), with a p-value of 0.001. This indicates a statistically significant association between Chloroquine/Hydroxychloroquine use and a reduced risk of PD.
Sulfasalazine: Data from two studies yielded a pooled RR of 1.00 (0.82–1.22), with a p-value of 0.98. These results do not suggest a statistically significant association between Sulfasalazine and PD.
Biological DMARDs
Analysis of two studies resulted in a pooled RR of 0.75 (0.42–1.33), with a p-value of 0.32. These findings suggest no statistically significant association between Anti-TNF agents and PD.
Publication bias assessment
The symmetry of the funnel plot (Figure 9) indicates the absence of publication bias in the studies reporting the association between NSAIDs use and the risk of PD. Moreover, Egger’s test and Kindalls Tau test p-values (0.274 and 0.410 respectively) confirm the absence of publication bias. We did not perform the publication bias assessment for the studies on acetaminophen, corticosteroids, and DMARDs because of the small number of studies on these drugs.

Funnel plot for assessment of the publication bias for the association between NSAIDs use and risk of Parkinson’s disease.
Discussion
This systematic review and meta-analysis aimed to investigate the association between the use of drugs commonly prescribed for RA and the risk of developing PD. The drugs of interest included NSAIDs, acetaminophen, corticosteroids, and DMARDs. The comprehensive analysis of 26 studies involving a total of 4,321,104 participants, including 150,703 PD cases, provides valuable insights into the potential relationships between these drugs and PD risk.
NSAIDs are a class of medications that have long been recognized for their anti-inflammatory and analgesic properties [45]. The chronic inflammation and immune dysregulation observed in PD have spurred interest in investigating the role of NSAIDs in modifying PD risk [46]. However, our analysis did not reveal a statistically significant association between NSAID use and PD risk, suggesting that the use of NSAIDs, including aspirin, ibuprofen, diclofenac, and naproxen, is not significantly linked to the development of PD.
These findings are consistent with some previous studies and meta-analyses [46], [47], [48], [49], which reported a lack of significant association between NSAID use and PD risk. It is important to note that the impact of NSAIDs may vary depending on the specific agent, dose, and duration of use. Further research is warranted to explore these factors in more detail, as they may provide a more nuanced understanding of the potential effects of NSAIDs on PD.
Additionally, our analysis revealed a statistically significant association between the use of acetaminophen and an increased risk of PD. While the observed effect size was relatively small, it suggests a potential link between acetaminophen and PD pathogenesis. Although the mechanism underlying this association is uncertain, this finding emphasizes the need for additional research to better understand the potential risks associated with acetaminophen use, especially in individuals at risk of developing PD. Given the widespread use of acetaminophen as an over-the-counter pain reliever, its potential impact on neurodegenerative diseases like PD is an important area for future investigation.
Corticosteroids have well-established anti-inflammatory properties and have been widely used to manage various inflammatory conditions, including RA [50]. Our analysis indicated a statistically significant association between corticosteroid use and a reduced risk of PD. Specifically, dexamethasone showed a strong and statistically significant protective effect, while prednisolone demonstrated a potential but inconclusive reduction in PD risk.
The potential neuroprotective effects of corticosteroids in PD are intriguing and warrant further exploration. However, it is important to acknowledge that corticosteroids come with potential side effects, and their use should be carefully considered, especially in a chronic condition like PD.
Our analysis suggests that DMARDs may significantly decrease the risk of PD. However, it is important to consider the potential heterogeneity within this drug class, as different DMARDs may have distinct effects on inflammatory pathways and neuroprotection. Therefore, further research is needed to explore the potential neuroprotective properties of specific DMARDs and their impact on PD risk.
This study has a few limitations. First, the included studies exhibited heterogeneity in terms of design, population, and methodology. While we performed subgroup analyses and sensitivity analyses to address some of these issues, the overall heterogeneity may have affected the results. Additionally, variability in the definition of exposure and the length of follow-up in different studies may introduce biases and affect the reliability of the results. Neuroprotection, being a slow process, requires chronic treatment of at least six months, and studies with shorter treatment durations might yield unreliable results due to insufficient exposure. Moreover, PD occurs more often in older population with a mean age of onset in the early to mid‐60s [51]. As a result, If the studies do not have sufficient follow up periods, it can fail to show the development of PD, not because the drug was protective but because the study failed to catch the event. This requires the follow up (from exposure to outcome assessment) to be at least comparable between the exposed and the non-exposed group. We reported the risk of bias regarding exposure and follow-up in our NOS assessment (items: ascertainment of exposure, follow-up long enough, and adequacy of follow-up). Addressing these issues, future studies should incorporate more stringent criteria for defining exposure and ensure comparable follow-up periods between exposed and non-exposed groups. Second, the use of observational studies in our analysis may introduce potential confounding factors that could not be fully accounted for. Future research, particularly randomized controlled trials, may help elucidate causal relationships and provide more robust evidence.
This study contributes to the growing body of literature exploring the potential link between drugs used for RA and PD. While the associations identified in this study may not be definitive, they provide valuable insights for further investigation. Understanding the potential impact of these drugs on PD risk is crucial for optimizing therapeutic strategies and improving the quality of life for individuals affected by this neurodegenerative condition.
In conclusion, our analysis did not find a significant association between NSAID use and PD risk. On the other hand, individuals treated with corticosteroids, particularly dexamethasone, and DMARDs, particularly hydroxychloroquine, were less likely to develop PD. Further research is needed to confirm and better understand these associations, as well as to explore the underlying mechanisms and clinical implications for patients taking anti-RA drugs and their risk of developing PD.
-
Research ethics: Not applicable.
-
Informed consent: Not applicable.
-
Author contributions: All authors have accepted responsibility for the entire content of this manuscript and approved its submission.
-
Use of Large Language Models, AI and Machine Learning Tools: None declared.
-
Conflict of interest: All other authors state no conflict of interest.
-
Research funding: Ahmed Negida and Matthew J. Barrett disclose support for the research of this work from NIH 1R21AG077469-01. Ahmed Negida has received a grant from the International Parkinson and Movement Disorder Society.
-
Data availability: Data used in this study are available upon a request from the corresponding author.
References
1. Antony, PMA, Diederich, NJ, Krüger, R, Balling, R. The hallmarks of Parkinson’s disease. FEBS J 2013;280:5981–93. https://doi.org/10.1111/febs.12335.Suche in Google Scholar PubMed
2. Bloem, BR, Okun, MS, Klein, C. Parkinson’s disease. Lancet 2021;397:2284–303. https://doi.org/10.1016/S0140-6736(21)00218-X.Suche in Google Scholar PubMed
3. Tysnes, O-B, Storstein, A. Epidemiology of Parkinson’s disease. J Neural Transm 2017;124:901–5. https://doi.org/10.1007/s00702-017-1686-y.Suche in Google Scholar PubMed
4. Simon, DK, Tanner, CM, Brundin, P. Parkinson disease epidemiology, pathology, genetics, and pathophysiology. Clin Geriatr Med 2020;36:1–12. https://doi.org/10.1016/j.cger.2019.08.002.Suche in Google Scholar PubMed PubMed Central
5. Harms, AS, Barnum, CJ, Ruhn, KA, Varghese, S, Treviño, I, Blesch, A, et al.. Delayed dominant-negative TNF gene therapy halts progressive loss of nigral dopaminergic neurons in a rat model of Parkinson’s disease. Mol Ther 2011;19:46–52. https://doi.org/10.1038/mt.2010.217.Suche in Google Scholar PubMed PubMed Central
6. Harms, AS, Ferreira, SA, Romero-Ramos, M. Periphery and brain, innate and adaptive immunity in Parkinson’s disease. Acta Neuropathol 2021;141:527–45. https://doi.org/10.1007/s00401-021-02268-5.Suche in Google Scholar PubMed PubMed Central
7. Rugbjerg, K, Friis, S, Ritz, B, Schernhammer, ES, Korbo, L, Olsen, JH. Autoimmune disease and risk for Parkinson disease: a population-based case-control study. Neurology 2009;73:1462–8. https://doi.org/10.1212/WNL.0b013e3181c06635.Suche in Google Scholar PubMed PubMed Central
8. Marogianni, C, Sokratous, M, Dardiotis, E, Hadjigeorgiou, GM, Bogdanos, D, Xiromerisiou, G. Neurodegeneration and inflammation–an interesting interplay in Parkinson’s disease. Int J Mol Sci 2020;21:8421. https://doi.org/10.3390/ijms21228421.Suche in Google Scholar PubMed PubMed Central
9. Sung, YF, Liu, FC, Lin, CC, Lee, JT, Yang, FC, Chou, YC, et al.. Reduced risk of Parkinson disease in patients with rheumatoid arthritis. Mayo Clin Proc 2016;91:1346–53. https://doi.org/10.1016/j.mayocp.2016.06.023.Suche in Google Scholar PubMed
10. Paakinaho, A, Koponen, M, Tiihonen, M, Kauppi, M, Hartikainen, S, Tolppanen, AM. Disease-modifying antirheumatic drugs and risk of Parkinson disease: nested case-control study of people with rheumatoid arthritis. Neurology 2022;98:e1273–81. https://doi.org/10.1212/WNL.0000000000013303.Suche in Google Scholar PubMed PubMed Central
11. Smolen, JS, Aletaha, D, McInnes, IB. Rheumatoid arthritis. Lancet 2016;388:2023–38. https://doi.org/10.1016/S0140-6736(16)30173-8.Suche in Google Scholar PubMed
12. Li, D, Hong, X, Chen, T. Association between rheumatoid arthritis and risk of Parkinson’s disease: a meta-analysis and systematic review. Front Neurol 2022;13:885179. https://doi.org/10.3389/fneur.2022.885179.Suche in Google Scholar PubMed PubMed Central
13. Kang, J, Eun, Y, Jang, W, Cho, MH, Han, K, Jung, J, et al.. Rheumatoid arthritis and risk of Parkinson disease in Korea. JAMA Neurol 2023;80:634. https://doi.org/10.1001/jamaneurol.2023.0932.Suche in Google Scholar PubMed PubMed Central
14. Asanuma, M, Nishibayashi-Asanuma, S, Miyazaki, I, Kohno, M, Ogawa, N. Neuroprotective effects of non-steroidal anti-inflammatory drugs by direct scavenging of nitric oxide radicals. J Neurochem 2001;76:1895–904. https://doi.org/10.1046/j.1471-4159.2001.00205.x.Suche in Google Scholar PubMed
15. Page, MJ, McKenzie, JE, Bossuyt, PM, Boutron, I, Hoffmann, TC, Mulrow, CD, et al.. The PRISMA 2020 statement: an updated guideline for reporting systematic reviews. Syst Rev 2021;10:89. https://doi.org/10.1186/s13643-021-01626-4.Suche in Google Scholar PubMed PubMed Central
16. Wells, GA, Shea, B, O’Connell, D, Robertson, J, Peterson, J, Welch, V, et al.. The Newcastle-Ottawa scale (NOS) for assessing the quality of nonrandomized studies in meta-analysis 2014. http://www.evidencebasedpublichealth.de/download/Newcastle_Ottowa_Scale_Pope_Bruce.pdf.Suche in Google Scholar
17. Brakedal, B, Tzoulis, C, Tysnes, OB, Haugarvoll, K. NSAID use is not associated with Parkinson’s disease incidence: a norwegian prescription database study. PLoS One 2021;16:e0256602. https://doi.org/10.1371/journal.pone.0256602.Suche in Google Scholar PubMed PubMed Central
18. Altman, DG. Practical statistics for medical research. Boca Raton, Fla, United States: Chapman and Hall/CRC; 1990.Suche in Google Scholar
19. Maclagan, LC, Visanji, NP, Cheng, Y, Tadrous, M, Lacoste, AMB, Kalia, LV, et al.. Identifying drugs with disease-modifying potential in Parkinson’s disease using artificial intelligence and pharmacoepidemiology. Pharmacoepidemiol Drug Saf 2020;29:864–72. https://doi.org/10.1002/pds.5015.Suche in Google Scholar PubMed
20. Higgins, JPT. Measuring inconsistency in meta-analyses. BMJ 2003;327:557–60. https://doi.org/10.1136/bmj.327.7414.557.Suche in Google Scholar PubMed PubMed Central
21. Higgins, JP. Higgins, JP, Green, S, editors. Cochrane handbook for systematic reviews of interventions: cochrane book series, 1st ed. Hoboken, New Jersey, U.S.: Wiley; 2008.10.1002/9780470712184Suche in Google Scholar
22. Rugbjerg, K, Friis, S, Jørgensen, TL, Ritz, B, Korbo, L, Olsen, JH. Risk for Parkinson’s disease among patients with osteoarthritis: a Danish cohort study. Mov Disord 2010;25:2355–60. https://doi.org/10.1002/mds.23274.Suche in Google Scholar PubMed PubMed Central
23. Becker, C, Jick, SS, Meier, CR. NSAID use and risk of Parkinson disease: a population-based case-control study: NSAID use and risk of Parkinson disease. Eur J Neurol 2011;18:1336–42. https://doi.org/10.1111/j.1468-1331.2011.03399.x.Suche in Google Scholar PubMed
24. Bower, JH, Maraganore, DM, Peterson, BJ, Ahlskog, JE, Rocca, WA. Immunologic diseases, anti-inflammatory drugs, and Parkinson disease: a case-control study. Neurology 2006;67:494–6. https://doi.org/10.1212/01.wnl.0000227906.99570.cc.Suche in Google Scholar PubMed
25. Driver, JA, Logroscino, G, Lu, L, Gaziano, JM, Kurth, T. Use of non-steroidal anti-inflammatory drugs and risk of Parkinson’s disease: nested case-control study. BMJ 2011;342:d198–8. https://doi.org/10.1136/bmj.d198.Suche in Google Scholar PubMed PubMed Central
26. Etminan, M, Suissa, S. NSAID use and the risk of Parkinsons disease. Curr Drug Saf 2006;1:223–5. https://doi.org/10.2174/157488606777934404.Suche in Google Scholar PubMed
27. Hancock, DB, Martin, ER, Stajich, JM, Jewett, R, Stacy, MA, Scott, BL, et al.. Smoking, caffeine, and nonsteroidal anti-inflammatory drugs in families with Parkinson disease. Arch Neurol 2007;64:576. https://doi.org/10.1001/archneur.64.4.576.Suche in Google Scholar PubMed
28. Hernán, MA, Logroscino, G, Rodríguez, LAG. Nonsteroidal anti-inflammatory drugs and the incidence of Parkinson disease. Neurology 2006;66:1097–9. https://doi.org/10.1212/01.wnl.0000204446.82823.28.Suche in Google Scholar PubMed
29. Koponen, M, Paakinaho, A, Lin, J, Hartikainen, S, Tolppanen, AM. Identification of drugs associated with lower risk of Parkinson’s disease using a systematic screening approach in a nationwide nested case–control study. Clin Epidemiol 2022;14:1217–27. https://doi.org/10.2147/CLEP.S381289.Suche in Google Scholar PubMed PubMed Central
30. Manthripragada, AD, Schernhammer, ES, Qiu, J, Friis, S, Wermuth, L, Olsen, JH, et al.. Non-steroidal anti-inflammatory drug use and the risk of Parkinson’s disease. Neuroepidemiology 2011;36:155–61. https://doi.org/10.1159/000325653.Suche in Google Scholar PubMed PubMed Central
31. Powers, KM, Kay, DM, Factor, SA, Zabetian, CP, Higgins, DS, Samii, A, et al.. Combined effects of smoking, coffee, and NSAIDs on Parkinson’s disease risk. Mov Disord 2008;23:88–95. https://doi.org/10.1002/mds.21782.Suche in Google Scholar PubMed
32. Racette, BA, Gross, A, Vouri, SM, Camacho-Soto, A, Willis, AW, Searles Nielsen, S. Immunosuppressants and risk of Parkinson disease. Ann Clin Transl Neurol 2018;5:870–5. https://doi.org/10.1002/acn3.580.Suche in Google Scholar PubMed PubMed Central
33. Song, Y, Racette, BA, Camacho-Soto, A, Searles Nielsen, S. Biologic targets of prescription medications and risk of neurodegenerative disease in United States medicare beneficiaries. PLoS One 2023;18:e0285011. https://doi.org/10.1371/journal.pone.0285011.Suche in Google Scholar PubMed PubMed Central
34. Ton, TG, Heckbert, SR, Longstreth, WT, Rossing, MA, Kukull, WA, Franklin, GM, et al.. Nonsteroidal anti-inflammatory drugs and risk of Parkinson’s disease. Mov Disord 2006;21:964–9. https://doi.org/10.1002/mds.20856.Suche in Google Scholar PubMed
35. Wahner, AD, Bronstein, JM, Bordelon, YM, Ritz, B. Nonsteroidal anti-inflammatory drugs may protect against Parkinson disease. Neurology 2007;69:1836–42. https://doi.org/10.1212/01.wnl.0000279519.99344.ad.Suche in Google Scholar PubMed
36. Bornebroek, M, De Lau, LML, Haag, MDM, Koudstaal, PJ, Hofman, A, Stricker, BHC, et al.. Nonsteroidal anti-inflammatory drugs and the risk of Parkinson disease. Neuroepidemiology 2007;28:193–6. https://doi.org/10.1159/000108110.Suche in Google Scholar PubMed
37. Chen, H, Zhang, SM, Hernán, MA, Schwarzschild, MA, Willett, WC, Colditz, GA, et al.. Nonsteroidal anti-inflammatory drugs and the risk of Parkinson disease. Arch Neurol 2003;60:1059. https://doi.org/10.1001/archneur.60.8.1059.Suche in Google Scholar PubMed
38. Chen, H, Jacobs, E, Schwarzschild, MA, McCullough, ML, Calle, EE, Thun, MJ, et al.. Nonsteroidal antiinflammatory drug use and the risk for Parkinson’s disease. Ann Neurol 2005;58:963–7. https://doi.org/10.1002/ana.20682.Suche in Google Scholar PubMed
39. Etminan, M, Carleton, BC, Samii, A. Non-steroidal anti-inflammatory drug use and the risk of Parkinson disease: a retrospective cohort study. J Clin Neurosci 2008;15:576–7. https://doi.org/10.1016/j.jocn.2007.02.095.Suche in Google Scholar PubMed
40. Gao, X, Chen, H, Schwarzschild, MA, Ascherio, A. Use of ibuprofen and risk of Parkinson disease. Neurology 2011;76:863–9. https://doi.org/10.1212/WNL.0b013e31820f2d79.Suche in Google Scholar PubMed PubMed Central
41. Lin, CH, Wu, RM, Chang, HY, Chiang, YT, Lin, HH. Preceding pain symptoms and Parkinson’s disease: a nationwide population-based cohort study. Eur J Neurol 2013;201398–404. https://doi.org/10.1111/ene.12197.Suche in Google Scholar PubMed
42. Park, S, Kim, J, Chun, J, Han, K, Soh, H, Kang, EA, et al.. Patients with inflammatory bowel disease are at an increased risk of Parkinson’s disease: a South Korean nationwide population-based study. J Clin Med 2019;8:1191. https://doi.org/10.3390/jcm8081191.Suche in Google Scholar PubMed PubMed Central
43. Peter, I, Dubinsky, M, Bressman, S, Park, A, Lu, C, Chen, N, et al.. Anti-tumor necrosis factor therapy and incidence of Parkinson disease among patients with inflammatory bowel disease. JAMA Neurol 2018;75:939. https://doi.org/10.1001/jamaneurol.2018.0605.Suche in Google Scholar PubMed PubMed Central
44. Yeh, FC, Chen, HC, Chou, YC, Lin, CL, Kao, CH, Lo, HY, et al.. Positive association of Parkinson’s disease with ankylosing spondylitis: a nationwide population-based study. J Transl Med 2020;18:455. https://doi.org/10.1186/s12967-020-02629-w.Suche in Google Scholar PubMed PubMed Central
45. Ong, CKS, Lirk, P, Tan, CH, Seymour, RA. An evidence-based update on nonsteroidal anti-inflammatory drugs. Clin Med Res 2007;5:19–34. https://doi.org/10.3121/cmr.2007.698.Suche in Google Scholar PubMed PubMed Central
46. Poly, TN, Islam, MM, Yang, HC, Li, YCJ. Non-steroidal anti-inflammatory drugs and risk of Parkinson’s disease in the elderly population: a meta-analysis. Eur J Clin Pharmacol 2019;75:99–108. https://doi.org/10.1007/s00228-018-2561-y.Suche in Google Scholar PubMed
47. Rees, K, Stowe, R, Patel, S, Ives, N, Breen, K, Clarke, CE, et al.. Non-steroidal anti-inflammatory drugs as disease-modifying agents for Parkinson’s disease: evidence from observational studies. Cochrane Database Syst Rev 2011;CD008454. https://doi.org/10.1002/14651858.CD008454.pub2.Suche in Google Scholar PubMed
48. Ren, L, Yi, J, Yang, J, Li, P, Cheng, X, Mao, P. Nonsteroidal anti-inflammatory drugs use and risk of Parkinson disease: a dose–response meta-analysis. Medicine 2018;97:e12172. https://doi.org/10.1097/MD.0000000000012172.Suche in Google Scholar PubMed PubMed Central
49. Samii, A, Etminan, M, Wiens, MO, Jafari, S. NSAID use and the risk of Parkinson’s disease: systematic review and meta-analysis of observational studies. Drugs Aging 2009;26:769–79. https://doi.org/10.2165/11316780-000000000-00000.Suche in Google Scholar PubMed
50. Bullock, J, Rizvi, SAA, Saleh, AM, Ahmed, SS, Do, DP, Ansari, RA, et al.. Rheumatoid arthritis: a brief overview of the treatment. Med Princ Pract 2018;27:501–7. https://doi.org/10.1159/000493390.Suche in Google Scholar PubMed PubMed Central
51. Samii, A, Nutt, JG, Ransom, BR. Parkinson’s disease. Lancet 2004;363:1783–93. https://doi.org/10.1016/S0140-6736(04)16305-8.Suche in Google Scholar PubMed
© 2025 the author(s), published by De Gruyter, Berlin/Boston
This work is licensed under the Creative Commons Attribution 4.0 International License.
Artikel in diesem Heft
- Frontmatter
- Review Articles
- Oligonucleotide therapeutics for neurodegenerative diseases
- Rheumatoid arthritis drugs and the risk of Parkinson’s disease – a meta-analysis
- Research Articles
- HIV-1 infection facilitates Alzheimer’s disease pathology in humanized APP knock-in immunodeficient mice
- Neurovirulent and non-neurovirulent strains of HIV-1 and their Tat proteins induce differential cytokine-chemokine profiles
- Cannabis use is associated with a lower likelihood of presence of HIV drug resistance mutations in a retrospective cohort of adults with HIV
- Sex dependent correlation of spleen atrophy and behavior deficits induced by binge treatment with ethanol in rodent models
- Brief Reports
- The 28th Scientific Conference of the Society on NeuroImmune Pharmacology: Charleston, SC – March 10-13, 2024
- The 29th Scientific Conference of the Society on NeuroImmune Pharmacology in Omaha, NE, June 8–12, 2025