A novel pressurized operando battery cell for laboratory X-ray computed tomography
-
Luca Weckelmann
 ,
Krzysztof Dzieciol
,
Krzysztof Dzieciol
 ,
Christoph König
,
Christoph König

Abstract
Battery research relies on microscopy techniques for their microstructure characterizations and operando mechanism investigations. Such techniques include scanning electron microscopy (SEM) or X-ray computed tomography (XCT). The latter one plays a special role due to its ability to visualize a sample or even a whole cell completely in three dimensions. Additionally, imaging is conducted without destructing the investigated sample enabling the possibility of operando measurements. Therefore, XCT advances to a highly valuable method for investigating battery components and interfaces in the pristine, intermediate and post-mortem state or while operating the battery. Despite the evident advantages, XCT of certain battery types such as lithium metal are challenging due to the combination of low and high attenuating materials and air sensitive elements. This work presents the development of a pressurized operando battery cell for laboratory X-ray computed tomography. The developed cell makes the investigation of air sensitive and for XCT challenging battery systems possible. It is resistant to various chemicals and air-tight, thus suitable for different battery types. A dynamic sealing via a metal bellow allows to set and change the stack pressure during operation and after assembly, respectively. The design is optimized for maintaining a high photon flux without neglecting a reliable long-term sealing and practical handling. Initial measurements of a symmetric lithium metal cell with hybrid solid electrolyte demonstrate the capabilities of the developed cell holder.
1 Introduction
Owing to the two key properties, i.e. non-destructivity and three-dimensionality, micro X-ray computed tomography (µXCT) and nano X-ray computed tomography (nXCT) represent valuable microscopy methods for battery research [1], [2], [3]. For all components of a battery cell – typically consisting of current collectors, an anode, a cathode, a separator, and an electrolyte – µXCT can provide valuable insights into the microstructural condition, such as the state of interfaces or pores. Of particular interest is the evolution of these structures over time. Consequently, operando measurements are among the most informative yet demanding. This is because they often require specialized cells or sample holders to keep the sample under operation but eliminate effects from environment or even the characterization sources. Here the complexity of the cell is not defined only by the system under investigation, but also by the requirements of the imaging technique.
The physical and chemical nature of the investigated materials decide about the degree of complexity of the suitable cell design for µXCT. For instance, batteries which are using highly absorbing elements like zinc in zinc-air batteries can be scanned with simplistic customized cells [4]. Likewise the investigation of commercially available cells with lithium nickel manganese cobalt oxides as the cathode, graphite as the anode and organic liquid as the electrolyte can be conducted directly inside the industrial cylindrical cell [5]. Conversely, the measurement of next generation batteries with lithium metal as the anode, i.e. lithium metal batteries, is challenging due to the fact of almost invisible lithium in combination with highly absorbing cell and housing parts. Because of the low atomic number (ZLi = 3) and the low density (0.53 g cm−3 at 20 °C) of lithium, the interaction with X-ray photons is limited. To overcome this issue, a phase contrast mode instead of absorption-based scans can be utilized [6], [7], [8]. Here, the phase shift of the electromagnetic waves due to different propagation velocities in different media causing interference that in turn results in an improved contrast of the interfaces between different matters. However, this mode requires larger distances from the X-ray source to the detector leading to a loss of photons and in consequence lower signal-to-nose ratio (SNR). In addition, copper, which is commonly used as the current collector for lithium metal anode and therefore in direct contact with it, is highly absorbing due to its high atomic number (ZCu = 29) and density (8.935 g cm−3 at 20 °C). Stainless steel, also frequently used as current collector, is highly absorbing as well but less than copper due to its main components, i.e. iron (ZFe = 26) and chromium (ZCr = 24). The presence of high absorbing current collectors can lead to artifacts in the lithium anode region and further impair the visibility of lithium.
Yet, the lithium metal anode/electrolyte interface is of critical importance in a lithium metal battery due to lithium dendrite, dead lithium and solid electrolyte interface (SEI) formation. For this reason the interface is a key region of interest in battery research [9]. As itemized in Table 1, numerous publications focus on elucidating such interface related phenomena by using µXCT. To accomplish this, an XCT cell designed for cycling lithium metal batteries must possess several essential properties to achieve meaningful measurements. Consequently, the scans are usually performed with customized cells that are designed for cycling lithium metal cells either inside a laboratory µXCT scanner or at synchrotron facilities. Synchrotron X-ray computed tomography (SXCT) offers a significantly increased photon flux compared to lab-based µXCT, which enables notably reduced scanning time and improved image quality. Besides that, customized cells for synchrotron applications can exhibit large dimensions.
Overview of the key properties of customized operando µXCT battery cells for the investigations of lithium metal batteries. Note that one cell is not suitable for XCT (MTI) and one is not able to do electrochemical cycling (Deben). The diameter refers to the inner diameter of the cell and thus for the maximum sample diameter.
| Investigated materials | Housing material | Current collector material | Diameter/mm | Electrical contact | Force regulation and monitoring | Laboratory XCT | Reference |
|---|---|---|---|---|---|---|---|
| Li, LiAl, LSPS | PAI | Stainless steel | 1 | ✓ | x | x | [10] |
| Li, LPSCl, NMC | PAI | Stainless steel, aluminum | 3 | ✓ | x | x | [11] |
| Li, liquid electrolyte | PEK | Stainless steel, copper | 1.58 | ✓ | x | x | [12] |
| Li, LSPS | PEEK | Stainless steel | 2 | ✓ | x | x | [13] |
| Li, LPSCl | PC | Stainless steel | 2 | ✓ | x | ✓ | [14] |
| Commercial cell | PI, glassy carbon | – | >80 | x | ✓ | ✓ | Deben UK Ltd. |
| Commercial cell | PEEK | Stainless steel | 8–25 | ✓ | ✓ | x | MTI Corporation |
| Li, LPS | PAI | Graphite + carbon tape | 3 | ✓ | x | x | [15] |
| Li, Ti, liquid electrolyte | PAI | Lithium, copper ring | 2.5 | ✓ | x | ✓ | [16] |
| Li, LPS | PFA | Stainless steel | 3 | ✓ | x | x | [17] |
| Li, LPS | – | Stainless steel | 3 | ✓ | x | x | [18] |
| Li, InLi, LPSB | PEEK | Stainless steel | 1 | ✓ | x | ✓ | [19] |
| InLi, LGPS, NCM | – | Stainless steel | 1 | ✓ | ✓ | x | [20] |
| LSPB’ | PEEK | Stainless steel | – | ✓ | x | ✓ | [21] |
| Li, LLZTO/PEO | PEEK | Copper coated PEEK | 6 | ✓ | ✓ | ✓ | This work |
-
LSPS, Li10SnP2S12; NMC, LiNi0.8Co0.1Mn0.1O2; LPSCl, Li6PS5Cl; LPS, Li3PS4; LPSB, Li5.5PS4.5Br1.5; LGPS, Li10GeP2S12; NCM, LiNi0.33Co0.33Mn0.33O2; LPSB’, Li6PS5Br; LLZTO, Li6.6La3Zr1.6Ta0.4O12; PEO, polyethylene oxide; PAI, polyamide-imide; PEEK, polyether ether ketone; PEK, polyether ketone; PC, Polycarbonate; PI, polyimide; PFA, perfluoroalkoxy alkane.
While a stainless steel current collectors are mostly used in µXCT battery cells, Seitzman et al. utilize carbon (ZC = 6) based ones [15]. Those exhibit high X-ray transmission but react with lithium, possibly compromising the electrochemical behavior during cycling. Another approach in order to reduce the strong absorption of current collectors is the use of a copper ring instead of a solid copper disc [16].
Different polymers such as polyether ether ketone (PEEK), polyamide-imide or perfluoro alkoxy as the cell housing material can be found in literature (cf. Table 1). Here the X-ray transmission, chemical stability with lithium and electrolyte, and moisture impermeability are the decisive parameters. The cells listed in Table 1 have inner diameters of ≤3 mm. Those are significantly smaller than the diameters of typical batteries (≥10 mm) in research such as coin cells or Swagelok-type cells and make handling difficult. But they require a small field of view (FOV) to cover the whole cell and have a low attenuation.
More general but necessary properties of operando laboratory µXCT cells for lithium metal batteries include long term airtightness, chemical resistivity against lithium, compatibility with a wide range of electrolytes and electrode materials, electrical contacts for the electrodes and low absorbing and compact housing. Additionally, it is imperative that the cell remains static during the scan, and the assembly must be feasible within a glovebox that contains an inert atmosphere.
For solid-state electrolytes, the force applied to the battery cell stack is an important parameter, influencing the performance drastically [22], [23]. Therefore, adjusting the pressure in the range of MPa after assembly and monitoring the applied force during cycling and during the scans, is highly desirable. For this reason, Sakka et al. [20] developed a pressurized operando battery cell for SXCT where the pressure is adjusted and executed by a screw vertical to the battery stack.
The airtightness is by default realized via sealing rings. To improve the contrast between argon (inert atmosphere for battery assembly) and lithium metal, Kodama et al. [19] presented an operando XCT cell with the possibility to exchange the argon filled interspaces of the cell with other gases. Instead of argon (ZAr = 18), the cell was filled with the significantly higher absorbing xenon (ZXe = 54), resulting in an improved contrast between lithium and the xenon filled voids. But due to the high absorbing gas, the overall photon flux is drastically reduced. If the gas pressure can be controlled and monitored, the cell can be considered as pressurized operando cell. However, the isostatic pressure that could confine the creep mechanisms of materials is different from pressure raised from a uniaxial force that acts vertically to the battery stack. The term pressurized refers in this article to cells, which can apply a force along the battery stack direction resulting in elevated pressures in the MPa range within the assembly.
Even more challenging, but also of great interest, is the investigation of so called “anode-free” or in situ formed anode systems. In such systems, the electrolyte is in direct contact with the current collector on the anode side when charged. Due to the missing lithium metal between the electrolyte and the highly absorbing current collector, the visibility of plated lithium on the current collector (charging mechanisms) is challenging. This elevates the demands for a µXCT cell that can be used to investigate such batteries.
This works presents detailed information about the development of a pressurized operando battery cell for laboratory XCT. A comprehensive discussion is provided that analyzes the cell design and material selection in detail. As a demonstration of the XCT cell, an operando measurement with a hybrid solid electrolyte (HSE) based symmetric battery was conducted and analyzed.
2 Materials and methods
Figure 1 summarizes the key properties of the developed operando battery cell. Besides the necessary features such as air tightness, electrical contact and chemical resistivity, the following key characteristics are introduced: A uniaxial stack force can be applied and adjusted during the experiment since real-time monitoring is possible. The cell comprises a metal coated polymer spacer at the top and bottom of the battery stack which can also act directly as the current collector. Furthermore, the cell dimensions are minimized but taking ease of use into account. To ensure movement free measurement, a low center of gravity is implemented through a heavy base part and lightweight upper parts. In general, the selected materials are low attenuating but also characterized by excellent chemical resistivity, mechanical stability and gas impermeability. The subsequent sections will address the constructive realization of the introduced key properties, as well as the selection of materials and technical components.
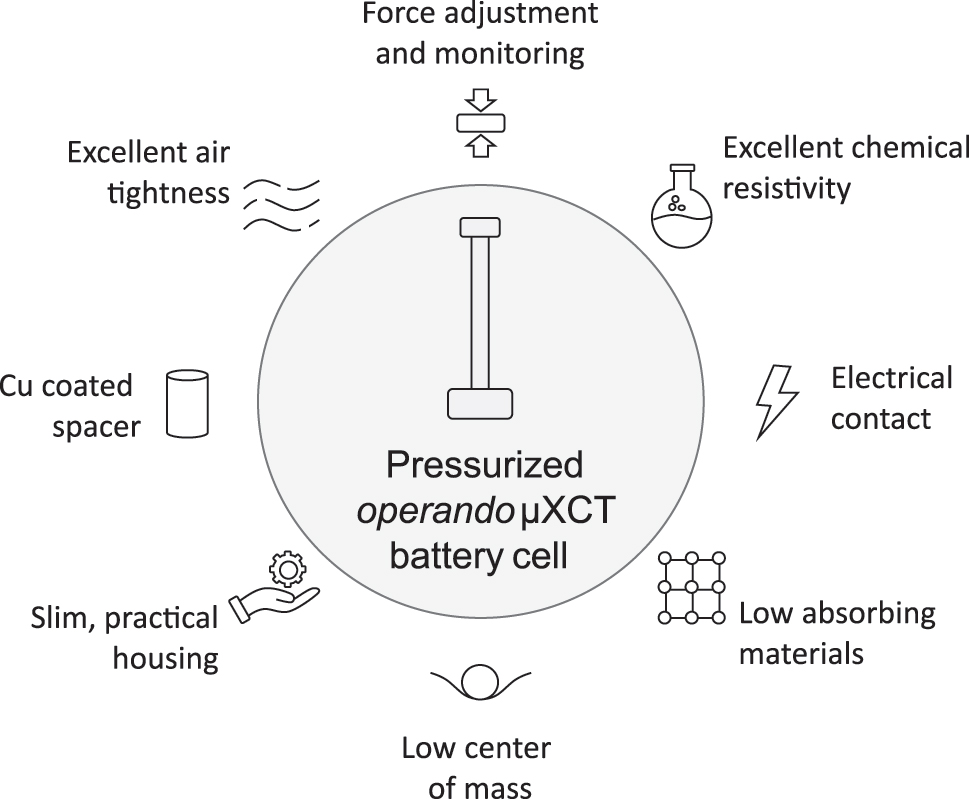
Illustration of the key properties of the developed pressurized operando battery cell for laboratory µXCT applications.
2.1 Cell design
The cell design is depicted in Figure 2 as a technical drawing of the cross section. Because of the disc shape of battery parts in coin and Swagelok-type cells, a cylindrical shape as the main body of the µXCT cell is the most obvious choice and follows the designs present in literature. Additionally, smooth geometry, free of sharps corner, helps to avoid streaking artifacts [24]. In addition, the cylindrical geometry enables a constant distance between source/cell and detector/cell while rotating the sample stage if detector and source are close to the housing. The main body consists of a hollow polymer rod (#10) with a tapering on the outside in the middle area, where the battery (#15) is located. This tapering results in reduction of material within the X-ray path, preserving a higher photon count on the detector. As demonstrated by the Beer–Lambert law (equation (1)), the length l alongside the absorption coefficient µ, is the primary factor influencing the attenuation of the initial beam intensity I0 resulting in a reduced intensity I. Consequently, a primary cell design guideline is to minimize the penetrated length through the housing.
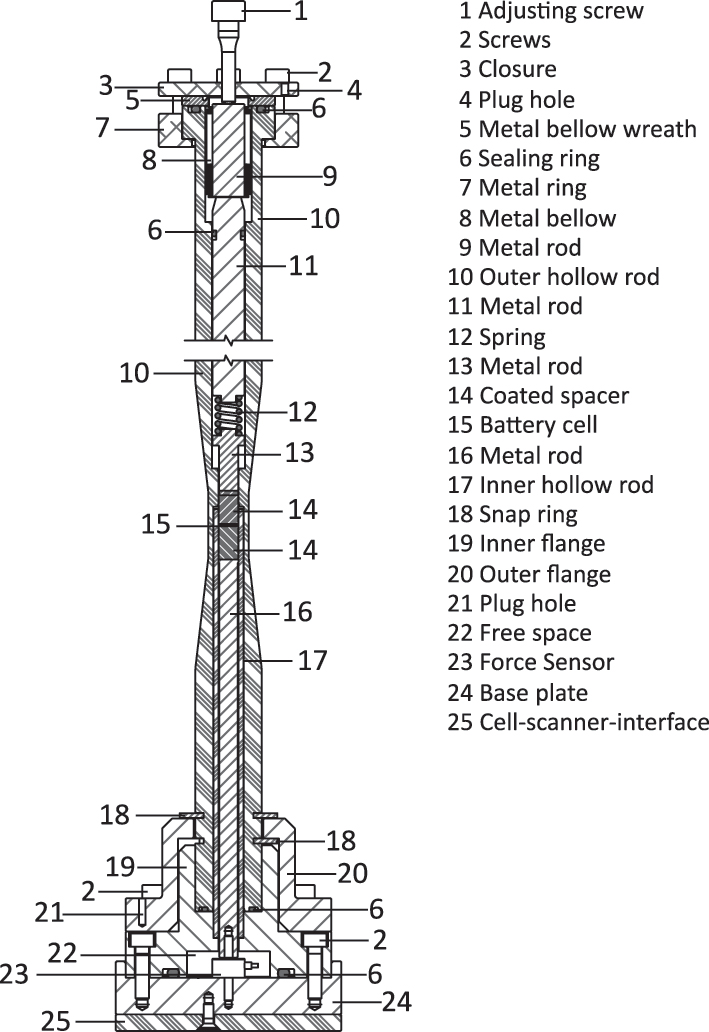
Technical drawing of the cross section of the pressurized operando battery cell with numeration (indicated with #) of the individual cell parts.
The height of the main cylindrical body (#10) is chosen to fit the used scanner (i.e. Xradia 620 Versa, Zeiss) but could be easily customized to fit other scanner geometries. In between the lower edge of the metal ring (#7) and the upper snap ring (#18), the source, which has an attached filter revolver, can be moved up to the outer hollow rod (#10). As a result, the source to sample distance is just limited by the upper diameter of the outer hollow rod (#10). A second, smaller hollow polymer rod (#17) is present internally. During assembly of the cell, the battery parts are placed inside the upper part of the inner hollow rod (#17). Once the battery parts are inside, the outer rod (#10) is slipped over the inner rod (#17) and flange-mounted (#18) to the base part of the cell holder. This procedure makes the assembly more practical and avoids a risky push-in of the battery parts deep inside a hollow rod. Another advantage of the inner hollow and outer rod is the ease of drying. The inner and outer rod can be disassembled from the cell and dried in a vacuum oven without the base parts including the force sensor. This is a mandatory measure due to water which might be trapped inside the cylinder wall, subsequently reacting with the cell components. The inner diameter of the inner hollow rod (#17) is 6 mm, i.e. sufficiently large for a well-founded comparison with typical cells but small enough to obtain sufficient spatial resolution. For electrical contact, two metal coated polymer spacers (#14) are used at both electrodes. The metal coating of polymer spacers ensures low X-ray attenuation and electronic conductivity concurrently. As shown in Figure 2, the polymer spacers (#14) create an adequate distance (1 cm) to the metal rods on the top (#13) and on the bottom (#16) to eliminate eventual metal artifacts that could affect the image quality. The upper metal rods (#13, #11, #9) and a spring (#12) conduct the current to the top of the cell, where an electrical connection via a plug hole (#4) can be established with an external controller, e.g. potentiostat. Just like the top metal rods, a bottom metal rod (#16) conducts the current via the housing of a force sensor (#23) to the bottom metal base parts (#19, #20, #24) of the cell. For electronic insulation, the base plate (#24) is attached to the scanner’s sample stage via non-conductive plate (#25). The spring (#12) maintains a constant contact between the inner cell parts and battery component at varying cell thicknesses while cycling. It can be easily exchanged with an alternative spring with different spring constants. Modifications of the spring geometries (e.g. spring height) for varying the spring constants are possible with adjustments of the metal rods (#11, #13).
A sealing concept with a focus on long time sealing against air was elaborated. This concept includes a static sealing on the bottom of the cell and a dynamic sealing at the top. The latter is required because of the mechanical operando force adjustment. A movable interface between the inside and outside of the cell transfers the outside adjusted force to the internal placed battery parts. Static sealings are realized via polymer O-rings (#6). Here, the inner flange (#19) and the outer hollow rod (#10) are provided with suitable grooves. A constant force is applied to the O-rings and guarantees a reliable static sealing. Polymer O-rings, however, are prone to be damaged during consistent movement. While large pressure is required to ensure the efficacy of the sealing rings, it can lead to microcracks caused by movement under higher force. Therefore, a customized metal bellow (#8) was used to facilitate the dynamic sealing. The metal bellow guarantees excellent sealing while allowing movement inside the cylinder and conducting electrical current simultaneously. It is in direct contact with the metal rod (#11) from the top and to the metal rod (#9) from the bottom, transferring the force to the battery components. In addition, the bellow (#8) possesses a welded wreath (#5) which is statically pressed onto the outer rod (#10) through an O-Ring to ensure the static sealing on top. The applied force on the battery stack can be adjusted by a screw with a fine thread (#1), which is in direct contact with a metal rod (#9). The force sensor (#23) is placed inside the inner flange (#19) and screwed to the base plate (#24) and the metal rod (#16). A hole is drilled inside the base plate (#24) enabling a connection to the analog-digital converter (ADC). Since the metal housing of the used force sensor (KM10z, ME-Meßsysteme) is shielded from the inner electronic parts, it can be used as electronic conductor without interference with the force measurement. The force sensor is placed on the bottom of the cell in order to achieve a low center of gravity and stabilize the cell against movement during measurement. With the selected force sensor up to 500 N can be measured which equals >17 MPa uniaxial pressure on the cell stack with a diameter of 6 mm. Once the lower part with the sensor is assembled, only the upper flange needs to be dismounted when preparing the cell for a new measurement.
2.2 Material selection
The evaluation of various elements and materials with respect to their X-ray attenuation is based on experimentally determined X-ray mass attenuation coefficients [25]. Those, most relevant for this work, are selected to illustrate in Figure 3a. This figure indicates an increase in the mass attenuation coefficient values with the ascendingly listed atomic numbers. Besides the atomic number, the electron density is influencing the attenuation coefficient as well and dominates at high energies. Nevertheless, the atomic number gives a first estimate about the magnitude of the attenuation and is therefore used as an indicator for evaluating the X-ray attenuation. fOther typical elements like hydrogen are less attenuating and thus lowering the attenuation compared to carbon. However, polymers can include elements with higher atomic numbers, such as fluorine (ZF = 9) in polytetrafluoroethylene (PTFE), shifting the attenuation coefficient to slightly higher values. As a result of a high or low attenuation coefficient, the relative beam intensity is significantly or hardly decreased, as shown for lithium and copper, which are both commonly present in lithium metal batteries (cf. Figure 3b).
![Figure 3:
Attenuation behavior of X-rays for different matters. a: X-ray linear attenuation coefficient µ for different elements (atomic numbers Z) and polymers at different energies at 25 °C and 1 atm [25]. Note that H, N, O and Ar are gaseous under those conditions. The density of C relates to graphite. For PEEK, the value is estimated based on the coefficient of the single elements in respect to their weight percentage. b: Calculated normalized beam intensity at 30 keV photons depending on the thickness for different elements based on the mass attenuation coefficients from a. Each subplot shows a different length scale.](/document/doi/10.1515/mim-2025-0010/asset/graphic/j_mim-2025-0010_fig_003.jpg)
Attenuation behavior of X-rays for different matters. a: X-ray linear attenuation coefficient µ for different elements (atomic numbers Z) and polymers at different energies at 25 °C and 1 atm [25]. Note that H, N, O and Ar are gaseous under those conditions. The density of C relates to graphite. For PEEK, the value is estimated based on the coefficient of the single elements in respect to their weight percentage. b: Calculated normalized beam intensity at 30 keV photons depending on the thickness for different elements based on the mass attenuation coefficients from a. Each subplot shows a different length scale.
Both polymer rods, the inner as well as the outer, are made of PEEK. PEEK offers, compared to other polymers reported in literature like PFA or polyamide-imide, a superior overall performance. It does not react with lithium, has a good chemical compatibility with lithium ion electrolytes, high moisture impermeability and its X-ray absorption is moderate (c.f. Figure 3) without being prone to radiation damage [26]. A detailed comparison between different polymers and their suitability for XCT measurements of lithium containing batteries can be found in the publication of Tan et al. [26]. Obviously, some polymers, e.g. polyimide exhibit higher X-ray transparency but come with a worse moisture impermeability. In addition to its excellent chemical stability, PEEK has a high tensile strength of about 100 MPa, thus it is mechanically suited for high pressure applications. Like the hollow cylinders, the coated spacers are made from PEEK as well. If the spacers are used as current collectors, the coating needs to be chemically stable with lithium. Moreover, since thinning the coating is beneficial to XCT image quality, the inevitable loss of conductance must be compensated for better intrinsic property, i.e. conductivity. This sets copper as an excellent choice for the coating material, with its electronic conductivity of 5.96 × 10⁷ S m−1 at 20 °C and good chemical stability against lithium. Compared to copper, stainless steel, for example type 301, is less absorbing but has a more than 40 times lower conductivity (1.4 × 10⁶ S m−1 at room temperature [27]). The copper layer is <1 µm thick and applied via sputter coating, a physical vapor deposition (PVD) technique.
Another coating is applied to the outer PEEK cylinder to enhance the air impermeability and sealing respectively. Gases such as water vapor (H2O) can penetrate through polymers leading to not negligible diffused amounts inside the cell in the case of long-term measurements (cf. Table 2). One way to significantly increase the penetration barrier without using high wall strength is to apply a thin metal coating to the polymer surface. This can be achieved by using PVD to coat all the PEEK parts that are in contact with the surrounding atmosphere. Here, it is important to consider the decreased photon flux due to the additional layer. Aluminum is suitable because of its low atomic number (ZAl = 13) and low gas permeability. It is reported that a layer of aluminum with a thickness of just 33 nm on a 12 µm polyethylene terephthalate film reduces the permeability to 4.1 % of the uncoated case for nitrogen, oxygen, carbon dioxide and water vapor [28]. Therefore, an intended coating of a layer of 100 nm of aluminum is increasing the air tightness drastically and enabling a long-term measurements. As shown in Figure 3b, even 1 µm thick aluminum is not strongly attenuating X-rays with an energy of 30 keV.
The permeation of gases through different plastics and elastomers. The permeability coefficients are given in cm3 mm m−2 d−1 atm−1 except for water vapor which is specified in g mm m−2 d−1.
| PI (Kapton®) | PAI resin | PEEK | EPDM | FKM (Viton®) | NBR (Krynac®) | PTFE | FEP | PFA | PC (Makrolon®) | |
|---|---|---|---|---|---|---|---|---|---|---|
| Reference | [29] | [29] | Victrex | [29] | [29] | [29] | [29] | [29] | [29] | [29] |
| Temperature | 23 °C | 30 °C | – | 0 °C | 24 °C (30 °C) | 23 °C | 20 °C (40 °C) | 25 °C (23 °C) | 25 °C (20 °C) | 23 °C |
| Gas | ||||||||||
| Air | – | – | – | 808 | 8.55 | 110 | – | – | – | – |
| Water vapor | 1.35 | – | 0.4 | – | – | 2.5–4.1 | 0.0045 (0.0174) | −(0.035) | −(0.002) | – |
| Nitrogen | 2 | 1.1–4.3 | 1.5 | 590 | 4.67 | 23 | 64 (129) | 125 | 100 | 16 |
| Oxygen | 10 | 4.3–22.8 | 7.6 | 1,735 | −(95) | 78 | 178 (316) | 290 | 335 | 81 |
| Carbon dioxide | 17 | 17.3–111.5 | 42 | 7,693 | −(508) | 583 | 487 (740) | 648 | 700 | 486 |
| Hydrogen | 100 | – | 140 | – | – | 460 | – | 853 | – | – |
| Helium | 163 | – | 160 | 1,360 | 771 | 475 | – | – | – | – |
The bottom metal parts, including the two flanges, are made of stainless steel while the top metal parts are made of less dense aluminum. This is done, again, to achieve a low center of mass, improving the overall mechanical stability. As a sealing material for O-rings, fluorinated polymer was chosen. Fluorinated polymers such as polytetrafluoroethylene or fluorinated ethylene propylene (FEP) are particularly resistant against water vapor compared to commonly used non-fluorinated ones, such as nitrile butadiene rubber (NBR) or ethylene propylene diene monomer (EPDM) (cf. Table 2). For example, NBR exhibits a more than 500 times larger permeability coefficient of water vapor at 23 °C compared to PTFE at 20 °C. In comparison, NBR has a lower oxygen permeability than PTFE, but only approximately two times. In addition to the selection of appropriate materials, the use of a sealing ring with a large cross section results in an increased penetration distance and thus an improved sealing barrier.
3 Results and discussion
3.1 Cell assembly
If used with moisture sensitive materials, the PEEK housing, including the outer and the inner hollow rod, needs to be dried prior assembly inside the glovebox. Since the cell is tested with lithium metal batteries, it is dried at 100 °C in vacuum for at least 24 h. After drying, the cell immediately transferred into an argon filled glovebox (H20 < 0.1 ppm, O2 < 0.1 ppm). The PEEK spacers are also dried before sputtering with copper which is conducted inside a glovebox with inert atmosphere. Note that the presented cell is not coated with aluminum, since no long-term operation was intended.
Figure 4a depicts the disassembled cell including all individual parts. The feedthrough for the force sensor cable, that is soldered to a 15-pin D-sub plug, is sealed with resin-based glue (Figure 4b). Only if the force sensor must be exchanged, a disassembly of the bottom part of the cell (Figure 4c) is necessary, otherwise (for sample exchange) it can remain assembled. Prior to filling the cell with battery components, the cell parts are transferred into the glovebox. Once the inner hollow rod (#17) is slipped over the metal rod (#16) and one spacer is placed within the hollow rod, the battery components can be placed inside, and the second spacer is placed on top of the battery components (Figure 4d). The final closing of the cell is done by slipping the outer rod (#10) with the attached top parts (#6, #7, #8, #9, #11, #12, #13) and outer flange (#18, #20) over the inner hollow rod (#17).
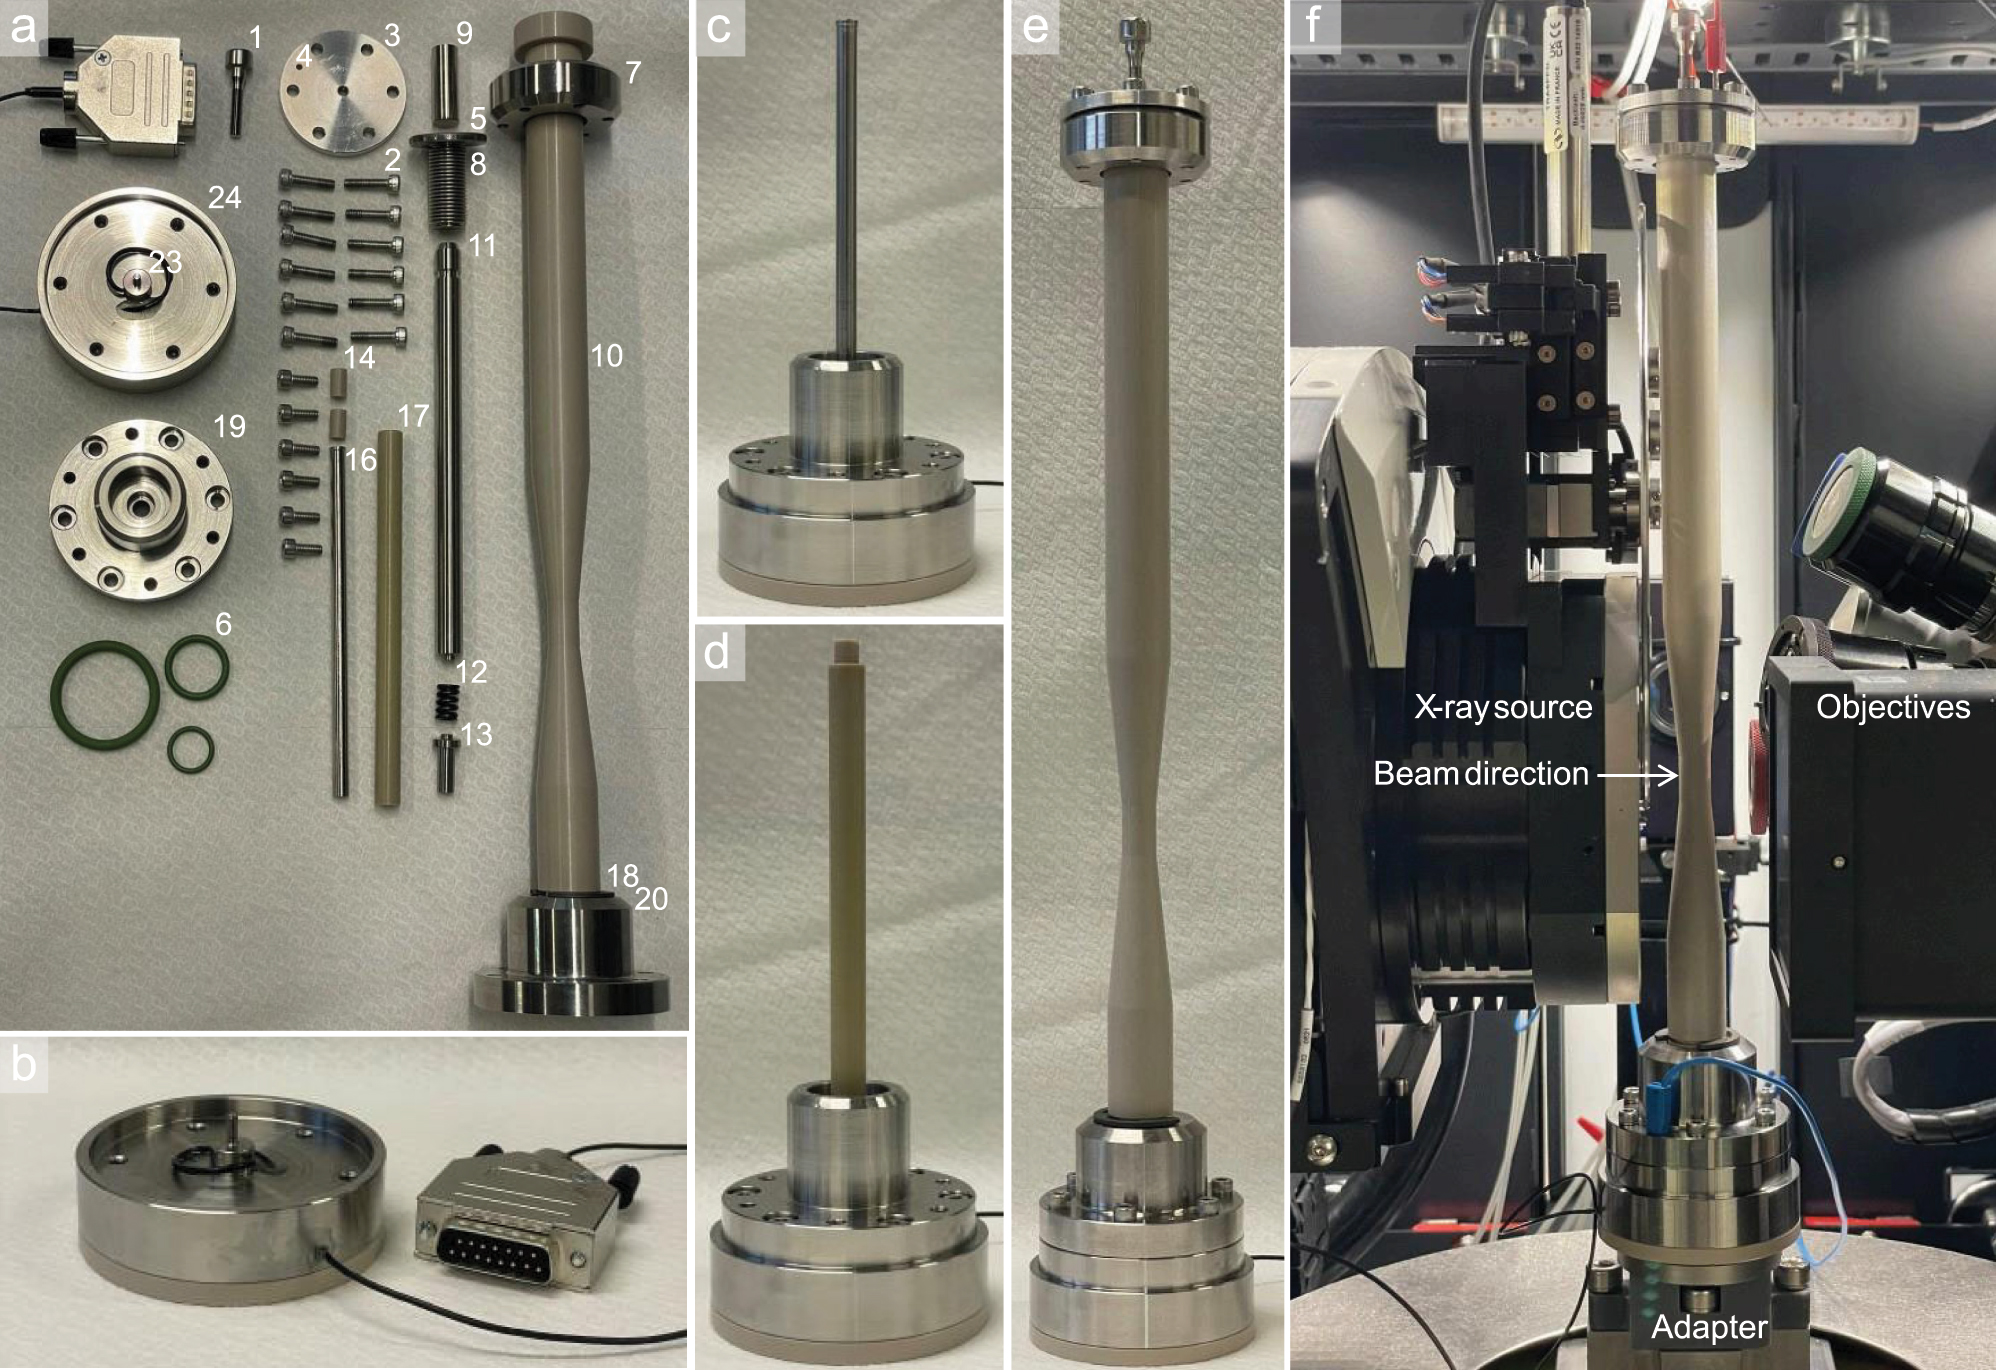
Images of the manufactured pressurized operando battery cell. a: Completely disassembled into its individual parts (except the force sensor and cell-scanner interface plate (#25)). The numbering follows that from Figure 2. b: Assembled base plate (#24), scanner-cell interface (#25) and force sensor (#23). The feedthroughs are closed with resin-based two component glue and the sensor cable is soldered to a 15-pin D-sub plug. c: Mounted metal rod and inner flange (#19). d: Mounted inner hollow rod (#17) and electrical contact spacers (#14). e: Completely assembled cell. f: Electrical connected (red and blue plug) and completely assembled cell inside the scanner.
Operating force is not applied (adjustment screw, #1) until an electrical connection for the sensor is established. An analog-to-digital converter (GSV-3USB 2 mV/V, ME-Meßsysteme) ensures a reliable control and measurement of the force sensor. It is placed outside the scanner and connected to a PC. The electrical potential is applied and measured with a potentiostat (SP-150e, Biologic). Figure 4f shows the assembled and connected cell inside the scanner. Source and objective are set close to the cell. Note the additional adapter that allows the vertical travel limits (Y-axis) of the stage motors to be offset.
The main cell components were fabricated in-house. Due to the cylindrical shapes of most metal and PEEK components, they could be manufactured via turning. For the hollow rods, drilling followed by turning was utilized. Due to the large length of the outer rod, this procedure presents a challenging endeavor. A rod that is not vertically symmetrical results in a varying sample-to-source and detector distance due to precession during rotation. Furthermore, the thin wall thickness at the tapered point makes machining and handling the cell challenging without risking breakage. Consequently, careful handling is essential during transfer and assembly. Due to its considerable length, the cell experiences significant leverage from the tapered end to the heavier top part, increasing its susceptibility to breaking if it falls over. Another consequence of this length is the need for sufficient space inside an oven for drying and within a transfer chamber for moving the cell in and out of a glovebox.
The cell parts are placed inside the inner hollow rod, ensuring proper placement of the single layers on top of each other. If the single cell parts can be placed and held on top of each other with just single pillars around the stack, the detected photon count could be further increased. Like for the tapered area, the wall thickness of the inner hollow rod could be further decreased to reduce attenuation. However, the cylinder walls help during assembly, which could be worsened by removing wall parts.
3.2 Operando measurement
To demonstrate the functionality and capabilities of the developed cell, a battery system with a solid hybrid electrolyte (HSE, ⌀ 6 mm) sandwiched between two lithium metal layers (⌀ 4 mm) is used. The electrolyte consists of a lithium-ion conductive garnet structured Li6.6La3Zr1.6Ta0.4O12 ceramic network which is infiltrated with polyethylene oxide (PEO). While the polymer is low absorbing, the ceramic parts exhibit strong X-ray attenuation due to incorporated heavy elements such as lanthanum (ZLa = 57) and tantalum (ZTa = 73). Plating and stripping during the whole experiment is done in just one direction, i.e. lithium is stripped from one side and plated on the other side. This procedure ensures sufficient amounts of plated and stripped lithium but also accelerated degradation of the battery components which then can be visualized. A symmetric battery cell is commonly cycled with constant current at symmetrically changing current directions. This results in stripped lithium on one side and plated lithium on the other side, with the process reversing when the current direction is changed. Since the plated and stripped amounts of lithium are usually <1 µm (homogeneous plating and stripping assumed with e.g. 0.1 mA cm−2 for 30 min), changes in porosity and lithium layer thickness are hardly visible with a resolution in the micrometer range. The operando measurement protocol consists of simultaneous force and potential measurements as well as µXCT scans (Figure 5). During the 3D scans, the open circuit voltage (OCV) of the cell is measured. If a potential for plating is applied between the electrodes, 2D images (radiograms) are taken every few minutes. The force is constantly measured and recorded. Note that while 3D imaging is done in situ, during the OCV periods, radiography and force monitoring are performed continuously, i.e. operando.
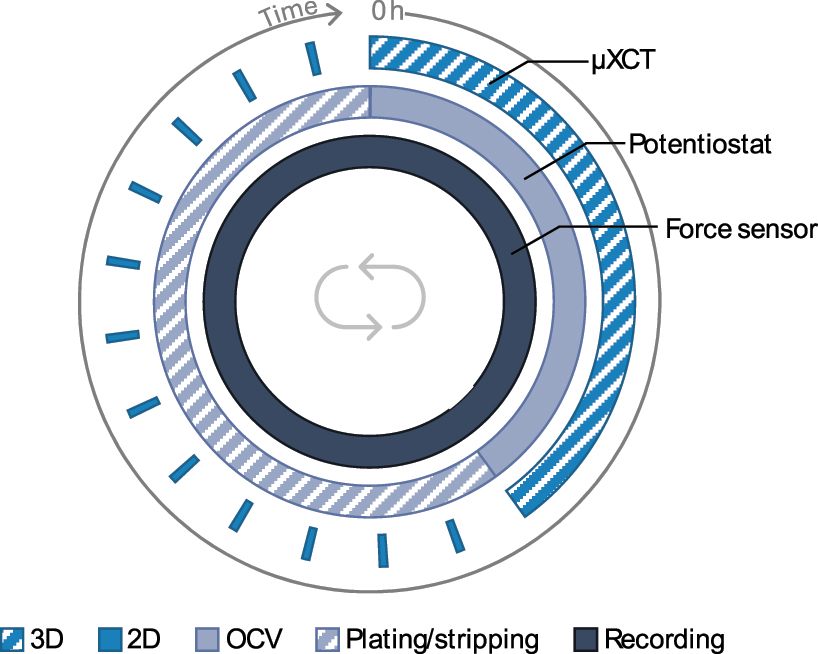
Illustration of a single operando cycle. First a 3D scan of the pristine battery cell is taken while the OCV and force are recorded. After the 3D scan, the plating/stripping process through an external applied potential is initiated and 2D radiograms are taken every few minutes until the process is finished. This procedure is repeated until sufficient data and scans are collected or the cell stops working. For setting up and controlling the automatic measurement an in-house developed script is used.
All 3D scans during the operando measurement were performed with the same settings. The X-ray source was positioned as close as possible to the cell to achieve a high photon count. A maximum energy of 70 keV was set with a low energy filter to reduce beam hardening. With an exposure time of 1.5 s, 1,601 projections and three images per projection, the total scanning time was 2.25 h. The chosen source-detector geometry with an 4× objective resulted in a voxel size of 3.4 µm and an FOV of 3.4 × 3.3 × 3.4 mm3. The OCV was set for a slightly longer duration than tomographic acquisition, i.e. 3 h, to ensure motion-free reconstruction. After 3 h, the plating process began, during which radiograms were collected every half hour (see also Supplementary material Video S1). To minimize the dose, the X-ray source was switched off between radiograms. For the first cycle a low current density of 2 μA cm−2 was applied, while for the subsequent cycles it was first set to 10 times and then to 20 times the initial current. The stacking force was measured and recorded throughout the whole measurement. It was approximately 22 N after assembly, resulting in an initial pressure of 1.75 MPa at the lithium/electrode interface. After 6 h of plating and a total time of 9 h, one operando cycle was completed and started from the beginning with a 3D scan.
Figure 6 shows the evolution over time of the measured potential, force, cross sections of the selected 3D scans and plated lithium thickness (see also Supplementary material Video S2). The cross sections with a focus on the highly attenuating ceramic filler are depicted in Figure 6a. Moving particles (detached from the ceramic network) could be monitored within the whole electrolyte layer. As Figure 6a demonstrates, particles and agglomerations of ceramic fillers parts are appearing and disappearing within one cross section throughout the measurement. Mechanical compression of the entire battery stack can be seen in Figure 6b. While the initial distance between the two copper current collector layers is 305 µm, it decreases to 282 µm after nine plating cycles. Like the total stack distance, the thickness of the top lithium layer (measured from polymer interface to the copper layer) is decreased after nine plating cycles from initial 138 µm–125 µm. Due to the movement of ceramic particles, a reliable thickness measurement between the electrolyte and the lower current collector is not possible. Nevertheless, HSE/Li layer thickness change can be estimated as a difference between overall thickness change and consumed lithium at the top, i.e. 10 µm. The force monitoring (Figure 6c) shows an on average decreasing force until approximately 19.6 N after 60 h. Despite an overall decrease in force, local fluctuations occur that coincide with the plating cycles. As soon as the plating starts, the force increases and as soon the plating is stopped, the force decreases again.
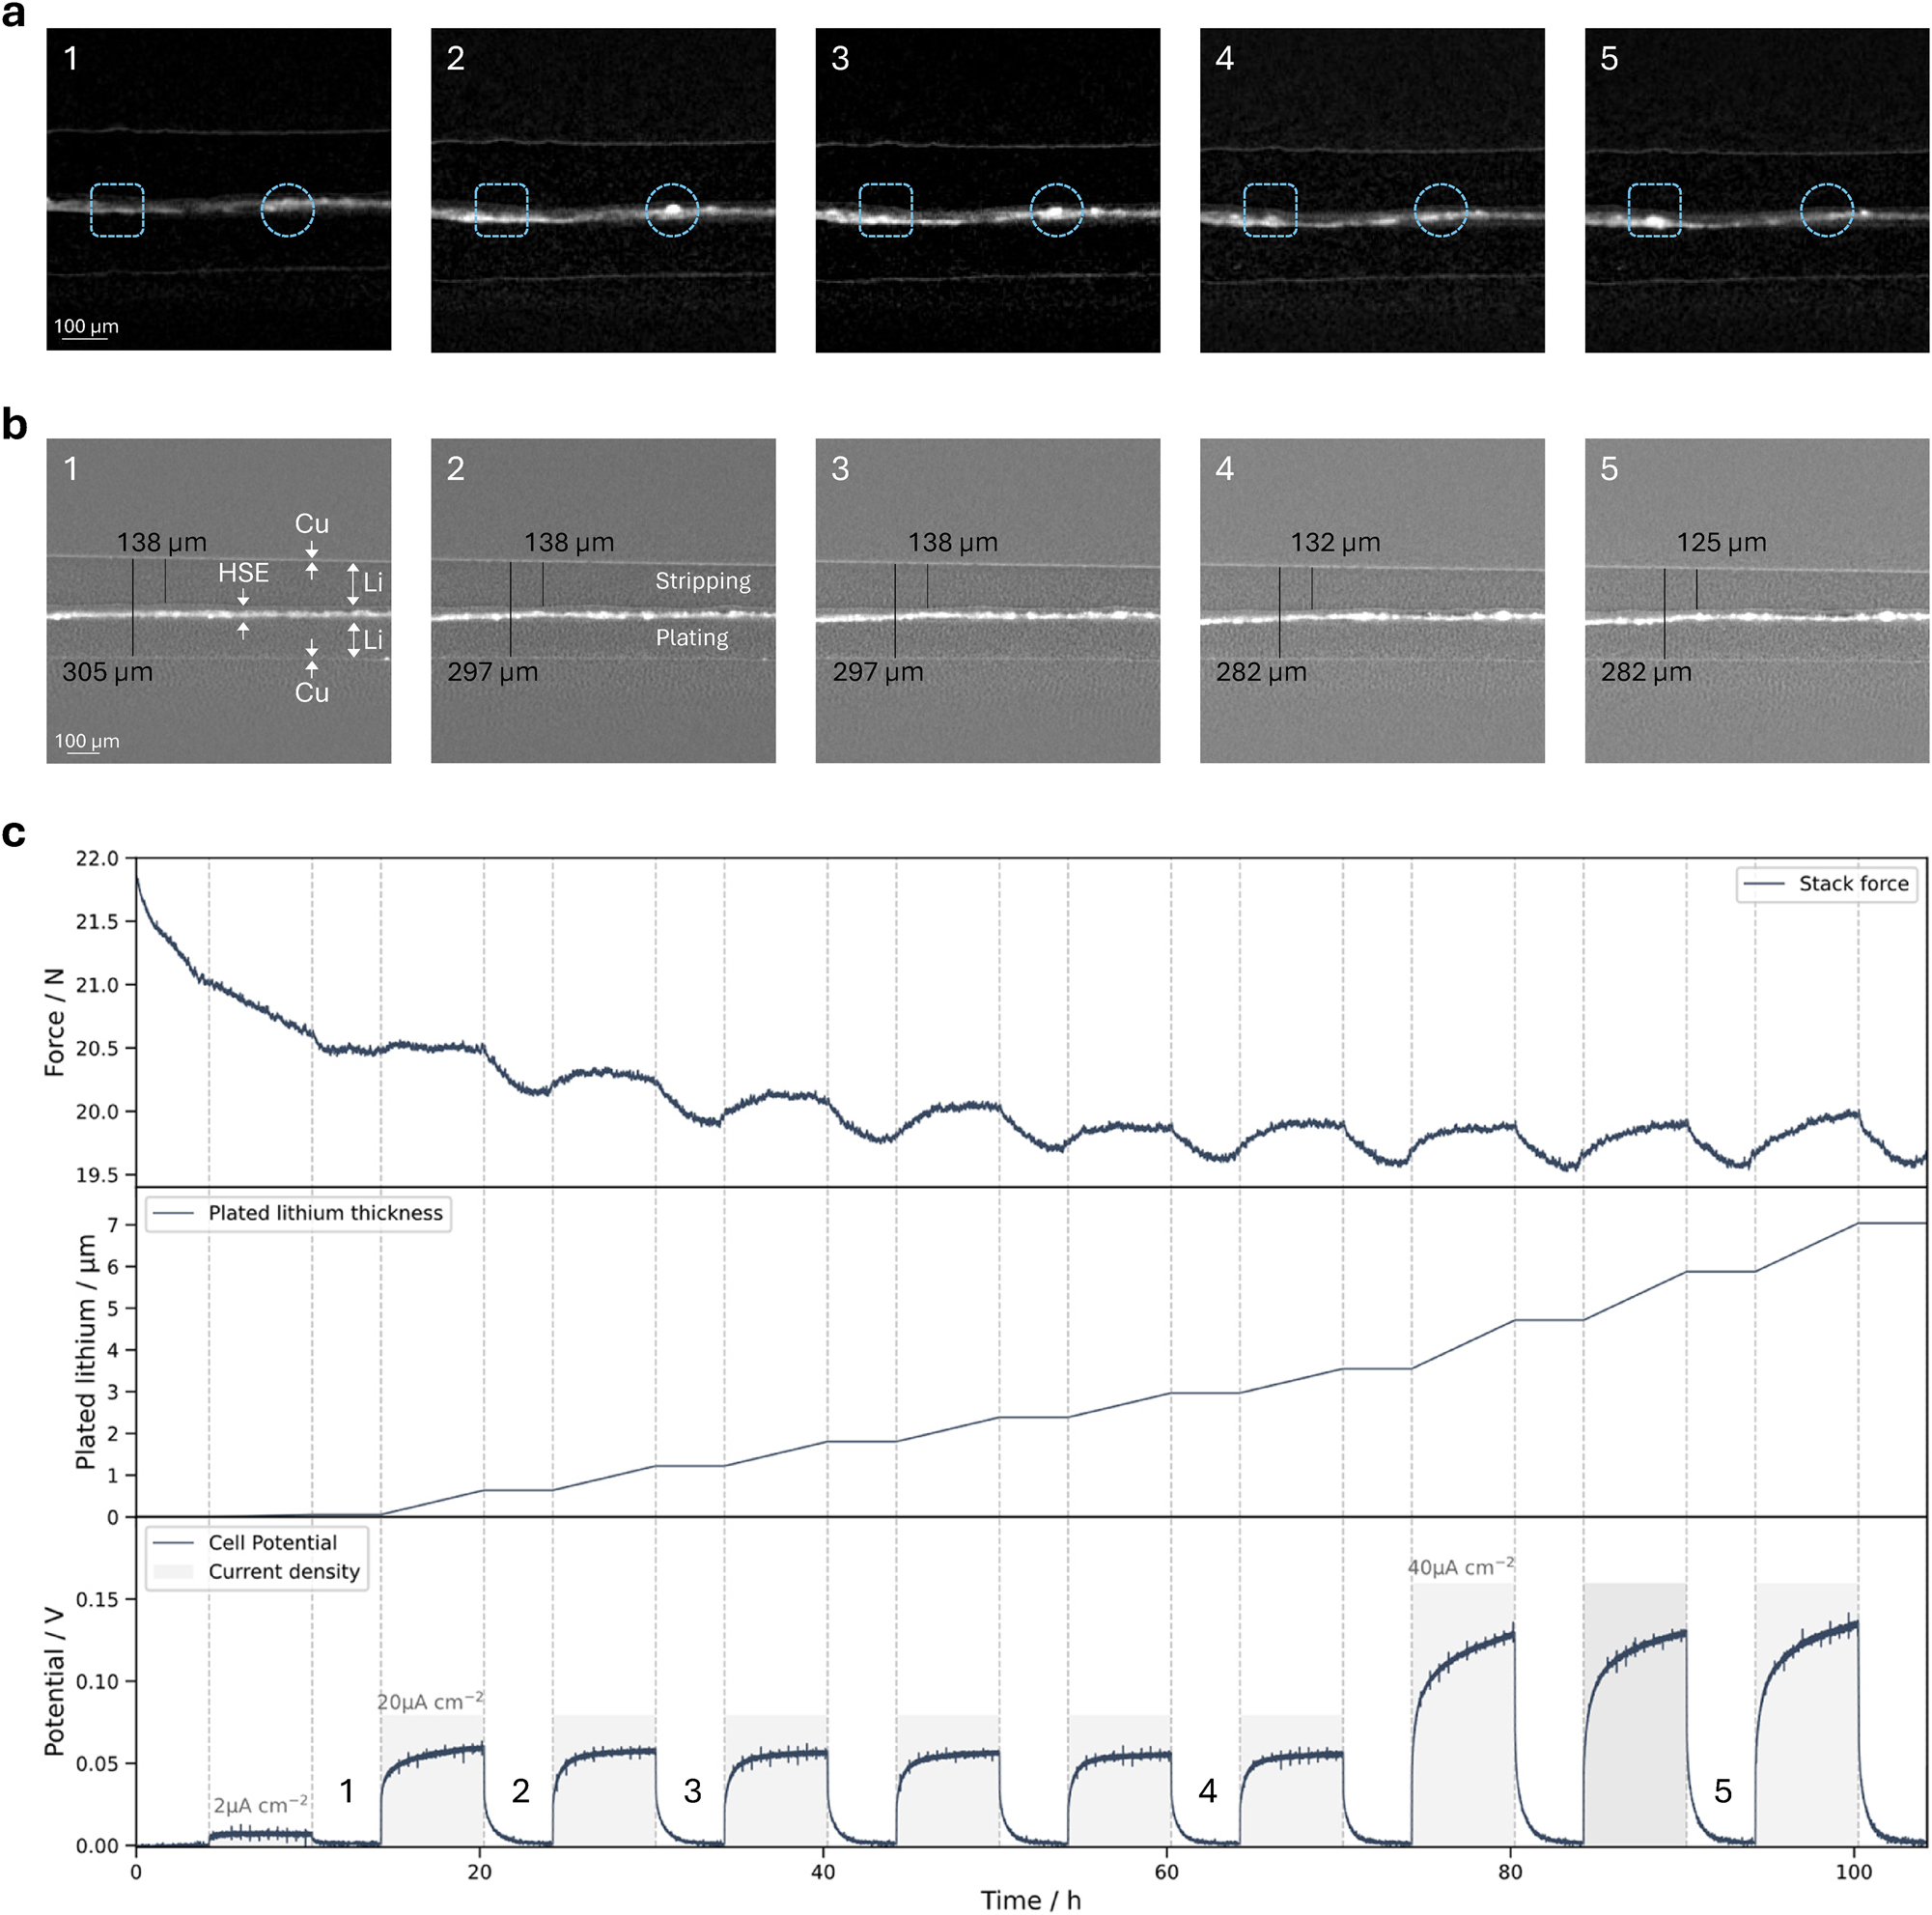
Operando unidirectional cycling results. a: 2D cross section images from the 3D scans after the 1st, 2nd, 3rd, 6th and 9th plating cycle (cf. 6c potential). Contrast is set to increase the visibility of highly attenuating particles. The blue rectangle and circle highlight the same position within different 3D scans indicating particle movement. b: 2D cross section images from the 3D scans for the same times as in 6a but at a different position with contrast focused on the differentiation between different layers. Marked and measured are the thicknesses from the top lithium layer and the whole battery layer (from Cu to Cu). c: Temporal progression of the measured stack force, plated lithium thickness and applied/measured potential. The dashed lines indicate the start and stop of each plating cycle. The plated lithium thickness is calculated based on the assumption of homogenous lithium deposition at the whole electrode surface.
The electronic potential curve follows the typical form of one half cycle during symmetric cycling with a hybrid solid electrolyte-based lithium metal battery [30], [31], [32]. First the potential exhibits a steep increase followed by a flattening slope. Due to the movement of the cell for reference images during cycling, the spikes in the potential are observed at fixed intervals. Within the 11th cycle the cell ran into a short circuit.
The demonstration of the cell’s performance with a hybrid solid electrolyte lithium metal battery proved to be challenging due to the highly attenuating ceramic filler inside the electrolyte. On the one hand, the ceramic parts make higher energy and longer exposure necessary to maintain a sufficient photon flux. On the other hand, high energy and longer exposure time can lead to lost contrast for the low absorbing areas that are present in the form of two lithium and the polymer layers. In addition to that, ceramic parts may cause beam hardening and scattering artifacts, deteriorating the image quality. The challenging nature of these ceramic parts was mainly evident at the lower part of the electrolyte/lithium interface which was blurred. Moreover, black spots appearing near particles were present from the first scan and constantly changing over time. Those spots are difficult to differentiate from possible voids, that can either form during cycling or also be present after assembly.
The constantly decreasing force in the first half of the measurement can be described by two aspects: One the one side electrolyte compression and creep and on the other side lithium creep. While shrinkage of the battery stack layer can be partially attributed to electrolyte compression, the main decrease is likely due to lithium creep (Figure 6b). Significant creep can occur at the initial pressure of 1.75 MPa as reported by e.g. Ding et al. [33]. The equilibrated force after approximately 60 h alternates between 19.6 N at the start and 19.9 N at the end of the 7th, 8th and 9th cycle. Assuming the initial electrode diameter of 4 mm results in 1.56 MPa and 1.58 MPa, respectively, but considering the post-mortem measured value of approximately 5 mm, an already significantly lowered pressures of ≤1 MPa are reached. The low-pressure value would explain the equilibrated force due to stopped lithium creep.
Assuming homogeneous lithium plating and stripping the force should be constant. One possible explanation for the fluctuations visible in Figure 6c is again a lithium creep as the low polarization voltage is not able to generate high enough electric field to polarize the hybrid electrolyte. The following behavior can be observed during each individual cycle. First, the force is increasing due to inhomogeneous plating and stripping which lead to an increased stack thickness and thus force caused by void formation. After a certain time of inhomogeneous plating, the lithium creep becomes crucial again and balances the void formation and eventually leads to a constant force. As soon as the lithium plating and stripping is stopped, only the creep mechanism takes place and results in a decreased force again until no more lithium creep is happening. The last force peak (cycle 10, Figure 6c) is higher than the previous peaks (likewise the potential peak), indicating even more inhomogeneous lithium plating and stripping compared to the previous cycles. Interestingly, this cycle is the last one before the failure of the battery. One might conclude that the increased force and potential peak is an indicator for severe void formation, leading to a drastically raised local current densities that in turn cause short circuits due to dendrite growth. Based on the spring constant, an evaluation of the void formation hypothesis can be evaluated. With the spring constant of the used spring (72.78 N mm−1) and the force difference (0.3 N), the height change is calculated to 4.12 µm. Homogeneous plating and stripping leads to 1.16 µm displaced lithium after 6 h with a current density of 40 μm cm−2. A by four times increased current density (160 μA cm−2) creates a 4.65 µm thick layer lithium. This in turn would account for a total loss of 75 % contact area between electrode and electrolyte (four-time increased current density can be achieved due to 75 % less area).
The observed ceramic particle movement could be attributed to mechanical stress caused by the compression of the electrolyte and the lithium creep. Based on the three-dimensional reconstructions, the particles’ movement can be tracked. Here, two-dimensional slicing is performed within the plane of the battery stack and orthogonal to it (Figure 7a), enabling an in-depth, layer-by-layer analysis. As shown exemplary for one ceramic particle in Figure 7a and b, the particles predominantly move from the inner regions toward the edges. However, it was also observed that the particles do not move radially. This could be attributed to the formation and growth of dendrites, which are too small to be detected by XCT with the used settings and investigated system but still induce localized mechanical stress. Alternatively, stress spikes might result from uneven surfaces, as observed with the current collectors. Manufactured by turning, the polymer spacers exhibit wavy surface. Additionally, the lithium electrodes and the electrolyte itself may exhibit unevenness.
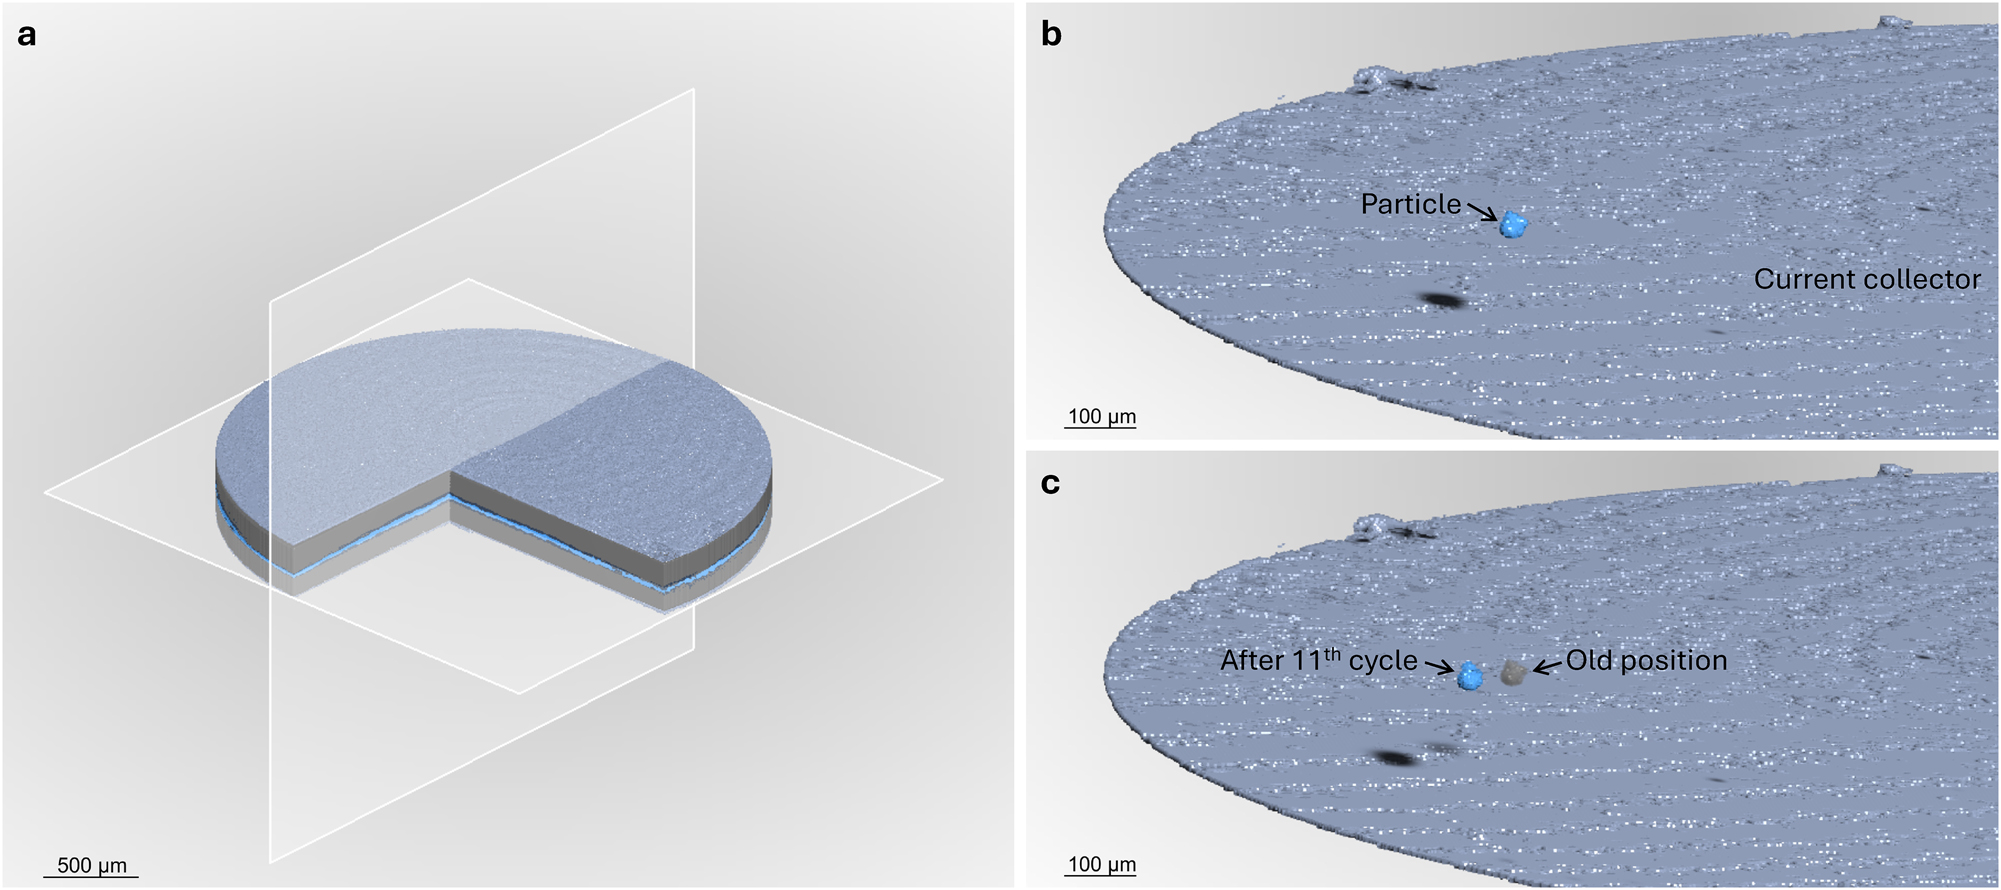
Three-dimensional renderings of the segmented battery. a: Segmentation of the stack after the first plating cycle. b: Arbitrarily selected particle (blue) and the bottom current collector (gray blue). c: The selected particle after 11th plating cycle (blue) and its old location (gray). Note that the top current collector, HSE and lithium layers are hidden. A light source is used to improve the 3D perspective. The black spots in a and b are caused by shadows of the particle and not part of the segmentation.
3.3 Post-mortem measurements
After the cell failure, the cycling was stopped and post-mortem scans with various settings were performed including scans with a high and low resolution. Since the operando measurement did not cover the whole battery stack, the low-resolution scan serves as an overview. With an 4× objective but changed source-sample-detector geometry, the FOV could be increased to 5.4 × 5.5 × 5.4 mm3 with a voxel size of 5.44 µm. As depicted in Figure 8a, the whole lithium layer is captured. While an interphase at the right edge is recognizable for both lithium layers, the right end can be just differentiated due to the enveloping electrolyte. Based on this interface, the electrolyte diameter is measured to approximately 5 mm. The part enveloped by the electrolyte is not considered.
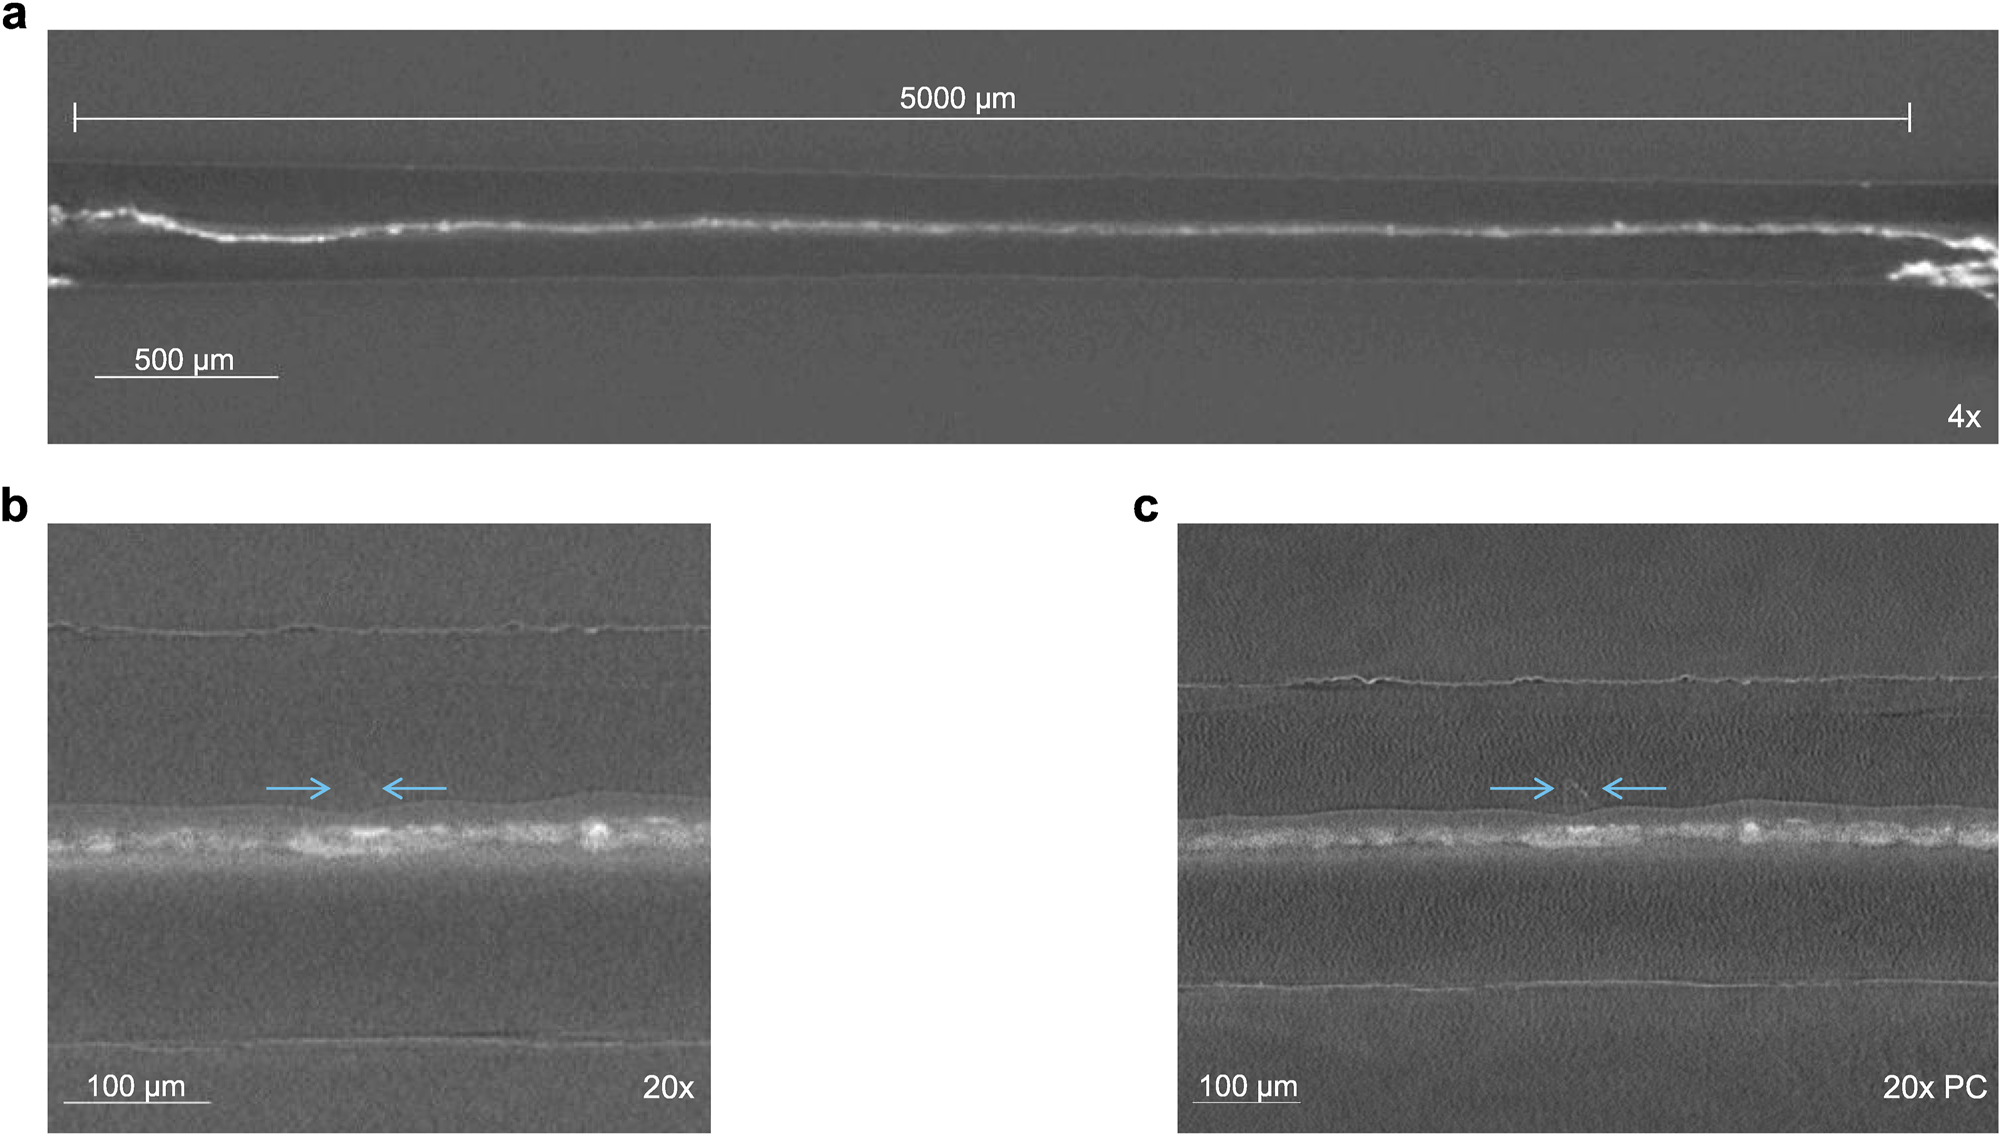
Post-mortem scans with different settings. a: Overview scans with a high FOV and low resolution with an 4× objective. b: High resolution absorption scan with 20× objectives. c: High resolution scan with 20× objective using propagation-based phase contrast geometry. The arrows highlight a structure which is not visible in absorption focused scans. Note that the magnifications in b and c are different.
It gets apparent that the electrolyte layer is distributed across the full width. On the edges, however, the electrolyte moved underneath the bottom lithium layer. The left edge exhibits a low amount of ceramic filler which indicates the altering of the electrolyte at the edges. In general, partially damaged electrolyte layers are observed primarily at the edges, while the electrolyte in the bulk appears visibly intact.
A high-resolution scan with a 20× objective and absorption contrast mode was performed (Figure 8b). Due to the low voxel size of 0.68 µm, smaller structures inside the electrolyte became visible and more distinguishable, respectively. Furthermore, the polymer layer on the top side of the electrolyte is clearly visible. Similar to the operando scans with a lower resolution, the interface between the bottom side of the and lithium is not resolvable. This is due to a thicker polymer layer on the top side of the electrolyte compared to the bottom side, which results in a greater proportion of highly attenuating particles on the bottom side, degrading the image quality at the interface.
Another scan was conducted using geometry promoting propagation-based phase contrast (Figure 8c). In this case, the source-detector distance and magnification were set according to work published by Dierks et al. [34]. The phase contrast-based scan reveals polygonal shaped structures inside both lithium layers, like the one shown in Figure 8c. Some of those structures weren’t or just rarely visible in the absorption scans. Both high-resolution images shown in Figure 8b and c, were post processed with an increased slice thickness averaging over 5 pixels to reduce noise.
The post-mortem scans reveal a homogeneous distributed electrolyte in the bulk but partially degraded at the edges. Both lithium layers seem to be enlarged over time. They were assembled with a diameter of 4 mm but appear >5 mm in diameter in the overview scan. This supports the assumption of significant lithium creep at the first half of the measurement. The hybrid electrolyte creep can be indicated by the creep underneath the lithium layer. Since the electrolyte was assembled with a diameter of 6 mm, filling the whole space, an enlargement to the sides cannot be measured.
With a scan time shorter than 2 h and a sufficient image quality, an overview scan with a large FOV could be also incorporated in the operando 3D scan. By contrast, propagation-based phase contrast scans with high magnification can reveal new interphases but come with high scanning time. Owing to the large sample to source and detector distances, the photon count is drastically reduced, worsening the SNR heavily without extended exposure. Nevertheless, high magnification scans with absorption and phase contrast are indispensable to study the battery microstructure on smaller scales.
4 Conclusion and outlook
A novel pressurized operando cell for laboratory X-ray tomography was developed. The cell is capable of cycling lithium metal batteries while continuously measuring 2D radiograms and stack force. Additional intermediate 3D scans enable the correlation of electrochemical and mechanical behavior with the three-dimensional microstructure of the cell components. Special components, such as the metal bellow, ensure a reliable long-term sealing while allowing operando monitoring of the stack force. Coated polymer spacers enable the investigation of layers near the current collector, including low-absorbing ones like lithium metal layers. Demonstrated with a hybrid solid electrolyte in a symmetric lithium metal battery, the cell could be successfully cycled. Although the used hybrid electrolyte turned out to be challenging due to its highly absorbing ceramic filler, useful insights into the coupled potential force behavior could be gained. Lower-absorbing materials, such as solid polymers, sulfide or liquid-based electrolytes, could enable even higher image quality and shorter exposure and thus measurement time.
Beside the laboratory µXCT, measurements with the cell can also be done at synchrotron facilities. The high photon flux of those facilities allows fast 3D scans and enhanced image quality. Since the cell is developed for laboratory XCT scanners, the cells’ dimensions are also suitable for the commonly large synchrotron measurements stands. Only the cell-scanner interface, specifically the base plate and electrical connections, may need modification.
Other potential applications for this cell include the measurement of air-sensitive samples since lithium metal was able to keep uncontaminated over long measuring time. In this case removing the inner hollow rod and attaching the sample to the metal rod improves the image quality. This enhancement is attributed to a reduction of material within the X-ray path, which increases the detected photon flux and thus the SNR. Another possible application is the mechanical testing, thanks to the compression screw and the force sensor. Apart from XCT applications, the cell could also be employed for other X-ray based measurements such as operando X-ray diffraction.
The cell can be further enhanced by incorporating a heating element, enabling measurements at elevated temperature. This facilitates cycling at higher current densities, accelerates operando measurements and supports the use of new battery materials typically cycled above room temperature. Additionally, the temperature dependence of microstructures could be investigated.
Funding source: Bundesministerium für Bildung und Forschung
Award Identifier / Grant number: LISI-2, 13XP0509A
Acknowledgments
We thank Heinz-Willi Firmenich for manufacturing the cell parts.
-
Research ethics: Not applicable.
-
Informed consent: Not applicable.
-
Author contributions: All authors have accepted responsibility for the entire content of this manuscript and approved its submission.
-
Use of Large Language Models, AI and Machine Learning Tools: A LLM was used to improve language.
-
Conflict of interest: The authors declare the following financial interests/personal relationships which may be considered as potential competing interests: Luca Weckelmann, Krzysztof Dzieciol, Christoph König, Chih-Long Tsai, Hermann Tempel and Rüdiger-A. Eichel have submitted a patent application (102024211849.4).
-
Research funding: This work was funded by the Federal Ministry of Education and Research Germany (BMBF) in the scope of the Lithium-Solid-Electrolyte Interfaces (2. Phase) project (grant no. 13XP0509A).
-
Data availability: Not applicable.
References
[1] F. Tang et al.., “Synchrotron X-ray tomography for rechargeable battery research: Fundamentals, setups and applications,” Small Methods, vol. 5, no. 9, 2021, Art. no. 9. https://doi.org/10.1002/smtd.202100557.Search in Google Scholar PubMed
[2] X. Zhang et al.., “Visualizing the future: Recent progress and challenges on advanced imaging characterization for all-solid-state batteries,” ACS Energy Lett., vol. 10, no. 1, 2025, pp. 496–525. https://doi.org/10.1021/acsenergylett.4c02476.Search in Google Scholar
[3] P. J. Withers et al.., “X-ray computed tomography,” Nat. Rev. Methods Primer, vol. 1, no. 1, 2021, pp. 1–21. https://doi.org/10.1038/s43586-021-00015-4.Search in Google Scholar
[4] K. Dzięcioł, Y. E. Durmus, H. Tempel, H. Kungl, A. Bauer, and R.-A. Eichel, “Laboratory X-ray computed tomography imaging protocol allowing the operando investigation of electrode material evolution in various environments,” iScience, vol. 26, no. 7, 2023, p. 107097. https://doi.org/10.1016/j.isci.2023.107097.Search in Google Scholar PubMed PubMed Central
[5] D. P. Finegan et al.., “In-operando high-speed tomography of lithium-ion batteries during thermal runaway,” Nat. Commun., vol. 6, no. 1, 2015, p. 6924. https://doi.org/10.1038/ncomms7924.Search in Google Scholar PubMed PubMed Central
[6] S. Dayani, H. Markötter, A. Schmidt, M. P. Widjaja, and G. Bruno, “Multi-level X-ray computed tomography (XCT) investigations of commercial lithium-ion batteries from cell to particle level,” J. Energy Storage, vol. 66, 2023, p. 107453. https://doi.org/10.1016/j.est.2023.107453.Search in Google Scholar
[7] D. S. Eastwood et al.., “The application of phase contrast X-ray techniques for imaging Li-ion battery electrodes,” Nucl. Instrum. Methods Phys. Res., Sect. B, vol. 324, no. Part A, pp. 118–123, 2014. https://doi.org/10.1016/j.nimb.2013.08.066.Search in Google Scholar
[8] S. Mayo and M. Endrizzi, “X-ray phase contrast methods,” in Handbook of Advanced Nondestructive Evaluation, N. Ida and N. Meyendorf, Eds., Cham: Springer International Publishing, 2019, pp. 1053–1093.10.1007/978-3-319-26553-7_54Search in Google Scholar
[9] L. Ma et al.., “Current challenges and progress in anode/electrolyte interfaces of all-solid-state lithium batteries,” eTransportation, vol. 20, 2024, p. 100312. https://doi.org/10.1016/j.etran.2024.100312.Search in Google Scholar
[10] F. Sun et al.., “Clarifying the electro-chemo-mechanical coupling in Li10SnP2S12 based all-solid-state batteries,” Adv. Energy Mater., vol. 12, no. 13, 2022, Art. no. 13. https://doi.org/10.1002/aenm.202103714.Search in Google Scholar
[11] Y. Zheng et al.., “Codependent failure mechanisms between cathode and anode in solid state lithium metal batteries: Mediated by uneven ion flux,” Sci. Bull., vol. 68, no. 8, 2023, Art. no. 8. https://doi.org/10.1016/j.scib.2023.03.021.Search in Google Scholar PubMed
[12] M. Sadd, S. Xiong, J. R. Bowen, F. Marone, and A. Matic, “Investigating microstructure evolution of lithium metal during plating and stripping via operando X-ray tomographic microscopy,” Nat. Commun., vol. 14, no. 1, 2023, Art. no. 1. https://doi.org/10.1038/s41467-023-36568-z.Search in Google Scholar PubMed PubMed Central
[13] J. A. Lewis et al.., “Linking void and interphase evolution to electrochemistry in solid-state batteries using operando X-ray tomography,” Nat. Mater., vol. 20, no. 4, 2021, Art. no. 4. https://doi.org/10.1038/s41563-020-00903-2.Search in Google Scholar PubMed
[14] J.-M. Doux et al.., “Stack pressure considerations for room-temperature all-solid-state lithium metal batteries,” Adv. Energy Mater., vol. 10, no. 1, 2020, Art. no. 1. https://doi.org/10.1002/aenm.201903253.Search in Google Scholar
[15] N. Seitzman, H. Guthrey, D. B. Sulas, H. A. S. Platt, M. Al-Jassim, and S. Pylypenko, “Toward all-solid-state lithium batteries: Three-dimensional visualization of lithium migration in β-Li3PS4 ceramic electrolyte,” J. Electrochem. Soc., vol. 165, no. 16, 2018, Art. no. 16. https://doi.org/10.1149/2.0301816jes.Search in Google Scholar
[16] F. Sun et al.., “Investigation of failure mechanisms in silicon based half cells during the first cycle by micro X-ray tomography and radiography,” J. Power Sources, vol. 321, 2016, pp. 174–184. https://doi.org/10.1016/j.jpowsour.2016.04.126.Search in Google Scholar
[17] S. Hao et al.., “Tracking lithium penetration in solid electrolytes in 3D by in-situ synchrotron X-ray computed tomography,” Nano Energy, vol. 82, 2021, p. 105744. https://doi.org/10.1016/j.nanoen.2021.105744.Search in Google Scholar
[18] J. Park et al.., “Unique Li deposition behavior in Li3PS4 solid electrolyte observed via operando X-ray computed tomography,” Chem. Commun., vol. 59, 2023, no. 50, Art. no. 50. https://doi.org/10.1039/D2CC05224E.Search in Google Scholar
[19] M. Kodama et al.., “X-ray computed tomography analysis of lithium deposition in all-solid-state lithium-metal batteries with carbon interlayers bonded through various processes,” J. Power Sources Adv., vol. 26, 2024, p. 100142. https://doi.org/10.1016/j.powera.2024.100142.Search in Google Scholar
[20] Y. Sakka et al.., “Pressure dependence on the three-dimensional structure of a composite electrode in an all-solid-state battery,” J. Mater. Chem. A, vol. 10, no. 31, 2022, Art. no. 31. https://doi.org/10.1039/D2TA02378D.Search in Google Scholar
[21] M. Kodama, S. Komiyama, A. Ohashi, N. Horikawa, K. Kawamura, and S. Hirai, “High-pressure in situ X-ray computed tomography and numerical simulation of sulfide solid electrolyte,” J. Power Sources, vol. 462, 2020, p. 228160. https://doi.org/10.1016/j.jpowsour.2020.228160.Search in Google Scholar
[22] X. Hu et al.., “External-pressure–electrochemistry coupling in solid-state lithium metal batteries,” Nat. Rev. Mater., vol. 9, no. 5, 2024, Art. no. 5. https://doi.org/10.1038/s41578-024-00669-y.Search in Google Scholar
[23] P. Roering, G. M. Overhoff, K. L. Liu, M. Winter, and G. Brunklaus, “External pressure in polymer-based lithium metal batteries: An often-neglected criterion when evaluating cycling performance?,” ACS Appl. Mater. Interfaces, vol. 16, no. 17, 2024, Art. no. 17. https://doi.org/10.1021/acsami.4c02095.Search in Google Scholar PubMed PubMed Central
[24] J. Banhart, Ed., Advanced Tomographic Methods in Materials Research and Engineering, Oxford, UK, Oxford University Press, 2008.10.1093/acprof:oso/9780199213245.001.0001Search in Google Scholar
[25] J. H. Hubbell and S. M. Seltzer, “X-ray mass attenuation coefficients,” NIST, 2009 [Online]. Available at: https://www.nist.gov/pml/x-ray-mass-attenuation-coefficients [Accessed: Mar. 15, 2025].Search in Google Scholar
[26] C. Tan, S. R. Daemi, O. O. Taiwo, T. M. M. Heenan, D. J. L. Brett, and P. R. Shearing, “Evolution of electrochemical cell designs for in-situ and Operando 3D characterization,” Materials, vol. 11, no. 11, 2018, Art. no. 11. https://doi.org/10.3390/ma11112157.Search in Google Scholar PubMed PubMed Central
[27] B. S. Mitchell, “Appendix 8: Electrical conductivity of selected materials,” in An Introduction to Materials Engineering and Science, Hoboken, NJ, USA, John Wiley & Sons, Ltd, 2003, pp. 893–899.10.1002/0471473359.app8Search in Google Scholar
[28] H. Jung, C. H. Jang, I. S. Yeo, and T.-H. Song, “Investigation of gas permeation through Al-metallized film for vacuum insulation panels,” Int. J. Heat Mass Transfer, vol. 56, no. 1, 2013, pp. 436–446. https://doi.org/10.1016/j.ijheatmasstransfer.2012.09.013.Search in Google Scholar
[29] L. W. McKeen, Permeability Properties of Plastics and Elastomers, 3rd ed. Oxford, UK, William Andrew Publishing, 2012.Search in Google Scholar
[30] M. Wu et al.., “3D coral-like LLZO/PVDF composite electrolytes with enhanced ionic conductivity and mechanical flexibility for solid-state lithium batteries,” ACS Appl. Mater. Interfaces, vol. 12, no. 47, 2020, pp. 52652–52659. https://doi.org/10.1021/acsami.0c15004.Search in Google Scholar PubMed
[31] T. Yang, J. Zheng, Q. Cheng, Y.-Y. Hu, and C. K. Chan, “Composite polymer electrolytes with Li7La3Zr2O12 garnet-type nanowires as ceramic fillers: mechanism of conductivity enhancement and role of doping and morphology,” ACS Appl. Mater. Interfaces, vol. 9, no. 26, 2017, Art. no. 26. https://doi.org/10.1021/acsami.7b03806.Search in Google Scholar PubMed
[32] Y. Li, W. Zhang, Q. Dou, K. W. Wong, and K. M. Ng, “Li7La3Zr2O12 ceramic nanofiber-incorporated composite polymer electrolytes for lithium metal batteries,” J. Mater. Chem. A, vol. 7, no. 7, 2019, Art. no. 7. https://doi.org/10.1039/C8TA11449H.Search in Google Scholar
[33] S. Ding, L. Fairgrieve-Park, O. Sendetskyi, and M. D. Fleischauer, “Compressive creep deformation of lithium foil at varied cell conditions,” J. Power Sources, vol. 488, 2021, p. 229404, https://doi.org/10.1016/j.jpowsour.2020.229404.Search in Google Scholar
[34] H. Dierks and J. Wallentin, “Experimental optimization of X-ray propagation-based phase contrast imaging geometry,” Opt. Express, vol. 28, no. 20, 2020, pp. 29562–29575. https://doi.org/10.1364/OE.399819.Search in Google Scholar PubMed
Supplementary Material
This article contains supplementary material (https://doi.org/10.1515/mim-2025-0010).
© 2025 the author(s), published by De Gruyter on behalf of Thoss Media
This work is licensed under the Creative Commons Attribution 4.0 International License.