Structural details of metal-organic frameworks by quantitative X-ray microscopy
-
Xiao-Meng Sui

 ,
Vivek Singh
,
Vivek Singh

Abstract
High-resolution X-ray microscopy was used to study the volumetric details of metal-organic framework (MOF) single crystals formed by coordination bonds between copper nitrate and an organic ligand. The three-dimensional information of individual crystals was visualized with submicron resolution, from the virtual slicing of the crystals. Density is one of the basic material properties, but conventional methods cannot provide high resolution mapping. To gain further information on material properties, quantification of the density inside individual crystal were made. The metal salt precursor was used as a standard. By using the same acquisition and reconstruction parameters for the sample and the standard, a correlation between the X-ray attenuation/intensity inside one crystal and its density was established. This correlation allowed the determination of the amount and the spatial distribution of material inside one MOF crystal. The results could provide guidance for future crystal design.
1 Introduction
Metal-organic frameworks (MOFs) are a group of highly porous (up to 90 % free volume) and crystalline materials composed of metal ions or clusters and organic ligands by coordination bonds [1]. These materials have garnered significant attention due to their exceptional surface area, tunable pore structures, and chemical versatility. MOFs are widely explored for applications in gas storage and separation [2], catalysis [3], drug delivery [4], sensing [5], etc. The growing interest in MOFs continues to drive advancements in their synthesis, characterization, and functionalization for the aforementioned industrial and scientific applications.
The previously reported MOF crystals studied here were formed by the interaction between copper salt with a known tetrahedral pyridyl ligand [6], [7]. Fine-tuning on the selection of metal, the ratio of metal to ligand, and reaction temperature leads to diversity of morphologies of the crystals. For example, cations that strongly coordinate with ligands produce single crystals with complex shapes like flowers and stars, whereas weakly coordinating metals form simpler, hexagonal-based crystals. Characterization methods such as scanning electron microscope (SEM) and X-ray diffraction (XRD) were used to study the morphology and crystallinity. Despite their complex shape and appearance, this group of MOFs appeared to be single crystals [6]. Recently, X-ray microscopy (XRM) was applied to qualitatively reveal the volumetric details at different growing time points, which helped decipher the growth mechanism [8]. Details of their cross-sectional morphology were revealed by the correlative study of focused ion beam SEM (FIB-SEM) and XRM.
XRM is a 3D nondestructive imaging method that allows visualization of the interior of opaque objects [9], [10]. A typical lab-based X-ray microscope (Figure 1) includes an X-ray focused source that emits a conical polychromatic X-ray beam. The beam propagates though a sample which contains one or more materials. After passing through the sample, a greyscale radiograph is projected on a detector resulting from the fact that materials with different effective atomic numbers (Z eff) or densities in the sample have different X-ray attenuations/intensity [11]. To get a complete 3D image, the sample rotates around the center of the region of interest (RoI), and 2D images are taken at different rotation angles. The image of the whole volume of the sample can be reconstructed from a complete set of images taken after rotating it over 180° or 360°. One can view the interior of the volume by virtually sectioning the 3D image at the desired position and orientation. XRM is widely used in many industrial, preclinical and research fields [12], [13], [14], [15], but it is rarely used for the study of MOF crystals.
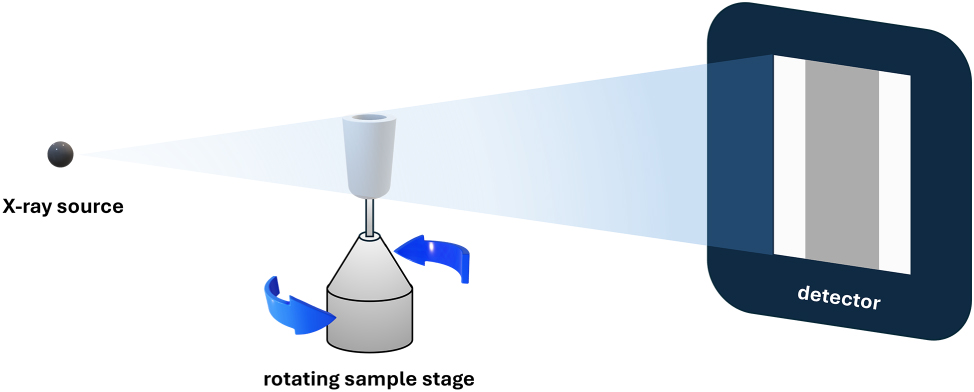
A schematic drawing of a typical lab-based X-ray microscope.
Examining the scan of the MOF crystals [6], [8], we noticed that, despite being single crystals, the X-ray attenuation across the virtual slices was not uniform. Imaging techniques such as SEM or FIB-SEM may provide the morphology of the surface or the cross-section, but they cannot provide information in 3D (in the case of SEM) or it is time consuming and destructive (in the case of FIB-SEM). Also, it seems that the MOF crystals were sensitive to the electron beam and FIB milling.
In this work, to further understand the structure of the crystals, we used XRM to study the 3D structures of the MOF crystals, both qualitatively and quantitatively. To the best of our knowledge, this is the first report to characterize the density of MOF structures by XRM.
2 Materials and methods
2.1 Materials
Chloroform (anhydrous) and dimethylformamide (ACS reagent) were purchased from Sigma Aldrich and J. T. Baker, respectively. Cu(NO3)2·6H2O (>99.9 %) was from Fluka Chemia. Reagents were used as received, without further purification. The ligand 1,3,5,7-Tetrakis(4-((E)-2-(pyridin-4-yl)vinyl)phenyl) adamantane (AdDB) was synthesized according to the literature [16]. Glass pressure tubes (Ace Glass, Inc., pressure tubes #15 with plunger valve, PTFE Bushing and FETFE® O-Ring, volume 50 mL) were used for crystal growth.
2.2 Crystal growth procedures for Cu – AdDB
The detailed synthesis procedure to prepare the Cu-AdDB MOF can be found in previous work [6]. In this work, we took the copper-to-ligand ratio of 1:2 as an example to study. The tube was sealed and placed in an oven at 105 °C without stirring for 48 h. After the reaction, the tube cooled down to room temperature. The resulting green crystals were collected by centrifugation. The crystals were washed twice with ethanol and dried under a high vacuum for 5 h.
2.3 Qualitative and quantitative XRM study
A few milligrams of dried MOF powder was placed in a sealed pipette tip and imaged using a Zeiss Versa 520 X-ray microscope. The microscope was operated at 40 kV and 3 W. 1,600 projections were collected over 360° with an optical magnification of 20×, binning of 2. The voxel size is 0.66 μm. To calibrate the density measurements, Cu(NO3)2·6H2O crystals (density 2,070 mg/cm3) were scanned under identical conditions, which include source voltage, filter, detector, and beam hardening correction constant. Following volume reconstruction, the image intensity values of the pure Cu(NO3)2·6H2O and air (density 0) were used to create a calibration curve. This calibration was then applied to convert the intensities of each voxel of the image into density values. We assume that the X-ray absorption of the organic component is negligible.
2.4 Data analysis and visualization
Quantification was carried out using the scale module embedded in the Zeiss reconstruction software. Image segmentation, analysis, and visualization were performed using the Amira software (Thermo Fisher Scientific, Version 2023.2).
3 Results and discussion
The MOF crystal used for this study has a double-decker flower morphology, with each flower consisting of six symmetrical petals, as shown under an SEM, optical microscopy and XRM [6]. Despite the multidomain and sophisticated morphology, X-ray diffraction proved that those flowers are single crystals that belong to the P622 space group [6], [7].
SEM provided information on the surface and overall shape of the crystals [6] (not shown here). The double-decker-flower-shaped crystal has a convex surface, with the center of the flower thicker and the petals thinner. The two flowers are connected in the core but separated along the edges of the petals.
Figure 2A shows a topographic view of the crystalline powder under the XRM. Using the Amira software, we were able to virtually isolate several single crystals for further analysis. One of them, with its typical double-decker flower shape, is shown in Figure 2B and C. The size of this flower is 32 μm, and its height at the center is 8 μm.
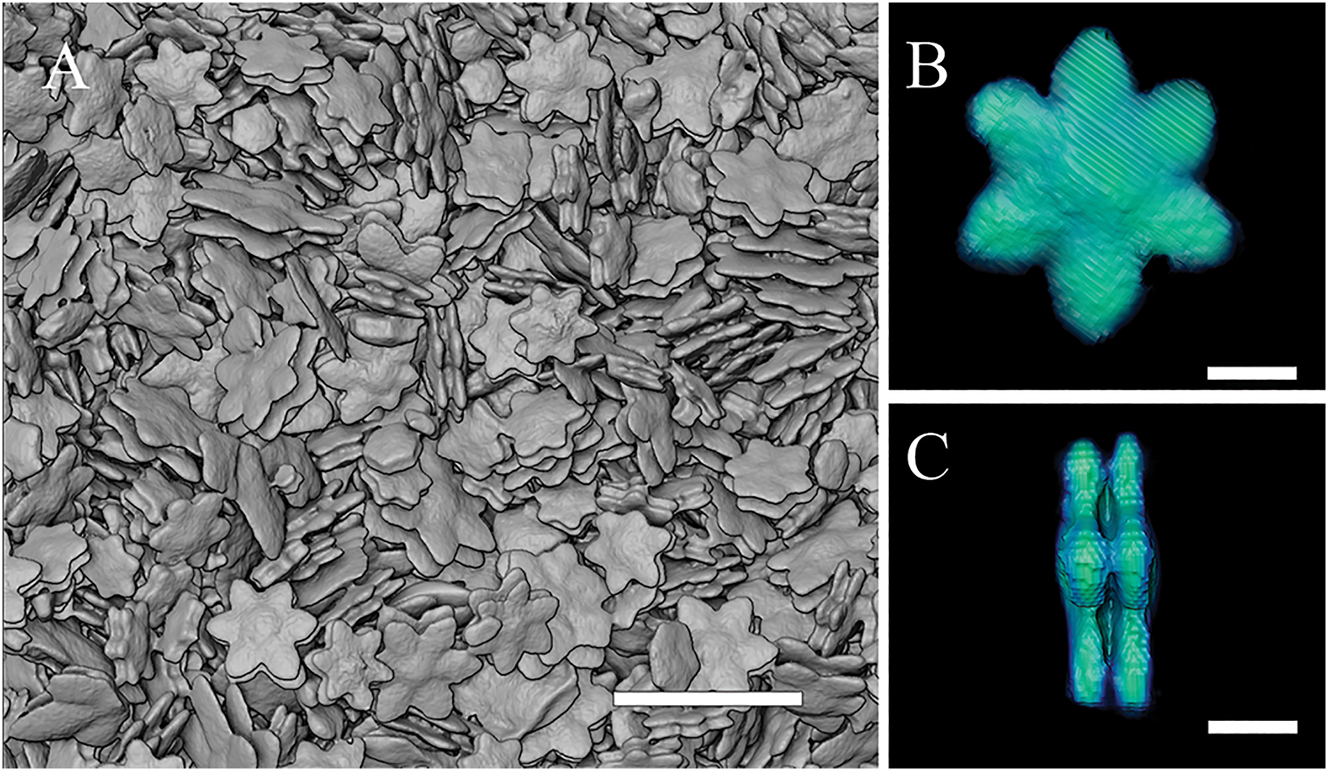
XRM images. (A) Uncalibrated images of Cu-AdDB MOF crystals. (B) One isolated crystal. (C) Lateral view of the same crystal in Figure 2B. Scale bars are 100 μm for (A) and 10 μm for (B) and (C), respectively.
By virtually slicing through an individual crystal, we noticed that the intensities of the pixels on each slice were not uniform. Each flower has a brighter shell and a darker core. Note that the intensity of the XRM result represents X-ray attenuation. Under the same incident X-ray beam energy, a higher value means higher Z eff or higher density. Based on the single crystal XRD (SCXRD) result, the crystals have the same Cu-AdDB coordination bonds throughout the structure; the reason for the non-uniform structure is probably the density variation.
We then carried out a quantitative study to determine the actual density of the sample. To quantify the data in the final XRM image, one must transform the raw intensities of all voxels of the reconstructed image into CT (Hounsfield) numbers. Alternatively, the density of a material in a sample can be estimated by empirical calibration of the image using a standard object (phantom).
When an X-ray beam is transmitted through a sample, its intensity decreases exponentially according to the Beer–Lambert law [17]. The X-ray attenuation is due to two primary mechanisms: absorption and scattering. Scattering contributes to the X-ray attenuation in coherent and incoherent (Compton scattering) manners. This is an intrinsic limitation of micro-CT/XRM methodology in crystals. Nonetheless, the contributions of scattering are just a few percent of the X-ray attenuation in metals [18]. Even though there might be artifacts induced by scattering, with the contribution of scattering itself being so low, the effects of the scattering-induced artifacts are negligible.
Assuming there is only a single material in the sample, the intensity is
where I is the X-ray intensity after it passes through the sample, I 0 is the incident intensity, x is the thickness of the sample, and μ is the linear attenuation coefficient. This constant depends on the nature of the material, mainly on its effective atomic number Z eff and on the energy of the incident beam. For a given beam intensity, the linear attenuation coefficient also depends on the amount of material in the sample, defined by its density [19]. To separate the effects induced by the amount of material from its intrinsic characteristics, we can define the mass attenuation coefficient μ m
where r is the density of the material in the sample.
The X-ray absorption by the sample becomes
or
XRM measures the raw intensity of the beam after it passes through the sample, as well as the incident beam intensity (measured without the sample). The absorption is calculated from these intensities before volume reconstruction. Consequently, the intensity values in the reconstructed 3D image represent the absorption values for each voxel within the sample. It should be noted that the Beer–Lambert law is only approximately valid for our polychromatic beam and may cause image artifacts, such as beam hardening and partial volume reconstruction [20]. We have avoided the partial volume reconstruction by choosing one of the crystals that is close to the center of the sample, and we have corrected all images for beam hardening, using Zeiss software.
The attenuation of hard X-ray photons depends mainly on the nature of the absorbing material and is significantly less influenced by structural details. For example, in a well-established method for estimating bone mineral density, a pure hydroxyapatite phantom is used as a standard for both the cortical and spongy (trabecular) parts of the bone, even though the composition and the structure of the phantom differ from those of the actual samples. The effects of organic materials and water on X-ray attenuation were not taken into account. Nevertheless, the estimation of the density from the X-ray CT scan agreed well with the measurements [21], [22].
Since there is no standard with the same composition, structure, and density available, we have used in our analysis the precursor Cu(NO3)2·6H2O. Our main quantitative assumption was that the X-ray absorption of the organic part is negligible compared to the metal salt. For calibration, we scanned crystal of Cu(NO3)2·6H2O (Figure 3). To get the accurate absorption value for the intensity of the phantom, a volume of interest (VoI) close to the center of the crystal (marked by the red circle on the crystal, in Figure 3) was chosen. We ensured that the selected VoI contained no voids. In XRM, a volume is composed of a stack of 2D images. The intensity value for the chosen VoI (which is used for calibration) was taken as the average of the intensities over all those 2D slices. The attenuation of the VoI is uniform, with a standard deviation only 2.8 % of the average value. This average value was assigned to the actual density of 2,070 mg/cm3 of the precursor crystal. For the value of air, which was assigned to a density value of zero, a VoI next to the crystal was chosen (marked by the red circle in the void in Figure 3), and the intensity was averaged over all slices.
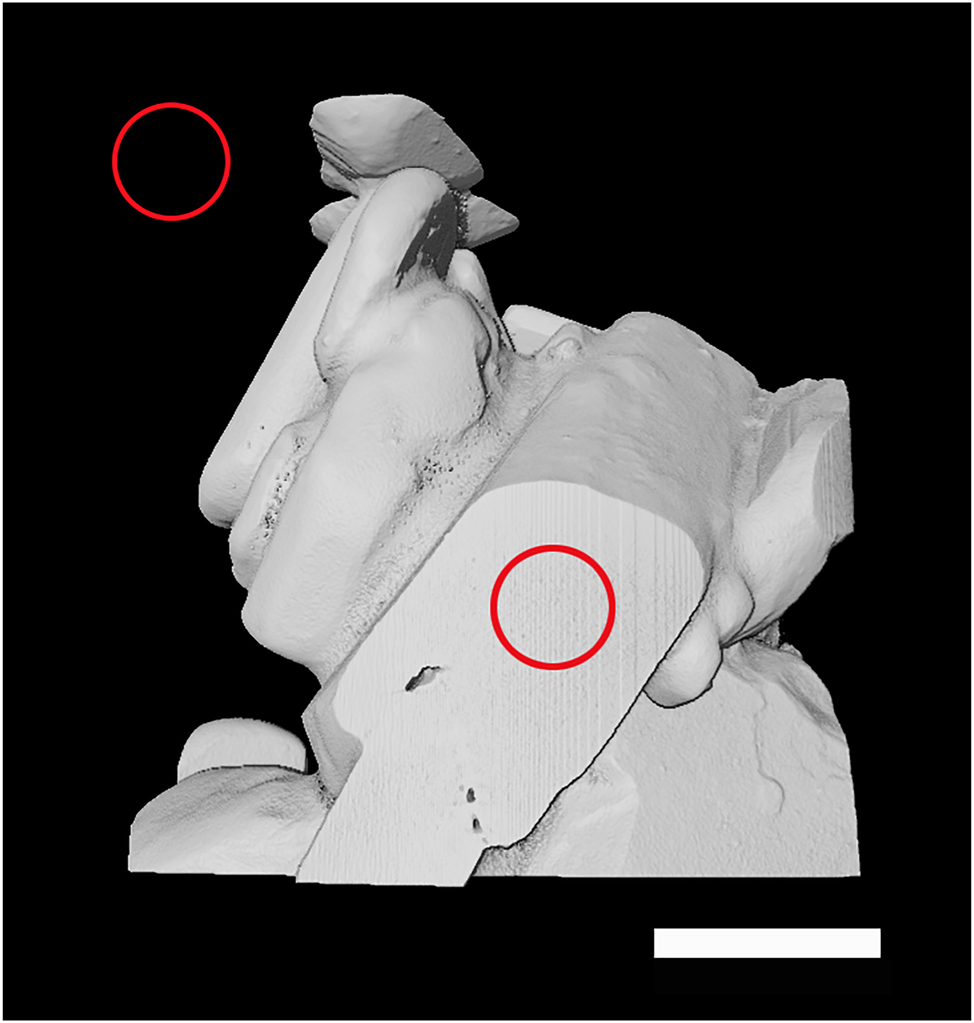
XRM image of a crystal of Cu(NO3)2·6H2O used for calibration. The positions of the two VoIs are marked by the red circles on the image. Scale bar is 200 μm.

Slicing through the crystal. (A) Positions of the virtual slices are shown in (B) to (F). Color legend in (B) shows the density of the crystal (in mg/cm3) and is valid for all images. The density of the crystal is in the range from the lowest (430 mg/cm3) to the highest (1,538 mg/cm3). Scale bars are 10 μm.
Virtual slicing of the whole volume of the double-decker flower makes it possible to analyze its interior (SI-Video_1). Figure 4 shows the densities (in mg/cm3) variations in the crystal for several slicing depths. The center of the outer layer (Figure 4B) shows higher density. Slicing deeper, we obtain a different density distribution, with the material density lower in the center of the flower and higher towards the surface (Figure 4C, D and F). The highest density comes from the middle of each flower petal, with a value of 1,538 mg/cm3. In the region connecting the two flowers, the material density is the lowest. Also, the size of the slice is smaller in the connecting region (Figure 4D) than that of the flower. Slicing further into the second flower gives the same intensity as for the first flower, indicating the two flowers are symmetrical.
After obtaining the density on each voxel, we calculated the average density of the crystal to be 840 mg/cm3, which is in the same order of magnitude as the density value (930 mg/cm3) obtained by SCXRD [6]. The agreement between different characterization modalities validates the assumption we made in the quantification.
Our data provides a deeper understanding of the formation of these crystalline flower structures. It was noticed that there is a low-density region in the center of a fully grown flower, and the size of this region (16 μm in width and 6 μm in height) is in a similar range to the ‘premature’ stellate structure (a product observed by SEM after 1.5 h of reaction [6]). Please refer to SI_Video 2 for the 3D view of the segmented data. As discussed in the reference [6], small particles seemed to attach to the surface of the stellate structures at later growth stage and might go through fusion and the Ostwald ripening process to form the petals of the final structure. This hypothesis should be validated through time-resolved measurements of crystals at various developmental stages.
4 Conclusions
We hereby report the application of the XRM in the study of a MOF crystal; correlating the results with other characterization techniques provides a better understanding of their structure. XRM provides a non-destructive method for determining the inner fine structures. For the first time, XRM scaling was applied to MOF crystals by using the metal salt precursor as a phantom/standard. This calibration helped to derive the density of the flower in each voxel. The results are in agreement with the SCXRD. We hope this study paves the way for applications of XRM in the study of other MOF materials.
Acknowledgments
This research was supported by the Irving and Cherna Moskowitz Center for Nano and Bio-Imaging at the Weizmann Institute of Science, M.E.v.d.B. holds the Bruce A. Pearlman Professional Chair in Synthetic Organic Chemistry.
-
Research ethics: Not applicable.
-
Informed consent: Not applicable.
-
Author contributions: X. M. S. Contributed data or analysis tools; Performed the analysis; Wrote the paper; V. B. Conceived and designed the analysis; Collected the data; Contributed data or analysis tools; Performed the analysis; Wrote the paper; V. S. synthesized the samples. All authors discussed the results and contributed to the final manuscript. All authors have accepted responsibility for the entire content of this manuscript and approved its submission.
-
Use of Large Language Models, AI and Machine Learning Tools: Not applicable.
-
Conflict of interest: The authors state no conflict of interest.
-
Research funding: None declared.
-
Data availability: Data are available upon reasonable request.
References
[1] H.-C. Zhou, J. R. Long, and O. M. Yaghi, “Introduction to metal–organic frameworks,” Chem. Rev., vol. 112, no. 2, pp. 673–674, 2012, https://doi.org/10.1021/cr300014x.Search in Google Scholar PubMed
[2] H. Li, et al.., “Porous metal-organic frameworks for gas storage and separation: status and challenges,” EnergyChem, vol. 1, no. 1, p. 100006, 2019, https://doi.org/10.1016/j.enchem.2019.100006.Search in Google Scholar PubMed PubMed Central
[3] D. Yang and B. C. Gates, “Catalysis by metal organic frameworks: perspective and suggestions for future research,” ACS Catal., vol. 9, no. 3, pp. 1779–1798, 2019, https://doi.org/10.1021/acscatal.8b04515.Search in Google Scholar
[4] H. D. Lawson, S. P. Walton, and C. Chan, “Metal–organic frameworks for drug delivery: a design perspective,” ACS Appl. Mater. Interfaces, vol. 13, no. 6, pp. 7004–7020, 2021, https://doi.org/10.1021/acsami.1c01089.Search in Google Scholar PubMed PubMed Central
[5] P. Kumar, A. Deep, and K.-H. Kim, “Metal organic frameworks for sensing applications,” TrAC, Trends Anal. Chem., vol. 73, pp. 39–53, 2015, https://doi.org/10.1016/j.trac.2015.04.009.Search in Google Scholar
[6] V. Singh, et al.., “Factors controlling complex morphologies of isomorphous metal-organic frameworks,” Chem. Eur J., vol. 29, no. 54, p. e202301825, 2023, https://doi.org/10.1002/chem.202301825.Search in Google Scholar PubMed
[7] H. Nasi, et al.., “Directing the morphology, packing, and properties of chiral metal-organic frameworks by cation exchange,” Angew. Chem., Int. Ed., vol. 61, no. 34, p. e202205238, 2022, https://doi.org/10.1002/anie.202205238.Search in Google Scholar PubMed PubMed Central
[8] M. C. di Gregorio, et al.., “Molecular cannibalism: sacrificial materials as precursors for hollow and multidomain single crystals,” Nat. Commun., vol. 12, p. 957, 2021, https://doi.org/10.1038/s41467-021-21076-9.Search in Google Scholar PubMed PubMed Central
[9] P. J. Withers, et al.., “X-ray computed tomography,” Nat. Rev. Methods Primers, vol. 1, p. 18, 2021, https://doi.org/10.1038/s43586-021-00015-4.Search in Google Scholar
[10] M. L. Bouxsein, S. K. Boyd, B. A. Christiansen, R. E. Guldberg, K. J. Jepsen, and R. Muller, “Guidelines for assessment of bone microstructure in rodents using micro–computed tomography,” J. Bone Miner. Res., vol. 25, no. 7, pp. 1468–1486, 2010, https://doi.org/10.1002/jbmr.141.Search in Google Scholar PubMed
[11] B. J. Heismann, J. Leppert, and K. Stierstorfer, “Density and atomic number measurements with spectral X-ray attenuation method,” J. Appl. Phys., vol. 94, no. 3, pp. 2073–2079, 2003. https://doi.org/10.1063/1.1586963.Search in Google Scholar
[12] B. D. Metscher, “Micro CT for comparative morphology: simple staining methods allow high-contrast 3D imaging of diverse non-mineralized animal tissues,” BMC Physiol., vol. 9, p. 11, 2009, https://doi.org/10.1186/1472-6793-9-11.Search in Google Scholar PubMed PubMed Central
[13] J. Le Houx and D. Kramer, “X-ray tomography for lithium ion battery electrode characterisation – a review,” Energy Rep., vol. 7, no. 2, pp. 9–14, 2021, https://doi.org/10.1016/j.egyr.2021.02.063.Search in Google Scholar
[14] R. Biton, et al.., “The rediscovered hula painted frog is a living fossil,” Nat. Commun., vol. 4, p. 1959, 2013, https://doi.org/10.1038/ncomms2959.Search in Google Scholar PubMed
[15] M. Pierantoni, et al.., “Mineral deposits in ficus leaves: morphologies and locations in relation to function,” Plant Physiol., vol. 176, no. 2, pp. 1751–1763, 2018, https://doi.org/10.1104/pp.17.01516.Search in Google Scholar PubMed PubMed Central
[16] M. Vasylyev, R. Popovitz-Biro, L. J. Shimon, and R. Neumann, “Inorganic–organic hybrid materials based on keggin type polyoxometalates and organic polyammonium cations,” J. Mol. Struct., vol. 656, nos. 1–3, pp. 27–35, 2003, https://doi.org/10.1016/s0022-2860(03)00330-2.Search in Google Scholar
[17] A. Beer, “Bestimmung der Absorption des rothen Lichts in farbigen Flüssigkeiten,” Ann. Phys., vol. 162, no. 5, pp. 78–88, 1852, https://doi.org/10.1002/andp.18521620505.Search in Google Scholar
[18] J. J. DeMarco and P. Suortti, “Effect of scattering on the attenuation of X rays,” Phys. Rev. B, vol. 4, no. 4, pp. 1028–1033, 1971, https://doi.org/10.1103/physrevb.4.1028.Search in Google Scholar
[19] E. Maire and P. J. Withers, “Quantitative X-ray tomography,” Int. Mater. Rev., vol. 59, no. 1, pp. 1–43, 2014, https://doi.org/10.1179/1743280413y.0000000023.Search in Google Scholar
[20] A. C. Kak and M. Slaney, Principles of Computerized Tomographic Imaging, Philadelphia, Society of Industrial and Applied Mathematics, 2001.10.1137/1.9780898719277Search in Google Scholar
[21] E. Donnelly, “Methods for assessing bone quality: a review,” Clin. Orthop. Relat. Res., vol. 469, no. 8, pp. 2128–2138, 2011, https://doi.org/10.1007/s11999-010-1702-0.Search in Google Scholar PubMed PubMed Central
[22] J. H. Kinney, G. W. Marshall, and S. J. Marshall, “Three-dimensional mapping of mineral densities in carious dentin: theory and method,” Scanning Microsc., vol. 8, no. 2, pp. 197–205, 1994.Search in Google Scholar
Supplementary Material
This article contains supplementary material (https://doi.org/10.1515/mim-2025-0009).
© 2025 the author(s), published by De Gruyter on behalf of Thoss Media
This work is licensed under the Creative Commons Attribution 4.0 International License.