Correlative electron and X-ray microscopy: a new lens for sodium-ion battery research
-
Adrian Mikitisin

 ,
Heinrich Ditler
,
Heinrich Ditler

Abstract
Sodium-ion batteries (SIBs) are emerging as a promising alternative to lithium-ion technology, with the first commercial cells now available. Understanding their structure and degradation mechanisms is crucial for further development. This study presents a correlative approach combining X-ray and electron microscopy to achieve multi-scale imaging of SIB materials. X-ray microscopy enables non-destructive 3D analysis of electrode architecture, while electron microscopy provides high-resolution insights into particle morphology, interfaces, and failure modes. By integrating these techniques, we establish a comprehensive workflow for analyzing structural and chemical changes. Our results offer one of the first in-depth imaging and analysis of commercial SIB materials and provide valuable feedback for material optimization. This correlative methodology sets a new standard for battery research, advancing the development of next-generation sodium-ion energy storage solutions.
1 Introduction
As the demand for sustainable and high-performance energy storage solutions grows [1], sodium-ion batteries (SIBs) have emerged as a promising alternative to lithium-ion technology due to their cost-effectiveness, abundant raw material supply, and comparable electrochemical power performance [2], [3], [4]. With the recent introduction of the first commercially available sodium-ion battery cells, a comprehensive understanding of their structural, chemical, and electrochemical properties is crucial for advancing their development. In this work, we present a correlative imaging approach that integrates X-ray microscopy (XRM) and electron microscopy (EM) to provide an unprecedented multi-scale characterization of the materials and architectures used in SIBs. This study highlights the advantages of combining non-destructive X-ray imaging with high-resolution electron microscopy to achieve a holistic understanding of the battery components.
We first provide an overview of one of the first commercially available sodium-ion battery cells, discussing their electrode compositions, material choices, and electrochemical characteristics. In [4] we already showed the capabilites of multi method characterization (from qOCV fitting to analytical methods like ICP-OES/EDX) that were recently applied to Li-Ion batteries can also be applied for Na-Ion batteries. The electrical testing of these cells, including charge-discharge cycling, impedance spectroscopy, and rate capability analysis, establishes a baseline for performance evaluation and degradation studies. To complement these findings, we apply advanced imaging modalities to analyze the morphology, microstructure, and failure modes of the key battery components.
X-ray microscopy [5], performed at both micro- and nano-scales, enables non-invasive visualization of the internal structure of SIB electrodes, revealing particle distribution, porosity, and large-scale structural defects. Using computed tomography (CT) techniques, we reconstruct three-dimensional (3D) volumes of the electrodes, allowing for statistical analysis of particle sizes, agglomeration tendencies, and macroscopic degradation features. The ability to monitor these changes in operando or post-mortem studies provides valuable insight into the cell’s aging behavior [6].
Electron microscopy further refines this analysis by enabling high-resolution imaging of the individual active material particles, interface structures, and failure points. Scanning electron microscopy (SEM) combined with focused ion beam (FIB) milling allows for cross-sectional imaging of the electrode layers, revealing microstructural changes at various cycling stages. Energy-dispersive X-ray spectroscopy (EDX) maps elemental distributions, identifying inhomogeneities and the presence of unwanted secondary phases.
A key contribution of this study is the development of a correlative microscopy workflow that bridges the gap between X-ray and electron microscopy, allowing for a seamless transition between different length scales and imaging modalities (Figure 1). By integrating 3D X-ray reconstructions with high-resolution electron imaging, we establish a comprehensive framework for analyzing the evolution of SIB electrode materials. This approach enables direct correlation between macroscopic degradation features and their nanoscale origins, providing a deeper understanding of performance-limiting factors such as particle fracture, binder distribution, and phase transformations.
Our results demonstrate that correlative X-ray and electron microscopy is an essential tool for unraveling the complex structure-property relationships in sodium-ion battery materials. This methodology provides valuable feedback for material design, cell optimization, and failure analysis, paving the way for the development or parameterization of a physico-chemical model [7] of next-generation SIBs with enhanced performance and durability. By combining non-destructive 3D imaging with high-resolution microstructural analysis, we establish a new standard for battery research that extends beyond traditional characterization techniques.
This work represents a first in-depth imaging and analysis of commercially available sodium-ion battery materials, offering critical insights into their composition and microstructure. As sodium-ion technology continues to evolve, correlative microscopy will play a pivotal role in guiding material improvements and accelerating the commercialization of sustainable energy storage solutions (Figure 1).
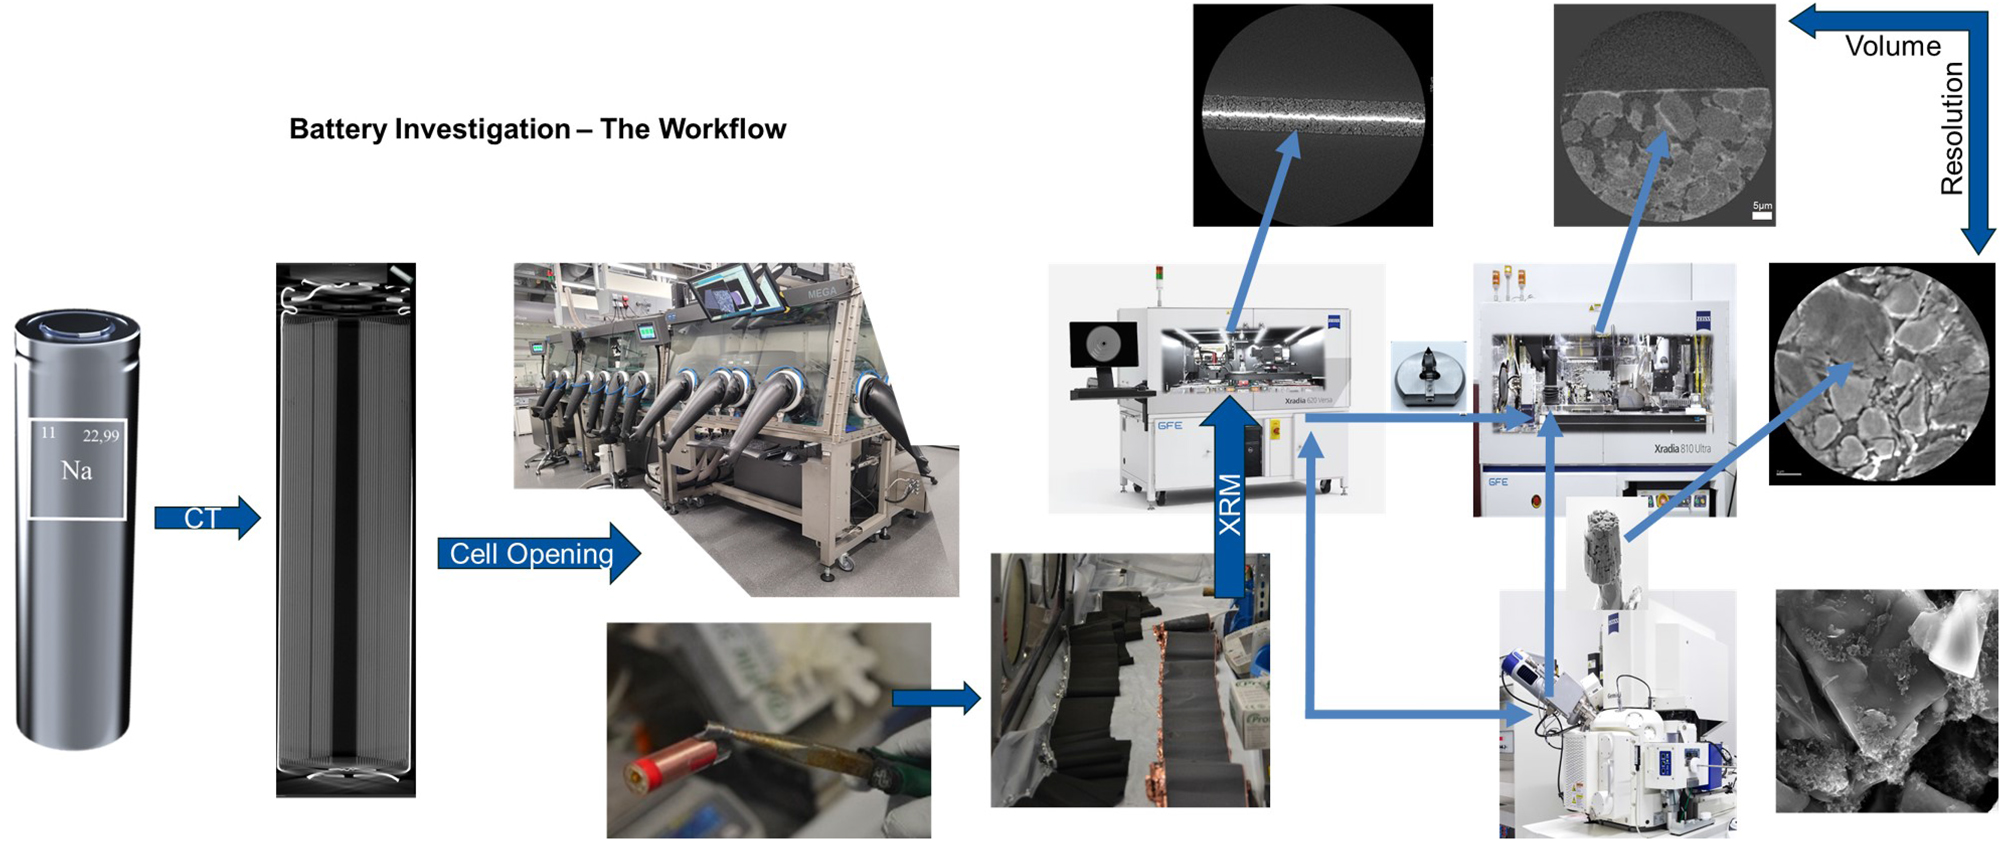
The correlative workflow illustrates the process from electrochemical testing to high-resolution imaging. After cell testing and disassembly in an argon-filled glovebox, electrodes are analyzed via two routes: (1) Micro-CT for structural overview, followed by Nano-CT for sub-micrometer resolution, or (2) Micro-CT to identify key features, followed by FIB-SEM cross-sectioning and Nano-CT for the highest resolution. This approach enables a multi-scale analysis of battery degradation and failure mechanisms.
2 Experimental setup
To evaluate the electrochemical characteristics of the anode and cathode materials of the studied sodium-ion battery, electrochemical testing was conducted using galvanostatic charge-discharge cycling to determine the voltage profiles of the anode and cathode half-cells. The structural and morphological characterization of the electrodes was carried out using scanning electron microscopy and energy-dispersive X-ray spectroscopy to investigate surface morphology, particle distribution, and elemental composition. Cross-sectional imaging of the electrodes was performed to assess structural integrity after cycling. Additionally, X-ray microscopy was employed to provide a three-dimensional visualization of electrode architecture and detect structural changes at different stages of cycling. This technique enabled non-destructive imaging of active material degradation, particle cracking, and electrode porosity evolution. The combination of electron and X-ray microscopy provided a comprehensive understanding of electrode behavior and degradation mechanisms in sodium-ion batteries.
2.1 Half cell voltages
To determine the voltage profiles of the anode and cathode half-cells, a coin cell in a two-electrode setup using the anode or cathode material versus a sodium chip is the most commonly used methodology [3], [8]. Since the cathode did not exhibit sufficient cycling behavior versus sodium, a three-electrode setup was used. This method demonstrated the lowest error relative to the real open-circuit potential in Schütte et al. [7]. For the anode coin cell measurements presented here, the same setup as in Rehm et al. [3] and Schütte et al. [7] was used. For the three-electrode setup, an EL-Cell was used, following the same configuration as in Schütte et al. [7], since charge transfer and solid electrolyte interphase (SEI) formation at the sodium counter electrode are significantly worse compared to the full-cell setup. The only modification was a change in the electrolyte solvent, replacing the mixture of ethylene carbonate, propylene carbonate, and dimethyl carbonate with a mixture of ethylene carbonate and diethyl carbonate (50:50 by wt.%). The concentration of the conductive salt, sodium hexafluorophosphate, was maintained at 1.2 M. The sodium-coated reference ring was purchased from EL-Cell.
2.2 Scanning electron microscopy
Scanning electron microscopy and energy-dispersive X-ray spectroscopy are commonly employed in battery research to analyze morphological changes, particle fractures, and the elemental composition of electrode surfaces. Due to lithium’s low X-ray transition energy (Ka at 54.3 eV), detecting it requires specialized EDX detectors [9]. In contrast, sodium has a significantly higher X-ray transition energy of approximately 1,041 eV, making it detectable with most standard EDX detectors. This allows for easier EDX analysis compared to lithium-ion batteries, as sodium-based deposits can be identified and visualized more readily. In this study, backscattered electron imaging and SE analysis of electrode cross-sections were conducted using a Zeiss GeminiSEM 300 (Zeiss, Germany). An UltimMax65 EDX detector (Oxford Instruments) was integrated into the microscope for EDX measurements, which were carried out at an accelerating voltage of 15 kV.
2.3 X-ray microscopy
X-ray microscopy is an effective technique for analyzing battery aging processes due to its non-destructive nature [10], [11], [12], allowing internal examination without opening the cell prior. By rotating the sample between 0° and 360°, a complete set of angular images is captured [13]. These images are then processed using a filtered back projection (FBP) reconstruction algorithm to generate a 3D model of the sample [14]. Once reconstructed, virtual cross-sections can be extracted at any point, revealing internal defects and the agglomeration of particles. This approach enables the detection of structural changes on a macroscopic scale while maintaining cell functionality. Unlike Micro-CT (mCT), which operates on both micro- and macro-scales, laboratory nano-computed tomography (nCT) requires direct access to the active material, making it a semi-destructive technique [15]. However, nCT provides critical insights into the aging mechanisms of active materials (for example cracking of cathode particles [16]) at the particle level [17]. Given its advantages, we employed XRM at various scales to investigate the sodium-ion battery.
Beginning at the full cell level, the effects of cycling and calendar aging can be examined down to sub-micron resolution using state-of-the-art XRMs such as the ZEISS Xradia 620 Versa. To investigate the full pouch cell, an accelerating voltage of 160 kV was used and the current was set to 156 µA. Micro-CT was employed to detect mechanical deformations or defects within the cell. For instance, changes due to material expansion can be visually represented. Simultaneously, the layer thickness can be measured non-destructively, and any potential changes in the layer thickness due to aging can be quantified.
After opening the cell, the extracted electrode foils were again examined using mCT at first. The foils were simply examined in the mCT after the glove box after extraction without any further necessary preparation. The samples can also be examined while sealed, ensuring that air is excluded at all times during the CT examination. For the measurements of the anode and cathode foils, a pixel size of 200 nm was selected. The measurement parameters for the cathode were 60 kV and 6.5 W, while for the anode foil, 30 kV and 2 W were used. A total of 1,601 projections were acquired. To improve image quality, multi-reference correction, adaptive motion compensation, and dynamic ring removal were applied.
After mCT investigations, high-resolution X-ray imaging was performed using a ZEISS Xradia 810 Ultra [18]. A quasi-monochromatic photon energy of 5.4 keV enabled the analysis of electrode structures at the particle scale, achieving a resolution of up to 50 nm. Sample preparation for nCT involved a ZEISS Crossbeam 350 Focused Ion Beam (FIB), optimizing the sample volume to approximately 15 µm in diameter for the best possible resolution in the nCT. Sample cylinders were prepared from the sample surface (anode and cathode) using gallium ion bombardment. Subsequently, the freed volumes were removed from the surface using a micromanipulator and applied to the sample holder of the nCT (tungsten needle), as shown in (Figure 2). The sample volumes prepared in this manner were then analyzed using phase contrast nanotomography. The phase contrast in the ZEISS Xradia 810 Ultra allows for the examination of particle and pore volumes [19], as well as the high-resolution investigation of binder structures between the particles due to the increased contrast [20]. Furthermore, defects within the primary particles after aging, as well as the structures of the secondary particles, can be resolved.
Another significant advantage of phase contrast imaging is its ability to enable the detailed investigation of the separator between the anode and cathode. Conventional absorption contrast alone is insufficient for visualizing fine structures within polymer films, as their weak X-ray absorption limits contrast differentiation. However, by utilizing phase contrast in nCT, the internal morphology of the separator can be visualized with high resolution, allowing for detailed characterization of its microstructure, porosity, and potential degradation effects. This capability provides new insights into separator performance and its role in the overall electrochemical stability of the cell. The only challanging task is to overcome is to segment phase contrast datasets [21] (Figure 2).
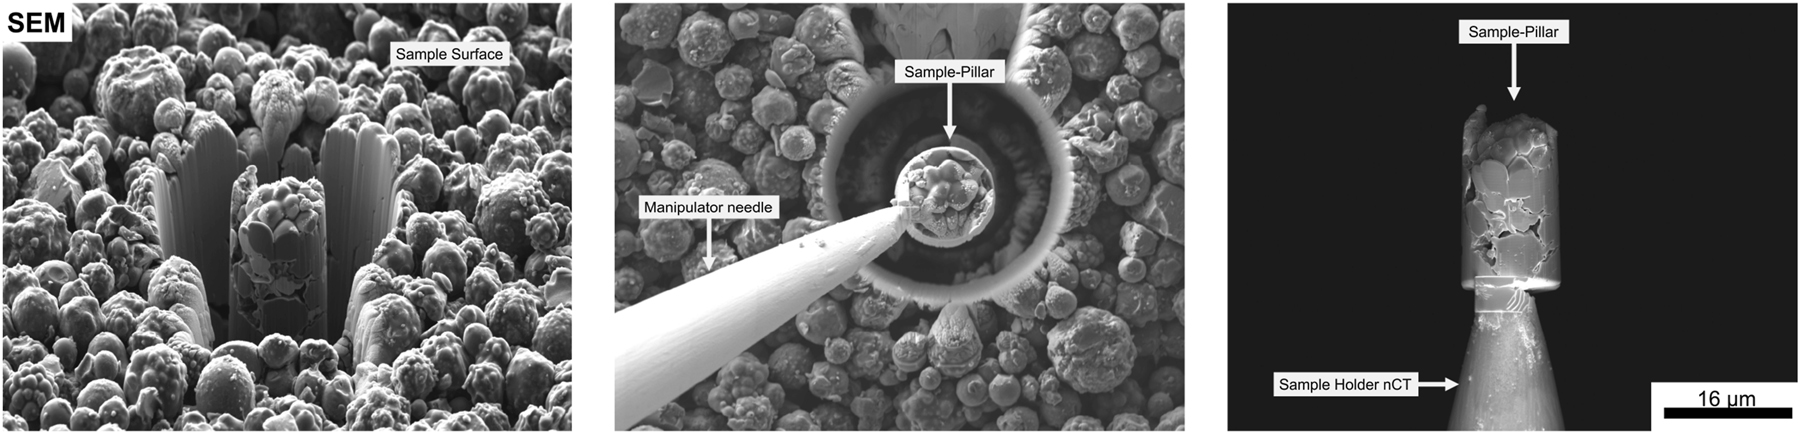
The image illustrates the sequential preparation steps for Nano-CT analysis. From left to right, the process begins with focused ion beam (FIB) milling, where a cylindrical sample is extracted from the electrode material. In the middle step, a micromanipulator needle is positioned at the sample and attached to the extracted pillar using gas injection system (GIS) welding. Finally, the pillar is detached from the bulk material and transferred onto a small tungsten needle, where it is subsequently analyzed using Nano-CT.
3 Results
3.1 Half cell voltages
Hard carbon can change its voltage curve due to different synthesis routes [22]. Therefore, it is always necessary to measure each hard carbon sample individually. Due to the high overvoltage during cycling of the anode material versus sodium metal, a low current of 14 µA was used for the anode voltage curve shown in Figure 3, resulting in a cycle time of nearly 400 h per direction. The cycling voltage limits were set to 10 mV and 2 V. The capacity for the shown sodiation/desodiation was 5.55 mAh and 5.49 mAh, respectively. The coulombic efficiency for an anode versus metal coin cell can appear closer to ideal (1.0) than it actually is due to side reactions during the plating process on the sodium metal counter electrode during desodiation.
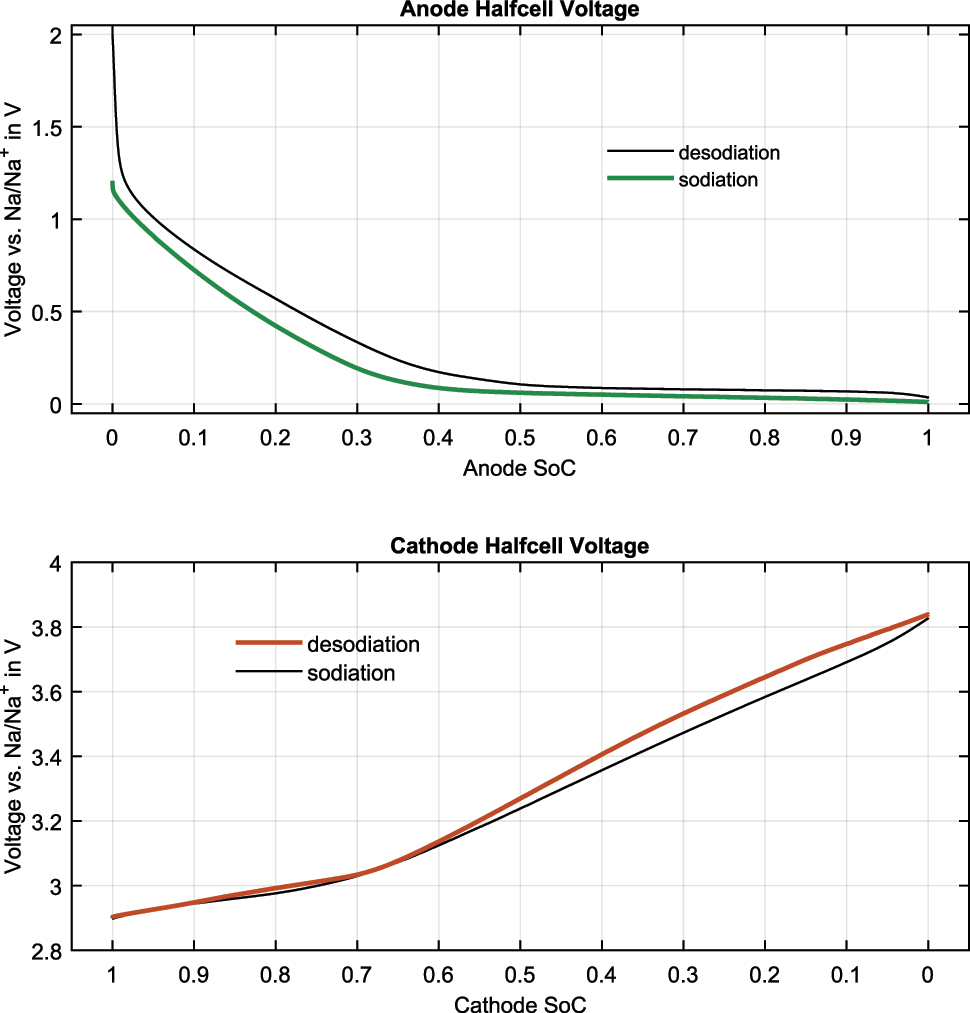
Half cell voltage curves versus Na/Na+ during sodiation and desodiation for the anode and cathode materials. The state of charge (SOC) is set to 0 and 1 at the end of the voltage curve but does not correspond to a specific state of sodiation.
For the cathode curve, the cycle with the highest coulombic efficiency is shown. Due to the lower impedance and the reference electrode in the EL-Cell three-electrode setup, a higher current can be used for a sufficient overvoltage. The voltage limits were set based on the measured full cell voltage, from 1 V to 3.9 V. The cycling current for both directions was set to 200 µA. The measured capacity for the sodiation/desodiation of the cathode half-cell, shown in Figure 3, was 4.72 mAh and 5.01 mAh, respectively.
The voltage curve of the anode shows a similar electrochemical behavior to other commercial hard carbon materials. The unsodiated hard carbon has a high voltage, which decreases similarly to an exponential function, with nearly no further decrease in voltage at around 0.4 to 0.5 SOC. The largest voltage difference between charging and discharging occurs in the higher voltage range, resulting in a hysteresis behavior in sodium-ion full cells containing hard carbon [3], [4].
The cathode voltage curve shows a similar electrochemical behavior to pure NiFeMn-layered oxides [4]. The voltage curve has a steeper slope around 3 V. The area below 3 V typically has no significant influence on the voltage decrease of the full cell at lower voltages due to the rising anode voltage in this SOC region [7]. The maximum measured cathode voltage is lower than the set full-cell limit of 3.9 V. This behavior was also observed in Schütte et al. [7], where it showed no significant negative influence on the measured cathode voltage. This phenomenon can be addressed in future research using three-electrode setups.
The largest voltage difference in the high SOC region is nearly invisible. Only in the higher voltage range can a difference between the charge and discharge voltages be observed. To the best of our knowledge, no layered oxide material exhibits significant hysteresis only in the higher voltage range. Therefore, we postulate that this phenomenon is due to a possible side reaction involving the sodium metal during the measurement.
3.2 Investigated cell
The sodium-ion cell under investigation is a research cell manufactured by LiFun Technology (Hunan Province, China). The cells were delivered and initially analyzed in a dry state, so that the electrodes were not in contact with any liquid electrolyte. First, the sodium ion cell was examined at the assembled state using CT methods, afterwards the cell components were separated and examined separately in more detail. The following Table 1 summarizes the parameters specified/given by the cell manufacturer:
LiFun 150 mAh sodium-ion cell parameters.
| Cell | Value |
|---|---|
| Capacity | 150 mAh |
| Voltage range | 2.5–4.0 V |
| Cell stack type | Pouch cell with wound stack |
| Dimension | 19.5 mm × 31 mm × 5.8 mm |
| Cathode | |
| Material | NaMO2 |
| Active material ratioa | 95.2 |
| Press density | 3 g/cm3 |
| Coating weight | 16 mg/cm2 |
| Areal capacity | 1.79 mAh/cm2 |
| Coating area | 109.2 cm2 |
| Coating thickness single side | 53.5 µm |
| Anode | |
| Material | Hard carbon |
| Active material ratioa | 95.5 |
| Press density | 0.83 g/cm3 |
| Coating weight | 7.88 mg/cm2 |
| Areal capacity | 2.15 mAh/cm2 |
| Coating area | 123.2 cm2 |
| Coating thickness single side | 95 µm |
-
aActive material without binder and carbon black.
3.3 Electron microscopy
In this study, scanning electron microscopy was utilized to investigate the surface and cross-sectional morphology of sodium-ion battery electrodes. To prevent exposure to ambient conditions and minimize potential alterations of sensitive features, electrodes were extracted from the cell and transferred to the SEM chamber using an inert gas transfer shuttle. This approach ensured that the native state of the electrodes remained unaltered during analysis. SEM was employed due to its capability to resolve fine structural details at nanometer resolution, making it ideal for studying particle morphology, agglomeration, and potential cracking or delamination within the electrode material. Secondary electron contrast (SE) imaging was used to capture topographical information, while backscattered electron (BSE) imaging provided contrast based on atomic number differences, allowing differentiation of various material phases. Additionally, energy-dispersive X-ray spectroscopy was performed to analyze the elemental composition of the electrode surface. By combining high-resolution imaging with elemental analysis, electron microscopy enables a comprehensive understanding of the microstructural and chemical changes occurring in sodium-ion battery electrodes.
The investigations of the topography and morphology of the negative and positive electrode are shown in Figure 4. The images on the left displays the microstructure of the negative electrode, showing a densely packed arrangement of spherical particles with varying diameters. Larger particles exhibit a rough and partially porous surface morphology, while smaller particles appear to adhere to them, indicating possible agglomeration. The overall structure suggests a high degree of particle packing, which may influence the electrode’s electrochemical performance. At first glance, the hard carbon particles in the negative electrode resemble polycrystalline NMC particles. However, EDX analysis confirms that the anode particles are primarily composed of carbon. As shown in Figure 5, a detailed chemical composition analysis of a selected region within the negative electrode reveals that carbon is the dominant element, while localized accumulations of sodium can be observed on some particles. These sodium-containing structures, likely representing binder material, exhibit a weight fraction of approximately two to seven percent. Since the cell has not yet undergone cycling, the observed sodium likely originates from the initial electrode formation process and the binder material. Furthermore, subsequent testing of coin cells made from the electrode material, based on half-cell electrical curves compared to sodium metal, confirms that the anode material is hard carbon.
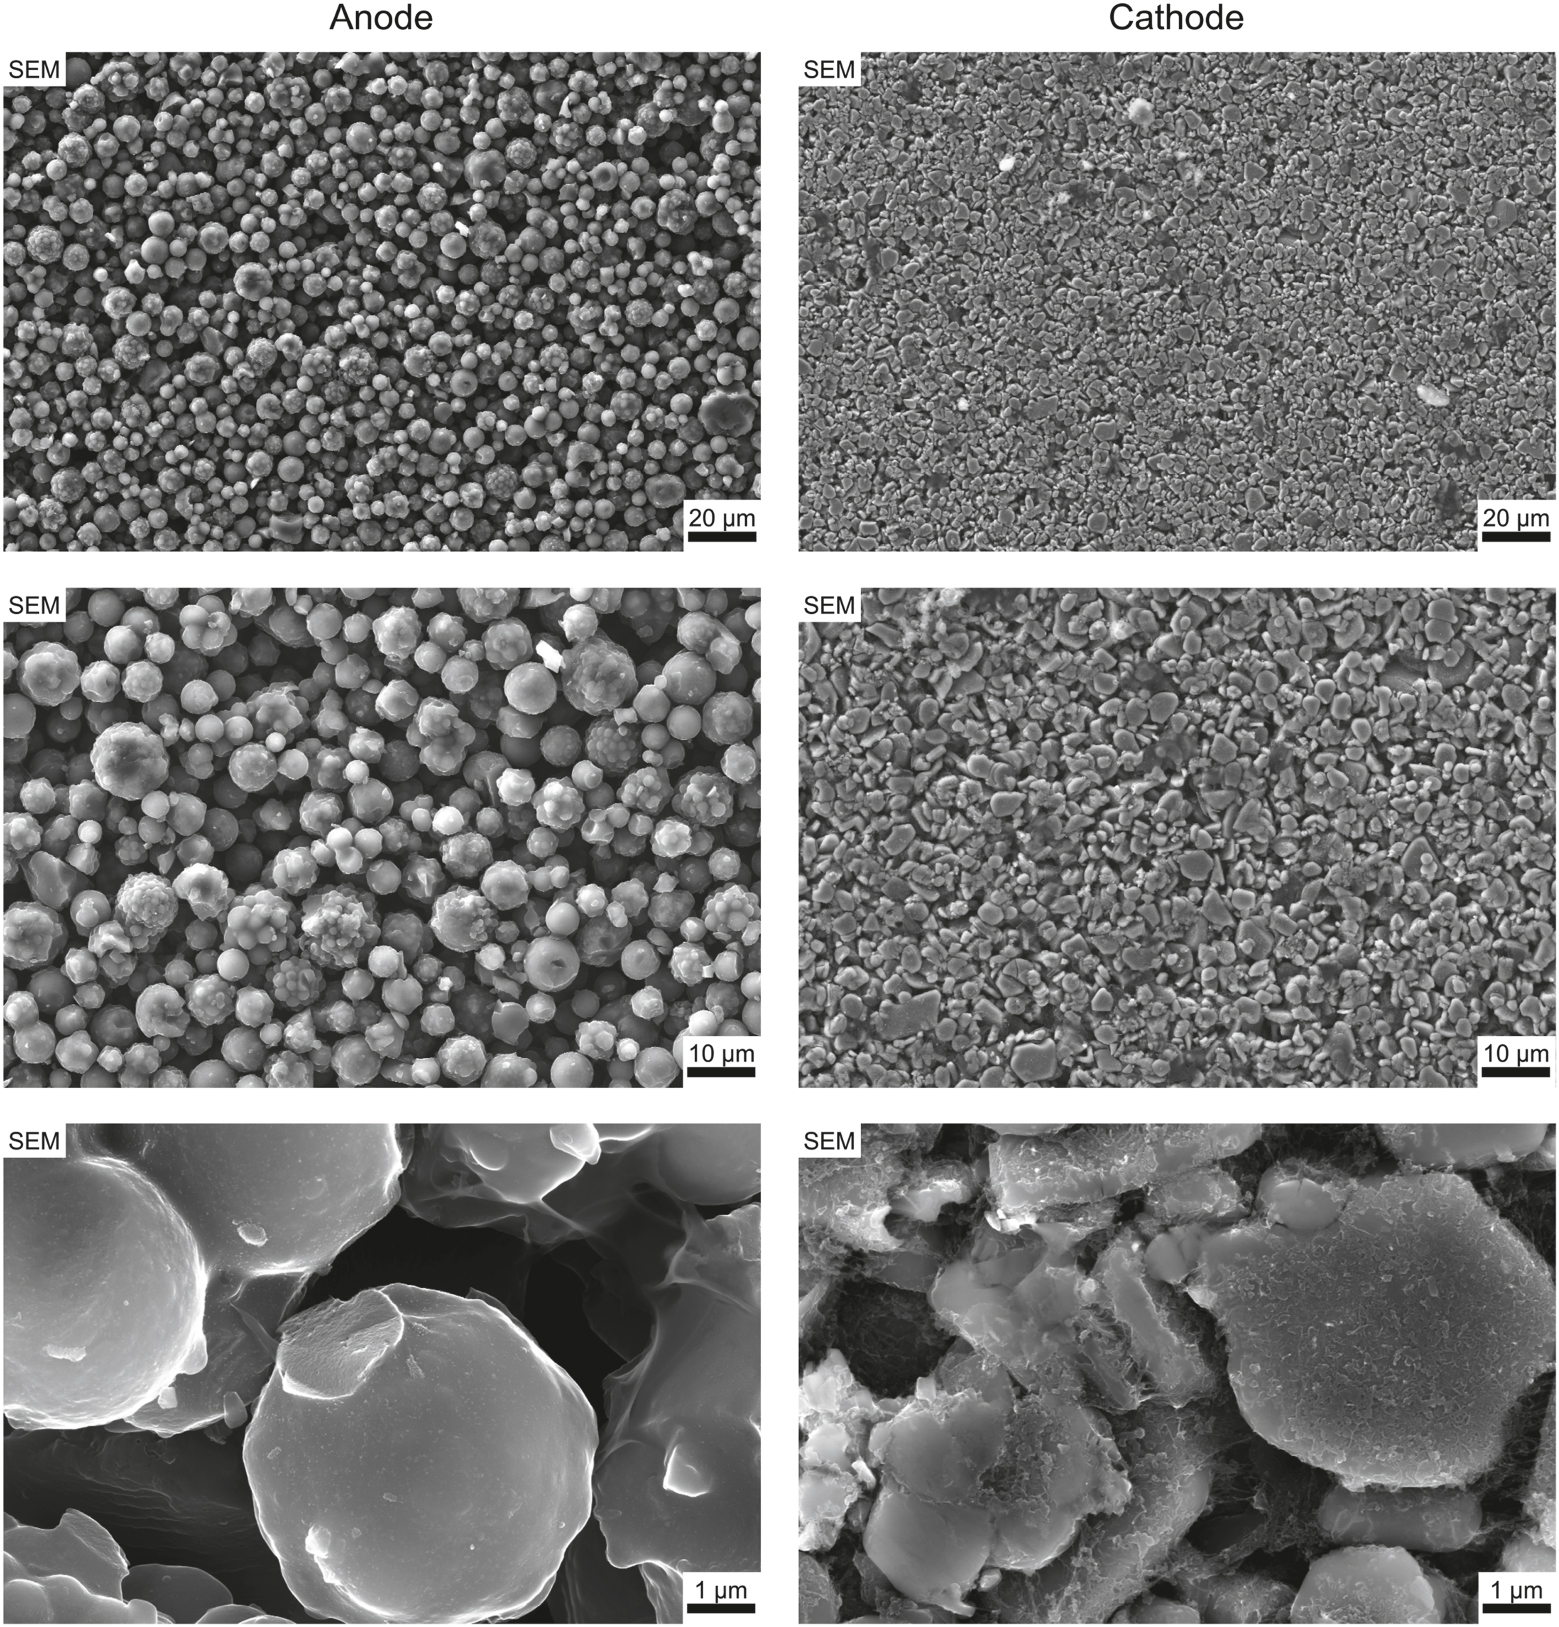
SEM in-lens images depicting the morphology of anode and cathode particles at increasing magnifications. Unlike typical lithium battery materials, the anode consists of round, spherical particles, while the cathode exhibits plate-like structures.
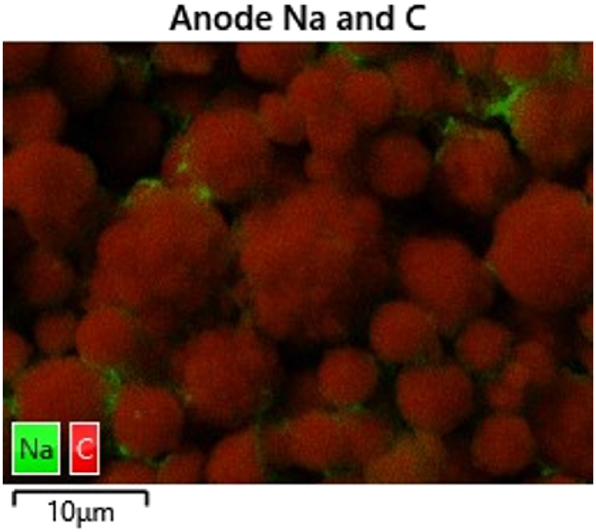
The figure illustrates the chemical composition of a selected region within the negative electrode. The predominant component is carbon, while localized accumulations of sodium can be observed on some particles. These structures, which are likely binder material, exhibit a weight fraction ranging from approximately 2 to 7 percent.
In contrast the images on the right side of Figure 4 present the surface morphology of the positive electrode. The microstructure reveals a densely packed arrangement of irregularly shaped particles with relatively uniform size distribution. In contrast to the negative electrode, where spherical agglomerates dominate, the particles in the positive electrode exhibit more angular and compact forms. This denser packing and reduced porosity suggest a material system optimized for enhanced electronic contact and structural stability. The high degree of interparticle connectivity and uniform coverage across the electrode surface is characteristic of typical cathode architectures, which are engineered to support efficient charge transport and mechanical robustness during repeated cycling. Here, EDX analysis (displayed in Figure 6) shows that the cathode consists of high amounts of oxygen, manganese, iron, nickel, carbon and sodium. Smaller amounts of zinc and calcium mainly in the form of small deposists were also detected by EDX. Hijazi et al. [23] also analyzed a layered oxide sodium-ion cell made by LiFun Technology and calculated the stoichiometry of the material to be NaCa0.03[Mn0.39Fe0.31Ni0.22Zn0.08]O2, which is approximately the stoichiometry calculated for the cell shown here.
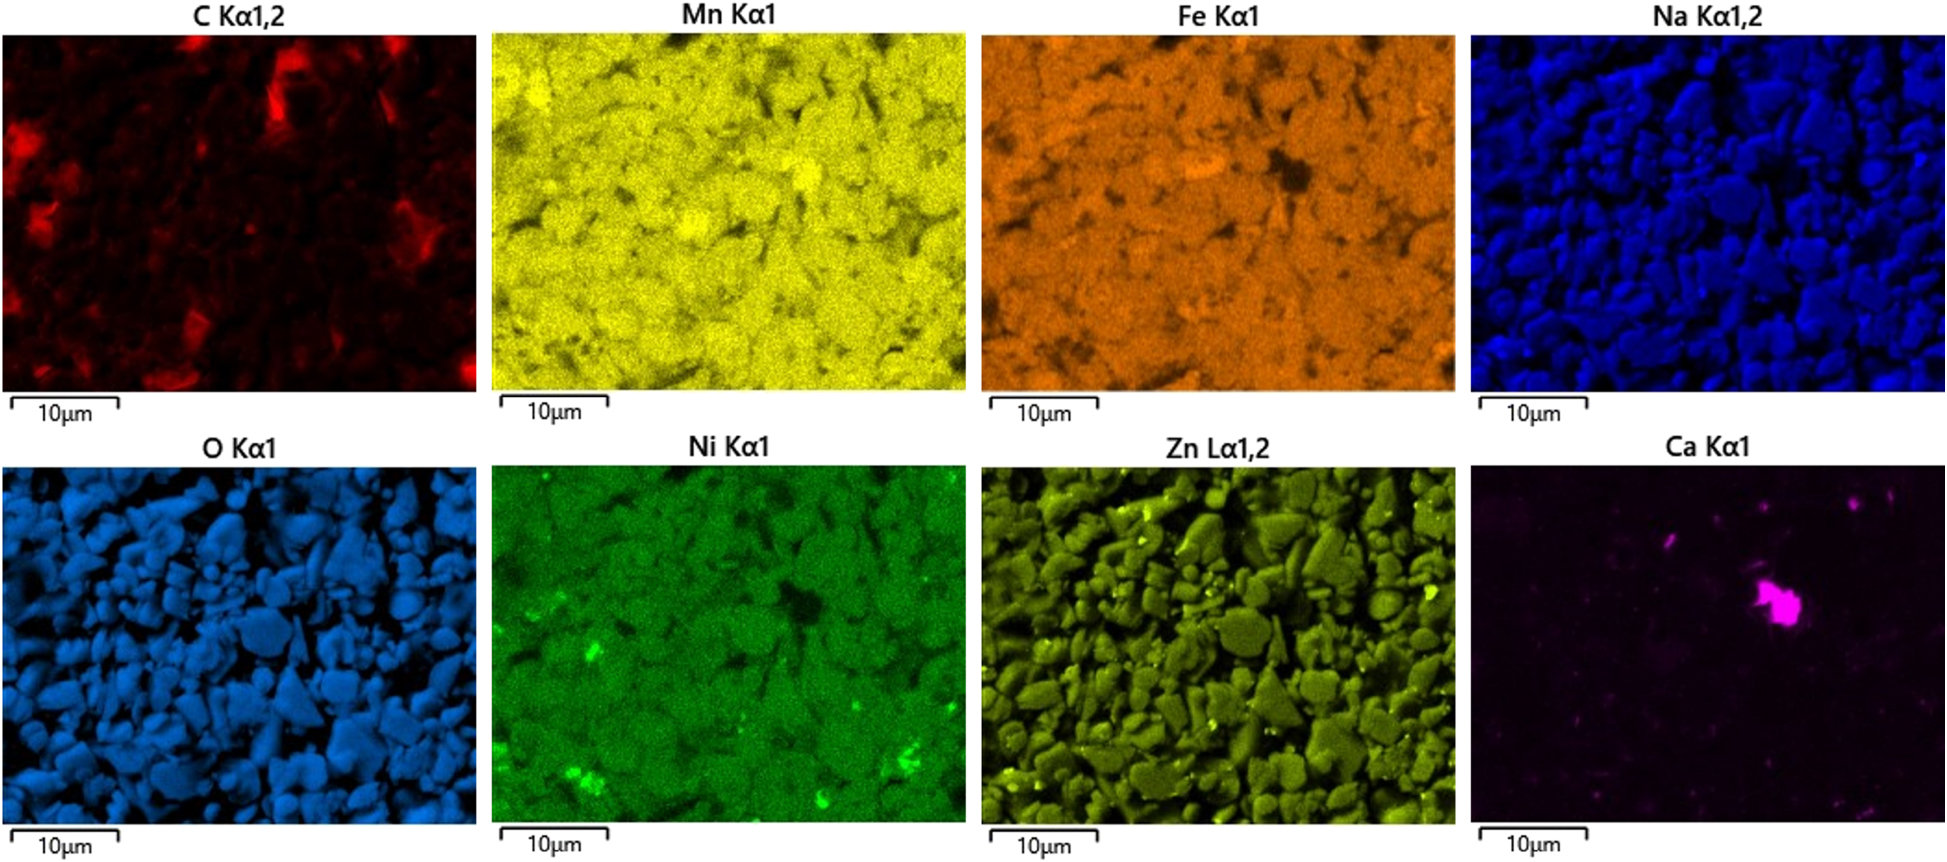
EDX elemental mapping images showing the distribution of Carbon (C), Manganese (Mn), Iron (Fe), Sodium (Na), Oxygen (O), Nickel (Ni), Zinc (Zn), and Calcium (Ca) in the cathode material. The cathode primarily consists of Mn, Fe, and Zn, with residual amounts of Ni and Ca.
3.4 X-ray microscopy
X-ray microscopy provides critical insights into the structural and morphological characteristics of electrode materials in sodium-ion batteries. In this study, XRM was employed to analyze electrode architectures at multiple length scales, from micrometer-scale overview scans to high-resolution nano-computed tomography imaging of individual electrodes and focused ion beam (FIB)-prepared samples. Overview scans were performed to evaluate particle size distributions, spatial heterogeneity, and porosity variations across the electrode surface. Additionally, three-dimensional reconstructions of the electrode microstructure provided a quantitative assessment of porosity, aiding in the correlation between microstructural features and ion transport properties. To achieve the highest spatial resolution, nCT imaging was conducted on single electrode regions of interest. This technique enabled nanometer visualization of active material degradation, pore network evolution, and potential failure mechanisms. Furthermore, FIB-sectioned samples were analyzed using ultra-high-resolution XRM to resolve nanoscale features, including defect formation and particle interconnectivity at the particle level. The combination of multi-scale XRM imaging from overview scans to high-resolution nCT offers a comprehensive understanding of electrode morphology and its impact on battery performance.
The fully charged LiFun pouch cell has a capacity of 150 mAh and operates within a voltage range of 2.5–4.0 V. The cell dimensions are 19 × 31 × 6 mm, consisting of an NaMO2 cathode paired with a hard carbon anode. A 3D overview, along with two slices (top and side) extracted from the 3D volume, is presented in Figure 7. From these slices, one cathode and one anode is extracted for further investigation. Due to the limited spatial resolution in the examination of a full cell, the cathode material structure could not be distinctly visualized. However, some particle deposits within the cathode were identified and will be analyzed in more detail in the following sections. Additionally, the anode exhibits significant foreign inclusions, which partially damage the active material and may negatively impact the overall performance of the cell.
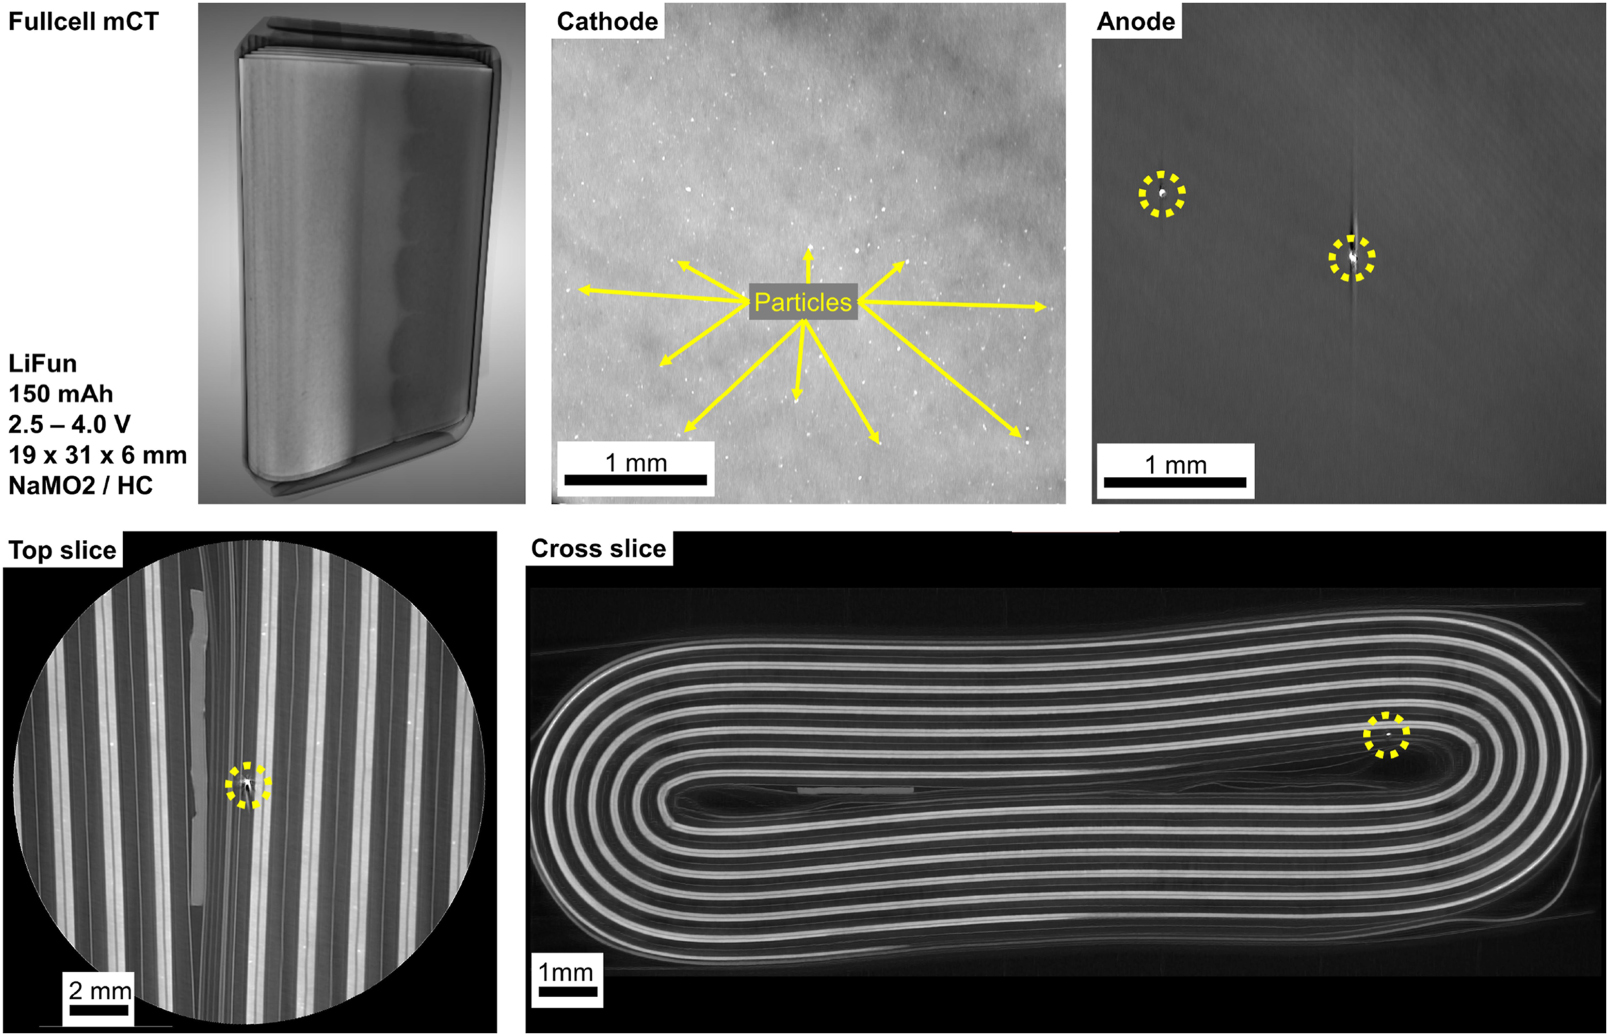
The 3D overview and two slices (top/side) of the fully charged LiFun pouch cell are shown. The NaMO2 cathode and hard carbon anode were analyzed, revealing particle deposits in the cathode and foreign inclusions in the anode, which may negatively impact performance.
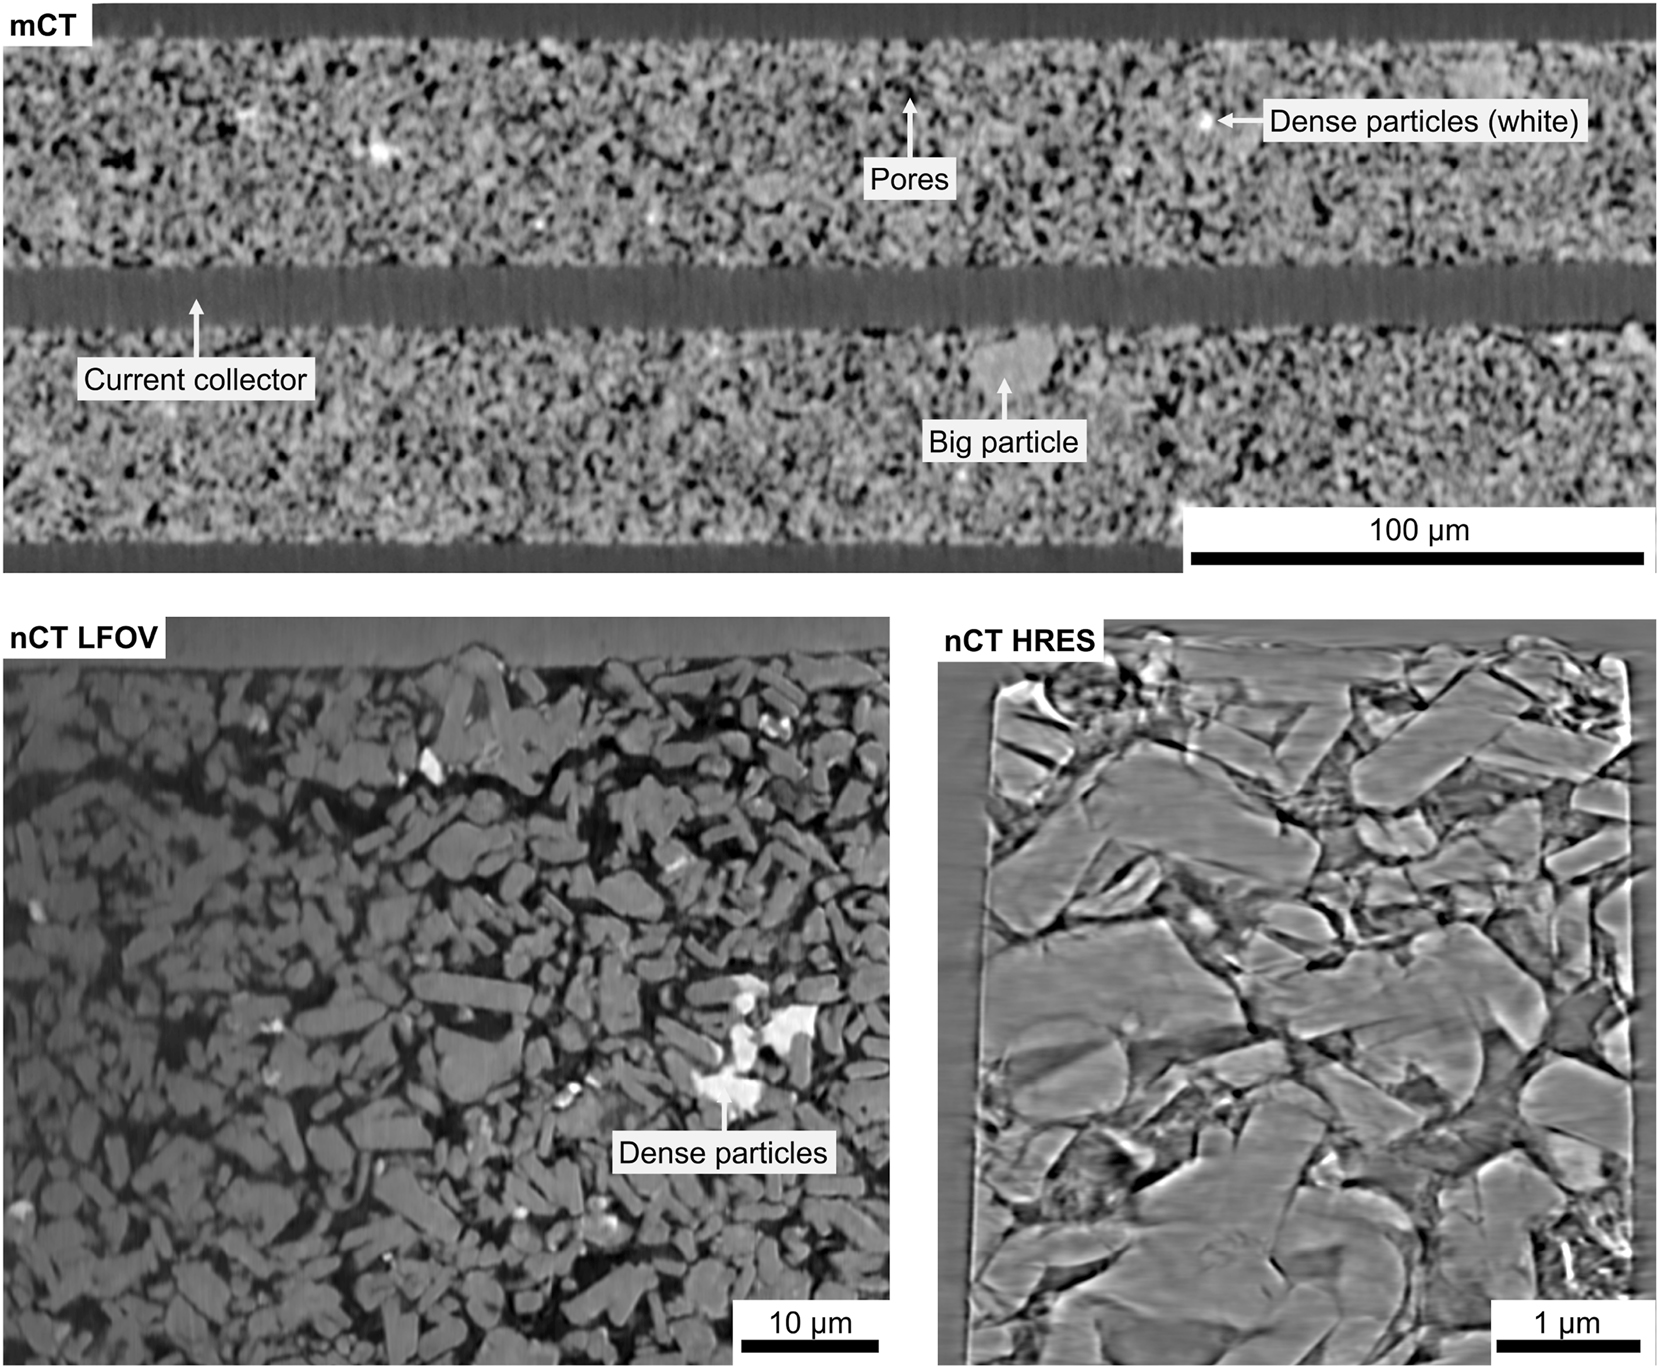
The results from the XRM measurements of the anode are presented in Figure 8. The figure displays data from both Micro-CT and Nano-CT, including large-field and high-resolution scans. Within the mCT volume, defects originating from the manufacturing process can be observed. Specifically, particles from the electrode material have been pushed into the current collector, which could potentially influence the electrical contact and mechanical integrity of the electrode. Overall, the electrode exhibits a highly porous structure composed of predominantly spherical particles with diameters ranging from one to several microns. This porosity is crucial for ion transport and electrolyte infiltration, both of which significantly impact the electrochemical performance. However, it may also introduce potential weaknesses in the mechanical stability of the electrode, particularly under repeated cycling conditions. In contrast to mCT, nCT provides additional phase contrast information, significantly enhancing the visibility of the sodium phase. The analysis reveals the presence of a thin sodium layer surrounding the particles. This layer could play a role in the electrochemical behavior of the anode, either facilitating sodium-ion transport or potentially leading to the formation of resistive interphases over extended cycling. Furthermore, nCT enables a more precise characterization of particle morphology, showing the coexistence of nearly perfect spherical particles alongside larger agglomerates of these spheres, which resemble a cauliflower-like structure. This structural variation could indicate different formation mechanisms or interactions between particles during electrode fabrication. The larger agglomerates may affect the overall packing density and electrical conductivity of the anode, influencing its performance in practical applications.
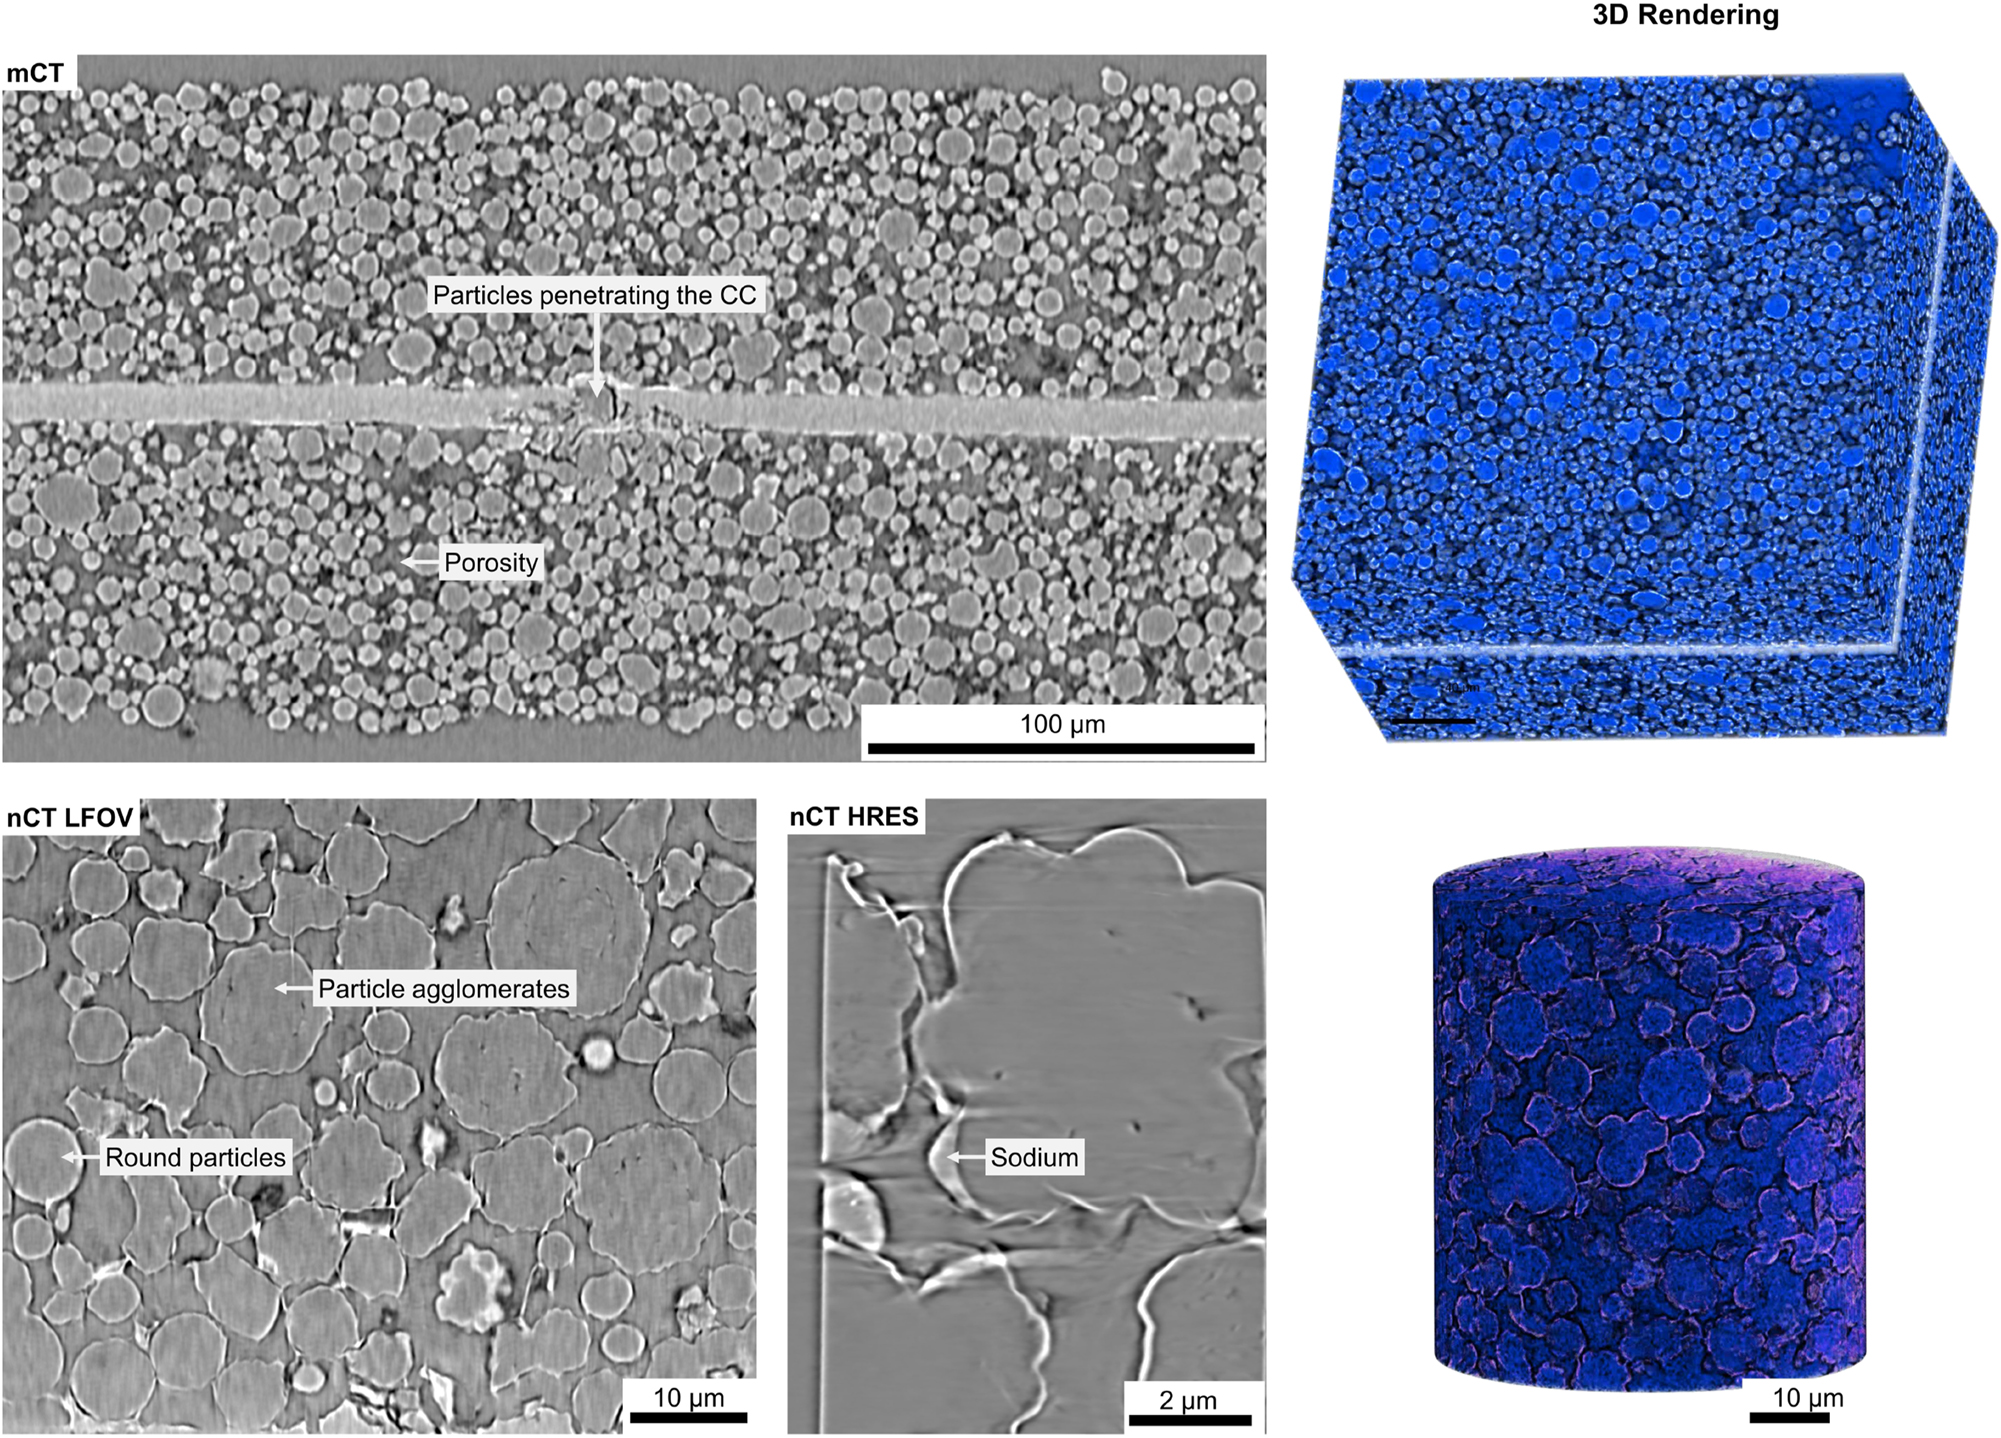
X-ray microscopy results from the anode sample, including Micro-CT, Nano-CT LFOV, and Nano-CT HRes scans. Micro-CT provides a large-scale overview, enabling the analysis of particle size distribution and identification of electrode defects. Nano-CT, with its higher resolution, reveals internal defects within particles and, due to phase contrast imaging, allows visualization of binder distribution between particles.
The results from the XRM measurements of the cathode are presented in Figure 9. In the investigations using Micro-CT, it is challenging to obtain quantitative information about the particle distribution in the positive electrode, as the majority of particles are in the single-micrometer range. The resolution limit of the mCT system is about 500 nm, meaning that only particles with a minimum size of approximately 1–2 µm can be accurately resolved. This limitation makes it difficult to analyze the finer structural details of the cathode material using mCT alone. Compared to the negative electrode, the cathode exhibits a significantly denser packing, with a markedly lower pore volume. The microstructural analysis reveals two distinct particle populations: densely packed small particles, which appear bright in the images and are likely deposits of zinc, nickel and/or calcium, and considerably larger particles ranging from 20 to 30 µm in size. These larger particles are relatively sparse but can be clearly distinguished within the electrode structure. For a more precise determination of particle morphology in the cathode, Nano-CT is essential. Due to its higher resolution and phase contrast capabilities, nCT enables a detailed visualization of the cathode microstructure, revealing that many of the particles adopt thin, rod-like shapes, which are randomly distributed throughout the electrode. Unlike the more spherical or aggregated structures observed in the anode, these elongated particles appear structurally intact, with no visible cracks or defects within their internal structure. This suggests a mechanically stable morphology, which may have implications for the electrochemical performance and long-term stability of the electrode material.
X-ray microscopy results from the cathode sample, including Micro-CT, Nano-CT LFOV, and Nano-CT HRes scans. Micro-CT provides a large-scale overview, enabling the analysis of particle size distribution and identification of electrode defects. Nano-CT, with its higher resolution, reveals internal defects within particles and, due to phase contrast imaging, allows visualization of binder distribution between particles.
In addition to the investigations of the electrodes, nCT provides a valuable tool for studying the separator used in the system. Due to its low X-ray absorption, the separator material can only be effectively analyzed using phase contrast imaging, which enables detailed insights into its microstructure. Without this technique, the weakly absorbing nature of the carbon separator would make it difficult to distinguish its features from the surrounding components. For the separator examined in this study, shown in Figure 10, it is clearly observed that it possesses a coating layer approximately 5 µm thick. This coating may play a critical role in modifying the separator’s electrochemical properties, potentially influencing ion transport, mechanical stability, or wettability. Furthermore, the fibrillar structure of the separator exhibits a well-defined alignment. The fibrils are arranged in a network-like structure, oriented orthogonally to the direction of sodium-ion movement. The combination of high-resolution imaging and phase contrast analysis thus provides essential structural insights into the separator, helping to optimize its design for improved electrochemical performance and long-term stability.
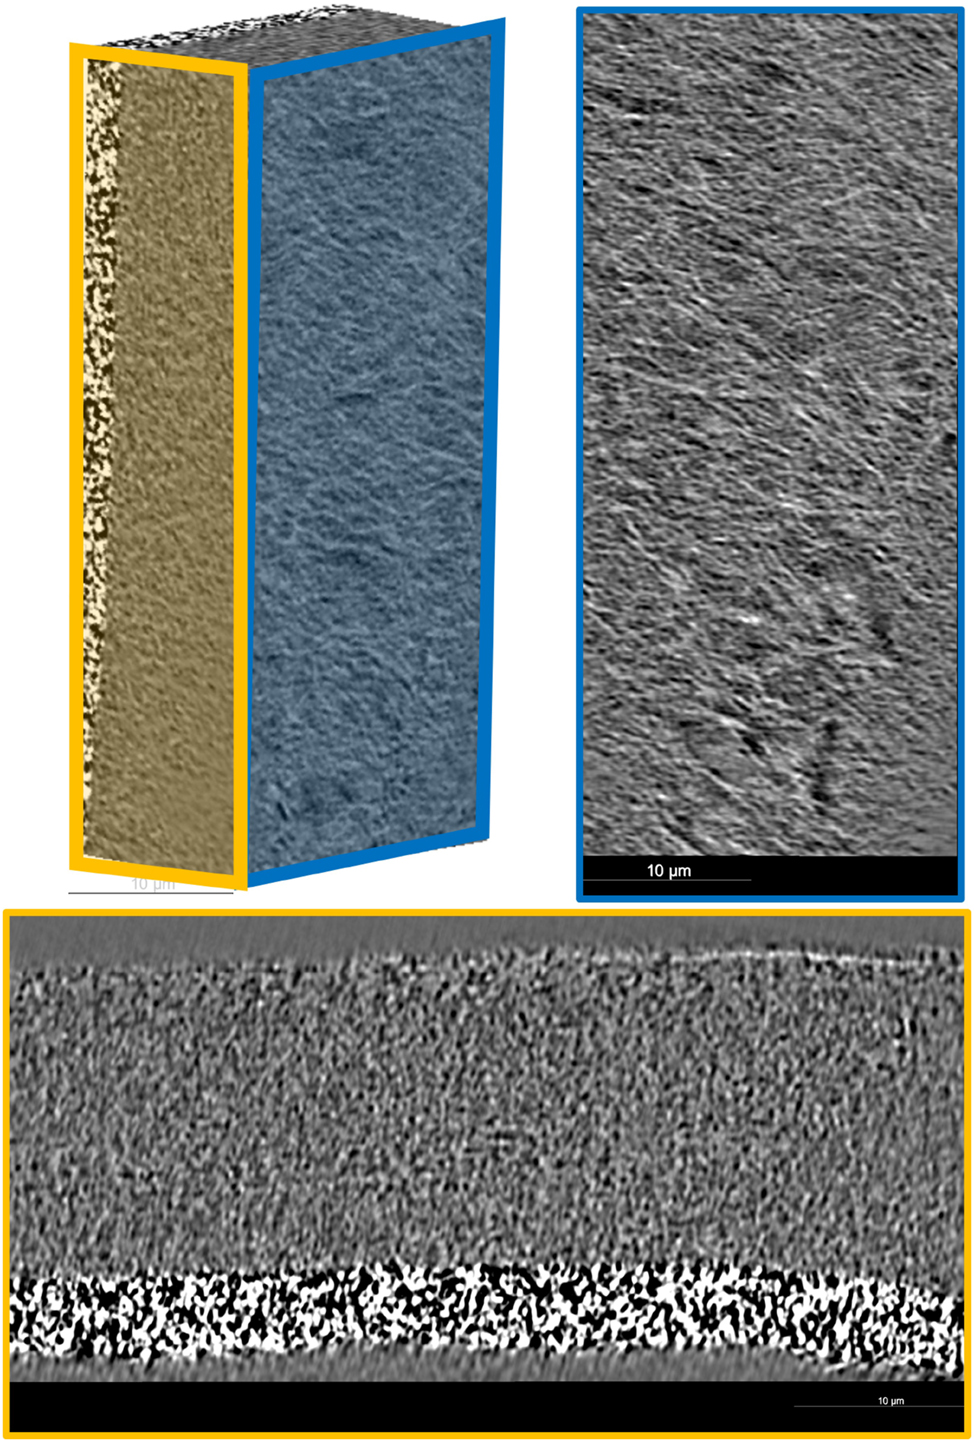
The figure shows the examined separator with a 5 µm thick coating layer. The fibrillar structure is well-defined, forming a network-like arrangement with fibers oriented orthogonally to the sodium-ion movement. High-resolution imaging reveals the detailed morphology and alignment of the fibrils.
4 Summary
The performance and long-term stability of sodium-ion batteries are governed by complex electrochemical and structural changes occurring at the electrode level. This study highlights the importance of a correlative workflow that integrates half cell testing (coin cell two-electrode setup using anode/cathode material vs. a sodium metal chip as reference electrode) with advanced imaging and analytical techniques, including scanning electron microscopy, energy-dispersive X-ray spectroscopy, and X-ray microscopy. Expanding this workflow to include additional techniques such as transmission electron microscopy (TEM), X-ray photoelectron spectroscopy (XPS), time-of-flight secondary ion mass spectrometry (ToF-SIMS) or Raman spectroscopy could further enhance the spatial, chemical, and structural understanding of battery materials and interfaces. By combining electrical performance evaluation with multi-scale imaging and elemental analysis, this approach provides a comprehensive understanding of electrode behavior, degradation mechanisms, and failure modes.
The integration of electrochemical data with high-resolution imaging enables direct correlation between capacity fade, structural evolution, and chemical composition changes in both anode and cathode materials. XRM offers non-destructive three-dimensional insights into electrode architecture, while electron microscopy techniques provide high-resolution imaging of surface morphology and cross-sectional analysis. This multi-modal methodology facilitates a deeper understanding of sodium-ion battery degradation pathways, informing material optimization strategies and improving battery performance.
This study underscores the necessity of a correlative analysis framework in battery research, enabling a more holistic approach to diagnosing performance limitations and guiding the development of next-generation sodium-ion batteries.
Acknowledgments
The authors would like to thank Kevin Kistermann for his support in the preparation of the nCT pillars, which are essential for high-resolution XRM investigations.
-
Research ethics: Not applicable.
-
Informed consent: Not applicable.
-
Author contributions: All authors have accepted responsibility for the entire content of this manuscript and approved its submission.
-
Use of Large Language Models, AI and Machine Learning Tools: None declared.
-
Conflict of interest: All other authors state no conflict of interest.
-
Research funding: None declared.
-
Data availability: Not applicable.
References
[1] A. Kampker and H. H. Heimes, Elektromobilität, Berlin, Heidelberg, Springer, 2024.10.1007/978-3-662-65812-3Search in Google Scholar
[2] N. Yabuuchi, K. Kubota, M. Dahbi, and S. Komaba, “Research development on sodium-ion batteries,” Chem. Rev., vol. 114, no. 23, pp. 11636–11682, 2014. https://doi.org/10.1021/cr500192f.Search in Google Scholar PubMed
[3] M. Rehm, M. Fischer, M. R. Gomez, M. Schütte, D. U. Sauer, and A. Jossen, “Comparing the electrical performance of commercial sodium-ion and lithium-iron-phosphate batteries,” J. Power Sources, vol. 633, 2025, Art. no. 236290. https://doi.org/10.1016/j.jpowsour.2025.236290.Search in Google Scholar
[4] H. Laufen, et al.., “Multi-method characterization of a commercial 1.2 ah sodium-ion battery cell indicates drop-in potential,” Cell Rep. Phys. Sci., vol. 5, no. 5, 2024, Art. no. 101945. https://doi.org/10.1016/j.xcrp.2024.101945.Search in Google Scholar
[5] C. Zeiss, Resolution of a 3d x-ray microscope – defining meaningful resolution parameters for xrm, Oberkochen, ZEISS, 2013.Search in Google Scholar
[6] H. Villarraga-Gómez, et al.., “Assessing rechargeable batteries with 3d x-ray microscopy, computed tomography, and nanotomography,” Nondestr. Test. Eval., vol. 37, no. 5, pp. 519–535, 2022. https://doi.org/10.1080/10589759.2022.2070165.Search in Google Scholar
[7] M. Schütte, et al.., “First full cell parameterization of a commercial layered oxide/hard carbon sodium-ion 18650 battery cell for a physico-chemical model,” J. Energy Storage, vol. 107, 2025, Art. no. 114931. https://doi.org/10.1016/j.est.2024.114931.Search in Google Scholar
[8] V. Marangon, et al.., “Cell design and chemistry of commercial sodium-ion battery cells,” J. Power Sources, vol. 634, 2025, Art. no. 236496. https://doi.org/10.1016/j.jpowsour.2025.236496.Search in Google Scholar
[9] R. Korthauer, Handbuch Lithium-Ionen-Batterien, Berlin, Heidelberg, Springer, 2013.10.1007/978-3-642-30653-2Search in Google Scholar
[10] J. Scharf, et al.., “Bridging nano- and microscale x-ray tomography for battery research by leveraging artificial intelligence,” Nat. Nanotechnol., vol. 17, no. 5, pp. 446–459, 2022. https://doi.org/10.1038/s41565-022-01081-9.Search in Google Scholar PubMed
[11] J. C. Barbosa, et al.., “Unlocking the potential of battery research: advanced characterization of cell components,” Adv. Eng. Mater., vol. 25, no. 2, 2023. https://doi.org/10.1002/adem.202200849.Search in Google Scholar
[12] S. Basak, et al.., “Characterizing battery materials and electrodes via in situ/operando transmission electron microscopy,” Chem. Phys. Rev., vol. 3, no. 3, 2022. https://doi.org/10.1063/5.0075430.Search in Google Scholar
[13] H. Villarraga-Gómez, et al.., “Improving the dimensional accuracy of 3d x-ray microscopy data,” Meas. Sci. Technol., vol. 33, no. 7, 2022, Art. no. 074002. https://doi.org/10.1088/1361-6501/ac5a30.Search in Google Scholar
[14] S. R. Deans, The Radon Transform and Some of its Applications, Mineola, New York, Courier Corporation, 2007.Search in Google Scholar
[15] F. Lutter, et al.., “Combining x-ray nano tomography with focused ion beam serial section imaging — application of correlative tomography to integrated circuits,” Nucl. Instrum. Methods Phys. Res., Sect. B: Beams Interact. Mater. At., vols. 500–501, pp. 10–17, 2021. https://doi.org/10.1016/j.nimb.2021.05.006.Search in Google Scholar
[16] C. Rahe, S. T. Kelly, M. Nourozi Rad, D. U. Sauer, J. Mayer, and E. Figgemeier, “Nanoscale x-ray imaging of ageing in automotive lithium ion battery cells,” J. Power Sources, vol. 433, 2019, Art. no. 126631. https://doi.org/10.1016/j.jpowsour.2019.05.039.Search in Google Scholar
[17] D. Müller, J. Graetz, A. Balles, S. Stier, R. Hanke, and C. Fella, “Laboratory-based nano-computed tomography and examples of its application in the field of materials research,” Crystals, vol. 11, no. 6, p. 677, 2021. https://doi.org/10.3390/cryst11060677.Search in Google Scholar
[18] R. White and S. Kelly, “Correlative, multi-scale, lab-based x-ray tomography: from millimeters to nanometers,” Microsc. Microanal., vol. 26, no. S2, pp. 1002–1003, 2020. https://doi.org/10.1017/s1431927620016621.Search in Google Scholar
[19] S. Frisco, A. Kumar, J. F. Whitacre, and S. Litster, “Understanding li-ion battery anode degradation and pore morphological changes through nano-resolution x-ray computed tomography,” J. Electrochem. Soc., vol. 163, no. 13, pp. A2636–A2640, 2016. https://doi.org/10.1149/2.0681613jes.Search in Google Scholar
[20] P. Bidola, et al.., “Application of sensitive, high-resolution imaging at a commercial lab-based x-ray micro-ct system using propagation-based phase retrieval,” J. Microsc., vol. 266, no. 2, pp. 211–220, 2017. https://doi.org/10.1111/jmi.12530.Search in Google Scholar PubMed
[21] A. S. Kumar, P. Mandal, Y. Zhang, and S. Litster, “Image segmentation of nanoscale zernike phase contrast x-ray computed tomography images,” J. Appl. Phys., vol. 117, no. 18, 2015. https://doi.org/10.1063/1.4919835.Search in Google Scholar
[22] M. P. Mercer, et al.., “Sodiation energetics in pore size controlled hard carbons determined via entropy profiling,” J. Mater. Chem. A, vol. 11, pp. 6543–6555, 2023. https://doi.org/10.1039/d2ta09406a.Search in Google Scholar
[23] H. Hijazi, et al.., “Impact of sodium metal plating on cycling performance of layered oxide/hard carbon sodium-ion pouch cells with different voltage cut-offs,” J. Electrochem. Soc., vol. 170, no. 7, 2023, Art. no. 070512. https://doi.org/10.1149/1945-7111/ace4fa.Search in Google Scholar
© 2025 the author(s), published by De Gruyter on behalf of Thoss Media
This work is licensed under the Creative Commons Attribution 4.0 International License.