Operando XCT with fine sampling of discharge process provides new insights into anode’s morphology evolution in a commercial zinc-air battery
-
Krzysztof Dzięcioł
 ,
Yasin Emre Durmus
,
Yasin Emre Durmus

Abstract
Fine sampling of the discharge process revealed details of the anode’s morphology evolution in a commercial zinc-air battery. With special software developed for laboratory XCT scanners, it was possible to observe and quantify the evolution of individual particles. An operando sequence consisting of 30 tomograms within 30 h of discharge at a low C-rate, resulted in shape changes small enough for successful quantification. Two morphological descriptors, i.e. equivalent diameter and complexity factor, were used to assess the morphology of the particles. Details on underlying mechanisms are provided, including the shrinking-core concept, dissolution and the newly observed anisotropic shrinkage.
1 Introduction
Metal-air batteries are considered cost-effective, environmentally friendly energy carriers [1]. Zinc in particular, as one of the most abundant materials on our planet, offers up to 1,370 Wh/kg of theoretical energy density, while being non-toxic and recyclable [2]. The lack of a fuel compartment, as oxygen is taken from the environment, results however in additional challenges [3], [4]. On top of passivation and corrosion affecting anode [1], air cathode degradation [5] and electrolyte poisoning (CO2) [5], [6] has to be taken into account. Moreover, rechargeability is not achieved yet on a commercial scale, although some promising results are reported [7].In this work, most common primary cell, designed for hearing aids, was investigated. Such a cell consists of a metal housing, a porous carbon-based cathode with manganese dioxide as a catalyst, a current collector and active material in form of zinc powder with particles ranging from a few to hundreds of micrometers. Anode is immersed in the gel-like electrolyte to facilitate the electrochemical circuit. This is visualized in Figure 1 on a segmented tomogram of a partially discharged battery.
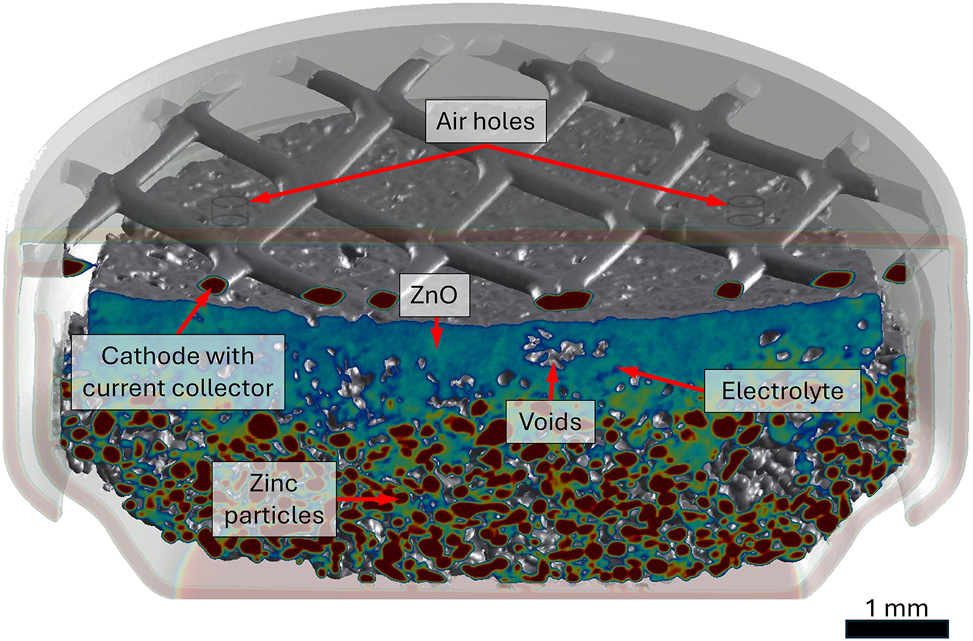
The main components of a primary zinc-air battery for a hearing aid, presented using delineated tomogram of a partially discharged cell. Note that the cathode material is not visible due to very low absorption. Colors were chosen arbitrarily for better separation between pristine and oxidized zinc.
During discharge, zinc is oxidized (Equation (1)) releasing electrons. At the same time, at the cathode, oxygen is reduced, producing hydroxide ions (Equation (1)).
Advanced imaging techniques, particularly X-ray methods, have emerged as powerful tools for investigating and enhancing battery performance due to their non-destructive nature. [8], [9] For instance, Bozzini et al. [10] demonstrated operando chemical-state mapping of dynamic zinc anodes using scanning soft X-ray transmission microscopy with nanometer-scale resolution. Their work revealed significant morphochemical changes related to dendrite formation and electrode degradation. Similarly, Kang et al. [11] utilized operando two-dimensional X-ray imaging to visualize changes in electrodes and electrolytes in zinc–air batteries under various operating conditions. Their findings identified crucial processes such as bubble formation, zinc deposition, and shape changes during charging and discharging. Additionally, Christensen et al. [12] employed spatially and time-resolved synchrotron X-ray diffraction to track the dynamic conversion of zinc and zinc oxide during the cycling of zinc–air batteries. They discovered that reactions begin near the cathode and progress downwards, with zinc redepositing as fine microcrystals. However, a common limitation in these studies is that they primarily focus on two-dimensional observations. Therefore, in addition to these methods, other techniques are needed to gain a deeper understanding of the processes occurring in batteries.
Among other methods, X-ray computed tomography (XCT) emerged as a regular screening technique, providing insight into processes affecting the performance of the primary zinc-air batteries. Franke-Lang et al. [13] utilized a custom-developed cell in a synchrotron XCT to visualize the interactions between changes in zinc morphology, parasitic gassing, and zincate transport during battery operation. Arlt et al. [14] visualized, using laboratory XCT, the discharge process of single Z13 cell and linked it with a theoretical model. Despite a low temporal resolution, i.e. 10 tomograms over 200 h of discharge, he managed to propose the “shrinking-core-concept” explaining the shape change of zinc particles being oxidized. This study was later extended by Hack et al., [15] where 4 cells (PR48) were measured at different C-rates. There, an additional effect, i.e. pore formation, was observed, especially at low C-rates. It was speculated that due to the limited space within the casing, the shrinking-core effect was replaced by an unknown mechanism leading to the dissolution of zinc particles. Again, however, the acquisition frequency was very low, i.e. up to 9 tomograms through the life of the cell. This led to significant differences in the anode morphology and inability to observe the changes within individual particles since they convert or disappear completely between acquisitions. It was noted by the authors that in the future, higher scanning frequency should be used to confirm the findings, preferably by applying synchrotron radiation. So far, however, nothing has been reported. Therefore, in this study, an attempt was made to record the evolution of the anode’s morphology with much finer steps. A laboratory source was used and technical details allowing the seamless acquisition at a high temporal resolution, relative to discharge time, are provided.
2 Materials and methods
2.1 Samples
For experiment a single zinc-air, P312 [16] battery, produced by Varta, was acquired. The cell is composed of a zinc-based powder anode, a separator, a highly viscous alkaline electrolyte, and a carbon-based air cathode with an electrocatalyst. Both the anode and the electrolyte might contain additives. According to the specification, the battery has a nominal voltage of 1.45 V, 190 mA h capacity and should be operated between 0 and 40° Celsius and 25–70 % relative humidity. The cells are normally packed in non-sealed boxes, with just a little sticker covering the air holes at the cathode side. It is therefore not clear how long it can efficiently prevent the air from reaching the catalyst. For this reason, the authors decided to select the “fresh” cell, i.e. with the latest possible expiration date. This approach should guarantee a minimum shelf time and lower the possibility of premature gas intrusion.
2.2 Electrochemical discharge
The battery was operated for around 350 h. The protocol consisted of a 1-h galvanostatic discharge at 2 mA (1/95C) and a 15-min discharge at 5 mA (1/38C). This approach was inspired by the norm DIN EN 60086-2:2016 defining standard testing conditions for hearing aid batteries [16], [17]. In contrast to previous XCT studies [14], [15], [18], a pulsed discharge mode was employed, to better simulate realistic load profiles. The discharge was followed by a 4-h OCV, allowing for 3D imaging. The process was controlled by a Biologic SP300 potentiostat and resulted in the discharge profile depicted in Figure 2a). It is important to note that the discharge time was significantly shorter than the total operating time, due to the 4-h break allowing tomographic data acquisition. In Figure 2b) the clipped, discharge-only profile, excluding the imaging segments, is presented for both applied currents separately. The cell reached the cut-off potential of 1.1 V specified by the norm, after around 170 h of operation corresponding to 30 h of discharge. Interestingly, just after around 18 h of discharge, the potential briefly increased under a 5 mA load. Then, a few hours later, the cell started to fail and eventually reached the cut-off. Note that, after an extended resting time of 48 h, it was possible to discharge the cell further but only with a much lower current, up to 2 mA. This is presented for the sake of transparency; however no quantitative analysis was performed beyond the 30 h of discharge time.
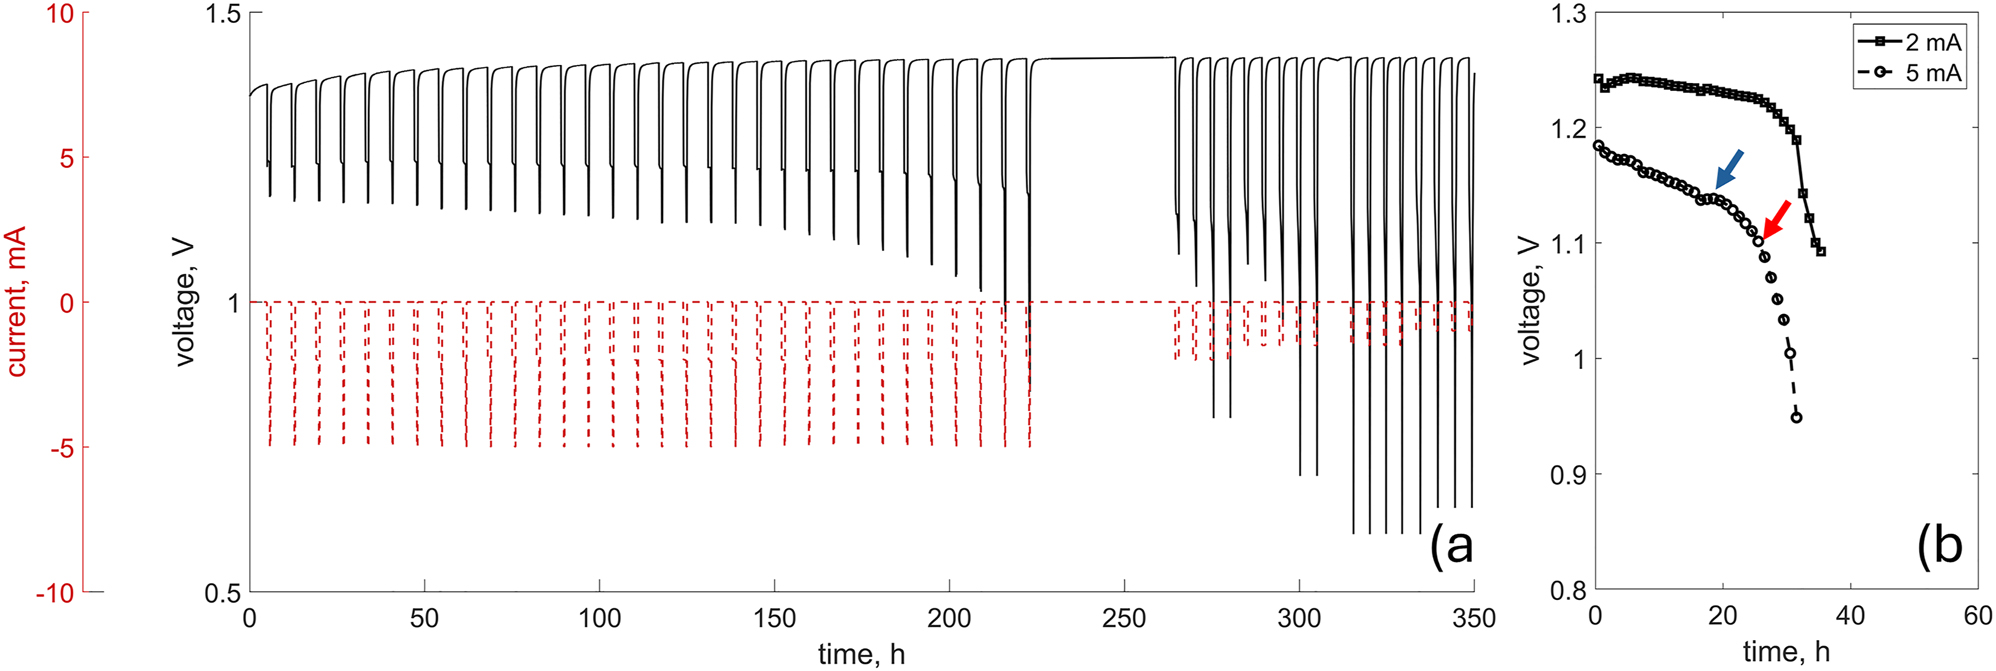
The complete discharge protocol a) and the discharge-only profile for both applied currents b) each point in the discharge-only profile corresponds to the average potential value recorded for given load, i.e. 2 mA or 5 mA. The cut-off and the unexpected potential rise are indicated by red and blue arrows, respectively.
2.3 Imaging
For imaging, a laboratory XCT was used, namely the Zeiss Xradia Versa 620. The anode’s voltage was set to 100 kV and a high-pass filter was applied to prevent beam hardening. Radiograms (2D) were recorded with a 5-s exposure and were used only to monitor the integrity of the cell during the discharge. Tomograms (3D) consisted of 1600 projections each being exposed for 5 s. This resulted in an approximately 2.5-h scan time. Note that this was significantly shorter than the OCV period, allowing the relaxation of the anode and a motion-free acquisition. The final voxel size, i.e. 11 μm, was limited not only by the relatively short acquisition time, but also by the geometry of the testing stand. Due to the dimensions of the standard coin cell holder [19], the source had to be placed as far as 30 mm from the sample. This significantly reduced the geometrical magnification that could be achieved without decreasing drastically the photon count. Note that, unlike the other XCT studies [14], [15], [18], the cell in this case is oriented with the cathode on top and the anode on the bottom. The complete configuration is depicted in Figure 3.
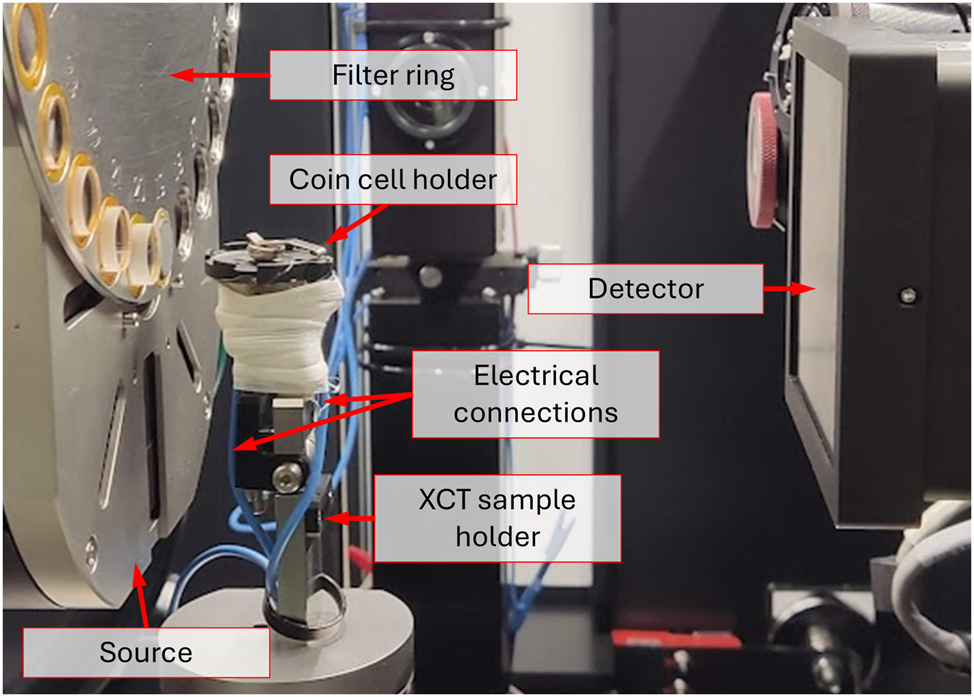
A photograph of the setup for an operando experiment.
2.4 Software development
Both samples were screened using a hybrid, 2D/3D imaging protocol, similar to one published by Dzieciol et al. [20] The laboratory scanners normally don’t offer any flexibility in designing the scanning sequence, especially if interplay with external devices is required. Therefore, special software was first developed. The software, i.e. “Sequence Designer for Xradia with Predefined Blocks” or, in short–XBlox [21], strongly simplifies the protocol design. Moreover, it allows to automate the whole process as imaging can be controlled by external device, i.e. – potentiostat. This is realized by a set of predefined blocks like “Radiogram”, “Tomogram”, “Rotate”, “Move to” etc., which can be interlinked in an arbitrary order via a simple drag-and-drop operation. Additionally, radiography can be monitored in real time, while any set of blocks can be encapsulated inside the nested loops. The user interface with the sequence used for this study is presented in Figure 4. Here, two nested loops were used. The internal one was responsible for continuous radiography and eventual tomography, with the latter being triggered by the failing edge of the signal coming from the potentiostat (current in Figure 2a). This guaranteed the execution of 3D acquisition only if the experiment was switching from discharge to OCV. The outer loop was responsible for re-acquiring the reference image for radiography from time to time. This is important as the X-ray beam profile can change with time and invalidate the old reference. More details can be found in the git repository which the authors are happy to share [21]. Note that the software was exclusively written for one combination of hardware components, i.e. Xradia scanners and Biologic potentiostats. Nevertheless, the authors believe that with access to the source code, its compatibility can be easily extended.
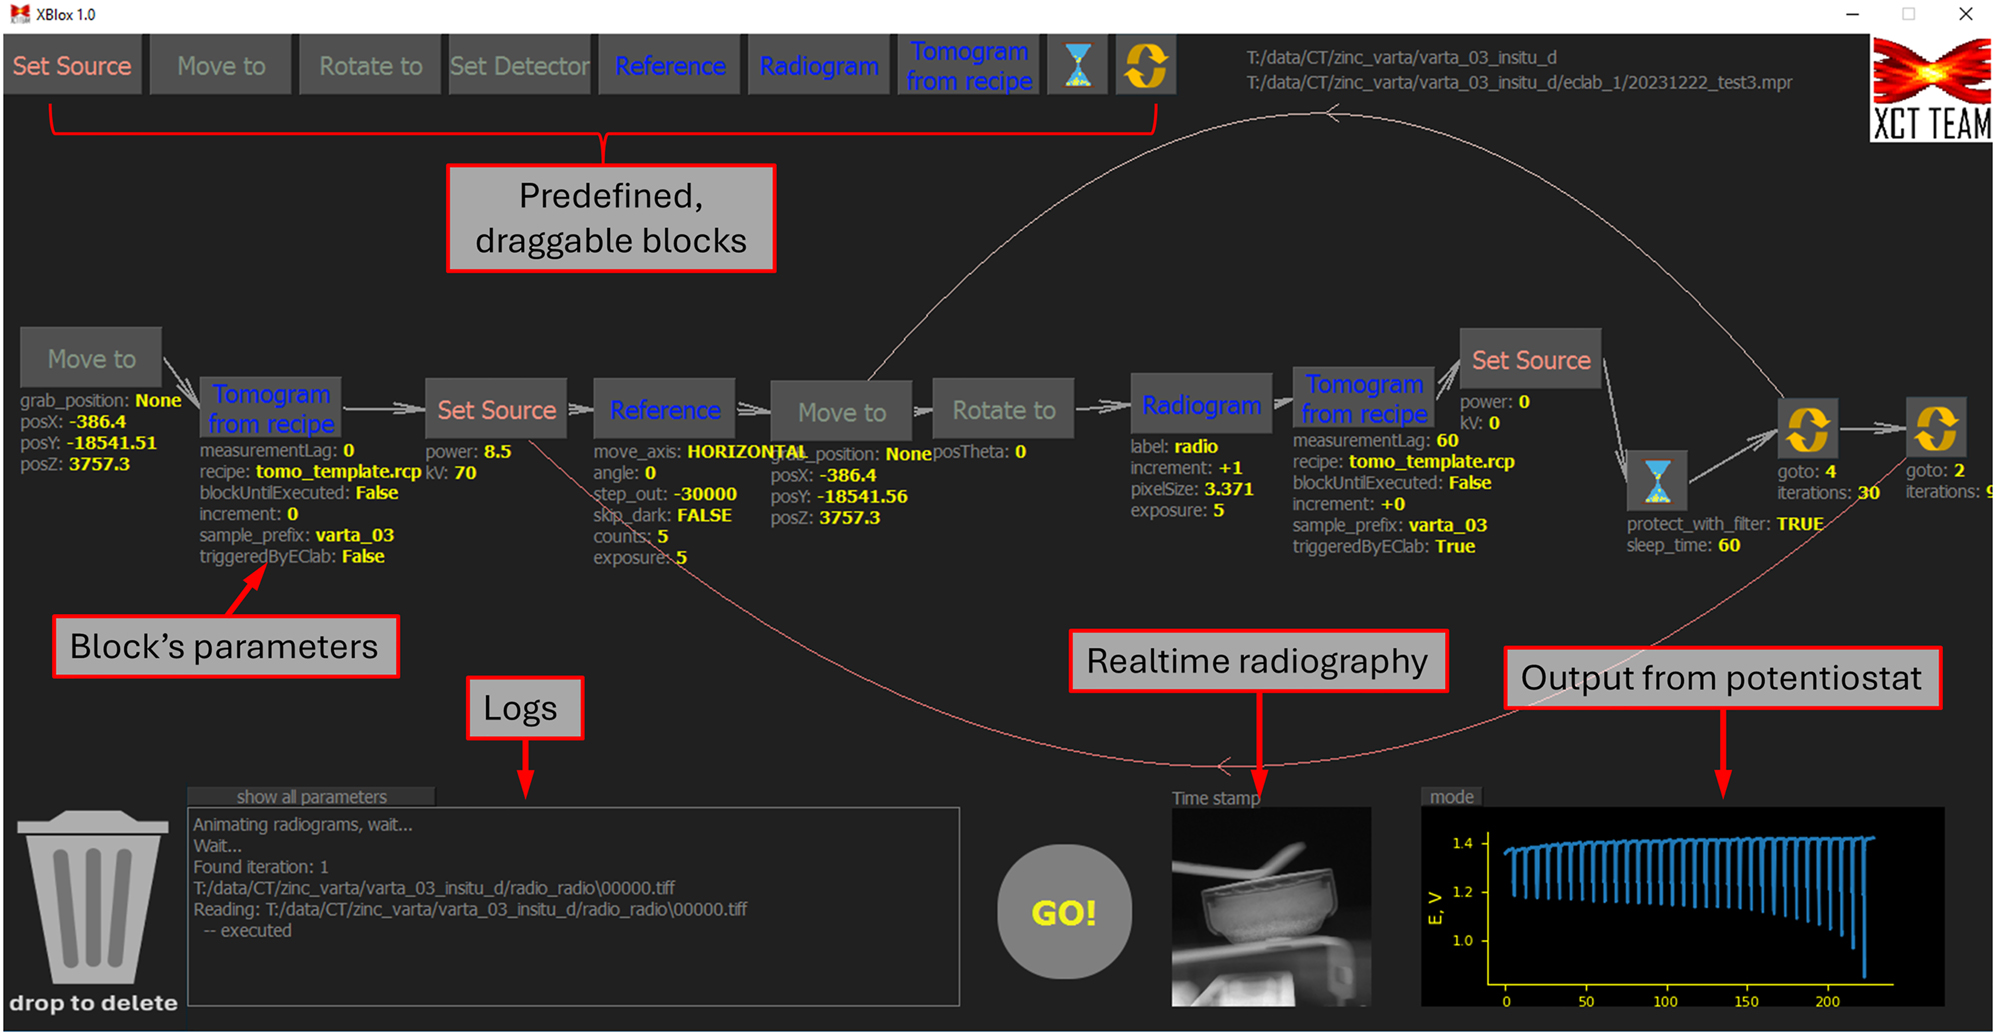
A screenshot of the software interface with the sequence used in this study.
2.5 Post processing
The acquired tomograms were aligned together using rigid registration. Since the movement of particles and expansion of the housing was introducing minor misalignment, the consecutive frames were corrected manually. The cross-sections of selected, aligned tomograms with corresponding timestamps are presented in Figure 5.
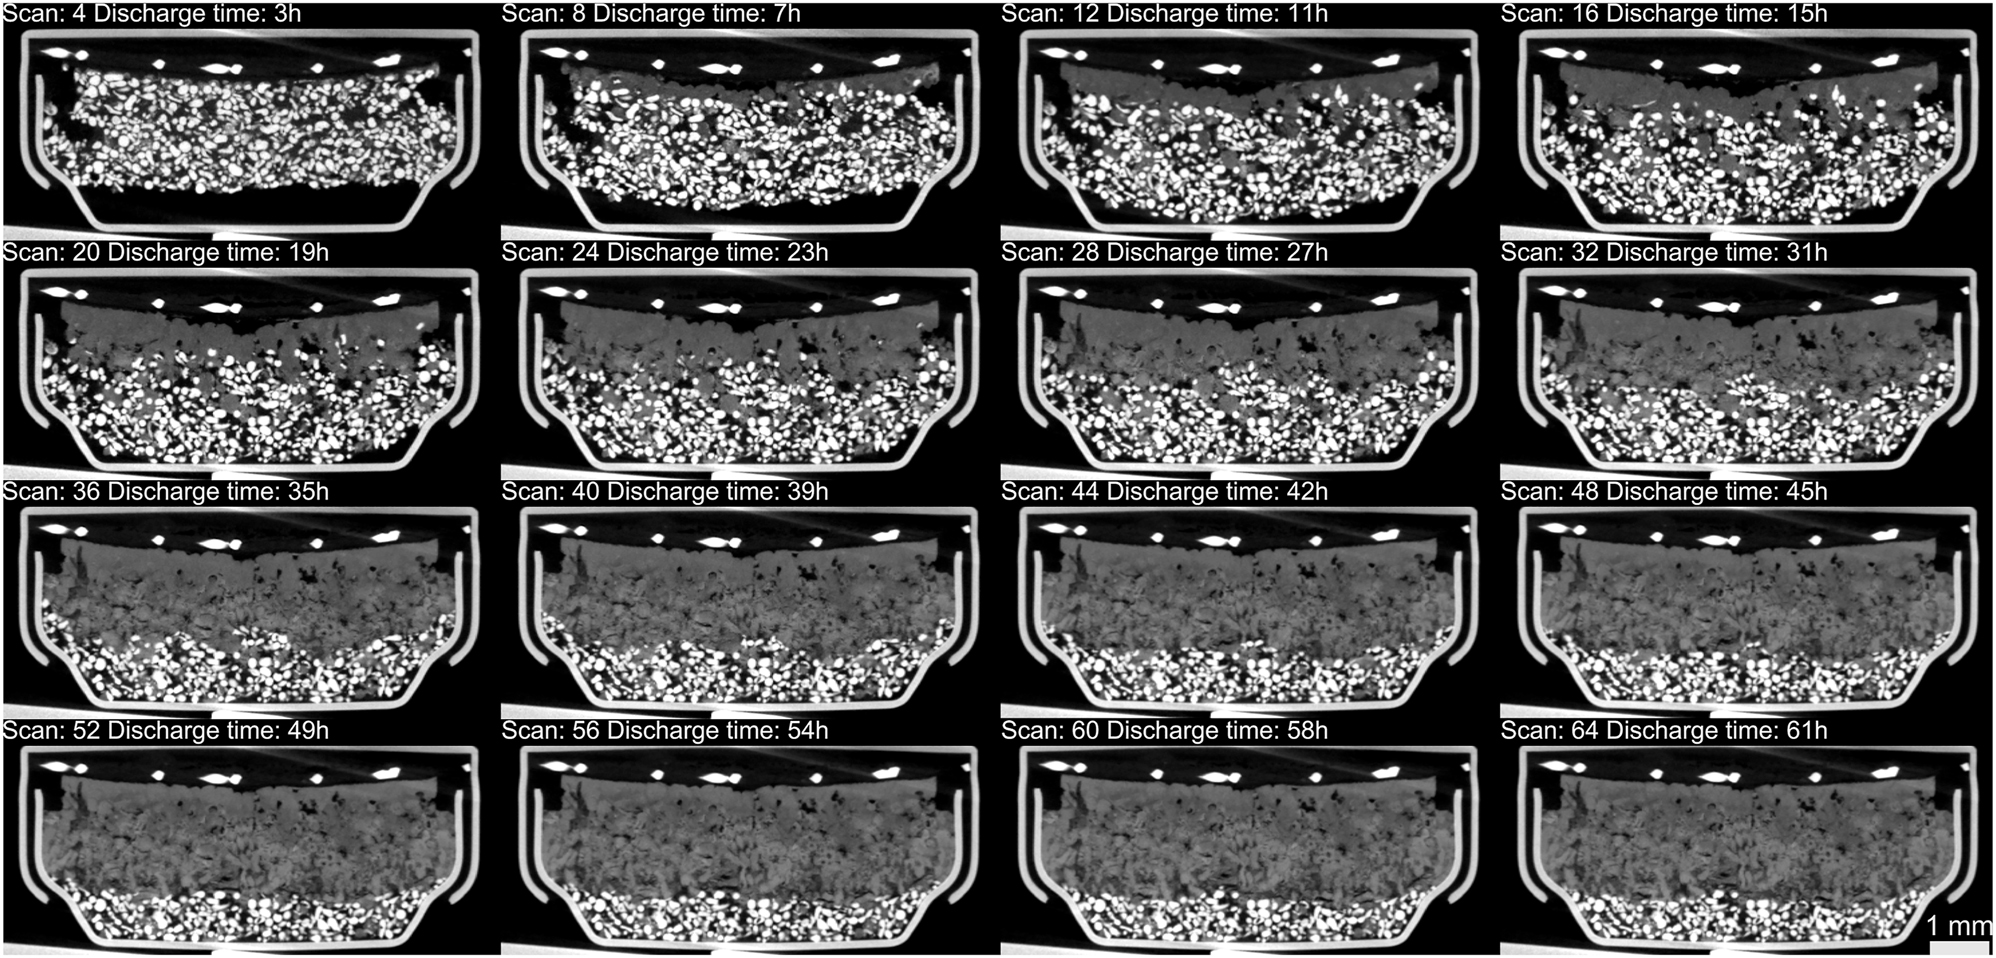
Cross sections of aligned tomograms. White pixels inside the cell housing belong to zinc particles while light and dark gray pixels represent the mixture of oxidized zinc, electrolyte and intermediate species (Zn(OH)4 2−). Note that only every fourth of the acquired tomograms is presented.
A special segmentation strategy was applied to delineate oxides and mixed species from non-converted zinc and housing. First, the combination of thresholding and standard morphological operations (dilation/erosion) was used to extract the housing and the cathode from the anode. Then, since many particles were forming inexplicit interfaces between each other, it was decided to apply machine learning for accurate delineation. Trainable Weka segmentation [22] was used, as implemented in Fiji [23]. This resulted in segmentation depicted in Figure 6. Obviously, not all particles were separated properly, however, a visual inspection of random orthogonal sections revealed that segmentation was successful. Note that just in pristine state, more than 16 k of the particles were detected, so eventual errors should be compensated by high statistical power of the acquired data.
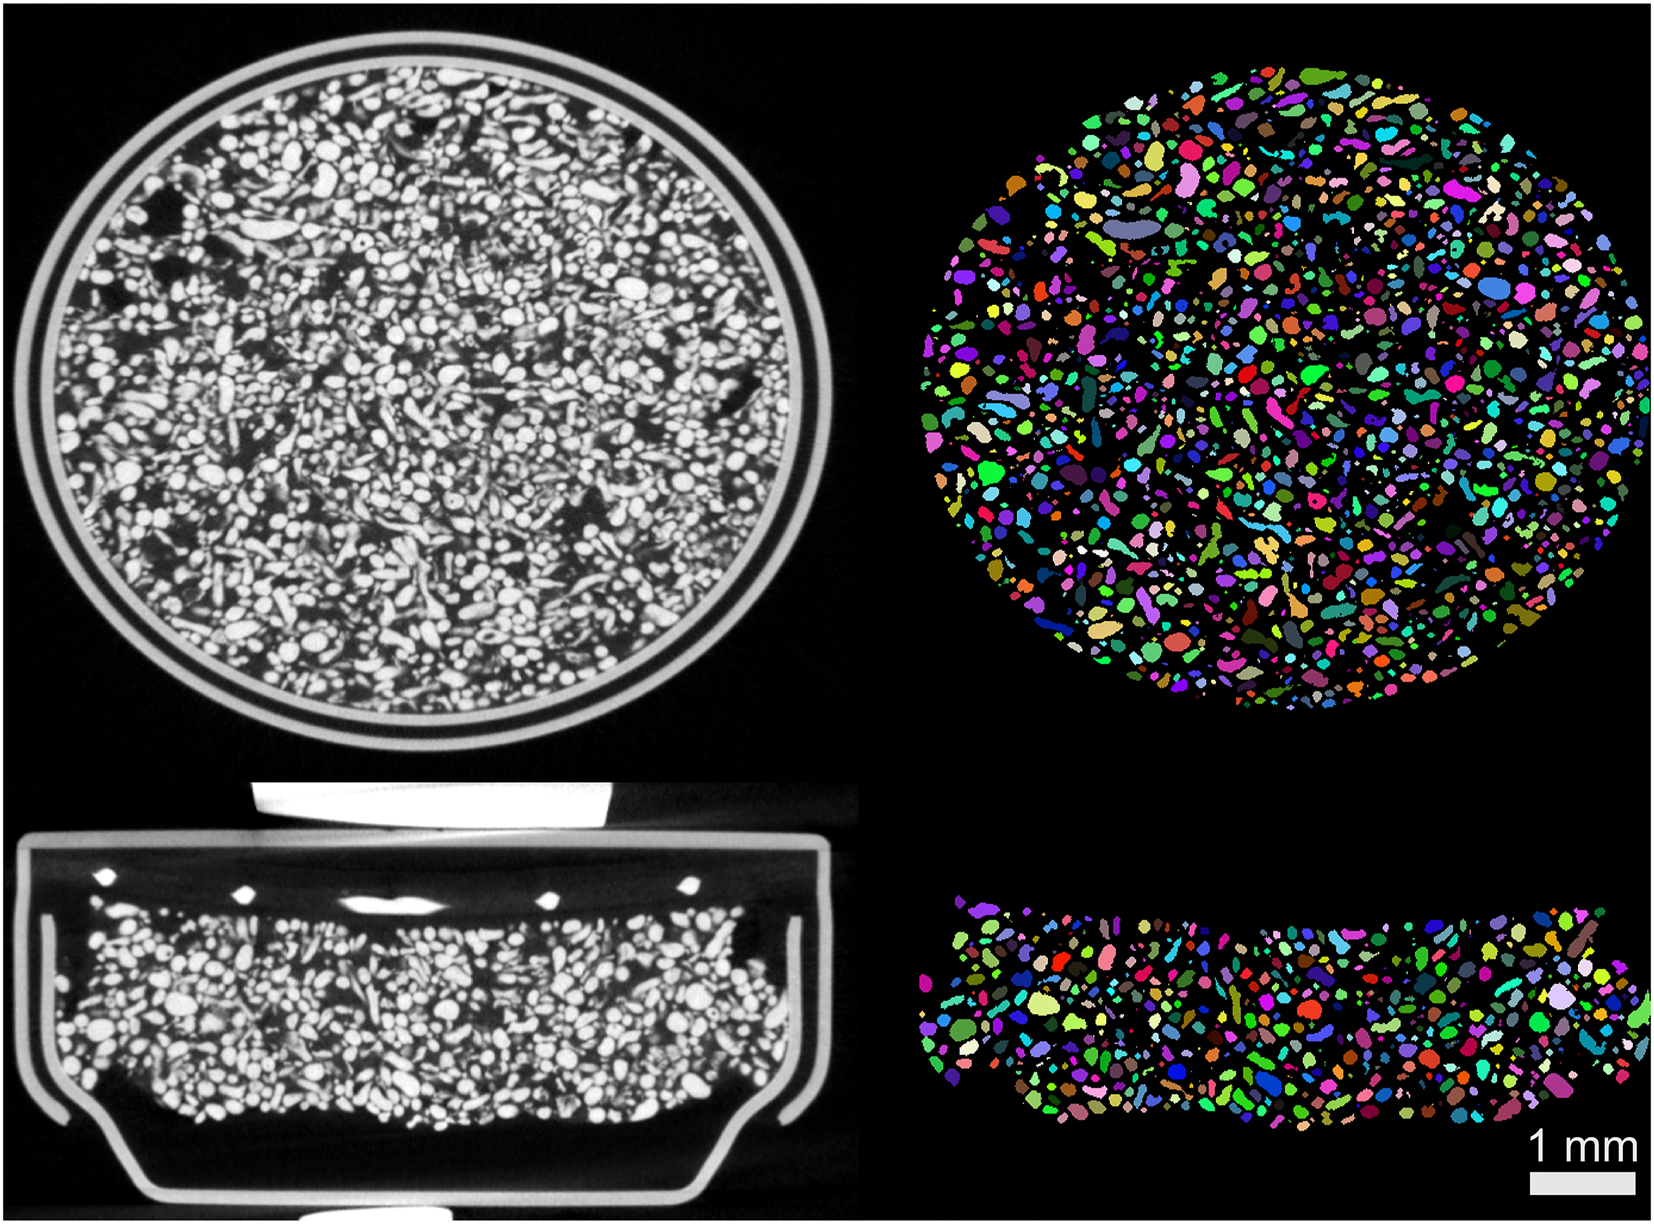
The segmentation results. Note that the delineated particles are assigned with random colors.
To quantify the evolution of single particles, two morphological descriptors were calculated, namely the equivalent diameter and the complexity factor. The former is a diameter of the sphere having the same volume as the object. The latter was defined as a deviation of particle’s shape from equivalent ellipsoid, i.e. having an identical moment of inertia, as described by Isaac et al. [24], where 0 represents the ideal ellipsoid and upper limit is not defined. This descriptor historically was used to quantify the growth of the cavities during creep [24], [25], however it was later applied to characterize e.g. porosity in die cast Mg alloys [26] and recently even to 3D-printed metals [27]. Its advantage over sphericity is that it’s less sensitive to transitions between regular shapes, i.e. spheres, flat ellipsoids and long rods should all have a low complexity factor. Therefore, an increasing value won’t indicate the object transforming into an ellipsoid from a sphere but rather a more radical modification of its topology. Conversely, a decreasing complexity factor should indicate that the surface is becoming smoother, rather than converting from one regular object (ellipsoid) to another (sphere).
In the last step, the particles detected at the pristine stage were tracked until the cut-off. Since the differences between tomograms were (relatively) small, tracking was done simply by looking for the nearest centroid at consecutive stage within certain distance, equal to current diameter of the particle. This finally allowed authors to observe and quantify the changes in morphological descriptors of individual particles from the pristine state until they are oxidized or dissolved in the electrolyte.
3 Results and discussion
The complete discharge process, even beyond the cut-off is visualized in Movie S1. It shows the good quality of the tomograms’ alignment. Moreover, it is clear that the sampling of the discharge profile is fine enough to reveal shape changes without losing particles completely between acquisitions.
Unfortunately, the performance of the tested battery was very low. As shown in Figure 5 and the Movie S1, not even 50 % of the zinc was utilized at the cut-off point, i.e. after 30 h of discharge, resulting in a capacity of approximately 70 mA h, far below the claimed 190 mA h. This contrasts with the results presented by Arlt et al. [14] where almost all the zinc could be easily utilized, however with a battery of a different origin. The reason for this unusual behavior was quickly found, when analyzing the battery integrity at the unusual potential rise recorded between the 18th and the 20th hour of discharge (see Figure 2b). While normally the cathode is invisible on tomograms due to low absorption, an image with adjusted contrast revealed the slow disintegration of the cathode between the 17th and the 19th hour of discharge. It is presented in Figure 7. The authors are unsure of the reason behind this disintegration, but it explains the short lifespan of the battery, which lasted only about 10 more hours after the cathode’s failure. It is also possible that the cathode consisted of multiple layers, and during battery operation, the integrity of these layers may have been compromised, potentially increasing the internal resistance of the battery. As reported previously by Schroeder et al. [18], the flooding of the air cathode can also affect the performance of the battery significantly. The potential flooding of the air cathode was not observed in this study; however, it couldn’t be completely excluded due to the low contrast between cathode’s material and the electrolyte.
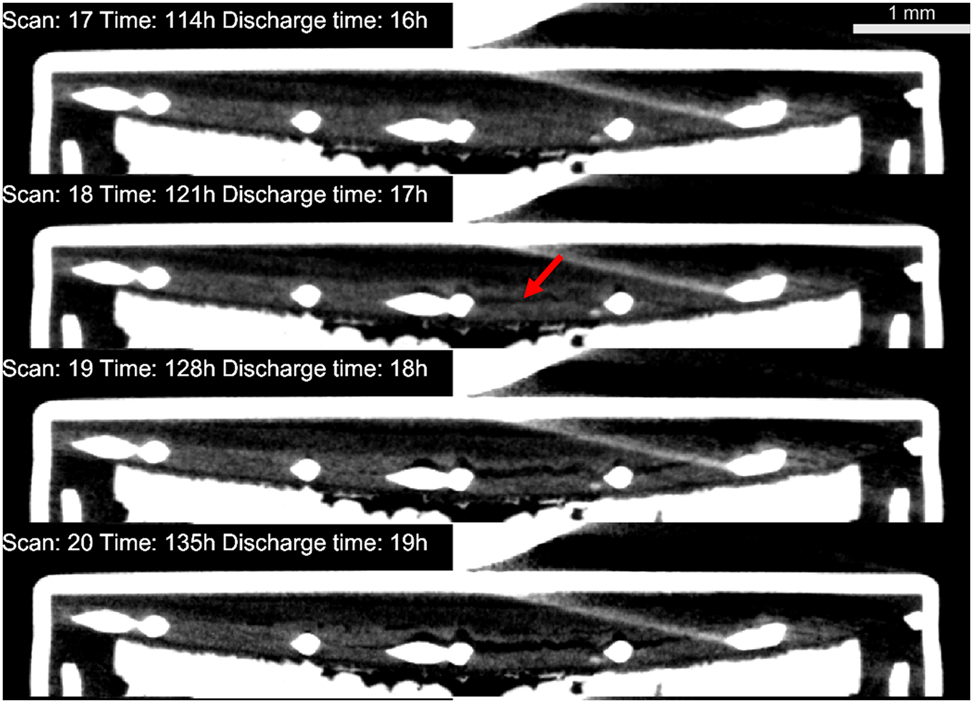
Sectional views of the battery revealing the progressive disintegration of the cathode. The red arrow indicates the region where the discontinuity was first observed.
As shown in Figure 5, the discharge of the cell converts the initial Zn particles into oxide species. This electrochemical conversion primarily begins with the particles near the separator, most likely due to the readily available hydroxide ions generated from the oxygen reduction reaction at the air cathode. As the Zn oxidizes, the concentration gradient of the hydroxide ions gradually increases towards the bottom lid of the cell. Simultaneously, the remaining Zn particles are pushed downward due to the volume expansion. Therefore, as illustrated in the last image of Figure 5, the active particles that remain are located at the bottom of the cell.
The volume fractions, presented in Figure 8a, show the expected symmetry between zinc and oxides. Increase in latter is followed by decrease of the former, as already reported by other studies [14]. On the other hand, the porosity at the beginning increases at the expense of the electrolyte, which suggest the effect of zinc particles dissolution, already observed by Hack et al. [15].
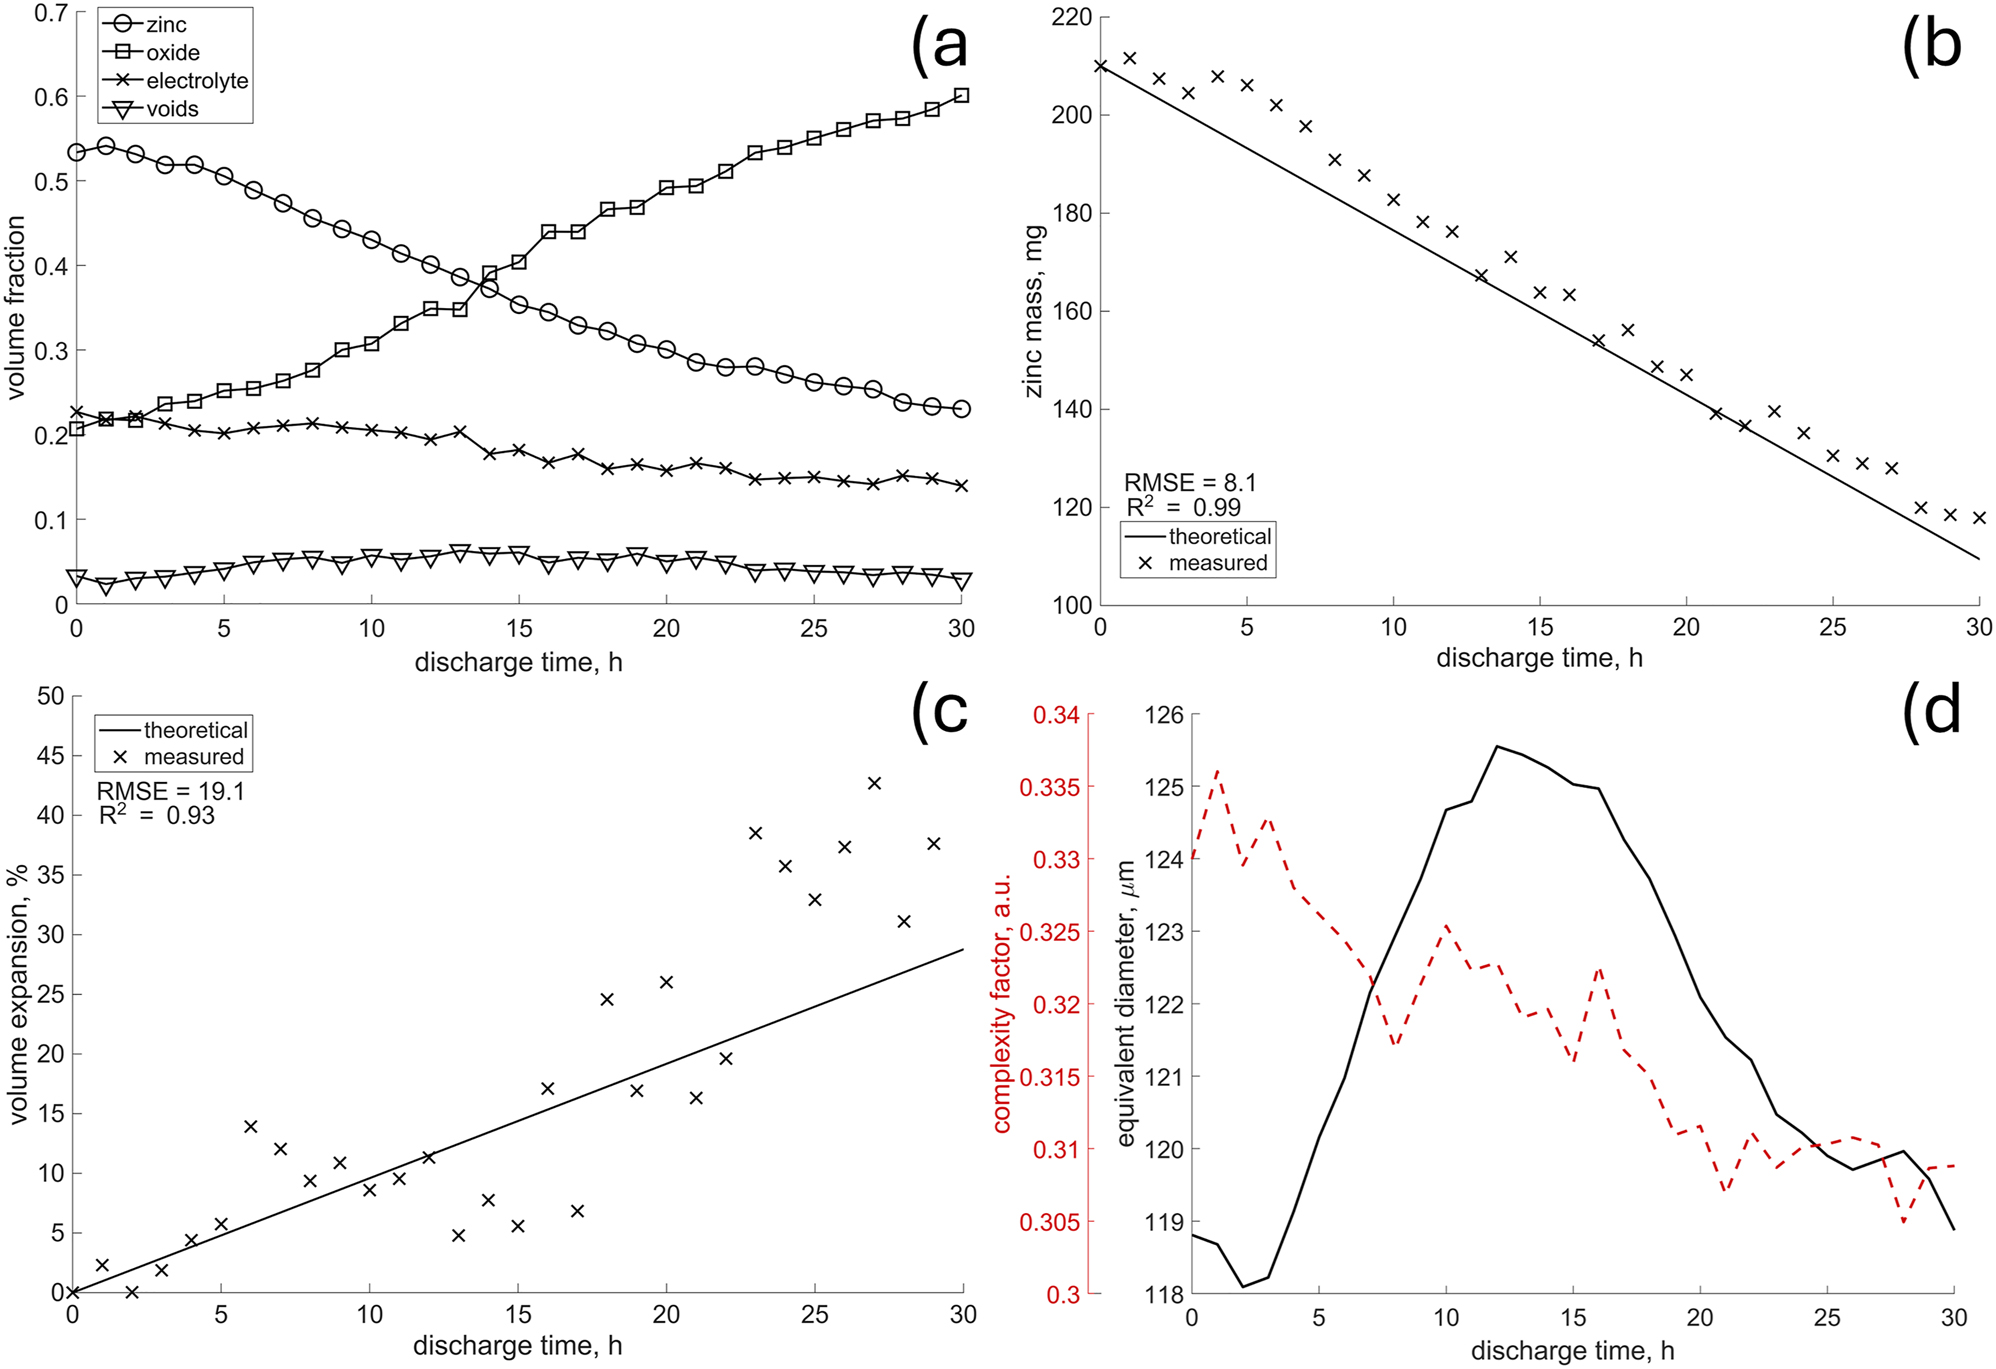
The evolution of the anode’s morphology over the discharge time, i.e. volume fractions a) active material mass b) anode’s volume expansion c) and shape descriptors of particles d) the calculated standard deviation for the complexity factor and equivalent diameters were 0.1 and 40, respectively.
According to the delineated tomogram of pristine state, the anode mixture consists of approximately 55 % zinc, 23 % electrolyte, and 22 % oxides, along with some pores, as illustrated in Figure 8a. The initial presence of oxidized particles (nearly 20 % as shown in Figure 8a) may seem surprising at first. However, a visual inspection of the pristine tomogram presented in Figure 6 reveals multiple voxel clusters that can be interpreted as oxides.
The authors are uncertain about the initial additive content of the battery; therefore, the potential additives were excluded from further discussion. Nevertheless, to assess the influence of unknown chemistry on presented results, additional metrics were calculated. First, the amount of converted zinc was estimated using the specific capacity of zinc (820 mA h/g) and applied current, integrated over the discharge time. Then, anode’s volume expansion was calculated, assuming that it consist of Zn and a mixed oxide, i.e. ZnO and Zn(OH)4 2−, following the approach of Arlt et al. [14] These values were compared to those obtained directly from the delineated morphology. Figure 8b shows good agreement with the predicted mass change, though a slight overestimate is evident. However, despite the correct trend (high R2), the anode’s volume expansion, as shown in Figure 8c, exhibits high variance (high RMSE). This is expected, as Figure 6 revealed already regions of varying intensities within the converted zinc, without clear boundaries, indicating inhomogeneous mixing of electrolyte, ZnO, Zn(OH)4 2− and possibly unknown additives. Consequently, precise volume estimation is challenging, as voxels associated with the electrolyte are randomly included or excluded. Note that in both cases, the initial values (anode’s volume and zinc mass) were taken from delineated tomogram of the pristine state.
The analysis of morphological descriptors provides another interesting insight. The average complexity factor, as depicted in Figure 8d, is decreasing with time, hence either particles become more regular, or the complex ones disappear. This suggests different mechanisms affecting different types of particles. Such a hypothesis can be supported by the initial increase of the average particle size (Figure 8d). The high error values, however, indicate a broader and/or multimodal distribution of the morphological descriptors. Therefore, to confirm the hypothesis and disentangle the possible dependence on the initial spatial distribution, bivariate histograms were computed.
This revealed, as shown in Figure 9a and b, that the distribution of particle size has bimodal characteristics. Two peaks are observed, one at 70 μm, and another at 140 μm. These are consistent while increasing distance from the cathode, although just at the cathode, less “small” particles are observed. However, at the cut-off (Figure 9b), histogram looks different–with significantly less “small” particles at each distance from the cathode. It suggests that the rate of consumption of “small” particles cannot be accommodated by the decrease in size of bigger particles. The complexity factor (Figure 9c) does not exhibit the bimodal characteristics, although its peak is shifting visibly towards lower values (Figure 9d).
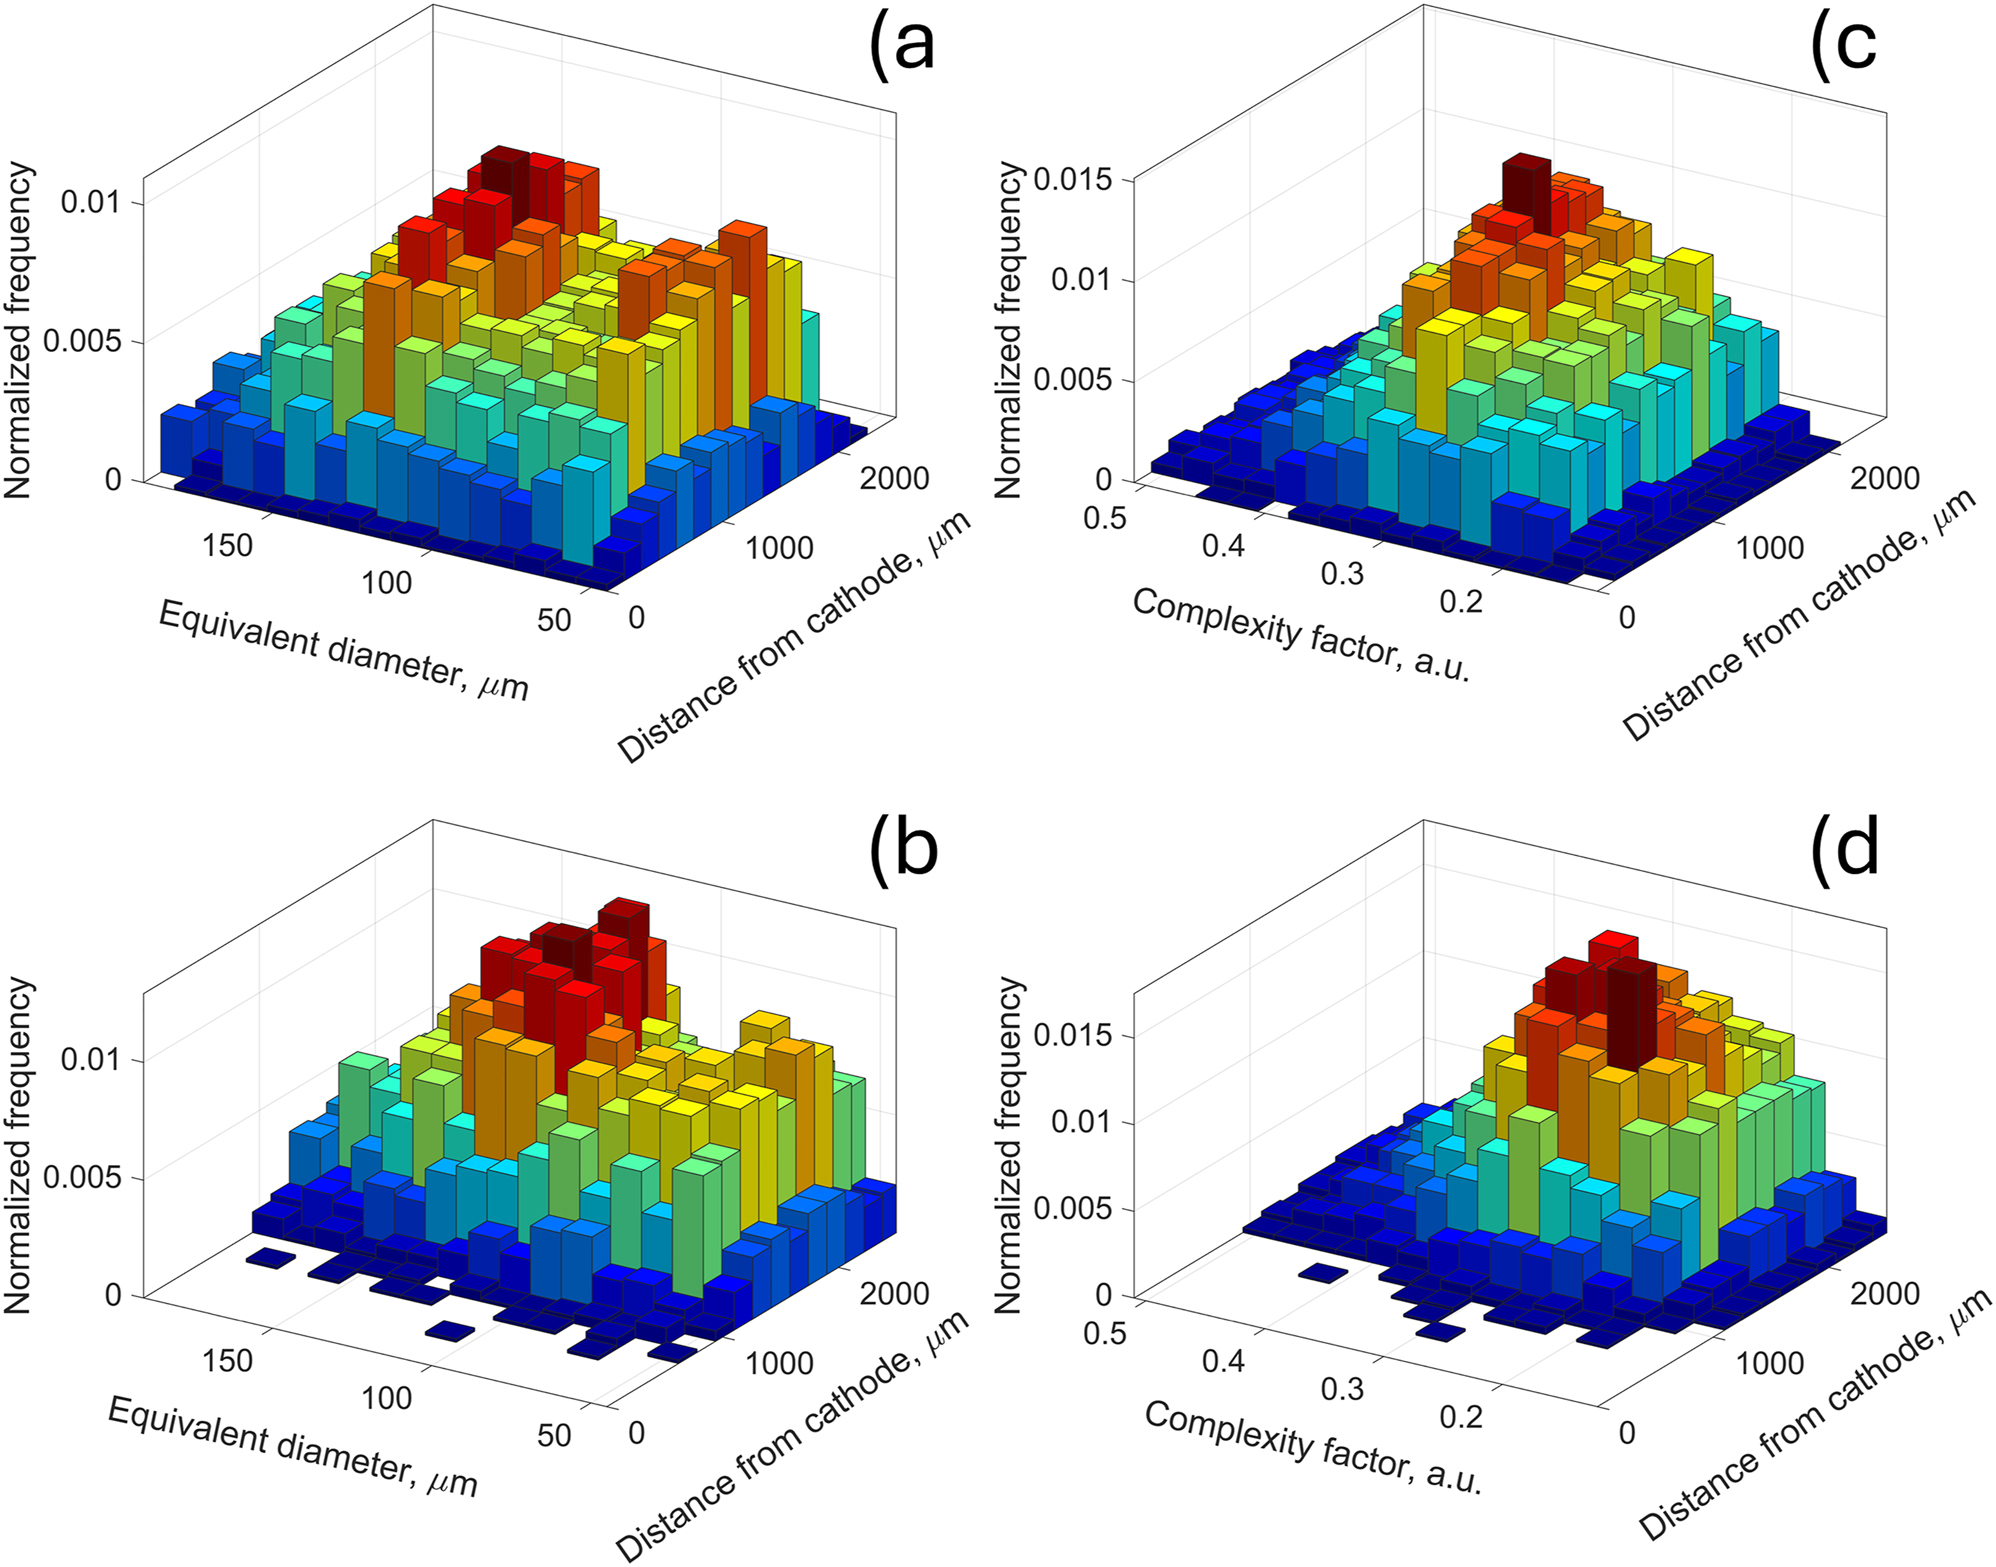
Bivariate histograms of particle sizes (a, b) and the complexity factor (c, d) for the pristine state (a, c) and at the cut-off (b, d).
To gain deeper insight into the underlying mechanisms, particles were classified into two distinct categories – “small” and “large” – determined by their initial size. Particles smaller than 100 µm were designated as “small,” while those exceeding 100 µm were categorized as “large”. Then they were tracked until they were dissolved completely, or cut-off was reached, as explained in the previous section. Figure 10a shows that “small” particles, in fact, are disappearing very fast, and hence the complexity factor change observed before is dominated by the “large” ones. This is confirmed by Figure 10b, where “small” class is characterized by complexity factor oscillating around constant value, while for the “large” particles, the tendency towards lower values is apparent.
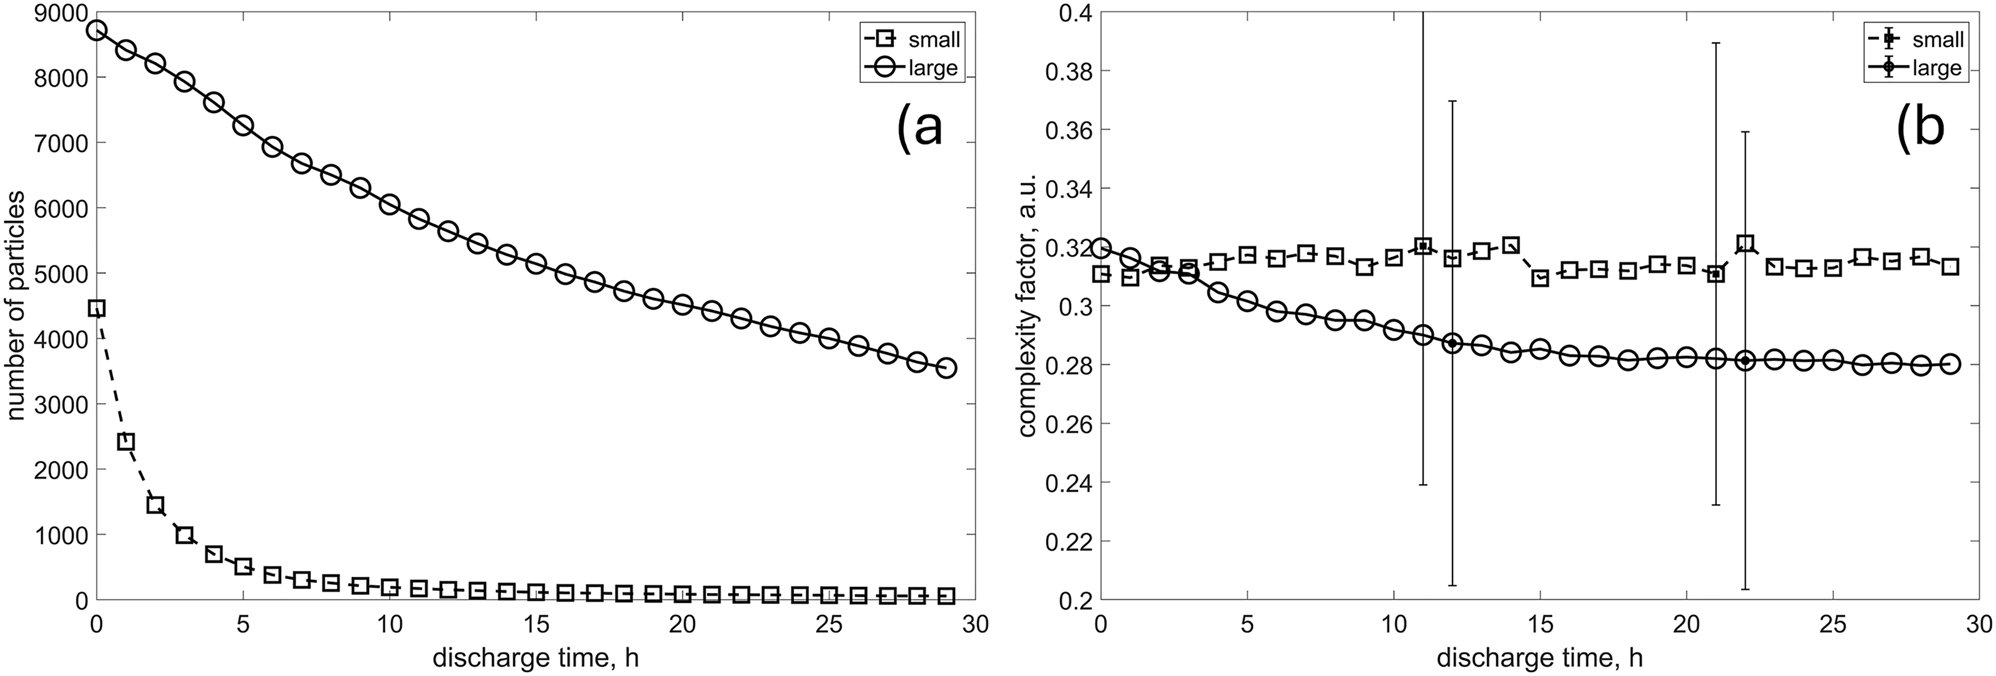
The change in the number of “small” and “large” particles over time a) and the evolution of morphological descriptors b).
Finally, the histogram of the complexity factor shift, as in Figure 11, calculated for both classes, shows clearly that the “large” ones tend to transform into more regular shapes. Note that only particles in close proximity to the cathode were chosen in order to eliminate the bias from the ones that never participated in the process. The maximum distance from the cathode, i.e. 0.5 mm, was defined arbitrarily, based on a visual inspection of tomograms.
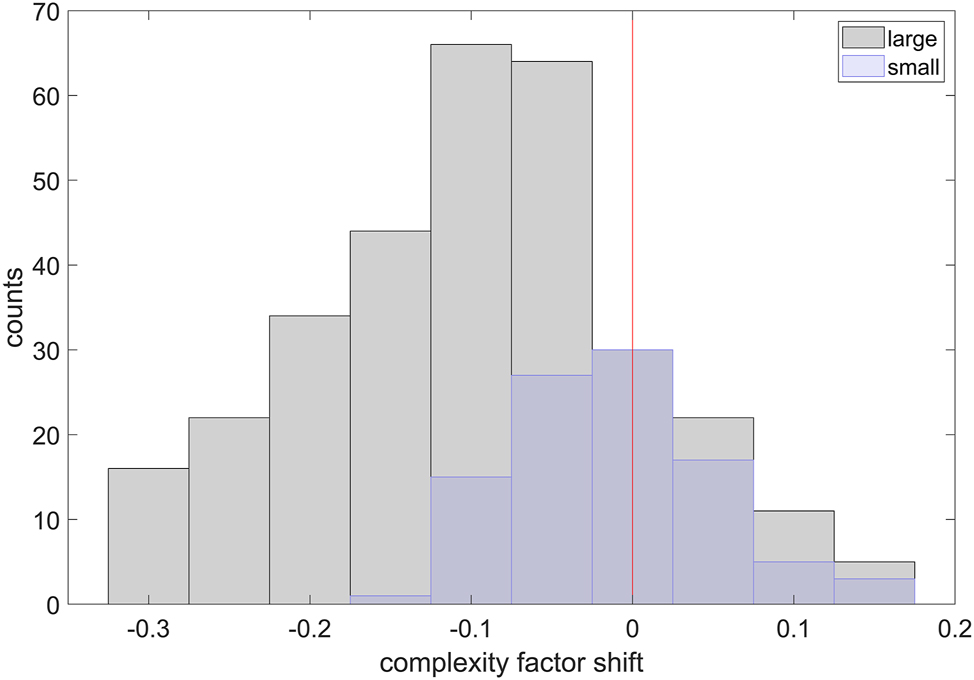
The complexity factor shift for particles of both classes in close proximity to the cathode (0.5 mm).
Thanks to the relatively high frequency of tomograms acquisition, it was possible to look at the evolution of individual zinc particles in more detail. Although several authors claim that mechanism of zinc particles dissolution should follow the shrinking core concept [14], [15], it was only observed to some extent in this study. The shrinking core concept describes the process in which, during discharge operation, the oxidation of zinc particles begins at the outer surface and gradually moves inward until all the zinc is oxidized (in an ideal case). In the case of torus-shaped particles, oxidation also starts from the inner surfaces. This oxidation process leads to volume expansion due to the differences in mass density between zinc and zinc oxide.
As illustrated in Figure 12a, some particles indeed display symmetrical shrinking that aligns with the shrinking-core model. However, many of them show anisotropic dissolution, with material loss occurring preferentially from the top to the bottom, regardless of their initial shape or size (see Figure 12b-d, f). Additionally, the oxidation of zinc particles can create pores (Figure 12e–g, h), indicating that zinc might dissolve as Zn(OH)4 2− without converting to ZnO, if the saturation point is not reached. Depending on the location of the particle, any combination of these processes may occur, or only a few of them may take place.
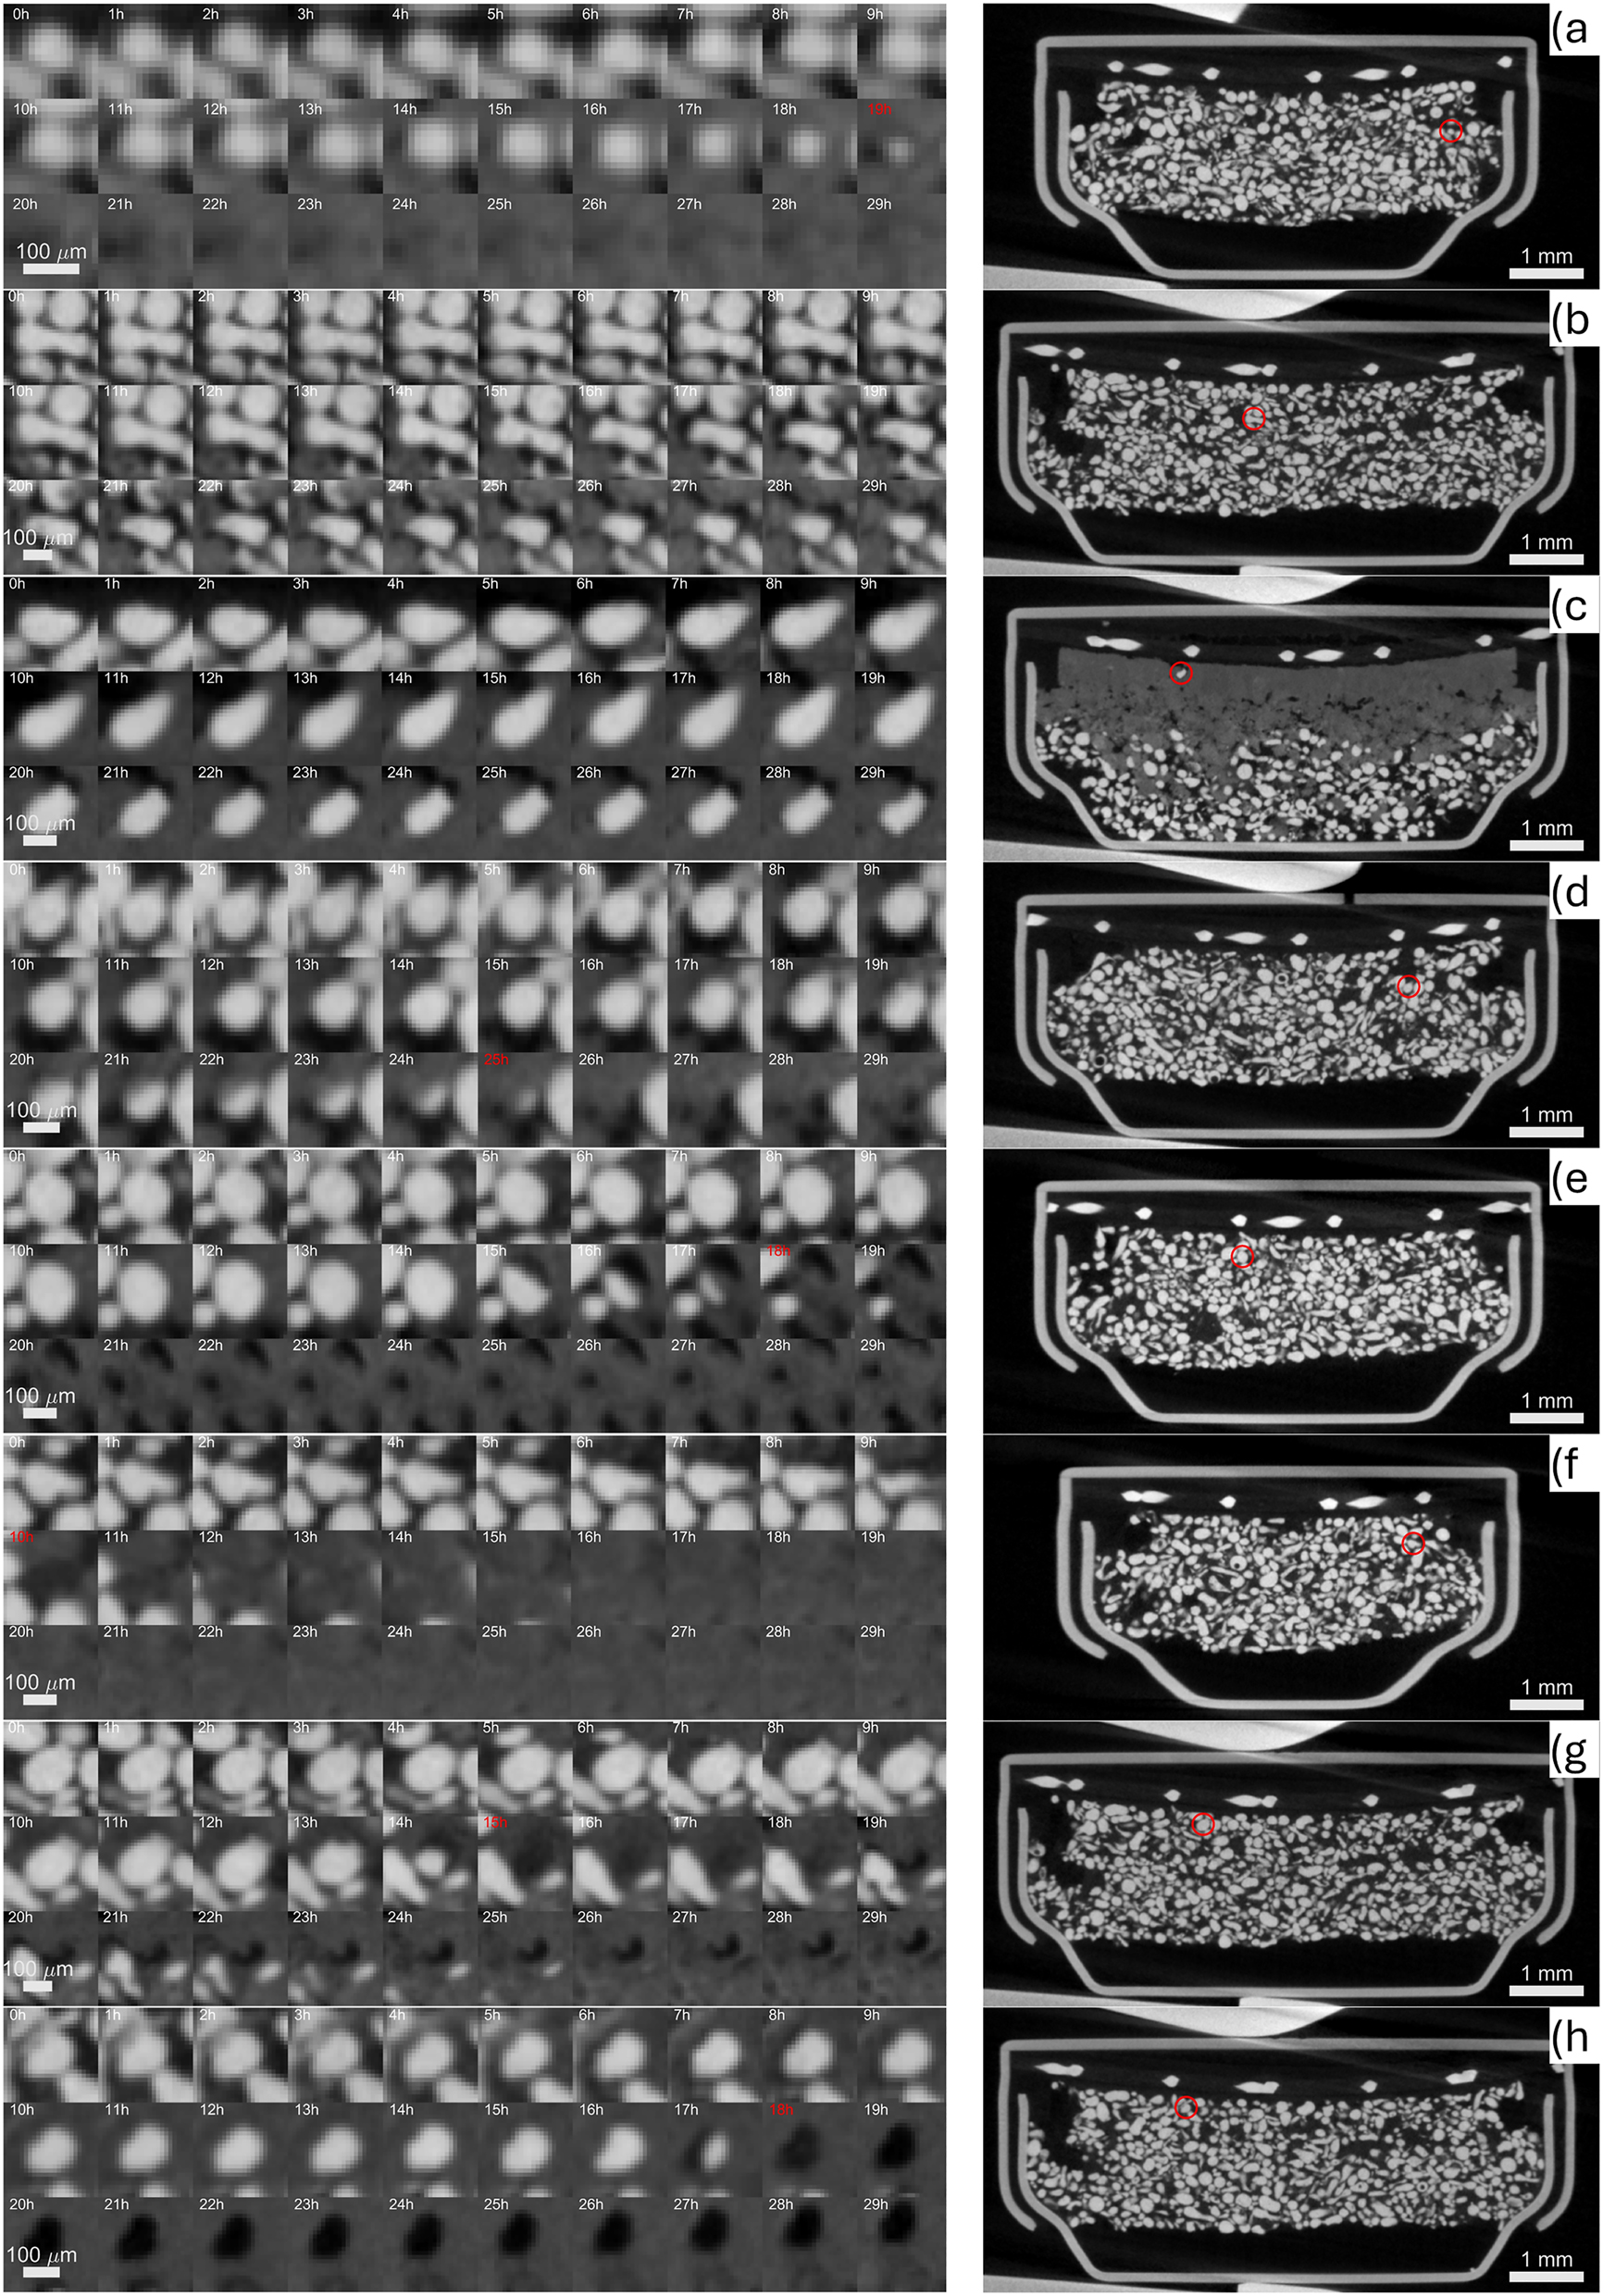
A selection of zinc particles affected by different mechanisms during their lifetime; shrinking core a), anisotropic conversion front (b, c, d, f) and dissolution (e, h, g). For clarity, on the right, the location of each particle is indicated on the corresponding cross section of the pristine tomogram with the exception of c) where the tomogram at cut-off was used to emphasize that the particle survived despite being very close to the cathode.
Interestingly, some particles survived until the cut-off, despite being active from the very beginning. For example, the particle shown in Figure 12c remains intact after 30 h, even though its neighboring particles were fully oxidized much earlier. The persistence of such particles may be due to its chemical nature; it could be an additive particle or consist of alloys or additives. Additionally, if the contact of the particle with the electrolyte was somehow disrupted, it could result in the particle remaining unreacted near the cathode as well.
Note that these observations were made possible by the very fine sampling of the discharge process. Otherwise, due to the significant movement of the particles and their symmetric shape, the anisotropic consumption might have been easily mistaken for isotropic shrinking-core behavior.
4 Conclusions and future work
New insights into mechanisms affecting particles morphology during discharge were presented using a laboratory XCT. A very fine sampling of the discharge process was attained thanks to the developed software allowing the seamless design of an imaging sequence controlled by an external device, e.g. a potentiostat. Detailed observation of individual particles was possible, showing that the shrinking core mechanism is less common than previously reported. In this study, many particles exhibited anisotropic dissolution, with material oxidation occurring primarily from the top to the bottom, regardless of their initial shape or size.
The statistical analysis provided insights into potential improvements in the anode’s morphology; however, it is crucial not to overlook the role of the cathode. So far, the performance and lifetime of zinc-air batteries have been limited by the cathode and this was also the case in the presented study. The disintegration of the cathode occurred just 18 h after the discharge began, leading to failure (cut-off) 12 h later. It is important to note that only a single battery was investigated. To confirm these observations, further testing with more samples is necessary, ideally with even finer sampling and higher resolution. This can be achieved in the future with the application of machine learning and dedicated battery holder optimizing the XCT acquisition geometry.
Funding source: Bundesministerium für Bildung und Forschung
Award Identifier / Grant number: 03SF0627A
-
Research ethics: Not applicable.
-
Informed consent: Not applicable.
-
Author contributions: All authors have accepted responsibility for the entire content of this manuscript and approved its submission.
-
Use of Large Language Models, AI and Machine Learning Tools: LLM was used for spell checking and to reformulate some sentences for better flow.
-
Conflict of interest: The authors state no conflict of interest.
-
Research funding: The authors acknowledge the financial support from the German Federal Ministry of Education and Research (BMBF) within the project “iNEW2.0 – Inkubator Nachhaltige Elektrochemische Wertschöpfungsketten” Project No. 03SF0627A.
-
Data availability: Raw data is available upon request, relevant source code is shared in the manuscript.
References
[1] Q. Liu, Z. Pan, E. Wang, L. An, and G. Sun, “Aqueous metal-air batteries: Fundamentals and applications,” Energy Storage Mater., vol. 27, pp. 478–505, 2020. https://doi.org/10.1016/j.ensm.2019.12.011.Search in Google Scholar
[2] N. Borchers, S. Clark, B. Horstmann, K. Jayasayee, M. Juel, and P. Stevens, “Innovative zinc-based batteries,” J. Power Sources, vol. 484, p. 229309, 2021. https://doi.org/10.1016/j.jpowsour.2020.229309.Search in Google Scholar
[3] Q. Wang, S. Kaushik, X. Xiao, and Q. Xu, “Sustainable zinc–air battery chemistry: advances, challenges and prospects,” Chem. Soc. Rev., vol. 52, no. 17, pp. 6139–90, 2023. https://doi.org/10.1039/D2CS00684G.Search in Google Scholar
[4] X.-W. Lv, et al.., “Rechargeable zinc–air batteries: advances, challenges, and prospects,” Small, vol. 20, no. 4, p. 2306396, 2024. https://doi.org/10.1002/smll.202306396.Search in Google Scholar PubMed
[5] Y. Zhong, B. Liu, Z. Zhao, Y. Shen, X. Liu, and C. Zhong, “Influencing factors of performance degradation of zinc–air batteries exposed to air,” Energies, vol. 14, no. 9, p. 2607, 2021. https://doi.org/10.3390/en14092607.Search in Google Scholar
[6] S. Hosseini, S. Masoudi Soltani, and Y.-Y. Li, “Current status and technical challenges of electrolytes in zinc–air batteries: An in-depth review,” Chem. Eng. J., vol. 408, p. 127241, 2021. https://doi.org/10.1016/j.cej.2020.127241.Search in Google Scholar
[7] K. W. Leong, Y. Wang, M. Ni, W. Pan, S. Luo, and D. Y. C. Leung, “Rechargeable Zn-air batteries: Recent trends and future perspectives,” Renew. Sustain. Energy Rev., vol. 154, p. 111771, 2022. https://doi.org/10.1016/j.rser.2021.111771.Search in Google Scholar
[8] H. Villarraga-Gómez, et al.., “Assessing rechargeable batteries with 3D X-ray microscopy, computed tomography, and nanotomography,” Nondestruct. Test. Eval, vol. 37, no. 5, pp. 519–35, 2022. https://doi.org/10.1080/10589759.2022.2070165.Search in Google Scholar
[9] R. F. Ziesche, et al.., “Multi-Dimensional Characterization of Battery Materials,” Adv. Energy Mater., vol. 13, no. 23, 2023, https://doi.org/10.1002/aenm.202300103.Search in Google Scholar
[10] B. Bozzini, M. Kazemian, M. Kiskinova, G. Kourousias, C. Mele, and A. Gianoncelli, “Operando soft X-ray microscope study of rechargeable Zn–air battery anodes in deep eutectic solvent electrolyte,” X-Ray Spectrom., vol. 48, no. 5, pp. 527–35, 2019. https://doi.org/10.1002/xrs.3031.Search in Google Scholar
[11] W. Kang, S. Kubota, M. Kodama, A. Ikezawa, H. Arai, and S. Hirai, “Operando X-Ray Imaging of the Charge-Discharge Behavior of Zinc-Air Batteries,” Electrochemistry, vol. 92, no. 8, p. 087003, 2024. https://doi.org/10.5796/electrochemistry.24-00053.Search in Google Scholar
[12] M. K. Christensen, J. K. Mathiesen, S. B. Simonsen, and P. Norby, “Transformation and migration in secondary zin-cair batteries studied by in situ synchrotron X-ray diffraction and X-ray tomography,” J. Mater. Chem. A, vol. 7, no. 11, pp. 6459–66, 2019. https://doi.org/10.1039/c8ta11554k.Search in Google Scholar
[13] R. Franke-Lang, T. Arlt, I. Manke, and J. Kowal, “X-ray tomography as a powerful method for zinc-air battery research,” J. Power Sources, vol. 370, pp. 45–51, 2017. https://doi.org/10.1016/j.jpowsour.2017.10.010.Search in Google Scholar
[14] T. Arlt, D. Schröder, U. Krewer, and I. Manke, “In operando monitoring of the state of charge and species distribution in zinc air batteries using X-ray tomography and model-based simulations,” Phys. Chem. Chem. Phys., vol. 16, no. 40, pp. 22273–80, 2014. https://doi.org/10.1039/C4CP02878C.Search in Google Scholar PubMed
[15] J. Hack, D. Patel, J. J. Bailey, F. Iacoviello, P. R. Shearing, and D. J. L. Brett, “In situ x-ray computed tomography of zinc–air primary cells during discharge: correlating discharge rate to anode morphology,” J. Phys. Mater., vol. 5, no. 1, p. 014001, 2021. https://doi.org/10.1088/2515-7639/ac3f9a.Search in Google Scholar
[16] P312 data sheet. https://www.microbattery.com/pub/media/tech-specs/power-one/Data_Sheet_p312_EVOLUTION.pdf.Search in Google Scholar
[17] DIN EN 60086-2:2016-10, Primärbatterien_- Teil_2: Physikalische und elektrische Spezifikationen (IEC_60086-2:2015); Deutsche Fassung EN_60086-2:2016. https://doi.org/10.31030/2535128.Search in Google Scholar
[18] D. Schröder, T. Arlt, U. Krewer, and I. Manke, “Analyzing transport paths in the air electrode of a zinc air battery using X-ray tomography,” Electrochem. Commun., vol. 40, pp. 88–91, 2014. https://doi.org/10.1016/j.elecom.2014.01.001.Search in Google Scholar
[19] Coin cell holder DigiKey Electron. https://www.digikey.de/de/products/detail/würth-elektronik/79528211/9488032.Search in Google Scholar
[20] K. Dzięcioł, Y. E. Durmus, H. Tempel, H. Kungl, A. Bauer, and R.-A. Eichel, “Laboratory X-ray computed tomography imaging protocol allowing the operando investigation of electrode material evolution in various environments,” iScience, vol. 26, no. 7, p. 107097, 2023. https://doi.org/10.1016/j.isci.2023.107097.Search in Google Scholar PubMed PubMed Central
[21] Sequence designer for Xradia with predefined blocks (XBlox). https://jugit.fz-juelich.de/iet-1-xct/xblox.Search in Google Scholar
[22] I. Arganda-Carreras, et al.., “Trainable Weka Segmentation: a machine learning tool for microscopy pixel classification,” Bioinformatics, vol. 33, no. 15, pp. 2424–6, 2017. https://doi.org/10.1093/bioinformatics/btx180.Search in Google Scholar PubMed
[23] J. Schindelin, et al.., “Fiji: an open-source platform for biological-image analysis,” Nat. Methods, vol. 9, no. 7, pp. 676–82, 2012. https://doi.org/10.1038/nmeth.2019.Search in Google Scholar PubMed PubMed Central
[24] A. Isaac, et al.., “In situ 3D quantification of the evolution of creep cavity size, shape, and spatial orientation using synchrotron X-ray tomography,” Mat Sci. Eng., vol. 478, no. 1, p. 108, 2008.10.1016/j.msea.2007.05.108Search in Google Scholar
[25] L. Renversade, H. Ruoff, K. Maile, F. Sket, and A. Borbély, “Microtomographic assessment of damage in P91 and E911 steels after long-term creep,” Int. J. Mater. Res., vol. 105, no. 7, pp. 621–7, 2014. https://doi.org/10.3139/146.111056.Search in Google Scholar
[26] F. Sket, A. Fernández, A. Jérusalem, J. M. Molina-Aldareguía, and M. T. Pérez-Prado, “Effect of Hydrostatic Pressure on the 3D Porosity Distribution and Mechanical Behavior of a High Pressure Die Cast Mg AZ91 Alloy,” Metall. Mater. Trans. A, vol. 46, no. 9, pp. 4056–69, 2015. https://doi.org/10.1007/s11661-015-3024-z.Search in Google Scholar
[27] M. Jaskari, et al.., “Effects of Volumetric Energy Density on Defect Structure and Fatigue Behaviour of Powder Bed Fusion Manufactured 316L Stainless Steel,” Mater. Sci. Eng. A, vol. 925, p. 147868, 2025. https://doi.org/10.1016/j.msea.2025.147868.Search in Google Scholar
Supplementary Material
This article contains supplementary material (https://doi.org/10.1515/mim-2025-0007).
© 2025 the author(s), published by De Gruyter on behalf of Thoss Media
This work is licensed under the Creative Commons Attribution 4.0 International License.