Letter to the editor by Winter et al.: Reply
-
Georg Hoffmann
 ,
Frank Klawonn
,
Frank Klawonn

To the Editor,
We welcome the comments by Winter et al. [1] on our article about laboratory data standardization. The authors not only emphasize the importance of the topic as such, but also confirm the widespread perception, that no final solutions are currently available and further discussion is needed.
In their letter, they discuss two mathematical approaches [2, 3], which represent a small part of the extensive literature on this topic [4]. Both the “zlog value” and the “quantity quotient” are similar in that they are based on the following three principles:
Their theoretical background is the well-known z-value z=(x–μ)/σ, where x is the measured laboratory result, μ is the mean and σ is the standard deviation of a reference population.
μ and σ are derived from the lower and upper ranges of the respective reference intervals.
All measured results and reference limits are transformed, before the z-value equivalents are calculated: the zlog value uses logarithms, while the quantity quotient takes square roots.
The aim of our proposal is to make laboratory findings comparable by mapping all measured values on uniform scales, which are independent of methods, units, patient gender, age and so forth. The standardized reference intervals will thus be −1.96 to +1.96 for zlog values and 80 to 120 for quantity quotients (without units), and the majority of patient results will fall into a range between about −10 and +10 or 0 to 200, respectively.
Nevertheless, we would like to reaffirm the authors’ statement, that mathematical transformations cannot replace existing standard procedures for result presentation and data transmission (RiliBÄK, ISO 15189, LOINC, UCUM, LDT, HL7, etc.). Rather they are meant to be just an additional help making the flood of data in laboratory medicine easier to handle.
Table 1 shows typical examples indicating, that zlog values between −5 and +5 seem indeed more or less equivalent from a clinical point of view. Beyond that range, the comparability becomes less convincing. For example, potassium (K) values below 2 mmol/L or above 10 mmol/L, which are hardly compatible with life, will still fall within the range of −10 to +10.
Typical laboratory results at critical limits of the zlog value.
| zlog=−10 | zlog=−5 | zlog=−3 | zlog+3 | zlog=+5 | zlog=+10 | |
|---|---|---|---|---|---|---|
| Crea, μmol/L | 19 (0.2) | 39 (0.4) | 52 (0.6) | 122 (1.4) | 162 (1.8) | 331 (3.7) |
| WBC, 1000/μL | 0.6 | 2.1 | 3.4 | 14.5 | 23.5 | 78 |
| K, mmol/L | 1.6 | 2.6 | 3.2 | 6.0 | 7.4 | 12.4 |
| Hb, mmol/L | 5 (8.1) | 6.9 (11.1) | 7.9 (12.7) | 11.5 (18.5) | 13.1 (21.1) | 18 (29.0) |
Values in parentheses are expressed in conventional units.
Figure 1 shows that both approaches yield equivalent results for K, whereas the quantity quotient tends to exaggerate high white blood cell counts (WBC) and creatinine concentrations (Crea). On the other hand, the quantity quotient for hemoglobin (Hb) concentrations below 4.5 mmol/L (7.2 g/dL) will become negative. This seems confusing, as the quantity quotient has been designed to represent an analogy to the intelligence quotient [3], which must not fall below zero by definition. This drawback of negative values does not apply to zlog values, as they indicate a negative deviation from the center of the reference interval [2], and are therefore self-explaining.
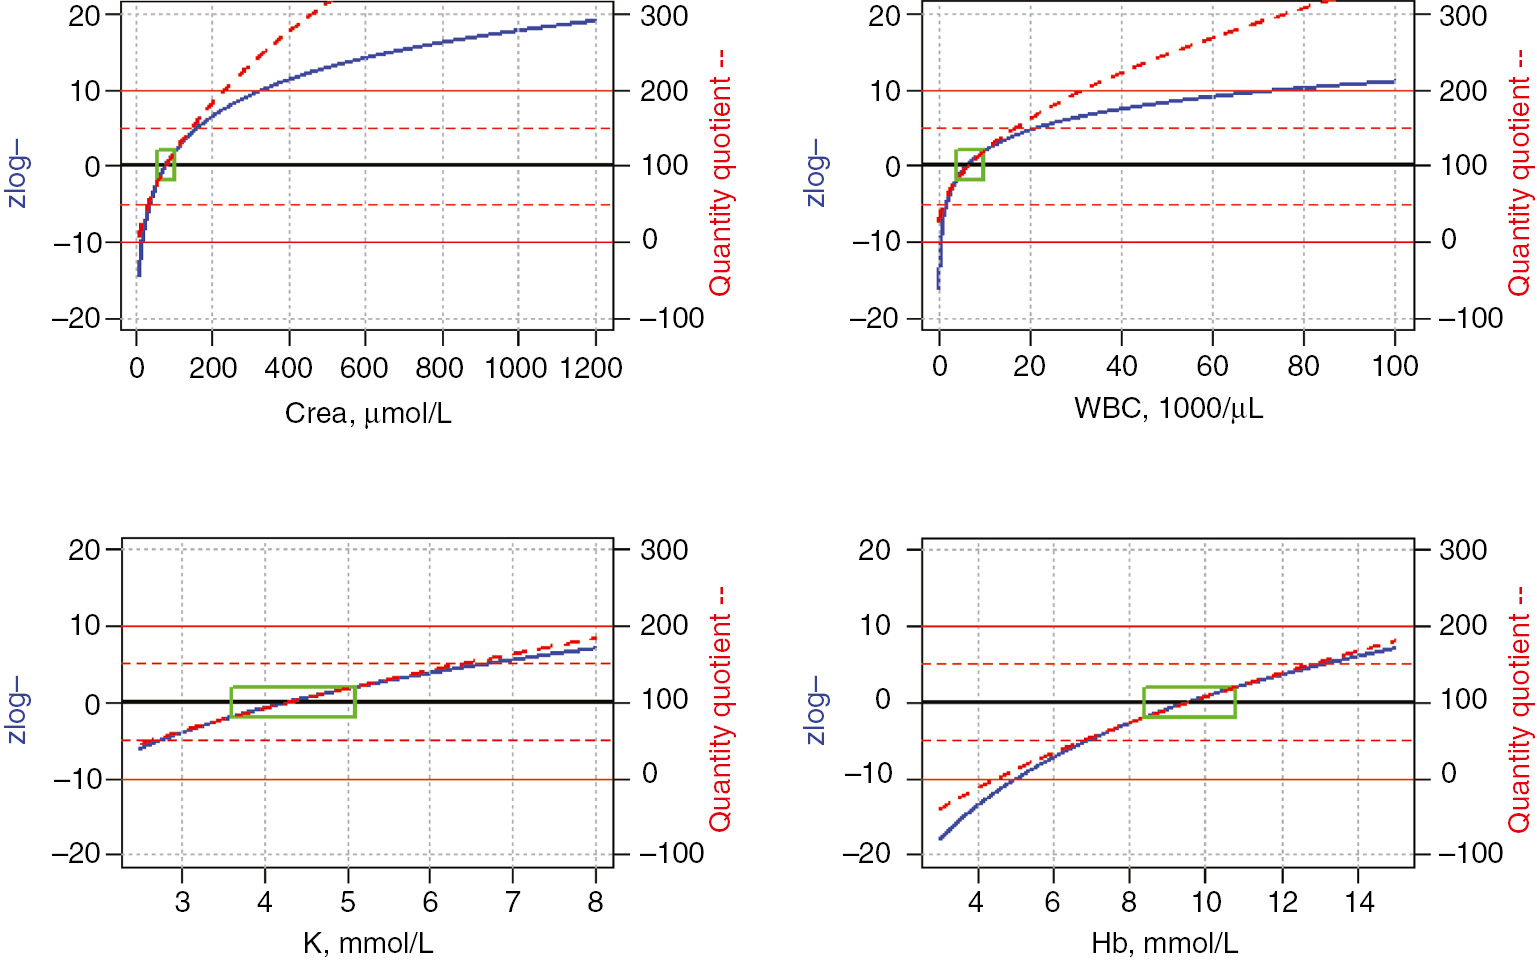
Comparison of zlog and quantity quotient values over the following ranges of plausible laboratory results: Crea (enzymatic) 10–1200 μmol (0.1–13.6 mg/dL); WBC: 100–100,000/μL; K: 2.5–8.0 mmol/L; Hb 3–15 mmol/L (4.8–24.2 g/dL).
The green boxes represent the respective reference intervals for adult men. Their standardized height on the y-axis is independent of the largely varying reference ranges on the x-axis: −1.96 to 1.96 for zlog values and 80–120 for quantity quotients.
We would also like to confirm the authors’ statement, that the proposed equations can improve the graphical representation of laboratory results. This is especially true for the standardized color scale [2], which may be derived from zlog values (Figure 2). The special appeal of colors is that they can be adjusted very nicely to medical intuition. In our proposal, we apply sigmoid functions to the red, green and blue proportions of the scale, so that changes become most prominent in the areas of interest where a measured result deviates by 3–5 standard deviations from the center of the reference interval; only minor color changes occur within the reference interval and in the extreme areas beyond 10 standard deviations. This color coding enriches the original values with additional information, without replacing them or taking up their own space in a laboratory report.

Published proposal for a continuous standardized color scale derived from zlog values between −10 and +10.
Finally, we support the statement that the full laboratory report must be stored in the electronic health record, including all comments and additional information. Therefore, we do not agree with the authors comment that any redundancies resulting from this requirement are classified as “bad software design”. The parallel transmission of original and calculated values is in common use as a safety feature [e.g. Hb and erythrocyte (Ery) plus mean corpuscular hemoglobin (MCH)=Hb/Ery]. Whenever medical decisions are made from a medical report, the exact copy of this report should be retrievable even after years; thus it will be advisable and even necessary for forensic reasons that calculated values (zlog or quantity quotient) are stored together with the original results rather than relying on recalculations made from the raw data.
Common reference values in combination with widely used terminologies (e.g. SNOMED) and data formats (e.g. HL7) will help to reduce the current confusion in the interpretation of laboratory results [2, 3]. We are convinced that the proposed standardization of laboratory results using zlog values and/or color codes will greatly contribute to improved quality of patient care.
Author contributions: All the authors have accepted responsibility for the entire content of this submitted manuscript and approved submission.
Research funding: None declared.
Employment or leadership: None declared.
Honorarium: None declared.
Competing interests: The funding organization(s) played no role in the study design; in the collection, analysis, and interpretation of data; in the writing of the report; or in the decision to submit the report for publication.
References
1. Winter C, Ganslandt T, Bietenbeck A. No mathematical shortcuts for standardization or harmonization of laboratory measurements. J Lab Med 2018;42:59–62.10.1515/labmed-2017-0122Search in Google Scholar
2. Hoffmann G, Klawonn F, Lichtinghagen R, Orth M. The zlog value as a basis for the standardization of laboratory results. J Lab Med 2017. DOI: https://doi.org/10.1515/labmed-2017-0135.10.1515/labmed-2017-0135Search in Google Scholar
3. Haeckel R, Wosniok W, Gurr E, Postma T, Streichert T. Quantity quotient reporting versus z-value for standardizing quantitative laboratory results. J Lab Med 2017;41:93–7.Search in Google Scholar
4. Hoffmann G, Zapatka M, Findeisen P, Wörner S, Martus P, Neumaier M. Data mining in clinical data sets. J Lab Med 2010;34:227–33.Search in Google Scholar
©2018 Walter de Gruyter GmbH, Berlin/Boston
This article is distributed under the terms of the Creative Commons Attribution Non-Commercial License, which permits unrestricted non-commercial use, distribution, and reproduction in any medium, provided the original work is properly cited.
Articles in the same Issue
- Frontmatter
- Molecular-Genetic and Cytogenetic Diagnostics
- Multiple Integration and Data Annotation Study (MIDAS): improving next-generation sequencing data analysis by genotype-phenotype correlations
- Emergence of exosomal DNA in molecular neuropathology
- ATF3 and EGR2 gene expression levels in sdLDL-treated macrophages of patients with coronary artery stenosis
- Clinical Chemistry and Metabolism
- Dynamic thiol-disulfide homeostasis is disturbed in patients with non-alcoholic fatty liver disease
- Endocrinology
- Association of plasma ghrelin levels with diabetic nephropathy
- Inflammation and Sepsis
- The antiiflammatory effect of Ginkgo biloba in lipopolysaccharide-induced rat sepsis model
- Original Article
- Determination of oxidative stress balance in follicular fluid
- Letter to the Editor
- No mathematical shortcuts for standardization or harmonization of laboratory measurements
- Letter to the editor by Winter et al.: Reply