The evolution of seeding systems and the impact of imbalanced groups in FIFA Men’s World Cup tournaments 1954–2022
-
Michael A. Lapré

 and
Elizabeth M. Palazzolo
and
Elizabeth M. Palazzolo

Abstract
The FIFA Men’s World Cup tournament is the most popular sporting event in the world. Scholars have identified several flaws in the organization of the World Cup causing competitive imbalance. We empirically assess competitive imbalance between groups for the World Cup tournaments from 1954 through 2022. We average the Elo ratings of a team’s opponents in the group stage to calculate their group opponents rating. In every World Cup, the range in group opponents rating exceeds 118 Elo rating points – the difference between an average participant and an average semifinalist. Using logistic regression, we find that for an average participant in a 32-team World Cup, an increase in group opponents rating of only 88 Elo rating points can reduce the probability of reaching the quarterfinal from 0.174 to 0.081, which is a decrease of more than 50 %. None of the five seeding systems used by FIFA during 1954–2022 lessened the negative impact of group opponents rating on the probability of reaching the quarterfinal. We close with seven policy recommendations to restore competitive balance at the World Cup.
1 Introduction
Soccer is the most popular sport in the world, and the World Cup – the flagship soccer competition – is the most popular sporting event in the world. A record high of 3.572 billion people – almost half of the global population – watched the 2018 World Cup (FIFA 2018). Soccer’s world governing body, Féderation Internationale de Football Association (FIFA), organizes the Men’s World Cup every four years and has more members than the United Nations (Haan, Koning, and van Witteloostuijn 2007). Qualification for the World Cup has significant economic benefits as each qualifying country receives an appearance fee of approximately 8 million dollars (Stone and Rod 2016). Cognizant of the economic and social benefits derived from the global mass viewership and growing popularity of the World Cup, FIFA has undertaken efforts to increase the attractiveness of all games played during the World Cup (Chater et al. 2021).
The World Cup consists of a qualification phase and a tournament phase. Prior to each World Cup, FIFA determines the number of qualifying slots for each of the six continental confederations: North and Central America (CONCACAF), South America (CONMEBOL), Europe (UEFA), Africa (CAF), Asia (AFC), and Oceania (OFC). In the qualification phase, teams compete in qualifying competitions to advance to the tournament phase. Table 1 shows the evolution of the tournament phase. Since 1954, the tournament phase typically consists of a group stage and a knockout stage. In the group stage, teams are allocated to groups of four teams. Each group participates in a round-robin tournament, with the best teams advancing to the knockout stage. Earlier World Cups were either knockout-stage only (1934 and 1938) or had some groups with fewer than four teams (1930 and 1950). Therefore, in our analysis of group strength, we focus on the 18 tournaments held between 1954 and 2022.
Format of the FIFA World Cup tournament.
| Years | Number of | Group stage | Group stage | Number of teams in |
|---|---|---|---|---|
| teams | 1st round | 2nd round | knockout stage | |
| 1930 | 13 | 4 groups of 3 or 4 | n/a | 4 |
| 1934 | 16 | n/a | n/a | 16 |
| 1938 | 15a | n/a | n/a | 15a |
| 1950 | 13a | 4 groups of 2, 3 or 4 | 1 group of 4 | n/a |
| 1954–1970 | 16 | 4 groups of 4 | n/a | 8 |
| 1974–1978 | 16 | 4 groups of 4 | 2 groups of 4 | 2 |
| 1982 | 24 | 6 groups of 4 | 4 groups of 3 | 4 |
| 1986–1994 | 24 | 6 groups of 4 | n/a | 16 |
| 1998–2022 | 32 | 8 groups of 4 | n/a | 16 |
-
n/a: not applicable. aLess than 16 because not all teams showed up.
For soccer leagues, creating competitive excitement is of paramount importance (Haan, Koning, and van Witteloostuijn 2007). Uncertainty about the outcome of a soccer game generates competitive excitement, which in turn attracts fans (Koning 2000; Scarf and Yusof 2011). When teams are more evenly matched, uncertainty about the outcome is higher (Koning 2000). In the group stage of the World Cup, groups should be balanced, i.e., groups should be roughly at the same competitive level (Guyon 2015). With imbalance across groups, it will be much harder for a team to advance to the knockout stage from a tough group with several strong teams compared to a team playing in an easier group. Such a scenario is considered unfair (Laliena and López 2019). Instead, teams of similar strength should have the same likelihood of advancing in the tournament. Competitive balance across groups enhances fairness (Guyon 2015).
To create groups, FIFA places participating teams in four pots. Pot 1 typically consists of the host country and the best teams – so called “seeded teams” – at the World Cup. Allocation mechanisms for the remaining teams to pots 2, 3, and 4 have evolved over time, to some extent accounting for geographic separation or team strength. For example, in 2010 and 2014, pots 2, 3, and 4 were based on geographic criteria, whereas in 2018 and 2022, pots 2, 3, and 4 were based on FIFA rankings. In a draw procedure, each group is constructed by drawing one team from each pot. Seeding protects the best teams as they cannot play each other in the group stage. Table 2 describes the evolution of seeding systems for the World Cup.
Evolution of seeding systems.
| Years | Description |
|---|---|
| 1930–1974 | Decision made in closed session |
| 1978–1986 | In public session, seeding and draw considered geographical position of the countries represented |
| 1990–1994 | Use ranking of the last two (1990) or three (1994) World Cups |
| 1998–2006 | Use both performance in last three (1998–2002) or two (2006) World Cups and FIFA ranking over the past three years |
| 2010–2022 | Use FIFA ranking from eight months before the World Cup |
FIFA has acknowledged the importance of competitive balance. FIFA’s Technical Study Group (TSG) publishes technical reports following each World Cup to track progress in improving competitive balance across all matches. The TSG contends in their technical report for the 2014 World Cup that “this World Cup was an extremely balanced affair. Eight of the 16 matches in the second stage went to extra time, and four all the way to a penalty shoot-out … [underlining] how close the teams [were] together as well as the good development work being done by the member associations” (FIFA 2014a, p. 44). Contrary to TSG’s claims suggesting an improvement in competitive balance over time, the groups in this World Cup had very different strengths (Guyon 2015; Laliena and López 2019). For example, group D was a tough group consisting of teams with Elo rankings at the time of the draw of 6, 9, 11, and 29 (England, Uruguay, Italy, and Costa Rica), whereas group H was a weak group made up of teams ranked 15, 18, 44, and 61 (Russia, Belgium, South Korea, and Algeria).
Several papers have studied FIFA’s draw procedures for the World Cup. Jones (1990) finds that the draw for the 1990 World Cup was mathematically unfair, and Rathgeber and Rathgeber (2007) show that despite both teams being seeded in the 2006 World Cup, Germany was more likely to play in a tough group while Italy was not. Guyon (2015) identifies three flaws in FIFA’s draw procedure for 32-team tournaments: lack of balance, lack of fairness, and an uneven distribution. First, the lack of balance results in groups of unequal competitive strength. Second, the unfairness of the draw increases the chance that certain teams have a greater chance of being allocated to a stronger group. Lastly, the draw has an uneven distribution, meaning that all possible outcomes of the draw are not equally likely. Guyon (2015), Laliena and López (2019), and Cea et al. (2020) propose better draw procedures to create competitive balance. However, these papers do not empirically assess imbalance at the World Cup.
For the 1982–2006 World Cups, Monks and Husch (2009) empirically investigate the impact of seeding, home continent, and hosting on the probability of reaching the quarterfinal. The authors find that being seeded and playing in the home continent increases the probability of reaching the quarterfinal. Yet, host teams do not enjoy any advantages beyond the benefits of seeding and the home continent effect. In this paper, we empirically assess imbalance between groups for the FIFA World Cup tournaments from 1954 through 2022. We find that the strength of the opponents in the group (“group opponents rating”) reduces the probability of reaching the quarterfinal. Moreover, once we include group opponents rating, seeding and home continent no longer affect the probability of reaching the quarterfinal. So, the findings by Monks and Husch (2009) are likely biased due to the omission of group opponents rating.
Lapré and Palazzolo (2022) empirically document competitive imbalance for the FIFA Women’s World Cup from 1991 through 2019. The authors find that higher group opponents rating significantly decreases the probability of reaching the quarterfinal. In this paper, unlike the study of the Women’s World Cup, the longer history of the Men’s World Cup allows us to investigate the impact of group opponents rating on both the quarterfinal and the semifinal. Unlike the FIFA Women’s ranking system, FIFA’s Men’s ranking systems through 2018 have been heavily criticized. While Lapré and Palazzolo (2022) use FIFA Women’s Ranking, in this paper we use Elo ratings. In contrast to the Women’s World Cup, FIFA has used different seeding systems in the longer history of the Men’s World Cup. In this paper, we study whether the different seedings systems affect competitive imbalance at the Men’s World Cup.
The remainder of the paper is organized as follows. In Section 2, we review related literature. In Section 3, we use Elo ratings at the time of the draw to empirically assess competitive imbalance between groups for the 1954 through 2022 World Cups. For each team, we average the ratings across the opponents in the group to calculate group opponents rating. In Section 4, we quantify the impact of imbalance on the probability of success at the World Cup. Using logistic regression, we find that a small increase (relative to the observed variation) in group opponents rating can decrease a team’s probability of reaching the quarterfinal by 9 to 21 percentage points depending on the number of teams in the World Cup. In Section 5, we discuss the evolution of FIFA’s seeding systems. In Section 6, we assess whether increases in competitive imbalance coincide with a reduction in the predictability of the composition of the late stages in the tournament. Lastly, we offer concluding remarks and policy recommendations in Section 7.
2 Related research
Scholars have identified several factors contributing to competitive imbalance at the World Cup including FIFA’s ranking methods, allocation of confederation slots, lack of win incentive, draw procedures, and seeding systems.
FIFA began ranking men’s national teams in 1993 and has since updated their ranking method in 1999, 2006, and after the World Cup in 2018. McHale and Davies (2007) note that FIFA’s ranking methods prior to 2006 have several subjective elements and lack justification. Weightings for regional strength and past results are not based on objective elements. No quantitative basis is provided to justify bonus points for away teams and points awarded for a win, draw, or loss. No empirical justification is provided for the decreasing weights applied to results from the past. McHale and Davies (2007) use statistical analysis to show that the FIFA ranking method between 1998 and 2006 does not use information from past results efficiently and does not react quickly enough to recent changes in team performance. Lasek et al. (2016) show that teams can exploit opportunities to climb in the FIFA rankings by scheduling friendly matches taking into account factors such as choosing the number of games, risk tolerance, and forming a coalition with other teams. Criticisms of FIFA’s ranking method between 2006 and 2018 include point-depreciation favoring certain confederations, disincentive to play in friendly matches, ignoring home advantage, a built-in incentive to play average teams rather than top teams, and underrating the World Cup host team (Cea et al. 2020; Csató 2021; Kaminski 2022). Lasek, Szlávik, and Bhulai (2013) assess the predictive power of several ranking methods. The authors find that relatively simple algorithms outperform the FIFA Men’s World Ranking procedure. Notably, Elo rating systems based on an update formula are competitive rating methods. Curiously, FIFA has used an Elo rating system for the FIFA Women’s World Ranking since they started ranking women’s national teams in 2003 (Lasek, Szlávik, and Bhulai 2013). Yet, the Men’s World Ranking did not switch to an Elo rating system until as late as 2018. For the FIFA ranking method used since 2018, Szczecinski and Roatis (2022) find that the predictive capacity of FIFA’s Elo algorithm can be improved by incorporating home advantage, explicitly modelling draws in the game, and introducing weighting of the results with goal differential. Other papers have analyzed rating methods that reflect teams’ current strength (Ley, Van de Wiele, and Van Eetvelde 2019) and find the all-time greatest teams (Baker and McHale 2018). Koning (2017), Van Eetvelde and Ley (2019), and Groll, Schauberger, and Van Eetvelde (2020) provide recent reviews of rating methods.
Stone and Rod (2016) show that the system of allocating the number of teams that can participate from each confederation does not ensure that the best teams qualify for the World Cup, nor does it fairly allocate qualification spots to confederations. Stone and Rod (2016) and Csató (2023e) advocate for a more transparent allocation process. Krumer and Moreno-Ternero (2023) study the allocation of additional slots for the 2026 World Cup.
The World Cup’s group stage and knockout stage structures can lead to tanking – that is, a team already qualified for the knockout stage might deliberately lose a game to face a more desirable opponent in the knockout stage (Stronka 2020). Chater et al. (2021) study how the last round of the group stage can lead to collusive games and stake-less games giving rise to match-fixing opportunities. The authors then propose changes to avoid match fixing. Guyon (2018b) and Csató (2021) discuss the design of the 1986–1994 World Cups featuring a single-group stage with 24 teams, which creates several fairness issues such as group advantage, lack of win incentive, and arbitrary choices. Csató (2023c) proposes a framework to quantify the threat of tanking in the last round of the group stage and identifies a schedule for the 2022 World Cup that minimizes the risk of tanking. Guyon (2020) proposes alternative methods to reduce the risk of collusion in the 2026 World Cup if FIFA were to use groups of only three teams. Csató (2022a) identifies an incentive compatibility problem in the qualification phase of the World Cup. The author shows with an example that a team with a better result in qualification might be punished by being placed in a weaker pot, and thus face stronger opponents in the tournament phase.
FIFA imposes geographic constraints on the draw. For example, since 1998, teams from the same confederation cannot be drawn into the same group, except for UEFA. In 32-team World Cups, FIFA constrains each group to have one or two UEFA teams. Traditionally, FIFA has built pots 2, 3, and 4 based on confederation while completely disregarding team strength causing many of the flaws (i.e., lack of balance, lack of fairness, and uneven distribution) of the draw procedure (Guyon 2015). Guyon (2015) proposes an improved draw procedure that mitigates these flaws while satisfying the geographic constraints. Inspired by Guyon (2015), since 2018, FIFA has moved from continent-based pots to ranking-based pots (Guyon 2018a). Building on Guyon (2015), Laliena and López (2019) propose two evenly distributed draw systems that produce groups with similar or equal competitive levels while accounting for the geographic constraints. Using an optimization method, Cea et al. (2020) propose a draw procedure that minimizes the difference between the maximum and minimum ranking sums of each group’s members. Csató (2023d) shows that the order in which pots are emptied during the draw can affect the probability of advancing in the tournament. The author proposes finding the optimal order prior to the draw. For the 2022 World Cup, FIFA performed the draw when three play-off winners were still unknown. FIFA placed the play-off winners in pot 4. However, Csató (2023a) shows that assigning the placeholders according to the highest-ranked potential winner improves competitive balance across groups.
Lastly, Scarf and Yusof (2011) use simulation to show that seeding increases the probability that the best teams advance beyond the group stage. In contrast, Engist, Merkus, and Schafmeister (2021) find that seeding did not influence tournament performance of marginally seeded teams in the UEFA Champions League (CL) and Europa League – the most prestigious tournaments for European clubs. Scholars have also used simulation to analyze seeding systems in the CL which has a qualification–group stage–knockout stage sequence similar to the World Cup. Csató (2022c) studies the reform in the Champions Path of CL qualification. Dagaev and Rudyak (2019) investigate the seeding system reform of the group stage in the CL. The authors find only marginal changes in tournament success measures when UEFA changed the seeded teams in pot 1 from the highest ranked teams to the national champions of the Top-7 associations. Corona et al. (2019) find that this CL seeding reform increased the uncertainty over progression to the knockout phase, but had little impact on the composition of the final. In this paper, the evolution of FIFA seeding systems in Table 2 covers a much longer time frame with different reforms such as (i) moving from closed to public session, (ii) changing from continental to performance criteria, and (iii) changing performance criteria from outcomes of prior World Cups to recent FIFA rankings.
3 Imbalance in groups
3.1 Group strength
To assess team strength at the time of the draw, we use World Football Elo Ratings (eloratings.net). Gásquez and Royuela (2016) note that the Elo rating uses a low volatility index (i.e., it has more memory present) and is particularly well suited for empirical analysis over long periods of time such as our analysis. Elo ratings are updated after every match and have been used extensively in the literature (Cea et al. 2020; Csató 2022b, 2023a, 2023b; Gásquez and Royuela 2016; Lasek, Szlávik, and Bhulai 2013; Lasek et al. 2016). Let
where W is the actual match outcome from team i’s perspective (1 for a win, 0.5 for a draw, and 0 for a loss) and the win expectancy on a neutral field is:
Win expectancy is modified if one team is playing at home by adding 100 points to the rating for the home team.[1]
For each of the 18 World Cup tournaments in our study, we obtained Elo ratings for all participating teams at the time of the draw from international-football.net. Let r
it
be the Elo rating for team i on the date of the draw for World Cup t. For the host team, we increase the rating by 100 to reflect home advantage (Csató 2023a). Next, we use the team ratings to calculate group strength. For each group G
t
in World Cup t, we calculate group strength

Group strength calculated as the average Elo rating of all four teams in the group. Number of groups in 1954–1978: 4, 1982–1994: 6, 1998–2022: 8.

Group strength calculated as the average Elo rating of the best three teams in the group. Number of groups in 1954–1978: 4, 1982–1994: 6, 1998–2022: 8.

Range in group strength. Number of groups in 1954–1978: 4, 1982–1994: 6, 1998–2022: 8.
3.2 Group opponents rating
Following Lapré and Palazzolo (2022), we calculate group opponents rating for team i in World Cup t as

Range in group opponents rating. Number of groups in 1954–1978: 4, 1982–1994: 6, 1998–2022: 8.
4 Impact of imbalanced groups
We investigate the impact of group opponents rating on two measures of success at the World Cup. The World Cups in 1954–1970 consisted of a single group stage followed by a knockout stage starting with quarterfinals. Similarly, the World Cups in 1986–2022 consisted of a single group stage followed by a knockout stage starting with 16 teams. For World Cups with a single group stage followed by a knockout stage, reaching the quarterfinal or the semifinal are logical measures of success. However, in 1974 and 1978 the first group stage with four groups of four teams yielded 8 teams advancing to a second group stage with two groups of four teams each. Since these World Cups consisted of two group stages, we make slight adjustments to account for these two years. Although there were no quarterfinals or semifinals in 1974 and 1978, the winners of the second-stage groups played the final, and the second-placed teams played a match to determine third and fourth place. Therefore, we can instead identify the top 8 and the top 4 in these tournaments as proxy measures for success. In 1982, the first group stage with six groups of four teams yielded 12 teams advancing to the second group stage with four groups of three teams each. The winners of the second-stage groups then advanced to the semifinals. In a similar fashion, we can instead identify the top 12 in the 1982 tournament as a proxy measure of success. So, our first measure of success is reaching the quarterfinal (or top 8 in 1974–1978 and top 12 in 1982), and our second measure of success is reaching the semifinal (or top 4 in 1974–1978).
4.1 Impact of group opponents rating on reaching the quarterfinal
Our first dependent variable is QF
it
= 1 if team i reached the quarterfinal in World Cup t, top 8 in 1974–1978, or top 12 in 1982, and 0 otherwise. Our results are robust when we omit the 1982 World Cup. We control for several factors which can affect reaching the quarterfinal. First, we control for the number of teams, N
t
, in World Cup t. Second, teams playing in their home continent can benefit from climatic conditions, cultural circumstances, and shorter travel distances for their fans (Groll, Schauberger, and Tutz 2015; Monks and Husch 2009). We control for a home continent advantage with HC
it
= 1 if World Cup t was held in the home continent of team i, and 0 otherwise. Third, in theory, seeded teams are the stronger teams. Seeded teams avoid playing each other in the (first) group stage. We control for the potential benefit of being seeded (Monks and Husch 2009) with S
it
= 1 if team i was a seeded team from pot 1 in World Cup t. Fourth, we control for the strength of team i in World Cup t with r
it
. As described in Section 3, home advantage for the host is included in the host rating. For our key independent variable of interest, group opponents rating for team i in World Cup t, we use both goppr
it
and
We do not include dummy variables for the different eras because the main effect of eras is captured by the number of teams, N t . A negative value for β1 means that a team playing in a World Cup with more teams has a lower probability of reaching the quarterfinal. A positive value for β2 means that a team playing in its home continent has a higher probability of reaching the quarterfinal. A positive value for β3 means that a seeded team has a higher probability of reaching the quarterfinal. A positive value for β4 means that a higher quality team has a higher probability of reaching the quarterfinal. A negative value for β5 implies that a team playing against higher quality opponents in the group stage has a lower probability of reaching the quarterfinal. A positive value for β5j means that in era j the seeding system reduced the negative impact of group opponents rating on the probability of reaching the quarterfinal.
When conducting logistic regression, Hosmer, Lemeshow, and Sturdivant (2013) recommend at least 10 observed events per independent variable to avoid overfitting. For the 17 World Cups in years 1954–1978 and 1986–2022, we have 17 × 8 = 136 top-8 observations. Combined with the top 12 teams in 1982, we have a total of 148 success observations. So, applying the rule of ten events per variable, we can include at most 14 independent variables. Since we include only 9 independent variables in the full model, we are not at risk of overfitting.
Table 3 shows the results of the logistic regression for reaching the quarterfinal. In Model (1), the positive and statistically significant estimate for β4 indicates that higher quality teams have a higher probability of reaching the quarterfinal. The negative and statistically significant estimate for β5 supports the notion that playing against tougher opponents in the group reduces the probability of reaching the quarterfinal.[2] Model (2) shows that the impact of group opponents rating is robust if we measure group opponents ratings by averaging the ratings of the two strongest opponents in the group.
Logistic regression models: top 8 in 1954–1978 and 1986–2022 or top 12 in 1982.
| (1) | (2) | (3) | |
|---|---|---|---|
| Constant, β0 | 5.034 | 1.631 | 5.455 |
| (5.425) | (4.988) | (6.383) | |
| Number of teams, β1 | −0.099*** | −0.093*** | −0.096 |
| (0.020) | (0.020) | (0.091) | |
| Home continent, β2 | 0.349 | 0.398 | 0.376 |
| (0.252) | (0.251) | (0.258) | |
| Seed, β3 | 0.566 | 0.509 | 0.569 |
| (0.309) | (0.313) | (0.310) | |
| Team rating, β4 | 0.0068*** | 0.0071*** | 0.0067*** |
| (0.0012) | (0.0012) | (0.0012) | |
| Group opponents rating (all 3), β5 | −0.0088*** | −0.0090*** | |
| (0.0024) | (0.0026) | ||
| Group opponents rating (best 2), β5 | −0.0070*** | ||
| (0.0021) | |||
| Group opponents rating (all 3) × D1978–1986, β52 | 0.0001 | ||
| (0.0004) | |||
| Group opponents rating (all 3) × D1990–1994, β53 | −0.0001 | ||
| (0.0004) | |||
| Group opponents rating (all 3) × D1998–2006, β54 | −0.0000 | ||
| (0.0008) | |||
| Group opponents rating (all 3) × D2010–2022, β55 | 0.0000 | ||
| (0.0008) | |||
| LR χ2 | 150.49*** | 147.94*** | 151.56*** |
| Pseudo R2 | 0.271 | 0.266 | 0.273 |
| Number of observations | 432 | 432 | 432 |
-
Dependent variable: Reach the Quarterfinal (or top 8 in 1974–1978, or top 12 in 1982). Standard errors in parentheses. * Significant at 0.05, ** at 0.01, and *** at 0.001.
For each model, the LR χ2 rejects the null hypothesis that all coefficients are zero. The pseudo R2 in Table 3 is the McFadden pseudo R2. Hemmert et al. (2018) derive sample-sensitive benchmark values for McFadden pseudo R2. All models in Table 3 have 432 observations and the percentage of success (top 8 in 1954–1978 and 1986–2022 or top 12 in 1982) is 34 %. For models with more than 200 observations and percentage of success under 38 % or above 62 %, McFadden R2 values between 0.11 and 0.20 indicate good model fit, and values above 0.20 indicate excellent fit (Hemmert et al. 2018). All models in Table 3 have a pseudo R2 above 0.20 indicating excellent model fit.
Next, we illustrate the impact of group opponents rating on the probability of reaching the quarterfinal. In Appendix A.1, we re-estimate Model (1) without the statistically insignificant variables. Let
In Figure 4A, we plot

Impact of group opponents rating (all 3 opponents) on reaching the quarterfinal (or top 8 in 1974–1978, or top 12 in 1982). Estimated probability of reaching the quarterfinal in 16-, 24-, and 32-team World Cups for an average team. The observed ranges in group opponents rating (all 3) for 16-, 24-, and 32-team World Cups were 1,699 to 2,022, 1,727 to 1,978, and 1,651 to 2,007 respectively.
Similarly, in Figure 4B, we use the estimates from Model (6) in Table 5 to plot

Impact of group opponents rating (strongest 2 opponents) on reaching the quarterfinal (or top 8 in 1974–1978, or top 12 in 1982). Estimated probability of reaching the quarterfinal in 16-, 24-, and 32-team World Cups for an average team. The observed ranges in group opponents rating (strongest 2) for 16-, 24-, and 32-team World Cups were 1,766 to 2,061, 1,755 to 2,045, and 1,713 to 2,054 respectively.
Model (3) in Table 3 shows that none of the estimates for β5j are statistically significant. Hence, none of the seeding systems reduced the negative impact of group opponents rating on the probability of reaching the quarterfinal estimated for 1954–1974. We find the same if we use group opponents rating for only the strongest two opponents. We discuss these findings in Section 5.
4.2 Impact of group opponents rating on reaching the semifinal
Our second dependent variable is SF it = 1 if team i reached the semifinal in World Cup t or top 4 in 1974–1978, and 0 otherwise. Table 4 shows the logistic regression results. For the 18 World Cups from 1954 through 2022, we have 18 × 4 = 72 top-4 observations. Applying the rule of ten events per variable, we can include at most 7 independent variables. Since we include 5 independent variables, we are not at risk of overfitting. In Model (1), the estimate for β5 is not significant. So, in contrast to our quarterfinal analysis, a higher group opponents rating does not reduce the probability of reaching the semifinal. This finding is robust in Model (2) when we use only the two strongest opponents in the group to calculate group opponents rating. For each model, the LR χ2 rejects the null hypothesis that all coefficients are zero. The pseudo R2 values are above 0.20 indicating excellent model fit.
Logistic regression models: top 4 in 1954–2022.
| (1) | (2) | |
|---|---|---|
| Constant, β0 | −6.928 | −4.623 |
| (6.543) | (6.092) | |
| Number of teams, β1 | −0.062** | −0.066** |
| (0.023) | (0.023) | |
| Home continent, β2 | 0.538 | 0.549 |
| (0.294) | (0.294) | |
| Seed, β3 | 0.763* | 0.686 |
| (0.348) | (0.353) | |
| Team rating, β4 | 0.0068*** | 0.0067*** |
| (0.0015) | (0.0015) | |
| Group opponents rating (all 3), β5 | −0.0035 | |
| (0.0028) | ||
| Group opponents rating (best 2), β5 | −0.0045 | |
| (0.0025) | ||
| LR χ2 | 86.73*** | 88.40*** |
| Pseudo R2 | 0.223 | 0.227 |
| Number of observations | 432 | 432 |
-
Dependent variable: Reach the Semifinal (or top 4 in 1974–1978). Standard errors in parentheses. * Significant at 0.05, ** at 0.01, and *** at 0.001.
4.3 Impact on group winners
Following Lapré and Palazzolo (2022), we explore an alternative explanation for the substantial variation in

Range in group opponents rating for the group winners. Number of groups in 1954–1978: 4, 1982–1994: 6, 1998–2022: 8.
5 Longitudinal assessment of FIFA’s seeding systems
To create balance across groups, FIFA identifies the stronger teams as seeds and places seeds in different groups. Table 2 shows the evolution of the seeding systems used by FIFA. In Section 4.1, we found that none of the seeding systems lessened the negative impact of group opponents rating on the probability of reaching the quarterfinal observed for the earlier years 1954–1974.
1954–1974. Prior to 1978, the FIFA Organising Committee decided on seeds in a closed session (FIFA 2014b). In 1954, there were 8 seeds (half of the participating teams). There were no seeds in 1958 and 1970. In each of the other years (i.e., 1962, 1966, 1974), two of the four seeds did not survive the group stage. These years illustrate how FIFA’s early decisions in closed sessions boiled down to a 50/50 proposition for seeds to advance to the quarterfinal. Consequently, these seeding decisions contributed to a marginal extent to create competitive balance.
1978–1986. “The division of teams into groups was made by the Organising Committee in a public session by means of seeding and a draw having regard inter alia to the geographical position of the countries represented” (FIFA 2014b, p. 3). Drawing teams from pots that are based on geography can lead to groups with unequal strengths (Guyon 2015; Lapré and Palazzolo 2022). So, it is not surprising that the coefficient for group opponents rating for 1978–1986 in Table 3 did not significantly change from the previous era.
1990–1994. After each World Cup, FIFA creates a World Cup ranking as follows. The outcomes of the final and the match for third place determine the rankings for the first four teams. The losing quarterfinalists are ranked 5 through 8 based on all matches played (3 points for a win, 1 point for a draw, and 0 points for a loss). The teams eliminated in the round of 16 are ranked 9 through 16 based on all matches played, and teams eliminated in the group stage are ranked 17 through 24 based on the three matches played in the group stage. FIFA’s World Cup rankings do not control for the strength of the opponents which is a serious drawback. To determine seeds for 1990, “[t]he ranking obtained at the last two FIFA World Cups was decisive, with the rank gained in Mexico 1986 counting double” (FIFA 2014b, p. 3). For 1994, FIFA used the World Cup rankings in the last three World Cups. In 1990 and 1994, all seeded teams survived the group stage. In 1990, 4 of the 6 seeds advanced to the quarterfinal, whereas in 1994, 3 out of 6 seeds advanced to the quarterfinal. As Table 3 shows, this seeding system did not lessen the impact of group opponents rating on the probability of reaching the quarterfinal. Even though this era was a step in the right direction with an attempt to take team strength into account, ample opportunity for improvement remained. First, World Cup rankings failed to consider the strength of opponents. Second, performance going back 8–12 years is not very informative as teams have a lot of turnover among their players.
1998–2006. For 1998 and 2002, “[t]he seeded teams were determined upon the finalists’ performance in the past three FIFA World Cup finals (ratio 3:2:1), and their position over the past three years in the monthly FIFA/Coca-Cola Ranking (equal ratio)” FIFA (2014b, p. 2). For 2006, this system was modified by only using the past two FIFA World Cup rankings and the FIFA Men’s World rankings. As Table 3 shows, in terms of mitigating the impact of group opponents rating on the probability of reaching the quarterfinal, this system did not significantly improve over the earlier years 1954–1974. First, World Cup rankings are problematic and going back 12 (or 8) years results in using outdated information. Second, as discussed in Section 2, FIFA Men’s World rankings in this era are problematic (Cea et al. 2020; Lasek et al. 2016; Lasek, Szlávik, and Bhulai 2013).
2010–2022. In this era, FIFA uses the Men’s World ranking from eight months before the World Cup. Since 2018, FIFA has created all four pots based on the Men’s World ranking. Again, this system did nothing to lessen the impact of group opponents rating on the probability of reaching the quarterfinal estimated for the earlier years 1954–1974 (Table 3). While eliminating past FIFA World Cup rankings and focusing on recent performance are steps in the right direction, for 2010–2018 recent performance was measured using the flawed FIFA Men’s World rankings.
6 Composition of the late stages of the tournament
Figures 2 and 3 illustrate the evolution of competitive imbalance with the ranges in group strength and group opponents rating, respectively. If the imbalance in the group stage increases, that should result in a reduction in the predictability of the tournament outcomes. Next, we assess the composition of the late stages of the tournament to find out if the highest ranked teams advance. For each World Cup t, we rank the participating teams based on their Elo rating at the time of the draw from 1 to N t . If a tournament has high predictability, the average rank of the quarterfinalists would be close to 4.5 which is the average rank of the teams ranked 1 through 8. Similarly, a highly predictable tournament would have an average rank for the semifinalists close to 2.5 which is the average rank of the teams ranked 1 through 4. Figure 6 shows the average rank among participants (at the time of the draw) for the quarterfinalists (QF), the semifinalists (SF), and the losing quarterfinalists (LQF).
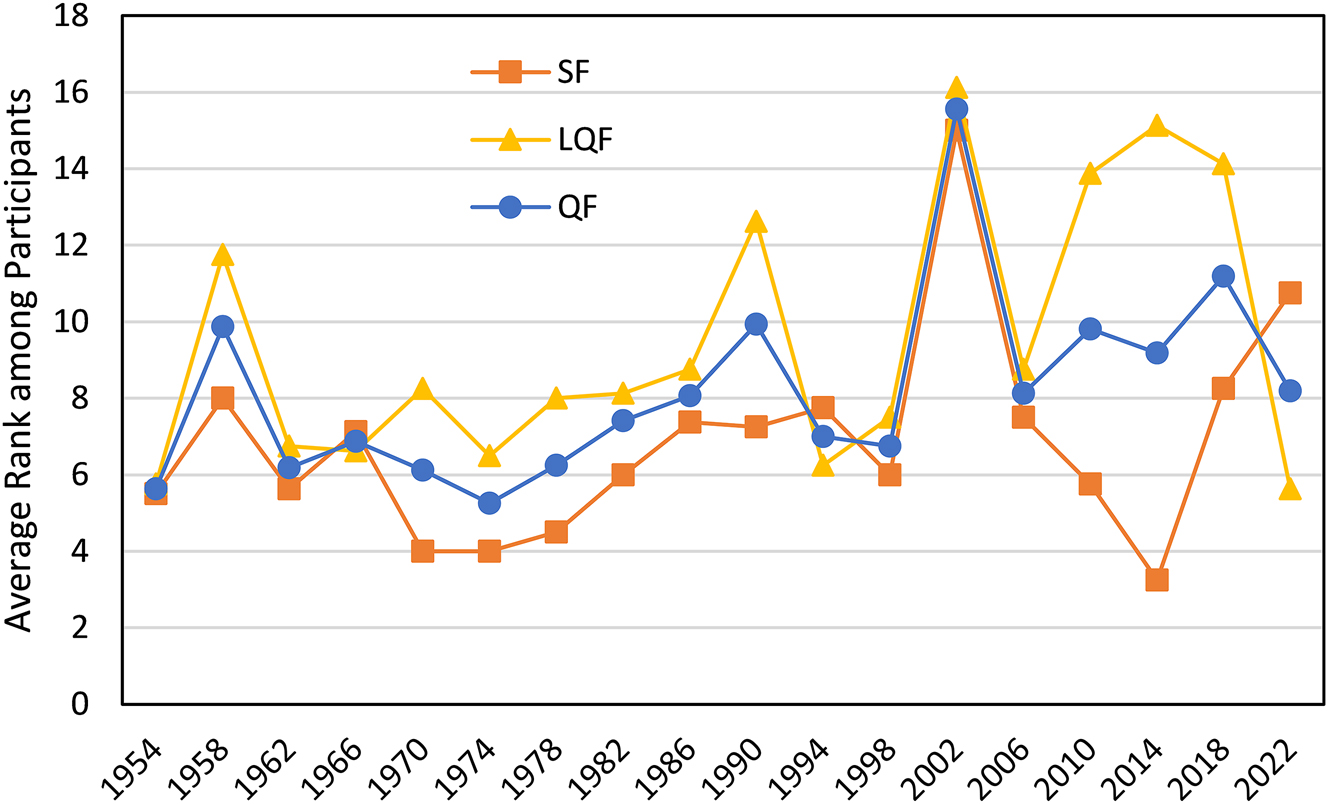
Average rank among participants (at the time of the draw) of top 8 in 1954–2022 or top 12 in 1982 (QF), top 4 (SF), and top 8 (or 12 in 1982) that do not reach the top 4 (LQF). Number of groups in 1954–1978: 4, 1982–1994: 6, 1998–2022: 8.
In Figure 2, we note an increase in the range in group strength with the expansion to 24-team World Cups in 1982. This increase mirrors the increase in the average rank of quarterfinalists and semifinalists during the 24-team World Cups in 1982 through 1994 in Figure 6. However, the reduction in predictability could be due to the increased number of participants as well as the design of a single-group stage with 24 teams. More interesting is the comparison of the seven 32-team World Cups. If we look at the range in groups strength measured by the three strongest teams in the group, Figure 2 shows this range to be larger in 2002, 2010, 2014, and 2018. These four World Cups also have a higher average rank for the quarterfinalists in Figure 6. Conversely, the three years with a lower range in group strength (again strongest three teams) in Figure 2, 1998, 2006, and 2022, are also the three years with a lower average rank for the quarterfinalists in Figure 6, indicating higher predictability. However, predictability increases in the semifinals as shown by the lower average rank for the semifinalists.[3] The average rank discrepancy in evolution for quarterfinalists and semifinalists dovetails with the significance findings for group opponents rating in Tables 3 and 4, where we find that group opponents rating reduces the probability of reaching the quarterfinal, but not the semifinal. So, it seems that competitive imbalance has a bigger impact on the quarterfinal composition than on the semifinal composition.
7 Discussion and conclusion
Competitive balance is essential for an exciting tournament. However, groups at the World Cup show substantial competitive imbalance. For all World Cups from 1954 to 2022, the range in group opponents rating has exceeded 118 Elo rating points – the difference between an average World Cup participant and an average semifinalist. Moreover, in five of the 32-team tournaments from 1998 to 2022, the range in group opponents rating has exceeded 236 Elo rating points – twice the difference between an average participant and an average semifinalist. For an average participant in a 32-team World Cup, an increase in group opponents rating of only 88 Elo rating points –the difference between an average participant and an average quarterfinalist– can reduce the probability of reaching the quarterfinal from 0.174 to 0.081, which is a decrease of more than 50 %.
Historically, FIFA has struggled with assessing the strength of teams. From 1990 through 2006, FIFA used past World Cup rankings which failed to take opponent strength into account. From 1998 through 2018, FIFA used Men’s World rankings. Several scholars have identified numerous flaws in FIFA ranking methods through 2018.
The implementation of seeding systems has not been effective. For example, in 2018, group A consisted of teams with Elo rankings – at the time of the draw – 13 (Uruguay), 44 (seed and host Russia), 50 (Egypt), and 66 (Saudi Arabia) whereas group C contained teams with Elo rankings 5 (seed France), 12 (Peru), 18 (Denmark), and 35 (Australia). Seeding a low-ranked host country inherently contributes to competitive imbalance.
Assigning teams in the draw procedure to pots 2, 3, and 4 based on continents has further contributed to competitive imbalance. Adopting one of Guyon’s (2015) proposals for 2018, FIFA moved from continent-based pots to ranking-based pots (Guyon 2018a). While this move is a step in the right direction, the allocation of confederation slots still does not match the actual distribution of the best teams in the world (Csató 2023e). As mentioned above, group A in 2018 contained teams ranked 50 and 66 in a 32-team World Cup. The more the allocation of confederation slots matches the distribution of the best teams in the world, the more competitive imbalance can be reduced. One of FIFA’s objectives is to grow the game globally. So, some of the slots allocated to non-UEFA and non-CONMEBOL confederations foster global development. In Appendix A.2, we explain that our measures for group strength based on the three strongest teams and group opponents rating based on the two strongest opponents can be adequately used to assess competitive imbalance while still allowing for global development.
To avoid substantial competitive imbalance, we recommend simultaneous adoption of the following conditions:
Use recent performance to assess team strength
Use a rating method such as an Elo rating system to steer clear of the flaws inherent to FIFA’s earlier ranking methods
Build pots based on team strength instead of continents
Adopt a draw procedure developed to create balance (e.g., Guyon 2015; Laliena and López 2019, or Cea et al. 2020)
Do not make the host a seed by default
Allocate confederation slots more closely aligned with the distribution of the best teams in the world
Since 1930, FIFA has made some progress. By 2018, they adopted three of these six conditions: recent performance to assess team strength, pots based on team strength, and a draw procedure proposed by Guyon (2015). For 2022, they adopted a fourth condition: an Elo rating system. However, FIFA could still improve the predictive capacity of their Elo algorithm by taking home advantage and goal differential into account (Szczecinski and Roatis 2022). Moreover, the last two conditions have been neglected. By making a low-ranked host (such as Qatar ranked 51 in 2022) a seed and by having an allocation of confederation slots that does not reflect the distribution of the best teams, the World Cup will remain imbalanced.
In fact, in the draw for the 2022 World Cup, FIFA has added yet another source for potential competitive imbalance. The draw was held when only 29 out of 32 teams were known and eight teams still had yet to compete in play-offs to determine the final 3 teams. One of these slots was a European play-off slot for which Wales (ranked 18 at the time of the draw) was still a possible candidate. This European play-off team was drawn into group B with teams ranked 5 (England), 15 (United States), and 21 (Iran). If Wales were to qualify, all four teams in group B would be ranked higher than the worst two teams in each of the other groups. Wales did indeed qualify. In hindsight, Csató’s (2023a) solution would have prevented the occurrence of this group. We recommend a seventh condition:
Do not perform the draw until all participating teams are known
The good news is that FIFA has adopted some of the advice from scholarly research in attempts to make the World Cup more balanced. The not so good news is that several obstacles remain. Lastly, if FIFA were to use 16 groups of three teams in 2026, then that decision could indeed ruin the World Cup due to the increased risk of collusion (Guyon 2020).
Funding source: Vanderbilt University
Award Identifier / Grant number: Unassigned
Acknowledgments
The authors gratefully acknowledge Julia Amato and Anna Lapré for research assistance with data collection, cross-checking, and calculations. The authors thank the Associate Editor and two anonymous reviewers for the thoughtful and constructive feedback during the review process. The authors also thank participants at the INFORMS 2022 Annual Meeting, as well as seminar participants at Vanderbilt University for helpful comments.
-
Author contribution: All the authors have accepted responsibility for the entire content of this submitted manuscript and approved submission.
-
Research funding: None declared.
-
Conflict of interest statement: The authors declare no conflicts of interest regarding this article.
A.1 Control variables
Model (1) in Table 5 is the base model for reaching the quarterfinal with only the control variables. The negative and statistically significant estimate for β1 indicates that more participating teams at a World Cup reduce the probability of reaching the quarterfinal. The positive and statistically significant estimate for β2 indicates that teams playing in their home continent have a higher probability of reaching the quarterfinal. The positive and statistically significant estimate for β3 indicates that seeded teams have a higher probability of reaching the quarterfinal. In Model (2), the positive and statistically significant estimate for β4 indicates that higher quality teams have a higher probability of reaching the quarterfinal. In Model (3), the negative and statistically significant estimate for β5 supports the notion that playing against tougher opponents in the group reduces the probability of reaching the quarterfinal. Model (4) shows the same if we measure group opponents ratings by averaging only the two strongest opponents in the group. Note that the estimates for β1 and β4 are consistent across all models. However, the estimates for β2 and β3 are not statistically significant in Models (3) and (4).
Logistic regression models: top 8 in 1954–1978 and 1986–2022 or top 12 in 1982.
| (1) | (2) | (3) | (4) | (5) | (6) | |
|---|---|---|---|---|---|---|
| Constant, β0 | 0.707 | −13.552*** | 5.034 | 1.631 | 5.573 | 2.213 |
| (0.447) | (2.258) | (5.425) | (4.988) | (5.371) | (4.955) | |
| Number of teams, β1 | −0.080*** | −0.071*** | −0.099*** | −0.093*** | −0.100*** | −0.095*** |
| (0.017) | (0.018) | (0.020) | (0.020) | (0.020) | (0.020) | |
| Home continent, β2 | 0.522* | 0.408 | 0.349 | 0.398 | ||
| (0.233) | (0.246) | (0.252) | (0.251) | |||
| Seed, β3 | 1.814*** | 0.825** | 0.566 | 0.509 | ||
| (0.259) | (0.297) | (0.309) | (0.313) | |||
| Team rating, β4 | 0.0077*** | 0.0068*** | 0.0071*** | 0.0078*** | 0.0080*** | |
| (0.0012) | (0.0012) | (0.0012) | (0.0011) | (0.0011) | ||
| Group opponents rating (all 3), β5 | −0.0088*** | −0.0100*** | ||||
| (0.0024) | (0.0023) | |||||
| Group opponents rating (best 2), β5 | −0.0070** | −0.0081*** | ||||
| (0.0021) | (0.0020) | |||||
| LR χ2 | 85.36*** | 136.17*** | 150.49*** | 147.94*** | 145.10*** | 142.58*** |
| Pseudo R2 | 0.154 | 0.245 | 0.271 | 0.266 | 0.261 | 0.257 |
| Number of observations | 432 | 432 | 432 | 432 | 432 | 432 |
-
Dependent variable: Reach the Quarterfinal (or top 8 in 1974–1978, or top 12 in 1982). Standard errors in parentheses. * Significant at 0.05, ** at 0.01, and *** at 0.001.
Dropping HC it and S it in Models (5) and (6) yields the same insights as Models (3) and (4). The insignificance of home continent is not surprising as the stronger teams from UEFA (e.g., Germany and Italy) and CONMEBOL (e.g., Brazil and Argentina) tend to outperform the other teams regardless of the continent where the World Cup is played. In fact, all world champions and runners-up are from UEFA or CONMEBOL. The insignificance of the seed variable means that group opponents rating better captures the performance dynamics at the World Cup. Without group opponents rating in Model (2), seed picks up some of the variation in the data relating to seeds playing weaker opponents. However, in Models (3) and (4), group opponents rating picks up the variation in opponent strength for all teams – not just the seeded teams. Models (3) and (4) show that there is no additional effect for seed beyond the effect for group opponents rating.
A.2 Global development and imbalance
The biggest changes in allocation of confederation slots occurred whenever FIFA expanded the number of teams at the World Cup. The strongest confederations are UEFA and CONMEBOL. The combined percentage of teams from UEFA and CONMEBOL participating at the 16-, 24-, and 32-team World Cups has averaged 86 %, 74 %, and 58 % respectively. With each expansion at the World Cup, FIFA has allocated more slots to the other confederations (CONCACAF, CAF, AFC, and OFC) to help grow the game globally, i.e., global development.
Next, we show that our measures of group strength for the strongest three teams and group opponents rating for the strongest two opponents can be used to assess competitive imbalance while still allowing for global development. First, for each World Cup, we identify the participating teams by their Elo rank at the time of the draw. Second, for all 16-team World Cups, we calculate the average Elo rank of the strongest teams, the second strongest teams, down to the sixteenth strongest teams. Third, in Figure 7, we plot these average Elo ranks as curve ‘16’. Fourth, we repeat this process for 24- and 32-team World Cups. For each curve, the marker represents the strongest team in the bottom 25 % of teams. So, for the 16 curve, the marker represents the thirteenth strongest team. A significant shift upwards means that those teams have much worse Elo ranks indicative of much lower ranked teams from non-UEFA and non-CONMEBOL confederations. For the 16 curve, the “upward break” happens for the sixteenth ranked team whereas for the 32 curve, the upward break happens for the 28th team. These breaks happen in the bottom 25 % of the teams. Note that group strength for the strongest three teams and group opponents rating for the strongest two opponents ignore the bottom 25 %. As long as FIFA places the bottom 25 % in pot 4, as they have started to do since 2018, our measures can be adequately used to assess competitive imbalance while still allowing for global development with significantly lower ranked teams in the bottom 25 %.

Average Elo rank (at the time of the draw) of the ith ranked team among participants at the World Cup for the 16-, 24-, and 32-team tournaments. Point markers indicate the highest ranked team from the bottom 25% of the teams at the World Cup.
References
Baker, R. D., and I. G. McHale. 2018. “Time-Varying Rating for International Football Teams.” European Journal of Operational Research 267 (2): 659–66. https://doi.org/10.1016/j.ejor.2017.11.042.Search in Google Scholar
Cea, S., G. Durán, M. Guajardo, D. Sauré, J. Siebert, and G. Zamorano. 2020. “An Analytics Approach to the FIFA Ranking Procedure and the World Cup Final Draw.” Annals of Operations Research 286 (1–2): 199–46. https://doi.org/10.1007/s10479-019-03261-8.Search in Google Scholar
Chater, M., L. Arrondel, J.-P. Gayant, and J.-F. Laslier. 2021. “Fixing Match-Fixing: Optimal Schedules to Promote Competitiveness.” European Journal of Operational Research 294 (2): 673–83. https://doi.org/10.1016/j.ejor.2021.02.006.Search in Google Scholar
Csató, L. 2021. Tournament Design: How Operations Research Can Improve Sports Rules. Cham, Switzerland: Palgrave Macmillan.10.1007/978-3-030-59844-0Search in Google Scholar
Csató, L. 2022a. “A Paradox of Tournament Seeding.” International Journal of Sports Science & Coaching. in press. https://doi.org/10.1177/17479541221141617.Search in Google Scholar
Csató, L. 2022b. “Quantifying Incentive (In)compatibility: A Case Study from Sports.” European Journal of Operational Research 302 (2): 717–26. https://doi.org/10.1016/j.ejor.2022.01.042.Search in Google Scholar
Csató, L. 2022c. “UEFA against the Champions? An Evaluation of the Recent Reform of the Champions League Qualification.” Journal of Sports Economics 23 (8): 991–1016. https://doi.org/10.1177/15270025221074700.Search in Google Scholar
Csató, L. 2023a. “Group Draw with Unknown Qualified Teams: A Lesson from 2022 FIFA World Cup.” International Journal of Sports Science & Coaching 18 (2): 539–51. https://doi.org/10.1177/17479541221108799.Search in Google Scholar
Csató, L. 2023b. “How to Avoid Uncompetitive Games? The Importance of Tie-Breaking Rules.” European Journal of Operational Research 307 (3): 1260–9. https://doi.org/10.1016/j.ejor.2022.11.015.Search in Google Scholar
Csató, L. 2023c. “Mitigating the Risk of Tanking in Multi-Stage Tournaments.” Manuscript. arXiv.2211.16054.10.1007/s10479-024-06311-ySearch in Google Scholar
Csató, L. 2023d. “On the Fairness of the Restricted Group Draw in the 2018 FIFA World Cup.” Manuscript. arXiv: 2103.11353.Search in Google Scholar
Csató, L. 2023e. “Quantifying the Unfairness of the 2018 FIFA World Cup Qualification.” International Journal of Sports Science & Coaching 18 (1): 183–96. https://doi.org/10.1177/17479541211073455.Search in Google Scholar
Corona, F., D. Forrest, J. D. Tena, and M. Wiper. 2019. “Bayesian Forecasting of UEFA Champions League under Alternative Seeding Regimes.” International Journal of Forecasting 35 (2): 722–32. https://doi.org/10.1016/j.ijforecast.2018.07.009.Search in Google Scholar
Dagaev, D., and V. Y. Rudyak. 2019. “Seeding the UEFA Champions League Participants: Evaluation of the Reform.” Journal of Quantitative Analysis in Sports 15 (2): 129–40. https://doi.org/10.1515/jqas-2017-0130.Search in Google Scholar
Engist, O., E. Merkus, and F. Schafmeister. 2021. “The Effect of Seeding on Tournament Outcomes: Evidence from a Regression-Discontinuity Design.” Journal of Sports Economics 22 (1): 115–36. https://doi.org/10.1177/1527002520955212.Search in Google Scholar
FIFA. 2014a. “2014 FIFA World Cup Brazil: Technical Report and Statistics.” https://web.archive.org/web/20180915095404/https://www.fifa.com/mm/document/footballdevelopment/technicalsupport/02/42/15/40/2014fwc_tsg_report_15082014_neutral.pdf (accessed January 5, 2022).Search in Google Scholar
FIFA. 2014b. “FACT Sheet: FIFA World Cup Seeded Teams since 1930.” https://digitalhub.fifa.com/m/79d9ab359eab12f3/original/g6sxbyxsmoqdxz3firrz-pdf.pdf (accessed January 10, 2022).Search in Google Scholar
FIFA. 2018. “More Than Half the World Watched Record-Breaking 2018 World Cup.” https://www.fifa.com/tournaments/mens/worldcup/2018russia/media-releases/more-than-half-the-world-watched-record-breaking-2018-world-cup (accessed January 23, 2022).Search in Google Scholar
Gásquez, R., and V. Royuela. 2016. “The Determinants of International Football Success: A Panel Data Analysis of the Elo Rating.” Social Science Quarterly 97 (2): 125–41. https://doi.org/10.1111/ssqu.12262.Search in Google Scholar
Groll, A., G. Schauberger, and G. Tutz. 2015. “Prediction of Major International Soccer Tournaments Based on Team-specific Regularized Poisson Regression: An Application to the FIFA World Cup 2014.” Journal of Quantitative Analysis in Sports 11 (2): 97–115. https://doi.org/10.1515/jqas-2014-0051.Search in Google Scholar
Groll, A., G. Schauberger, and H. Van Eetvelde. 2020. “Ranking and Prediction Models for Football Data.” In Science Meets Sports: When Statistics Are More than Numbers, edited by C. Ley and Y. Dominicy, 95–122. Newcastle upon Tyne: Cambridge Scholars Publishing.Search in Google Scholar
Guyon, J. 2015. “Rethinking the FIFA World Cup Final Draw.” Journal of Quantitative Analysis in Sports 11 (3): 169–82. https://doi.org/10.1515/jqas-2014-0030.Search in Google Scholar
Guyon, J. 2018a. “Pourquoi la Coupe du Monde est plus equitable cette année.” In The Conversation June 13. https://theconversation.com/pourquoi-la-coupe-du-monde-est-plus-equitable-cette-annee-97948 (accessed April 19, 2022).Search in Google Scholar
Guyon, J. 2018b. “What a Fairer 24 Team UEFA Euro Could Look like.” Journal of Sports Analytics 4 (4): 297–317. https://doi.org/10.3233/jsa-180219.Search in Google Scholar
Guyon, J. 2020. “Risk of Collusion: Will Groups of 3 Ruin the FIFA World Cup?” Journal of Sports Analytics 6 (4): 259–79. https://doi.org/10.3233/jsa-200414.Search in Google Scholar
Haan, M., R. H. Koning, and A. van Witteloostuijn. 2007. “Competitive Balance in National European Soccer Competitions.” In Statistical Thinking in Sports, edited by J. Albert and R. H. Koning, 63–75. Boca Raton: CRC Press.10.1201/9781584888697.ch4Search in Google Scholar
Hemmert, G. A. J., L. M. Schons, J. Wieseke, and H. Schimmelpfennig. 2018. “Log-Likelihood-Based Pseudo-R2 in Logistic Regression: Deriving Sample-Sensitive Benchmarks.” Sociological Methods & Research 47 (3): 507–31. https://doi.org/10.1177/0049124116638107.Search in Google Scholar
Hosmer, D. W., S. Lemeshow, and R. X. Sturdivant. 2013. Applied Logistic Regression, 3rd ed.. Hoboken, New Jersey: John Wiley & Sons.10.1002/9781118548387Search in Google Scholar
Jones, M. C. 1990. “The World Cup Draw’s Flaws.” The Mathematical Gazette 74 (470): 335–8. https://doi.org/10.2307/3618128.Search in Google Scholar
Kaminski, M. M. 2022. “How Strong Are Soccer Teams? The “Host Paradox” and Other Counterintuitive Properties of FIFA’s Former Ranking System.” Games 13 (2): 22. https://doi.org/10.3390/g13020022.Search in Google Scholar
Koning, R. H. 2000. “Balance in Competition in Dutch Soccer.” The Statistician 49 (3): 419–31. https://doi.org/10.1111/1467-9884.00244.Search in Google Scholar
Koning, R. H. 2017. “Rating of Team Abilities in Soccer.” In Handbook of Statistical Methods and Analyses in Sports, edited by J. Albert, M. E. Glickman, T. B. Swartz, and R. H. Koning, 355–71. Boca Raton: CRC Press.Search in Google Scholar
Krumer, A., and J. Moreno-Ternero. 2023. “The Allocation of Additional Slots for the FIFA World Cup.” Journal of Sports Economics. In press. https://doi.org/10.1177/15270025231160757.Search in Google Scholar
Laliena, P., and F. J. López. 2019. “Fair Draws for Group Rounds in Sport Tournaments.” International Transactions in Operational Research 26 (2): 439–57. https://doi.org/10.1111/itor.12565.Search in Google Scholar
Lapré, M. A., and E. M. Palazzolo. 2022. “Quantifying the Impact of Imbalanced Groups in FIFA Women’s World Cup Tournaments 1991–2019.” Journal of Quantitative Analysis in Sports 18 (3): 187–99. https://doi.org/10.1515/jqas-2021-0052.Search in Google Scholar
Lasek, J., Z. Szlávik, and S. Bhulai. 2013. “The Predictive Power of Ranking Systems in Association Football.” International Journal of Applied Pattern Recognition 1 (1): 27–46. https://doi.org/10.1504/ijapr.2013.052339.Search in Google Scholar
Lasek, J., Z. Szlávik, M. Gagolewski, and S. Bhulai. 2016. “How to Improve a Team’s Position in the FIFA Ranking? A Simulation Study.” Journal of Applied Statistics 43 (7): 1349–68. https://doi.org/10.1080/02664763.2015.1100593.Search in Google Scholar
Ley, C., T. Van de Wiele, and H. Van Eetvelde. 2019. “Ranking Soccer Teams on the Basis of Their Current Strength: A Comparison of Maximum Likelihood Approaches.” Statistical Modelling 19 (1): 55–73. https://doi.org/10.1177/1471082x18817650.Search in Google Scholar
McHale, I., and S. Davies. 2007. “Statistical Analysis of the Effectiveness of the FIFA World Rankings.” In Statistical Thinking in Sports, edited by J. Albert and R. H. Koning, 77–90. Boca Raton: CRC Press.10.1201/9781584888697.ch5Search in Google Scholar
Monks, J., and J. Husch. 2009. “The Impact of Seeding, Home Continent, and Hosting on FIFA World Cup Results.” Journal of Sports Economics 10 (4): 391–408. https://doi.org/10.1177/1527002508328757.Search in Google Scholar
Rathgeber, A., and H. Rathgeber. 2007. “Why Germany Was Supposed to Be Drawn in the Group of Death and Why it Escaped.” Chance 20 (2): 22–4. https://doi.org/10.1080/09332480.2007.10722842.Search in Google Scholar
Scarf, P. A., and M. M. Yusof. 2011. “A Numerical Study of Tournament Structure and Seeding Policy for the Soccer World Cup Finals.” Statistica Neerlandica 65 (1): 43–57. https://doi.org/10.1111/j.1467-9574.2010.00471.x.Search in Google Scholar
Stone, C., and M. Rod. 2016. “Unfair Play in World Cup Qualification? An Analysis of the 1998–2010 FIFA World Cup Performances and the Bias in the Allocation of Tournament Berths.” Soccer and Society 17 (1): 40–57, https://doi.org/10.1080/14660970.2014.891985.Search in Google Scholar
Stronka, W. 2020. “Anti-Tanking Pair Matching before an Elimination Phase of a Two-phase Tournament.” Economies 8 (3): 66. https://doi.org/10.3390/economies8030066.Search in Google Scholar
Szczecinski, L., and I.-I. Roatis. 2022. “FIFA Ranking: Evaluation and Path Forward.” Journal of Sports Analytics 8 (4): 231–50. https://doi.org/10.3233/jsa-200619.Search in Google Scholar
Van Eetvelde, H., and C. Ley. 2019. “Ranking Methods in Soccer.” In Wiley StatsRef: Statistics Reference Online, edited by R. S. Kenett, T. N. Longford, W. Piegorsch, and F. Ruggeri, 1–9. Hoboken, New Jersey: Springer.10.1002/9781118445112.stat08161Search in Google Scholar
© 2023 the author(s), published by De Gruyter, Berlin/Boston
This work is licensed under the Creative Commons Attribution 4.0 International License.
Articles in the same Issue
- Frontmatter
- Research Articles
- A Bayesian analysis of the time through the order penalty in baseball
- Parking the bus
- Bayesian analysis of Formula One race results: disentangling driver skill and constructor advantage
- Simplified Kalman filter for on-line rating: one-fits-all approach
- The evolution of seeding systems and the impact of imbalanced groups in FIFA Men’s World Cup tournaments 1954–2022