No cheering in the background? Individual performance in professional darts during COVID-19
-
Finn Spilker
 and
Marius Ötting
and
Marius Ötting

Abstract
The COVID-19 pandemic has led to a global shutdown of sporting activities. While professional sports competitions restarted in mid-2020, spectators were usually not allowed. This paper investigates the effect of absent fans and reduced social pressure on performance in professional darts – a setting where individual player performances can be well observed. Considering almost five years of tournament data, we use Bayesian multilevel models to investigate potential heterogeneity across players concerning reduced social pressure. For our analysis, we consider the two main performance measures in darts: the three-dart average and the checkout performance. Our results indicate that the effect of reduced social pressure on performance varies substantially across players. We further find experienced players to be less affected by social pressure compared to relatively inexperienced players.
1 Introduction
The COVID-19 pandemic, which broke out in Europe in March 2020, massively altered global work conditions and limited social interactions (e.g., Narayanamurthy and Tortorella 2021; Saleem et al. 2021; Sembiring et al. 2020). Even sports – especially spectator sports – faced a novel setting for athletes, as full stadiums and cheering fans gave way to different and unfamiliar conditions with partially or entirely absent audiences. This raises the question of how this altered social pressure affects athletes’ performance.
The concept of social pressure influencing individual performance traces back to Allport (1924) and Zajonc (1965), who formulated the social facilitation theory. As a natural experiment, the pandemic and its concomitants spawned numerous studies analysing the impact of reduced social pressure. These studies primarily examine (a) the diminished home advantage in team sports, likely stemming from absent fan support and reduced social pressure on referees, and (b) an altered referee bias per se. Reade et al. (2022) summarise over 20 studies published since the pandemic outbreak. As previous studies on the effects of the COVID-19 pandemic mainly focused on team sports, there are – to the best of our knowledge – no studies investigating potential changes in the individual performance of professional athletes due to (changed) social pressure.
To investigate potential changes in individual performance, we consider professional darts – a setting with minimal to no interaction between players and with only a few potential confounding factors. In addition, darts is well known for having a symbiotic connection between players and fans, which makes it well suited for analysing the influence of social pressure. For our analysis, we consider Bayesian multilevel models to investigate player-specific effects of the changed social pressure on performance. Our results suggest that players cope differently with social pressure, as some players increased their performance during COVID-19, while for others, we find a decreasing effect. Moreover, our analysis reveals that the effect of changed social pressure varies with players’ experience. In particular, more experienced players tend to perform better under standard conditions, i.e., in the presence of many spectators, than less experienced players.
The paper is structured as follows. Section 2 presents the related literature on (1) findings on the performance under (social) pressure and (2) the effects of COVID-19 on the performance of athletes. Our data set is introduced in Section 3, where we also explain the two darts performance measures used throughout our analysis. Section 4 presents the Bayesian multilevel models considered for our analysis, and Section 5 covers the results.
2 Related literature
Our study draws on the literature on performance under social pressure in sports. Dohmen (2008) summarises that spectators’ presence can affect individuals’ performance negatively and positively, reflecting the somewhat unclear picture of sports economic research. Studies conclude that supportive fans can improve athletes’ performance in football and basketball (Greer 1983; Ponzo and Scoppa 2018; Varca 1980). For football, many studies investigate whether the home advantage was reduced by analysing matches played without spectators due to COVID-19, reporting that fans are a key factor for the home advantage (see, e.g., Correia-Oliveira and Andrade-Souza 2022; Dilger and Vischer 2020; Fischer and Haucap 2021). Contradictory, other studies arrive at different conclusions, according to which team and individual performances decrease in front of a supportive crowd, for example, in golf, basketball, baseball, or biathlon (see, e.g., Baumeister and Steinhilber 1984; Böheim et al. 2019; Harb-Wu and Krumer 2019; Wright et al. 1991). Moore and Brylinsky (1993), Priks (2013) and Roşca (2020) find indications for both a negative as well as a positive effect of spectator presence or the quality of their support on team performance in football and basketball.
To better explain these contradictory results, we consider the theory of social facilitation, on which many of the above-mentioned studies are based. The social facilitation paradigm, introduced by Allport (1924), states that individual performances and decisions can be affected by the presence of third parties. Incorporating such audience effects into a conceptual framework, Zajonc (1965) extends the social facilitation theory and states that social pressure increases the probability of observing familiar behaviour patterns. Frequently repeated and well-rehearsed routines typically characterise such patterns. Consequently, tasks considered “simple” are easier for the individual to solve under social pressure than complex or novel tasks (Bond and Titus 1983; Zajonc 1965). In addition, the question of whether spectators impair or increase athletes’ performance is a function of both the nature of the task and the degree of individual expertise (Harkins 1987; Ötting et al. 2020). Accordingly, the social facilitation theory assumes two factors influencing performance with an audience: task complexity and task expertise. Task expertise pertains to the individual’s experience, irrespective of task design, often measured by the frequency of task completion. With identical tasks, experienced athletes thus benefit from spectator presence, while less experienced individuals are adversely affected.
When analysing social pressure, we do not anticipate a universal effect on all individuals but consider specific moderating factors that influence how individuals respond to pressure. While various studies demonstrate the impact of spectators on individual performance, limited evidence exists regarding the factors that influence the crowd effect itself. Consequently, some papers try to isolate not only individual performance (see, e.g., Bransen et al. 2019; Epting et al. 2011; Gallagher et al. 2021) but also personal characteristics as they expect them to determine how individuals cope with social pressure. While Geukes et al. (2012) found that social pressure affects handball players, their results also suggest that individual factors such as private self-consciousness moderate how players cope with spectator presence. Caselli et al. (2023) refer to the playing characteristics of footballers in Italy and highlight that the performance of African and dark-skinned players suffers from social pressure, as they have been victims of racial hostility in the past. Heinrich et al. (2021) analyse gender-specific differences in response to social pressure of professional biathletes. Female biathletes improved their performance in coordination tasks but worsened it in conditioning tasks (compared to events held under COVID-19 restrictions without spectators). The opposite was observed for male athletes. Analysing baseball data, Jane (2022) finds a negative effect of spectator size on the probability of a successful hit. However, this effect vanished among so-called star players, indicating that they are more prone to coping with social pressure.
Consequently, the individual factors moderating the handling of social pressure can be manifold. In addition, social facilitation suggests an individual’s experience as a further moderator. Capturing individual experience, Livingston (2012) finds that golfers’ experience significantly moderates how they cope with competitive pressure, even though he cannot identify the direction of the effect. Examining male and female tennis players, Jetter and Walker (2015) find a negative moderating effect of experience for men and a positive effect for women in investigating a potential hot hand effect. Beyond these studies, limited research exists on social pressure using sports data and how individual experience moderates its impact on performance. Otten (2009) analyses the free-throw performance of experienced basketball players when they were videotaped and when not, suggesting that players under social pressure performed better compared to when not being filmed. Beilock et al. (2002) investigate how experienced and inexperienced footballers perform under external distractions. In a dribbling task using both the strong and weak foot, experienced players exhibited worse performance with their weak foot under external distraction. In contrast, inexperienced players required high effort regardless of the foot used. This suggests that more experienced players may struggle to cope with new settings. Analysing how football referees deal with social pressure, Nevill et al. (2002) and Dawson (2012) find that more experienced referees are less influenced by home supporters and, hence, by social pressure.
Our contribution explores the impact of both social pressure and players’ experience. We analyse performance data of individual darts players from tournaments before and after the COVID-19 pandemic outbreak, which imposed substantial restrictions, including limited to no spectators and strict audience behaviour rules. As darts is usually known for enormous crowd noise and fan chants, the atmosphere and thus the social pressure exerted on the athletes during matches changed considerably (Davis 2022a,b). Although several studies have investigated the consequences of a non-existent audience due to COVID-19, there is no analysis for professional darts. Moreover, only a few studies shed light on individual performances in response to (changed) social pressure and whether an athlete’s experience can explain changes in performance. While Jetter and Walker (2015) also investigate individual-specific effects in tennis, performance in darts can be attributed to individual players more easily. In particular, while performance in tennis depends on external factors such as the opponent’s skills, the referees, or the weather, such factors can be neglected in darts since it is played indoors and without (potentially subjective) refereeing decisions. Also, there is minimal to no interaction between players, i.e., a player cannot affect the opponents’ performance. In contrast to Beilock et al. (2002) and Otten (2009), our data are derived from actual competitions, where the social pressure is thus not artificially generated but is given an actual crowd.
Darts thus provides a nearly ideal and unique setting to analyse individual performance under changed social pressure in a highly professional environment. Following the social facilitation theory and in line with Ötting et al. (2020), we consider throwing a dart as a simple task as it is highly standardised and repeated many times by the players. Moreover, this paper addresses another possible determinant of the ability to cope with (changed) social pressure, namely, a player’s experience. Based on the social facilitation theory outlined above, we assume inexperienced players cope differently with social pressure compared to more experienced players.
3 Data
Our data set – taken from http://live.dartsdata.com/ – covers 3310 darts matches played between February 2017 and May 2021 across 103 tournaments organised by the Professional Darts Corporation (PDC). Since a darts match involves two players, we collected data for both to analyse their performance, totalling in n = 6, 620 observations. All matches follow the 501-up format, where both players begin with 501 points and take their turns one after another. A player throws three darts within each turn, with a segment’s value hit by each dart being reduced from the current score. The first player to reach exactly 0 points wins a so-called ’leg’. The last dart thrown to reduce the score to 0 must hit a double or the bull’s-eye (so-called ’double out’ format). To win a match, a player must be the first to win a prespecified number of legs.
In our data, each row contains two player performance measures together with some further variables on the match itself, which will be introduced below (such as the heterogeneity across players). To measure a player’s performance in a given match, we consider the three-dart average and the success rate on double fields, which we introduce in the following.
While previous COVID literature also suggests analysing referee performance, particularly in football (Bryson et al. 2021; Reade et al. 2022; Scoppa 2021), referees only play a very minor role in darts. The rules of darts are simple and objective, encompassing factors such as the distance from the foot to the dartboard or the distance of the non-throwing player to the opponent. A darts referee ensures compliance with the rules but does not make subjective decisions such as assessing fouls. The overriding task of the referee, also known as the ’caller’, is to loudly announce the points thrown. Referees in darts can thus not affect players’ performance.
3.1 Three-dart average and checkout performance
Players aim for high numbers to rapidly reduce their score, with the maximum possible score in a single turn, consisting of three darts, being 180 points. Therefore, a natural strategy for each player is to maximise points per turn. A player’s mean score per turn is called the ’three-dart average’, providing the most recognised performance measure in darts which is also used by television broadcasts. In contrast to other sports, it is solely attributable to a player as it is neither part of a team outcome nor can it be directly affected by the referee or other players. Thus, the response variable average enables a holistic analysis of the performance as it is based on the entire match and is not limited to certain parts of a match. As a rule of thumb, professionals routinely achieve averages of over 90, while averages over 100 are considered particularly outstanding. In our data, the tournament with the lowest average was the ‘European Darts Matchplay 2018’ (91.65), and the highest was ‘The Masters 2018’ (99.11).
To ensure reliable inference on player-specific effects, we reduced the data set to only those players who played at least ten matches pre- and post-COVID. The final data set for the analysis of the averages comprises 60 players. Table 1 displays summary statistics on the three-dart average for all matches as well as for those played pre- and post-COVID, respectively. We observe a lower mean for the three-dart average during COVID matches (93.97) than before COVID (95.25).
Summary statistics on the three-dart average and checkout percentage. For both variables, summary statistics are shown for the entire sample as well as for matches pre-COVID-19 and post-COVID-19.
| n | Mean | Std. dev. | Min | Max | |
|---|---|---|---|---|---|
| Three-dart average | |||||
| Total | 6620 | 94.85 | 6.46 | 57.72 | 121.97 |
| Regular | 4578 | 95.25 | 6.13 | 71.05 | 121.97 |
| COVID | 2042 | 93.97 | 7.05 | 57.72 | 118.96 |
| Checkout percentage | |||||
| Total | 6322 | 38.65 | 14.17 | 0.00 | 100.00 |
| Regular | 4435 | 38.81 | 13.74 | 0.00 | 100.00 |
| COVID | 1887 | 38.29 | 15.13 | 0.00 | 100.00 |
-
The number of observations for the checkout percentage data set is slightly lower than for the three-dart average data, since for the former, we excluded cases where players had less than five attempts to check out.
The second performance measure our analysis concerns is the checkout performance of each player. As introduced above, at the end of a leg, players must hit a double, a fairly small segment of the dart board. To evaluate the checkout performance, the commonly used performance indicator in darts is the so-called checkout percentage, given by the ratio of doubles hit divided by all attempts on double. However, as our data contain double attempts and the hits, we use the variable double hits to analyse the checkout performance.
For reliable inference on player-specific effects, we reduced the data set to only those players with at least five attempts at a double. Consequently, the data set for the analysis of the checkout performance comprises n = 6, 323 observations from 60 players, which is thus only slightly smaller than the data set considered for the three-dart averages. Table 1 indicates only minor differences in the checkout percentage pre- and post-COVID.
3.2 COVID-19 matches
Darts fosters a unique fan-player connection, distinct from other sports. In PDC tournaments, fans stand closely to players, shaking hands as they enter the stage and singing chants during the game. This intimate atmosphere contrasts with sports in large stadiums, like football or basketball, where athletes are more isolated from fans due to venue design. Enclosed halls hosting darts tournaments amplify the crowd noise, creating an environment characterised by partying, disguised, and singing spectators (Davis 2018, 2022b).
The COVID-19 pandemic ended such festival atmosphere in darts. Matches in late 2020 had only a few spectators, adhering to strict rules, including a ban on chants and costumes.[1] Other tournaments were held behind closed doors, resulting in a subdued atmosphere compared to pre-COVID matches with reduced noise, shouting, and chants (Davis 2022a,b). The Guardian highlighted such novel game-play circumstances and the significance of spectators in darts, emphasising their close connection to players and their impact on the sport.[2] Consequently, we anticipate a diminished social pressure on players due to the altered atmosphere.
To capture the effect of the social pressure exerted by the fans, we include the dummy variable COVID. Table 1 indicates that almost 70 % of the observations belong to matches played pre-COVID, which are thus labelled as regular, meaning that they took place under standard conditions, i.e., with packed arenas and no restrictions. Thus, about 30 % of our observations belong to matches that took place after the pandemic outbreak. To explore performance variations pre- and post-COVID among players, Figure 1 displays the performance for the 25 players with the highest number of observations in our data, revealing substantial differences. For some players, such as Michael van Gerwen and Gary Anderson, the three-dart average declines post-COVID, while it increases for other players, such as Dimitri van den Bergh and Luke Humphries. The benefitting players are relatively inexperienced in most cases. For instance, Dimitri van den Bergh and Luke Humphries have post-COVID experience levels of six and three years. In contrast, the experience levels of Michael van Gerwen and Gary Anderson are very high at 15 and 20 years, and their averages decrease. Similarly, the checkout percentages (right panel of Figure 1) show a decline in performance for some players (such as Gary Anderson and Kim Huybrechts), while others increased it during spectator deviations (such as James Wade or Chris Dobey).

Changes in performance pre- and post-COVID as indicated by the three-dart average (left panel) and checkout percentage (right panel). Shown are the 25 players with the most observations in our data set.
To assess performance differences before and during COVID-19 between experienced and inexperienced players, we classify those with three or fewer years of experience as inexperienced (corresponding to the 20 % percentile). Prior to the pandemic, inexperienced players had a lower mean three-dart average (93.7) compared to experienced players (95.7). During the COVID-19 pandemic, inexperienced players had, on average, a higher three-dart average (94.4) than experienced players (93.9), although this difference is not statistically significant. Thus, both decreasing performances of experienced players (95.7 vs. 93.9) and, albeit smaller, increasing performances of inexperienced players (93.7 vs. 94.4) could be observed during the pandemic.
3.3 Players’ experience
Drawing on social facilitation theory, findings by Beilock et al. (2002), Otten (2009) or Jetter and Walker (2015) and Figure 1, we anticipate that coping with spectator-induced social pressure improves with increased experience. Hence, we expect experienced darts players to perform better under social pressure than inexperienced players. In contrast, Beilock et al. (2002) suggest that more experienced players struggle with new situations compared to inexperienced players. Therefore, matches played behind closed doors may have adversely affected the performance of experienced darts players.
We measure a player’s experience by the number of years he is considered a professional player. To participate in PDC tournaments regularly, players need a so-called tour card, allowing them to participate in the PDC Pro Tour. Founded in 1992 as an independent darts association, the PDC has become a global hub for top darts players, hosting prestigious tournaments. The key to PDC’s success lies in its elevated professionalism compared to national associations. PDC players consistently achieve higher three-dart averages, earn substantial prize money, and, unlike players from other associations, can make a living from their sport, highlighting the significance of the tour card. We thus measure a player’s experience by the number of years since he received the tour card for the first time.
A total of 128 tour cards are available, with 64 awarded to the top 64 players on the world ranking list, known as the Order of Merit. The remaining 64 tour cards can be obtained through participation in the PDC Qualifying Schools.[3] The PDC introduced the tour card first in 2011; however, a few players in our data can also be considered professionals before 2011. To obtain an adequate experience level for these players, we surveyed the first season in their career in which they belonged to the top 64 of the Order of Merit, which would, by today’s rules, allow them to obtain a tour card.
The experience levels of the players considered in our data range from 0 to 20, with a mean of 7.72 years (cf. Table 4 in the Appendix). Our sample thus contains substantial variation in players’ experience levels, which enables us to reliably investigate the effect of experience on the ability to cope with social pressure.
3.4 Further variables
Our data further contain covariates on match characteristics that potentially affect a player’s performance, which were also considered in previous studies (e.g., Ötting et al. 2020; Teeselink et al. 2020). In later rounds of a tournament, players usually have a higher incentive to perform well, which is captured by a set of dummy variables containing the information on the tournament round (ranging from the first round or group stage to the final; 12 categories in total). To account for the heterogeneity of the two players, we include the difference in their betting odds of winning the match. The betting odds were taken from www.oddsportal.com. Two further covariates cover the score difference and the match length. If the score difference is large, the match was most likely decided early, leading to a reduced incentive for the players to perform well at the end of the match. By including the match length, we account for potential fatigue effects. In the results below, we refer to the set of variables introduced in this subsection as match controls. Table 4 in the Appendix displays descriptive statistics for these covariates.
4 Model formulations
To investigate potential changes in the performance of darts players when social pressure is reduced (i.e., after the start of the pandemic), we consider the two different response variables introduced above: the three-dart average (labelled as average in the following), and the double hits. As our data set has a longitudinal structure and as we are interested in modelling player-specific effects (cf. Figure 1), we consider multilevel models for our analysis.
4.1 Three-dart average
In our analysis, the response variable average ij denotes the three-dart average of player i (i = 1, …, 60) in match j (j = 1, …, n i ). Our first model can be considered as a simple benchmark model which includes only the COVID dummy variable:
where α is the intercept and β captures the change in performance post-COVID across all players. The second model for investigating the performance as measured by the three-dart average is given by
where the vector x ij contains further variables which are likely to affect the performance of darts players as introduced above, i.e. the length and the score of the match, a dummy variable for each tournament as well as for the round of the tournament, the difference in the betting odds, and the experience.
As Figure 1 indicates substantial heterogeneity in performance across players, the next model includes varying intercepts:
Here, player-specific deviations from the average intercept α are given by α player[i] to account for the different levels of players’ quality.
Figure 1 further suggests that the effect of an absent crowd on performance differs across players. Our next model for the average includes varying slopes to investigate such pattern:
where β denotes the average change in performance post-COVID across all players and β player[i] are the corresponding player-specific deviations from the average effect.
Finally, to investigate the potential moderating effect of players’ experience as introduced above, we consider the following model:
where β again denotes the average change in performance post-COVID across all players and f is a smooth function to account for potential nonlinear effects.
4.2 Checkout performance
The second part of our analysis focuses on modelling the checkout performance, i.e., the situation at the end of a leg where darts players have to hit a small segment to reduce their score to 0. While the checkout percentage constitutes a proportion, we do not model it directly but rather consider the number of successes (double hits), i.e., the number of darts that hit a double field, together with the total number of darts thrown at a double field. For that purpose, we use aggregated binomial regression models since it is most natural to explicitly consider the underlying sample size instead of using only the resulting proportion.
As for the analysis of the averages, we start with a simple benchmark model that includes only the COVID dummy:
where n ij and p ij denote the number of throws at a double segment of player i in match j and the corresponding probability to hit a double segment, respectively. Similar to the model for the averages (A.0) α is the intercept, and β is the average effect of the change in checkout performance post-COVID (across all players).
The second model for the checkout performance is given by
where the vector x ij contains the match control variables that are likely to affect players’ performance, as introduced above.
To account for heterogeneity in players’ performance as indicated by Figure 1, the next model for the checkout performance includes varying intercepts:
The next model is the most flexible one as it further includes varying slopes for the effect of post-COVID matches on checkout performance to fully capture any potential heterogeneity across players:
As for the three-dart average, we also investigate the potential moderating effect of players’ experience for the checkout performance, with f again denoting a smooth function:
4.3 Model fitting
To fit the multilevel models introduced above, we choose a Bayesian approach to obtain posterior distributions of the change in performance due to the absence of fans. Moreover, due to the hierarchical structure of our data, a Bayesian approach allows to obtain posterior distributions of the change in performance for each player. In addition, we provide a comprehensive analysis of player heterogeneity by evaluating the corresponding credible intervals for each player. In particular, we use the R package brms (Bürkner 2017), which provides an interface for the programming language Stan (Carpenter et al. 2017). We fitted each model using four Markov chains with 10,000 iterations and discarded the first 5000 of each chain as warm-up, thus resulting in 20,000 posterior samples.
To check for convergence of the chains, we consider the Gelman-Rubin
As we use a Bayesian approach to obtain posterior distributions of the change in performance, the use of prior distributions is not motivated to incorporate domain expertise. We thus use weakly informative prior distributions. In particular, we choose a
5 Results
5.1 Three-dart average
To get an overview of the impact of COVID restrictions on the performance of darts players, this section presents the fitted models for the average. Table 2 displays posterior summaries for models (A.0)A.4)–(A.4). Starting with model (A.0), which includes only the post-COVID dummy, we observe a negative effect, and the corresponding credible interval does not include zero. For model (A.1), which includes match control variables such as dummy variables for each tournament, the COVID effect becomes positive, and the corresponding credible interval includes zero. The main driver behind this changed effect is the PDC Home Tour: In 2020, the PDC established a new tournament format where matches were played from home. For this tournament, we observe a three-dart average of 91.84, which is lower compared to other tournaments held both before (mean: 95.25) and after COVID (mean: 95.86, calculated without Home Tour matches; see Table 5 in the Appendix). Thus, the negative effect of post-COVID matches on performance vanishes once dummy variables for the different tournaments are included in the model.
Posterior summaries for the intercept
| Equation (A.0) | Equation (A.1) | Equation (A.2) | Equation (A.3) | Equation (A.4) | |
|---|---|---|---|---|---|
| COVID
|
−1.28 | 0.28 | −0.00004 | 0.40 | 0.47 |
| CI: [−1.61; − 0.95] | CI: [−0.77; 1.35] | CI: [−1.08; 1.06] | CI: [−0.96; 1.79] | CI: [−0.61; 1.57] | |
|
n_eff: 19,013,
|
n_eff: 4,581,
|
n_eff: 3,994,
|
n_eff: 3,232,
|
n_eff: 3,355,
|
|
| Intercept
|
95.25 | 91.48 | 92.90 | 92.99 | 92.84 |
| CI: [95.06; 95.44] | CI: [87.53; 95.41] | CI: [89.13; 96.72] | CI: [89.29; 96.76] | CI: [88.97; 96.73] | |
|
n_eff: 19,232,
|
n_eff: 989,
|
n_eff: 1,081,
|
n_eff: 1,041,
|
n_eff: 982,
|
|
| Match controls | No | Yes | Yes | Yes | Yes |
| Varying intercepts | No | No | Yes | Yes | Yes |
| Varying slopes | No | No | No | Yes | No |
| WAIC | 43,427 | 41,519 | 40,983 | 40,825 | 41,779 |
For the post-COVID dummy variable, we observe a similar effect for model (A.2), which further includes varying intercepts for each player. This model is favoured over the previous model formulations by the Watanabe–Akaike information criterion (WAIC; Watanabe and Opper 2010). When considering varying slopes as in model (A.3), we observe a further drop in the WAIC, thus suggesting player-specific effects of COVID restrictions on the three-dart average. Since the direction of causality of the two match control covariates match length and legs difference could also go the other way – higher averages can also lead to shorter games – Table 6 in the Appendix shows the results when omitting these two covariates.
Figure 2 shows the posterior distributions of the player-specific post-COVID throwing performances as considered for model (A.3). While some players increased their performance during the pandemic, our results also indicate a drop in the performance of other players. The posterior mean for the player-level correlation between the varying intercepts and the slopes as included in model (A.3) is estimated as −0.31 (95 % CI: [−0.58; − 0.005]), thus indicating that players of higher quality tend to perform worse after the COVID break. High-quality players with a drop in post-COVID performances include, for example, the former world champions Gary Anderson and Michael van Gerwen. According to the social facilitation theory, players’ expertise can be considered as an individual-specific variable that can affect the response to pressure, which will be further investigated below.

5.2 Checkout performance
For the analysis of the checkout performance, Table 3 displays posterior summaries for the fitted models (C.0)–(C.3). While for the most simple model formulation (i.e., model (C.0)), the post-COVID effect is slightly negative, the effect becomes positive for the more complex models (C.1)–(C.4). However, the corresponding 95 % CIs include zero for each model. Moreover, the WAIC does not indicate any improvement in the model fit for the more complex models. In particular, when considering varying intercepts and slopes in models (C.2) and (C.3), respectively, we only observe a minor drop in the WAIC – in other words, our results do not indicate any player-specific effects in the checkout performance. As for the three dart average, Table 6 in the Appendix displays the results when omitting the two match controls match length and legs difference.
Posterior summaries for the intercept
| Equation (C.0) | Equation (C.1) | Equation (C.2) | Equation (C.3) | Equation (C.4) | |
|---|---|---|---|---|---|
| COVID
|
−0.02 | 0.04 | 0.04 | 0.03 | 0.05 |
| CI: [−0.05; 0.01] | CI: [−0.07; 0.14] | CI: [−0.06; 0.15] | CI: [−0.08; 0.14] | CI: [−0.06; 0.16] | |
|
n_eff: 13,386,
|
n_eff: 5,304,
|
n_eff: 7,231,
|
n_eff: 12,282,
|
n_eff: 11,958,
|
|
| Intercept
|
−0.54 | −0.86 | −0.87 | −0.87 | −0.86 |
| CI: [−0.56; − 0.53] | CI: [−1.39; − 0.35] | CI: [−1.38; − 0.37] | CI: [−1.38; − 0.37] | CI: [−1.37; − 0.34] | |
|
n_eff: 13,683,
|
n_eff: 532,
|
n_eff: 837,
|
n_eff: 1,338,
|
n_eff: 1,066,
|
|
| Match controls | No | Yes | Yes | Yes | Yes |
| Varying intercepts | No | No | Yes | Yes | Yes |
| Varying slopes | No | No | No | Yes | No |
| WAIC | 25,415 | 24,054 | 24,049 | 24,044 | 24,217 |
Figure 3 shows the corresponding posterior distributions for the 25 players with the most observations in our sample. It confirms that there are only minor variations in the post-COVID checkout performance across the players, thus showing a less clear picture than for the three-dart averages. This is further underlined by the correlation between the varying intercepts and slopes, for which the posterior mean is estimated as 0.33 with a 95 % CI of [−0.76; 0.97].

5.3 COVID matches and experience
Our results indicate that the effect of social pressure on the three-dart average varies across players, while we do not find any evidence for differences across players concerning the checkout performance. Moreover, for the three-dart averages, our results suggest that more experienced players are more likely to perform better when they are exposed to social pressure, which is in line with the social facilitation theory.
To further investigate the potential moderating effect of experience, Figure 4 shows the estimated effect of players’ experience under models (A.4) and (C.4). For the three-dart average, our results suggest that more experienced players are more likely to perform better under social pressure, with a peak at about ten years of experience. Although the effect turns negative for players with more than ten years of experience, the corresponding CIs include 0. For post-COVID matches, the estimated smooth functional effect indicates a positive effect for inexperienced players; however, the corresponding CIs include 0.
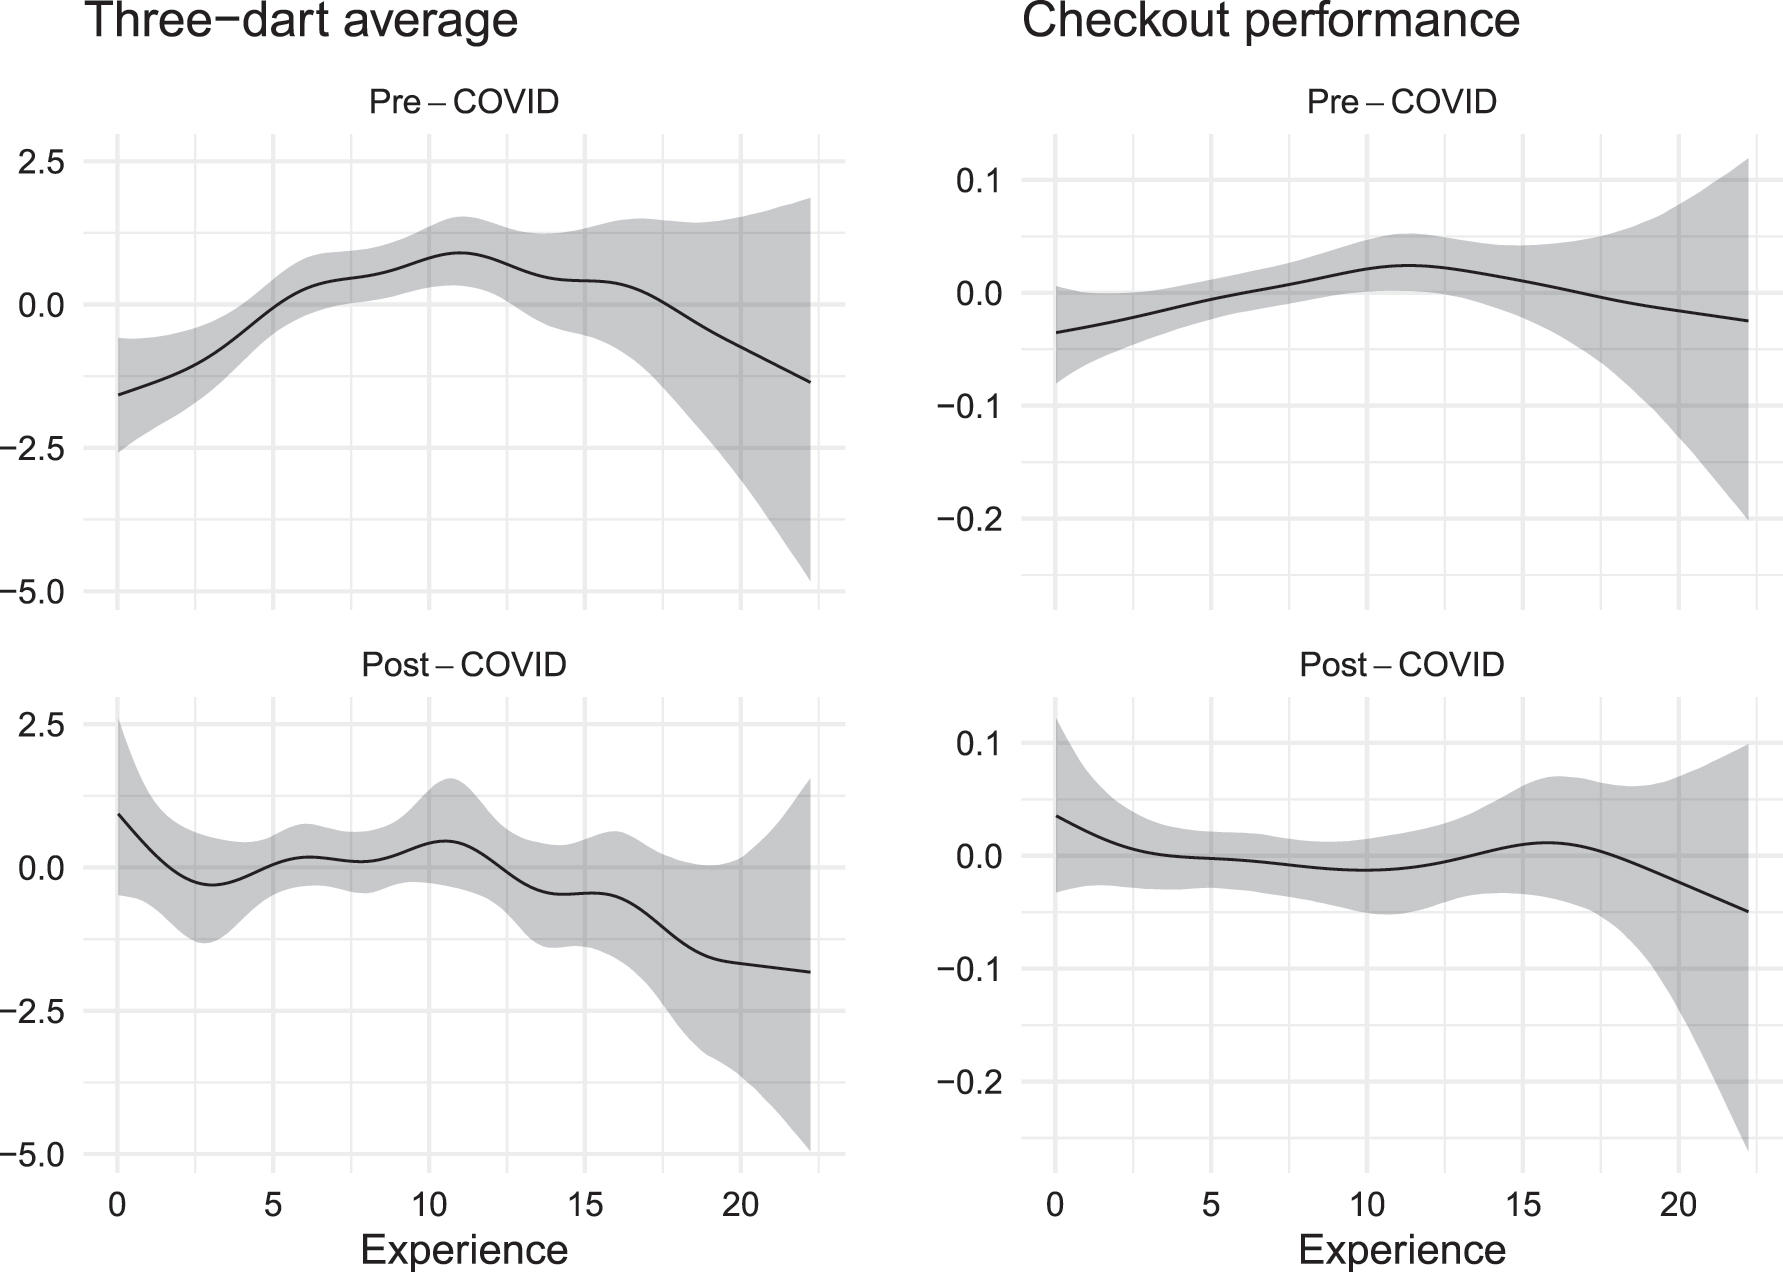
Left: Estimated smooth-functional effects of the experience on the three-dart average (model (A.4)) for periods before and during the COVID-19 pandemic. Right: Estimated smooth-functional effects of the experience on the checkout performance (model (C.4)) for periods before and during the COVID-19 pandemic.
The effect of experience on the checkout performance shows a less clear picture than the three-dart average, as the 95 % credible intervals include 0 (cf. Figure 4). However, the shape of the estimated smooth functions is similar to those obtained for the three-dart average. Hence, our results slightly indicate that also, for the checkout performance, more experienced players are more likely to perform better under social pressure, but the corresponding evidence is inconclusive. This inconclusive evidence is further underlined by the posterior summaries shown in Table 3. While the posterior means obtained from model (C.4) are similar to those of the other models, the overall model fit indicated by the WAIC values cannot be improved by adding smooth-functional effects.
6 Discussion
This contribution aimed to investigate whether a change in social pressure affects the performance of professional darts players, with a particular focus on the role of players’ experience. By analysing two performance indicators of professional darts players, our results can be summarised by two findings. First, our results suggest that no general effect of social pressure on performance exists; instead, it seems that the effect of social pressure varies across players. Our findings indicate that individuals cope differently with social pressure. These results align with the findings by, e.g., Caselli et al. (2023) and Jane (2022), and further underline the importance of investigating individual-specific effects. Second, we find a weak moderating effect of the experience on darts players’ performance, which is in line with existing studies by Beilock et al. (2002), Otten (2009), and Livingston (2012). In the period observed, the players who suffered the least in terms of their three-dart average were those with little experience in professional darts – however, this effect should be interpreted with caution since the corresponding CIs are fairly wide and often include 0. This effect may be driven by the fact that players who are new to professional darts typically have more recent experience with playing on smaller stages or in front of only a few spectators as they usually take part only in small events or qualifiers, e.g., the PDC Qualifying Schools. Beilock et al. (2002) found that inexperienced players must exert similar effort under new conditions as they require a constant high level of effort for their average performance. In contrast, experienced players may be so used to the audience that they are more affected by the changed atmosphere when playing under unfamiliar conditions. These results are thus in line with the social facilitation theory, which suggests that – assuming throwing a dart is a simple task that is identical for both players – less experienced players are more likely to suffer from social pressure.
While the results for the three-dart average show a somewhat clear pattern, our results for the checkout performance are inconclusive. In particular, we do not observe a change in the checkout performance for post-COVID matches across all players or any player-specific effects. Consistent with the social facilitation theory, this may be explained by a change in task complexity, as different types of pressure are exerted on the players. For the checkout performance, players are not only exposed to social pressure but also to match-winning pressure as single legs and sometimes entire matches are decided in such situations. While less experienced players may better cope with the reduced social pressure in tasks that are often replicated, like throwing high numbers at the beginning of a leg, more experienced players are more familiar with such match-winning pressure situations. Thus, more experienced players may compensate for the inability to cope with the reduced social pressure through their experience with match-winning pressure. In addition, reconsidering our empirical results, Figure 4 and the sample means presented in Section 3.2 indicate that the effect of experience on performance (in situations with and without social pressure) is similar for both performance measures. However, the evidence for checkout performance is inconclusive.
Our findings are a starting point for future research on the moderating effect of experience on social pressure. Future research could investigate the effect of the audience size in more detail using data on the exact number of spectators. Although such data are unavailable for darts, they can be easily collected for other sports. Another important point is that experience alone does not entirely explain the heterogeneity in the effect of reduced social pressure on performance. Further latent psychological aspects may thus affect coping with pressure, as addressed by Geukes et al. (2012). Future research could take this as a starting point to investigate further factors influencing the ability to cope with social pressure. While such analyses could be carried out for different sports, this study demonstrated that explicitly considering heterogeneity across players can provide exciting insights.
-
Research ethics: Not applicable.
-
Author contributions: The authors have accepted responsibility for the entire content of this manuscript and approved its submission.
-
Competing interests: The authors state no conflict of interest.
-
Research funding: None declared.
-
Data availability: The raw data can be obtained on request from the corresponding author.

Posterior distributions of the individual COVID effects on the three-dart average as considered for model (A.3), showing all 60 players from the sample.

Posterior distributions of the individual COVID effects on the checkout performance as considered for model (C.3), showing all 60 players from the sample.
Additional descriptive statistics.
| n | Mean | Std. dev. | Min | Max | |
|---|---|---|---|---|---|
| Overall | |||||
| Experience | 6620 | 7.72 | 4.84 | 0 | 20 |
| Legs difference | 6620 | 0.47 | 3.62 | −13 | 13 |
| Betting odds difference | 6592 | −0.65 | 2.91 | −24.99 | 24.99 |
| Match length (legs played) | 6620 | 11.04 | 5.29 | 4 | 54 |
| Pre COVID | |||||
| Experience | 4578 | 7.65 | 4.75 | 0 | 19 |
| Legs difference | 4578 | 0.50 | 3.71 | −13 | 13 |
| Betting odds difference | 4569 | −0.74 | 3.19 | −20.18 | 19.61 |
| Match length (legs played) | 4578 | 11.64 | 5.12 | 4 | 54 |
| Post COVID | |||||
| Experience | 2042 | 7.88 | 5.02 | 0 | 20 |
| Legs difference | 2042 | 0.40 | 3.39 | −9 | 9 |
| Betting odds difference | 2023 | −0.44 | 2.16 | −24.99 | 24.99 |
| Match length (legs played) | 2042 | 9.69 | 5.43 | 4 | 44 |
Three-dart averages for matches played pre-COVID for the Home Tour and for all matches played post-COVID except the Home Tour.
| Pre COVID | PDC Home Tour | Post COVID without Home Tour | |
|---|---|---|---|
| Three-dart average | 95.24 | 91.84 | 95.86 |
| n = 4, 578 | n = 963 | n = 1, 079 | |
| Checkout percentage | 38.83 | 38.35 | 39.33 |
| n = 4, 569 | n = 953 | n = 1, 077 |
Robustness checks of models (A.0)–(A.4) and (C.0)–(C4). The results displayed here exclude the match controls match length and legs difference.
| Equation (A.0) | Equation (A.1) | Equation (A.2) | Equation (A.3) | Equation (A.4) | |
|---|---|---|---|---|---|
| COVID
|
−1.28 | 0.31 | −0.03 | 0.22 | 0.47 |
| CI: [−1.61; − 0.95] | CI: [−0.82; 1.43] | CI: [−1.15; 1.09] | CI: [−1.24; 1.68] | CI: [−0.71; 1.64] | |
|
n_eff: 19,013,
|
n_eff: 4,769,
|
n_eff: 3,536,
|
n_eff: 3,088,
|
n_eff: 5,022,
|
|
| Intercept
|
95.25 | 92.77 | 94.07 | 94.21 | 94.21 |
| CI: [95.06; 95.44] | CI: [88.85; 96.76] | CI: [90.12; 98.11] | CI: [90.26; 98.31] | CI: [90.27; 98.12] | |
|
n_eff: 19,232,
|
n_eff: 1,136,
|
n_eff: 951,
|
n_eff: 866,
|
n_eff: 1,139,
|
|
| Equation (C.0) | Equation (C.1) | Equation (C.2) | Equation (C.3) | Equation (C.4) | |
| COVID
|
−0.02 | 0.04 | 0.04 | 0.02 | 0.05 |
| CI: [−0.05; 0.01] | CI: [−0.07; 0.14] | CI: [−0.07; 0.15] | CI: [−0.10; 0.13] | CI: [−0.06; 0.16] | |
|
n_eff: 13,386,
|
n_eff: 5,072,
|
n_eff: 8,753,
|
n_eff: 12,213,
|
n_eff: 10,466,
|
|
| Intercept
|
−0.54 | −0.88 | −0.87 | −0.87 | −0.85 |
| CI: [−0.56; − 0.53] | CI: [−1.40; − 0.37] | CI: [−1.38; − 0.36] | CI: [−1.40; − 0.37] | CI: [−1.37; − 0.37] | |
|
n_eff: 13,683,
|
n_eff: 664,
|
n_eff: 839,
|
n_eff: 1,202,
|
n_eff: 989,
|
|
| Match controls w/o match length and legs difference | No | Yes | Yes | Yes | Yes |
| Varying intercepts | No | No | Yes | Yes | Yes |
| Varying slopes | No | No | No | Yes | No |
References
Allport, F.H. (1924). Social psychology. Houghton Mifflin, Boston, MA.Search in Google Scholar
Baumeister, R.F. and Steinhilber, A. (1984). Paradoxical effects of supportive audiences on performance under pressure: the home field disadvantage in sports championships. J. Pers. Soc. Psychol. 47: 85–93. https://doi.org/10.1037//0022-3514.47.1.85.Search in Google Scholar
Beilock, S.L., Carr, T.H., MacMahon, C., and Starkes, J.L. (2002). When paying attention becomes counterproductive: impact of divided versus skill-focused attention on novice and experienced performance of sensorimotor skills. J. Exp. Psychol. Appl. 8: 6. https://doi.org/10.1037//1076-898x.8.1.6.Search in Google Scholar PubMed
Böheim, R., Grübl, D., and Lackner, M. (2019). Choking under pressure–evidence of the causal effect of audience size on performance. J. Econ. Behav. Organ. 168: 76–93. https://doi.org/10.1016/j.jebo.2019.10.001.Search in Google Scholar
Bond, C.F. and Titus, L.J. (1983). Social facilitation: a meta-analysis of 241 studies. Psychol. Bull. 94: 265. https://doi.org/10.1037//0033-2909.94.2.265.Search in Google Scholar
Bransen, L., Van Haaren, J., and van de Velden, M. (2019). Measuring soccer players’ contributions to chance creation by valuing their passes. J. Quant. Anal. Sports 15: 97–116. https://doi.org/10.1515/jqas-2018-0020.Search in Google Scholar
Brooks, S.P. and Gelman, A. (1998). General methods for monitoring convergence of iterative simulations. J. Comput. Graph. Stat. 7: 434–455. https://doi.org/10.1080/10618600.1998.10474787.Search in Google Scholar
Bryson, A., Dolton, P., Reade, J.J., Schreyer, D., and Singleton, C. (2021). Causal effects of an absent crowd on performances and refereeing decisions during Covid-19. Econ. Lett. 198: 109664. https://doi.org/10.1016/j.econlet.2020.109664.Search in Google Scholar
Bürkner, P.C. (2017). brms: an R package for Bayesian multilevel models using Stan. J. Stat. Software 80: 1–28. https://doi.org/10.18637/jss.v080.i01.Search in Google Scholar
Carpenter, B., Gelman, A., Hoffman, M.D., Lee, D., Goodrich, B., Betancourt, M., Brubaker, M., Guo, J., Li, P., and Riddell, A. (2017). Stan: a probabilistic programming language. J. Stat. Software 76: 1–34, https://doi.org/10.18637/jss.v076.i01.Search in Google Scholar PubMed PubMed Central
Caselli, M., Falco, P., and Mattera, G. (2023). When the stadium goes silent: how crowds affect the performance of discriminated groups. J. Labor Econ. 41: 431–451. https://doi.org/10.1086/719967.Search in Google Scholar
Correia-Oliveira, C.R. and Andrade-Souza, V.A. (2022). Home advantage in soccer after the break due to covid-19 pandemic: does crowd support matter? Int. J. Sport Exerc. Psychol. 20: 1245–1256, https://doi.org/10.1080/1612197x.2021.1934716.Search in Google Scholar
Davis, L. (2018). From a pub game to a sporting spectacle: the professionalisation of british darts, 1970–1997. Sport Hist. 38: 507–533. https://doi.org/10.1080/17460263.2018.1511462.Search in Google Scholar
Davis, L. (2022a). The adaptation of the live PDC darts event during the COVID-19 lockdown. Manag. Sport Leis. 27: 247–253. https://doi.org/10.1080/23750472.2020.1782251.Search in Google Scholar
Davis, L. (2022b) Don’t stop the party: exploring the tools used by fans to create atmospheres at live PDC darts events. In: Managing sport and leisure, pp. 1–21.10.1080/23750472.2022.2105252Search in Google Scholar
Dawson, P.M. (2012). Experience, social pressure and performance: the case of soccer officials. Appl. Econ. Lett. 19: 883–886. https://doi.org/10.1080/13504851.2011.607118.Search in Google Scholar
Dilger, A. and Vischer, L. (2020) No home bias in ghost games, Discussion paper of the institute for organisational economics 07/2020, school of business and economics, university of Münster.10.2139/ssrn.3674876Search in Google Scholar
Dohmen, T.J. (2008). Do professionals choke under pressure? J. Econ. Behav. Organ. 65: 636–653. https://doi.org/10.1016/j.jebo.2005.12.004.Search in Google Scholar
Epting, L.K., Riggs, K.N., Knowles, J.D., and Hanky, J.J. (2011). Cheers vs. jeers: effects of audience feedback on individual athletic performance. N. Am. J. Psychol. 13: 299–312.Search in Google Scholar
Fischer, K. and Haucap, J. (2021). Does crowd support drive the home advantage in professional football? evidence from German ghost games during the covid-19 pandemic. J. Sports Econ. 22: 982–1008. https://doi.org/10.1177/15270025211026552.Search in Google Scholar
Gallagher, S.K., Frisoli, K., and Luby, A. (2021). Opening up the court: analyzing player performance across tennis grand slams. J. Quant. Anal. Sports 17: 255–271. https://doi.org/10.1515/jqas-2019-0015.Search in Google Scholar
Gelman, A. and Rubin, D.B. (1992). Inference from iterative simulation using multiple sequences. Stat. Sci. 7: 457–472. https://doi.org/10.1214/ss/1177011136.Search in Google Scholar
Geukes, K., Mesagno, C., Hanrahan, S.J., and Kellmann, M. (2012). Testing an interactionist perspective on the relationship between personality traits and performance under public pressure. Psychol. Sport Exerc. 13: 243–250. https://doi.org/10.1016/j.psychsport.2011.12.004.Search in Google Scholar
Greer, D.L. (1983). Spectator booing and the home advantage: a study of social influence in the basketball arena. Soc. Psychol. Q. 46: 252–261. https://doi.org/10.2307/3033796.Search in Google Scholar
Harb-Wu, K. and Krumer, A. (2019). Choking under pressure in front of a supportive audience: evidence from professional biathlon. J. Econ. Behav. Organ. 166: 246–262. https://doi.org/10.1016/j.jebo.2019.09.001.Search in Google Scholar
Harkins, S.G. (1987). Social loafing and social facilitation. J. Exp. Soc. Psychol. 23: 1–18. https://doi.org/10.1016/0022-1031(87)90022-9.Search in Google Scholar
Heinrich, A., Müller, F., Stoll, O., and Cañal-Bruland, R. (2021). Selection bias in social facilitation theory? audience effects on elite biathletes’ performance are gender-specific. Psychol. Sport Exerc. 55: 101943. https://doi.org/10.1016/j.psychsport.2021.101943.Search in Google Scholar
Jane, W.J. (2022). Choking or excelling under pressure: evidence of the causal effect of audience size on performance. Bull. Econ. Res. 74: 329–357. https://doi.org/10.1111/boer.12307.Search in Google Scholar
Jetter, M. and Walker, J.K. (2015). Game, set, and match: do women and men perform differently in competitive situations? J. Econ. Behav. Organ. 119: 96–108. https://doi.org/10.1016/j.jebo.2015.07.017.Search in Google Scholar
Livingston, J.A. (2012). The hot hand and the cold hand in professional golf. J. Econ. Behav. Organ. 81: 172–184. https://doi.org/10.1016/j.jebo.2011.10.001.Search in Google Scholar
Moore, J.C. and Brylinsky, J.A. (1993). Spectator effect on team performance in college basketball. J. Sport Behav. 16: 77–85.Search in Google Scholar
Narayanamurthy, G. and Tortorella, G. (2021). Impact of covid-19 outbreak on employee performance–moderating role of industry 4.0 base technologies. Int. J. Prod. Econ. 234: 108075. https://doi.org/10.1016/j.ijpe.2021.108075.Search in Google Scholar PubMed PubMed Central
Nevill, A.M., Balmer, N.J., and Williams, A.M. (2002). The influence of crowd noise and experience upon refereeing decisions in football. Psychol. Sport Exerc. 3: 261–272. https://doi.org/10.1016/s1469-0292(01)00033-4.Search in Google Scholar
Otten, M. (2009). Choking vs. clutch performance: a study of sport performance under pressure. J. Sport Exerc. Psychol. 31: 583–601. https://doi.org/10.1123/jsep.31.5.583.Search in Google Scholar PubMed
Ötting, M., Deutscher, C., Schneemann, S., Langrock, R., Gehrmann, S., and Scholten, H. (2020). Performance under pressure in skill tasks: an analysis of professional darts. PLoS ONE 15: e0228870. https://doi.org/10.1371/journal.pone.0228870.Search in Google Scholar PubMed PubMed Central
Ponzo, M. and Scoppa, V. (2018). Does the home advantage depend on crowd support? Evidence from same-stadium derbies. J. Sports Econ. 19: 562–582. https://doi.org/10.1177/1527002516665794.Search in Google Scholar
Priks, M. (2013). Singin’in the rain: a study of social pressure on the soccer field, CESifo working paper 4481.10.2139/ssrn.2363847Search in Google Scholar
Reade, J.J., Schreyer, D., and Singleton, C. (2022). Eliminating supportive crowds reduces referee bias. Econ. Inq. 60: 1416–1436.10.1111/ecin.13063Search in Google Scholar
Roşca, V.I. (2020). The effect of match attendance on team performance in basketball. Rev. Manag. Comp. Int. 21: 71–84.Search in Google Scholar
Saleem, F., Malik, M.I., and Qureshi, S.S. (2021). Work stress hampering employee performance during covid-19: is safety culture needed? Front. Psychol. 12: 655839. https://doi.org/10.3389/fpsyg.2021.655839.Search in Google Scholar PubMed PubMed Central
Scoppa, V. (2021). Social pressure in the stadiums: do agents change behavior without crowd support? J. Econ. Psychol. 82: 102344. https://doi.org/10.1016/j.joep.2020.102344.Search in Google Scholar
Sembiring, M.J., Fatihudin, D., Mochklas, M., and Holisin, I. (2020). Banking employee performance during pandemic Covid-19: remuneration and motivation. J. Xi’an Univ. Archit. Technol. 12: 64–71.Search in Google Scholar
Teeselink, B.K., van Loon, R.J.P., van den Assem, M.J., and van Dolder, D. (2020). Incentives, performance and choking in darts. J. Econ. Behav. Organ. 169: 38–52. https://doi.org/10.1016/j.jebo.2019.10.026.Search in Google Scholar
Varca, P.E. (1980). An analysis of home and away game performance of male college basketball teams. J. Sport Exerc. Psychol. 2: 245–257. https://doi.org/10.1123/jsp.2.3.245.Search in Google Scholar
Watanabe, S. and Opper, M. (2010). Asymptotic equivalence of Bayes cross validation and widely applicable information criterion in singular learning theory. J. Mach. Learn. Res. 11: 3571–3594.Search in Google Scholar
Wood, S.N. (2017). Generalized additive models: an Introduction with R. Chapman and Hall/CRC, Boca Raton, FL.10.1201/9781315370279Search in Google Scholar
Wright, E.F., Jackson, W., Christie, S.D., McGuire, G.R., and Wright, R.D. (1991). The home-course disadvantage in golf championships: further evidence for the undermining effect of supportive audiences on performance under pressure. J. Sport Behav. 14: 51.Search in Google Scholar
Zajonc, R.B. (1965). Social facilitation: a solution is suggested for an old unresolved social psychological problem. Science 149: 269–274. https://doi.org/10.1126/science.149.3681.269.Search in Google Scholar PubMed
Supplementary Material
This article contains supplementary material (https://doi.org/10.1515/jqas-2022-0036).
© 2024 Walter de Gruyter GmbH, Berlin/Boston
Articles in the same Issue
- Frontmatter
- Research Articles
- Estimating positional plus-minus in the NBA
- No cheering in the background? Individual performance in professional darts during COVID-19
- Spatial roles in hockey special teams
- Career path clustering of elite soccer players among European Big-5 nations utilizing Dynamic Time Warping
- The strategic jump-the order effect on winning “The Final Three” in long jump competitions