DO seniors and IMGs have lower match probabilities than MD seniors after adjusting for specialty choice and USMLE Step 1 score
-
Dhimitri A. Nikolla
 ,
Kaitlin M. Bowers
,
Kaitlin M. Bowers

Abstract
Context
It is unknown if US residency applicants of different educational backgrounds (US allopathic [MD], Doctor of Osteopathic Medicine [DO], and international medical graduates [IMG]) but comparable academic performance have similar match success.
Objectives
Our objective was to compare match probabilities between applicant types after adjusting for specialty choice and United States Medical Licensing Examination (USMLE) Step 1 scores.
Methods
We performed a secondary analysis of published data in National Resident Matching Program (NRMP) reports from 2016, 2018, 2020, and 2022 for US MD seniors, DO seniors, and IMGs (US citizens and non-US citizens). We examined the 10 specialties with the most available spots in 2022. Average marginal effects from a multiple variable logistic regression model were utilized to estimate each non-MD senior applicant type’s probability of matching into their preferred specialty compared to MD seniors adjusting for specialty choice, Step 1 score, and match year.
Results
Each non-MD applicant type had a lower adjusted percent difference in matching to their preferred specialty than MD seniors, −7.1 % (95 % confidence interval [CI], −11.3 to −2.9) for DO seniors, −45.6 % (−50.6 to −40.5) for US IMGs, and −56.6 % (−61.5 to −51.6) for non-US IMGs. Similarly, each non-MD applicant type had a lower adjusted percent difference in matching than MD seniors across almost all Step 1 score ranges, except for DO seniors with Step 1 scores <200 (−2.0 % [−9.5 to 5.5]).
Conclusions
After adjusting for specialty choice, Step 1 score, and match year, non-US MD applicants had lower probabilities of matching into their preferred specialties than their US MD colleagues.
Resident physicians in US postgraduate training programs obtain their undergraduate medical education through various degree pathways. The most common undergraduate degree pathways include US allopathic (MD) medical schools, US osteopathic (DO) medical schools, and international medical schools outside the United States or Canada [1]. Despite having different training pathways [2, 3], most candidates applying to US postgraduate training programs complete the same sequence of licensing examinations, the United States Medical Licensing Examination (USMLE) [4], [5], [6]. Although the USMLE Step 1 has recently transitioned to pass/fail grading [7], Step 1 scores have provided program directors with numerical values by which to compare applicants and inform decisions to interview and rank [8]. Ultimately, most postgraduate training programs and applicants will enter the National Resident Matching Program (NRMP), where they rank each other, and applicants are matched to each program’s available training spots [1].
Historically, non-MD seniors have had lower match proportions than their MD senior colleagues [1]. However, MD seniors may be more academically competitive. For example, MD seniors typically score higher on the USMLE examinations, such as Step 1, than DO seniors and international medical graduates (IMGs) [4], [5], [6, 9], [10], [11], [12], [13], [14], [15], [16], [17]. Furthermore, many factors determine a successful match, including letters of recommendation, interpersonal skills, commitment to the specialty, and performance on clinical rotations [18], and MD seniors may be or may be perceived as more competitive regarding these less objective factors [19]. However, many programs also do not consider non-MD seniors and filter out their applications [8, 20]. Therefore, differences in match success between MD seniors and non-MD seniors with similar specialty choice and USMLE scores may be due in part by qualifications other than USMLE scores or filtering of applicant types without consideration of academic performance [8, 18]. A better understanding of how undergraduate medical education pathways may impact match success provides premedical and medical students with better guidance making training and match-related decisions.
Therefore, our objective was to compare match probabilities to the applicant’s preferred specialty by applicant type (MD seniors, DO seniors, US citizen IMGs [US IMG], non-US citizen IMGs [non-US IMG]), adjusting for specialty choice and USMLE Step 1 score. Because all applicant types are eligible for US postgraduate medical education training [1], most applicants complete the Step 1 examination [4], [5], [6, 9], [10], [11], [12], [13], [14], [15], [16], [17], and because Step 1 score has been a primary determinant of applicant selection by programs [8, 18], we hypothesized that match probabilities for the applicant’s preferred specialty would be similar between different applicant types with the same specialty choice and comparable Step 1 scores.
Methods
Study design and population
We performed a retrospective, secondary analysis of published data reported in the NRMP charting outcomes reports for MD seniors, DO seniors, US IMGs, and non-US IMGs from 2016, 2018, 2020, and 2022 [4], [5], [6, 9], [10], [11], [12], [13], [14], [15], [16], [17]. These were the most recent charting outcomes reports available for each applicant type [21]. We abstracted the number of applicants matching and not matching to their preferred specialty by applicant type, specialty choice, Step 1 score range, and match year. Matching to their preferred specialty was defined by the NRMP as the specialty of the applicant’s first rank. We limited data collection to the 10 specialties with the most available spots in 2022 to limit any bias from specialties that have fewer non-MD applicants [1]. We included internal medicine, family medicine, pediatrics, emergency medicine, psychiatry, surgery, anesthesiology, obstetrics-gynecology, orthopedic surgery, and neurology [1]. Only DO seniors who reported Step 1 scores were included in the analyses allowing for direct comparisons between applicant types. Similarly, we did not collect match data on DO seniors in the 2016 match year because Step 1 scores were not reported in the charting outcomes report [9]. We present additional methods pertaining to the data collection and dataset creation processes in the Supplementary Data.
Intervention and outcome measures
The study’s independent variable was the applicant type (MD seniors, DO seniors, US IMGs, and non-US IMGs). Match year (2016, 2018, 2020, and 2022) and Step 1 score range (≤180, 181–190, 191–200, 201–210, 211–220, 221–230, 231–240, 241–250, 251–260, and >260) were also collected. The primary outcome was matched to the preferred specialty.
Analysis of outcomes
We reported descriptive statistics utilizing counts with percentages. All variables were analyzed as factors because this was the format in which they were abstracted. Unadjusted differences in match proportions were reported with 95 % confidence intervals (CI) utilizing the 2-sample test for equality of proportions with continuity correction. For the main analysis, a multiple variable logistic regression model was performed examining the association between applicant type (independent variable) and matching to the applicant’s preferred specialty (dependent variable), adjusting for specialty choice, Step 1 score range, and match year. Average marginal effects were calculated to determine the effects on the probability of matching and were multiplied by 100 to be reported as adjusted percent differences. Cluster robust standard errors were utilized to calculate 95 % CIs to account for clustering by specialty. We checked for multicollinearity with generalized variance-inflation factors and model fit with the Akaike information criterion (AIC) and the Bayesian information criterion (BIC).
We performed sensitivity analyses repeating the primary adjusted analysis with Step 1 score as continuous and discrete 10-point increments and after random forest multiple imputation of missing Step 1 scores from non-DO seniors. We did not impute missing Step 1 scores for DO seniors because Step 1 is not required for DO students to obtain medical licensure or enter a postgraduate training program [22, 23]. However, DO seniors who complete Step 1 may have greater odds of matching [24]; therefore, they are likely to take the examination based on their predicted performance [24, 25]. With the available data, this missingness in Step 1 score for DO applicants is likely missing not at random and would be inappropriate for imputation.
Secondary analyses were performed exploring the interactions of applicant type by specialty, Step 1 score range, and match year. For the analysis by specialty, multiple variable logistic regression models were performed by specialty, examining the association between applicant type (independent variable) and matching to the applicant’s preferred specialty (dependent variable), adjusting for Step 1 score range and match year. For the analysis by Step 1 score, the model adjusted for match year and specialty. Also, for the analysis by match year, the model adjusted for Step 1 score range and specialty. Robust standard errors were utilized for the analysis by specialty, while cluster robust standard errors at the specialty level were utilized for the match year and Step 1 score secondary analyses. Although we performed several different analyses with different subgroups, we only examined a single outcome and this study was not intended to be confirmatory; therefore, we did not adjust for multiplicity [26].
Analyses were performed with R (Version 4.2.1 2022-06-23, R Foundation for Statistical Computing, Vienna, Austria); packages and package versions are listed in the supplement (Supplemental Figure 1). Differences in the probability of matching were considered statistically significant if their 95 % CIs did not cross zero.
Sample size calculation
Across the study population, the rate of matching to the applicant’s preferred specialty is correlated with specialty and Step 1 score [4], [5], [6]. This heterogeneity makes sample size calculation challenging. Powering the study for the main analysis would leave subgroups underpowered. Although the main analysis may be of more interest to premedical students choosing an undergraduate medical education pathway, the subgroup analyses by specialty and Step 1 score would be of more interest to medical students choosing a specialty knowing their Step 1 score. For example, the overall match rate between MD and DO seniors in 2022 was 92.9 vs. 91.3 %, respectively [1]. For this difference, we would need 1,026 observations per group to achieve 90 % power at a significance level of 95 %. However, random or stratified random sampling of the data down to this sample size would leave the specialty and Step 1 score range subgroup analyses extremely underpowered. Therefore, given how important these subgroup analyses likely would be to medical students, we chose to include all of the most recent data from the published charting outcomes reports since 2016 [4], [5], [6, 9], [10], [11], [12], [13], [14], [15], [16], [17], acknowledging that this would make the main analysis overpowered. Nevertheless, some subgroup comparisons would still be underpowered with respect to this sample size calculation.
IRB statement
The study protocol was reviewed by the Allegheny Health Network Institutional Review Board (IRB) staff and considered not to be human subjects research.
Results
Applicant characteristics
In 2016, 2018, 2020, and 2022, 52,902 US MD seniors, 13,846 DO seniors, 15,400 US IMGs, and 22,241 non-US IMGs met our inclusion criteria. The counts from each applicant group matching to their preferred specialty were 49,174 (93.0 %) for MD seniors, 12,075 (87.2 %) for DO seniors, 8,350 (54.2 %) for US IMGs, and 11,874 (53.4 %) for non-US IMGs (Table 1).
Unadjusted differences between applicant types.
| US MD | DOa | US IMG | Non-US IMG | |
|---|---|---|---|---|
| n | 52,902 | 13,846 | 15,400 | 22,241 |
| Year, n (%) | ||||
| 2016 | 12,642 (23.9) | 0 (0.0)c | 4,004 (26.0) | 5,744 (25.8) |
| 2018 | 13,512 (25.5) | 3,324 (24.0) | 3,931 (25.5) | 5,582 (25.1) |
| 2020 | 13,955 (26.4) | 5,359 (38.7) | 4,046 (26.3) | 5,407 (24.3) |
| 2022 | 12,793 (24.2) | 5,163 (37.3) | 3,419 (22.2) | 5,508 (24.8) |
| Specialty, n (%) | ||||
| Anesthesiology | 4,435 (8.4) | 1,028 (7.4) | 624 (4.1) | 664 (3.0) |
| Emergency | 6,239 (11.8) | 1927 (13.9) | 723 (4.7) | 242 (1.1) |
| Family | 5,283 (10.0) | 2,961 (21.4) | 3,737 (24.3) | 2,421 (10.9) |
| Internal | 12,712 (24.0) | 3,419 (24.7) | 6,198 (40.2) | 13,330 (59.9) |
| Neurology | 1760 (3.3) | 339 (2.4) | 397 (2.6) | 1,188 (5.3) |
| OB/GYN | 4,474 (8.5) | 835 (6.0) | 468 (3.0) | 439 (2.0) |
| Orthopedic | 3,295 (6.2) | 342 (2.5) | 96 (0.6) | 79 (0.4) |
| Pediatric | 6,482 (12.3) | 1,362 (9.8) | 1,068 (6.9) | 1807 (8.1) |
| Psychiatry | 4,069 (7.7) | 992 (7.2) | 1,319 (8.6) | 1,167 (5.2) |
| Surgery | 4,153 (7.9) | 641 (4.6) | 770 (5.0) | 904 (4.1) |
| USMLE Step 1 score, n (%) | ||||
| 180 or less | 6 (<0.1) | 22 (0.2) | 14 (0.1) | 10 (<0.1) |
| 181–190 | 57 (0.1) | 59 (0.4) | 333 (2.2) | 153 (0.7) |
| 191–200 | 2042 (3.9) | 361 (2.6) | 2027 (13.2) | 1,325 (6.0) |
| 201–210 | 4,772 (9.0) | 972 (7.0) | 2,878 (18.7) | 2,235 (10.0) |
| 211–220 | 7,336 (13.9) | 1738 (12.6) | 2,980 (19.4) | 3,125 (14.1) |
| 221–230 | 9,912 (18.7) | 2,125 (15.3) | 2,502 (16.2) | 4,120 (18.5) |
| 231–240 | 10,946 (20.7) | 1809 (13.1) | 1810 (11.8) | 4,236 (19.0) |
| 241–250 | 9,486 (17.9) | 1,023 (7.4) | 1,015 (6.6) | 3,463 (15.6) |
| 251–260 | 6,078 (11.5) | 385 (2.8) | 403 (2.6) | 1830 (8.2) |
| 260 or greater | 1,634 (3.1) | 52 (0.4) | 55 (0.4) | 563 (2.5) |
| Missingd | 633 (1.2) | 5,300 (38.3) | 1,383 (9.0) | 1,181 (5.3) |
| Matched, n (%)b | 49,174 (93.0) | 12,075 (87.2) | 8,350 (54.2) | 11,874 (53.4) |
-
DO, Doctor of Osteopathic Medicine; IMG, international medical graduate; OB/GYN, Obstetrics and Gynecology; US, United States; USMLE, United States Medical Licensing Examination. aExcludes DO senior applicants who did not take the USMLE. bThe outcome of matching to the applicant’s preferred specialty was defined as matching to the specialty of the first program in the applicant’s rank list. cUSMLE Step 1 data were not reported for DO seniors in 2016; therefore, these DO seniors were excluded from the study dataset. dA USMLE Step 1 score was not reported in the charting outcomes reports for these applicants.
Main and sensitivity analyses
After adjusting for specialty choice, Step 1 score, and match year, all non-US MD applicant types had an overall lower percent difference in matching to their preferred specialty than MD seniors, −7.1 % (95 % CI, −11.3 to −2.9) for DO seniors, −45.6 % (−50.6 to −40.5) for US IMGs, and −56.6 % (−61.5 to −51.6) for non-US IMGs (Table 2). These estimates were similar in sensitivity analyses with Step 1 scores modeled as continuous 10-point increments and after multiple imputation of missing Step 1 scores (Supplemental Table 1).
Unadjusted match proportions and adjusted match probabilities between applicant types.
| Degree type | Unadjusted difference in % matched (95 % CI) | Adjusted difference in match probability as % (95 % CI)a | n |
|---|---|---|---|
| US MD | Reference | Reference | 95,892 |
| DO | −5.7 (−6.4, −5.1) | −7.1 (−11.3, −2.9) | |
| US IMG | −38.7 (−39.6, −37.9) | −45.6 (−50.6, −40.5) | |
| Non-US IMG | −39.6 (−40.3, −38.9) | −56.6 (−61.5, −51.6) |
-
CI, confidence interval; DO, Doctor of Osteopathic Medicine; IMG, international medical graduate; OB/GYN, Obstetrics and Gynecology; US, United States; USMLE, United States Medical Licensing Examination. aEstimates were adjusted for specialty choice, USMLE Step 1 score range, and match year.
Secondary analyses
The adjusted percent differences in matching between applicant types varied by specialty. For example, there was no significant difference between MD and DO seniors in the adjusted percent difference in matching into Internal Medicine (−1.4 % [95 % CI, −4.3 to 1.4]), Family Medicine (−3.0 % [−7.4 to 1.5]), and Pediatrics (−1.4 % [−3.4 to 0.6]) (Table 3 and Figure 1). The adjusted percent differences for US and non-US IMGs were all much lower than US MD seniors across all included specialties (Table 3 and Figure 1).
Unadjusted match proportions and adjusted match probabilities between applicant types by specialty.
| Specialty | Degree type | Unadjusted difference in % matched (95 % CI) | Adjusted difference in match probability as % (95 % CI)a | n |
|---|---|---|---|---|
| Internal | US MD | Reference | Reference | 33,246 |
| DO | −4.1 (−5.0, −3.3) | −1.4 (−4.3, 1.4) | ||
| US IMG | −40.9 (−42.1, −39.6) | −54.0 (−56.2, −51.7) | ||
| Non-US IMG | −40.0 (−40.9, −39.2) | −52.8 (−54.3, −51.3) | ||
| Family | US MD | Reference | Reference | 11,804 |
| DO | −2.3 (−3.3, −1.3) | −3.0 (−7.4, 1.5) | ||
| US IMG | −42.0 (−43.7, −40.3) | −45.9 (−48.6, −43.2) | ||
| Non-US IMG | −51.7 (−53.7, −49.6) | −63.7 (−66.3, −61.1) | ||
| Pediatric | US MD | Reference | Reference | 9,810 |
| DO | −4.0 (−5.3, −2.6) | −1.4 (−3.4, 0.6) | ||
| US IMG | −29.4 (−32.3, −26.6) | −26.5 (−30.2, −22.9) | ||
| Non-US IMG | −37.8 (−40.1, −35.5) | −39.1 (−42.3, −36.0) | ||
| Emergency | US MD | Reference | Reference | 8,489 |
| DO | −5.3 (−6.9, −3.7) | −2.5 (−4.3, −0.8) | ||
| US IMG | −33.8 (−37.5, −30.1) | −29.9 (−34, −25.7) | ||
| Non-US IMG | −48.5 (−55.0, −42.0) | −48.7 (−56.7, −40.7) | ||
| Psychiatry | US MD | Reference | Reference | 6,696 |
| DO | −8.3 (−10.9, −5.6) | −8.9 (−14.2, −3.6) | ||
| US IMG | −51.4 (−54.2, −48.6) | −47.4 (−50.9, −43.9) | ||
| Non-US IMG | −52.7 (−55.7, −49.8) | −55.5 (−58.7, −52.3) | ||
| Surgery | US MD | Reference | Reference | 6,195 |
| DO | −21.2 (−25.2, −17.3) | −18.9 (−24.3, −13.5) | ||
| US IMG | −48.3 (−52.0, −44.7) | −54.8 (−58.5, −51.2) | ||
| Non-US IMG | −57.5 (−60.7, −54.4) | −66.6 (−69.5, −63.7) | ||
| Anesthesiology | US MD | Reference | Reference | 6,529 |
| DO | −15.8 (−18.5, −13.1) | −12.2 (−15.1, −9.3) | ||
| US IMG | −31.1 (−35.1, −27.2) | −37.4 (−42.7, −32.1) | ||
| Non-US IMG | −40.6 (−44.6, −36.7) | −49.4 (−54.4, −44.4) | ||
| OB/GYN | US MD | Reference | Reference | 5,899 |
| DO | −20.0 (−23.4, −16.6) | −12.6 (−16.7, −8.5) | ||
| US IMG | −44.8 (−49.5, −40.1) | −45.1 (−50.1, −40.1) | ||
| Non-US IMG | −55.2 (−59.8, −50.6) | −60.5 (−65.0, −56.0) | ||
| Orthopedic | US MD | Reference | Reference | 3,747 |
| DO | −15.3 (−20.9, −9.8) | −5.8 (−11.6, −0.1) | ||
| US IMG | −49.4 (−58.9, −39.8) | −45.8 (−56.4, −35.1) | ||
| Non-US IMG | −46.1 (−57.0, −35.2) | −43.9 (−56.7, −31.1) | ||
| Neurology | US MD | Reference | Reference | 3,477 |
| DO | −3.9 (−6.8, −1.0) | −8.9 (−17.2, −0.6) | ||
| US IMG | −44.2 (−49.4, −39.1) | −58.2 (−64.6, −51.9) | ||
| Non-US IMG | −40.3 (−43.3, −37.3) | −48.7 (−52.7, −44.7) |
-
CI, confidence interval; DO, Doctor of Osteopathic Medicine; IMG, international medical graduate; OB/GYN, Obstetrics and Gynecology; US, United States; USMLE, United States Medical Licensing Examination. aEstimates were adjusted for USMLE Step 1 score range and match year.
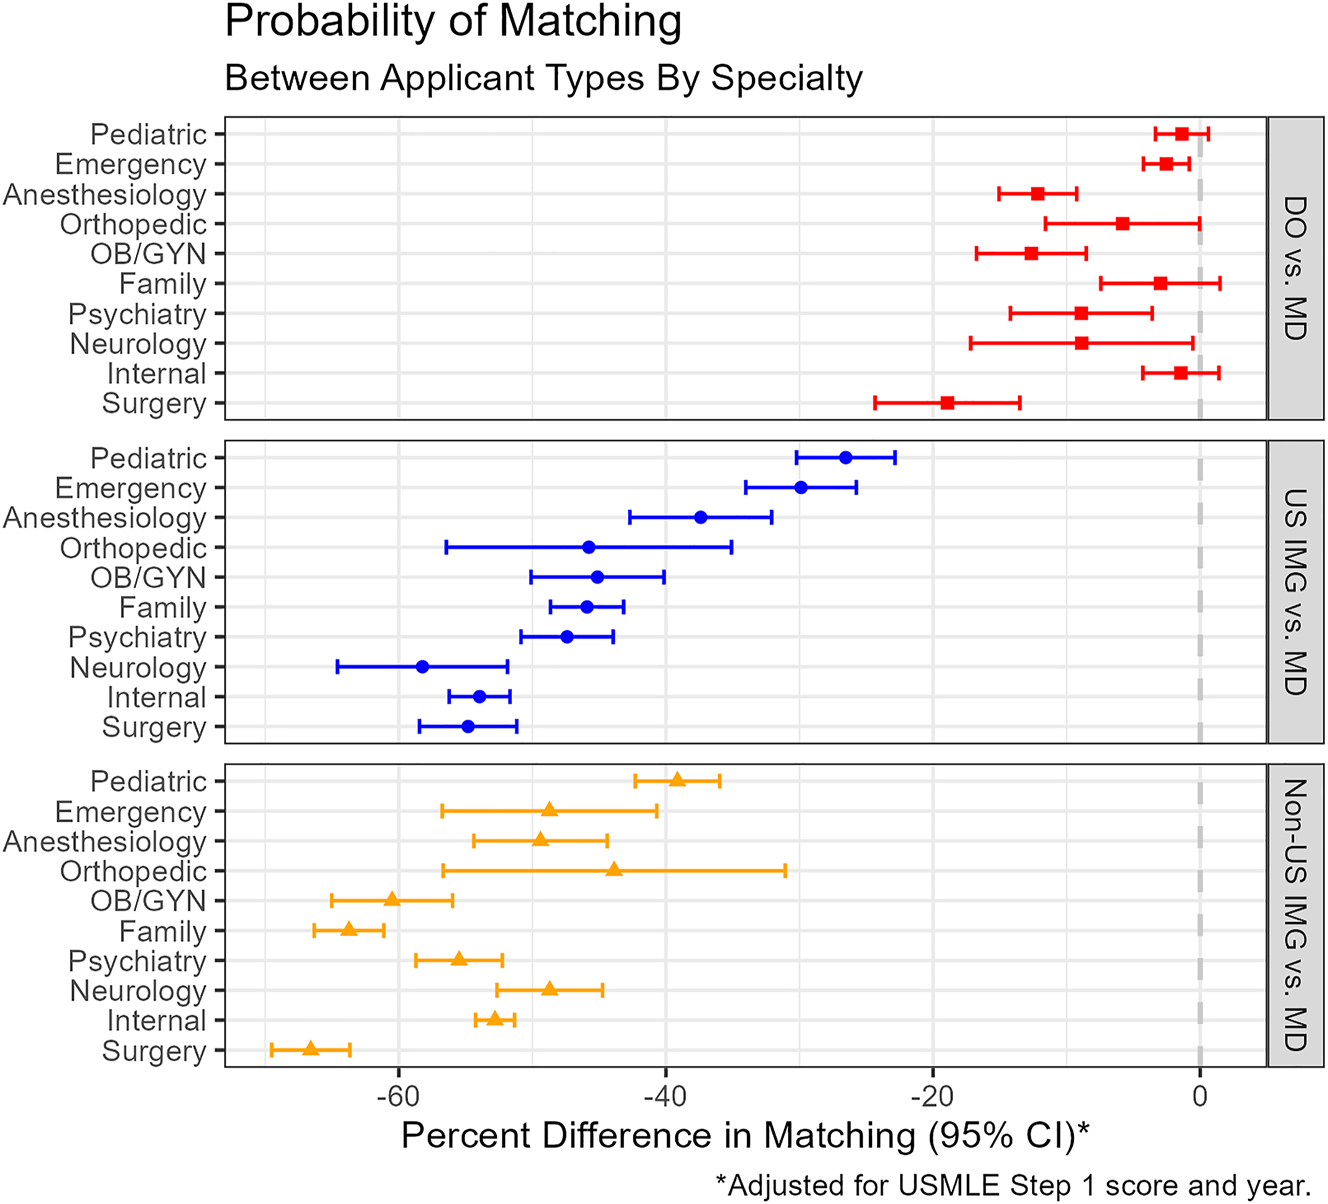
The figure displays the probability of matching into applicants’ preferred specialties between US MD and non-US MD applicants stratified by specialty.
Similarly, DO seniors, US IMGs, and non-US IMGs had lower adjusted percent differences in matching than MD seniors across almost all Step 1 score ranges. The exception was DO seniors with Step 1 scores <200 whose adjusted percent difference compared to MD seniors was −2.0 % (−9.5 to 5.5) (Figure 2 and Supplemental Table 2). Nevertheless, all non-US MD applicant types followed a similar pattern with smaller differences compared to MD seniors with increasing Step 1 scores (Figure 2). Lastly, adjusted percent differences in matching maintained a similar order to the main analysis between DO seniors, US IMGs, and non-US IMGs compared to MD seniors by match year (Supplemental Figure 2 and Supplemental Table 3).

The figure displays the probability of matching into applicants’ preferred specialties between US MD and non-US MD applicants stratified by USMLE Step 1 score range. Very low and very high score ranges were merged (≤200 and >250) due to few applicants in those categories.
Discussion
Despite adjusting for specialty choice, Step 1 score, and match year, the adjusted percent differences in matching to the applicant’s preferred specialty for DO seniors, US IMGs, and non-US IMGs relative to MD seniors followed a similar pattern as the unadjusted differences (Table 2). This pattern was largely consistent throughout subgroups. For example, all non-US MD applicants had a significantly lower adjusted probability of matching than MDs in all Step 1 score ranges, except for DO seniors with a score of <200 (Figure 2 and Supplemental Table 2).
These results suggest that the association between match success and applicant type may be affected by unmeasured confounders. One explanation is that MD seniors may be more competitive beyond Step 1 score. For example, MD seniors had a higher mean number of research experiences than non-MD senior applicants across all match years studied [4], [5], [6, 9], [10], [11], [12], [13], [14], [15], [16], [17]. However, processes such as filtering that preclude consideration of non-MD senior applications may also explain this effect. For example, in 2022, the percentage of programs that never interview DO seniors, US IMGs, and non-US IMGs were 7 , 20, and 34 %, which follows a similar pattern to our overall adjusted match probabilities (Table 2) [8]. Furthermore, in 2022, program directors reported that slightly more than 40 % of applications on average were rejected based on standardized screening not receiving holistic review [8]. Filtering of DO seniors may be related to perceptions that DO students are less competitive than MD students [19]. In contrast, filtering of IMGs may be related to more practical and nonacademic reasons, such as US visa requirements, learning US culture, understanding the US healthcare system, communication skills, and racial/ethnic bias [2].
However, the percent differences between applicants varied by specialty (Figure 1 and Table 3). For example, there was no statistical difference for DO seniors compared to MD seniors in the adjusted probability of matching into internal medicine, family medicine, and pediatric (Figure 1 and Table 3). Because these are primary care related fields, the greater focus on primary care medicine within osteopathic medical schools compared to allopathic medical schools may provide some benefits in match success to DO applicants [27].
Nevertheless, these results may inform and guide both premedical and medical students through their pursuit of medical school and postgraduate medical training. For example, if a premedical student has an option between medical training pathways, these results may help inform that decision, because their opportunity for match success may be impacted by the pathway they choose. Additionally, match probabilities differ regardless of Step 1 score (Supplemental Table 2 and Figure 2). Therefore, all medical students should strive to be competitive beyond licensing examination performance (i.e., good letters of recommendation and performance on rotations) [18].
Finally, although this analysis adjusted for the Step 1 score and Step 1 has become pass/fail [7], these results likely maintain validity. Despite the Step 1 score being a major determinant of interview invitations over the studied years [8, 28], [29], [30], differences in match probabilities persisted in our study after adjustment for and stratification by Step 1 score (Table 2, Supplemental Table 2, and Figure 2). Therefore, in the future, non-Step 1 factors that influence applicant competitiveness (e.g., letters of recommendations) will likely be just as or more influential to match success, regardless of whether programs replace Step 1 score in their applicant selection process with another quantitative test score (e.g., USMLE Step 2). However, future research should investigate reasons for differences in match success between applicants with similar academic performance.
Limitations
Our study was a retrospective, secondary analysis of NRMP surveys, which potentially exposes the results to self-report bias. Nevertheless, most Step 1 scores were verified by the NRMP with the US allopathic and osteopathic medical schools for MD and DO seniors [4, 6, 11, 12, 14, 15, 17]. Furthermore, the results are observational and statistical adjustments were limited to a few variables (specialty choice, Step 1 score, and match year); therefore, unmeasured confounders, such as letters of recommendations as well as program familiarity with non-MD senior applicants, may have impacted the results. Additionally, the proportion of DO programs directors by specialty has been associated with DO applicant match success [31]. Therefore, although we adjusted for specialty choice, the training credentials of program directors among each applicant’s list of programs they applied to may have confounded the results. Also, applicants are likely to apply to medical school and residency programs based on their self-perceived competitiveness, which might bias our observational data. Similarly, our adjusted match probabilities for DO seniors may be greater than observed, because we excluded DO seniors who did not report taking Step 1. In addition, this subgroup may have worse match success than DO seniors who report taking Step 1 [24]. Also, our analysis was limited to the 10 specialties in 2022 with the most spots to limit bias from specialties with fewer non-MD senior applicants. However, this exclusion also limits the generalizability of our results to other specialties. Our results are also not generalizable to applicants who apply to residency outside the US or NRMP match (e.g., military match, San Francisco match, and Urology Residency Matching Program). Finally, our main analysis was overpowered, so there was possibly an elevated risk of type 1 error. In contrast, some subgroups were underpowered, which may have elevated the risk of type 2 error. Nevertheless, our results were largely consistent across the main, sensitivity, and secondary analyses.
Conclusions
After adjusting for specialty choice, Step 1 score, and match year, non-MD seniors had lower probabilities of matching into their preferred specialties than their MD senior colleagues. In addition, all non-MD seniors had a significantly lower adjusted probability of matching than MD seniors across Step 1 score ranges, except for DO seniors with a score of <200. These results do not explain the discrepancy in residency match proportions between the studied applicant types.
-
Research ethics: The study protocol was reviewed by the Allegheny Health Network Institutional Review Board staff and considered not to be human subject research.
-
Informed consent: Not applicable.
-
Author contributions: All authors provided substantial contributions to the conception and design, acquisition of data, or analysis and interpretation of data; all authors drafted the article or revised it critically for important intellectual content; all authors gave final approval of the version of the article to be published; and all authors have accepted responsibility for the entire content of this manuscript.
-
Competing interests: None declared.
-
Research funding: None declared.
-
Data availability: The National Resident Matching Program published the data, which is freely available online.
References
1. National Resident Matching Program. Results and data 2022 main residency match. National Resident Matching Program; 2022.Suche in Google Scholar
2. Murillo, ZC, Alcalá Aguirre, FO, Luna Landa, EM, Reyes Güereque, EN, Rodríguez García, GP, Diaz Montoya, LS. Challenges for international medical graduates in the US graduate medical education and health care system environment: a narrative review. Cureus 2022;14:e27351. https://doi.org/10.7759/cureus.27351.Suche in Google Scholar PubMed PubMed Central
3. Ahmed, H, Kortz, M, Carmody, JB. An update on medical school accreditation in the United States: implications for the single graduate medical education (GME) era. Cureus 2023;15:e34884. https://doi.org/10.7759/cureus.34884.Suche in Google Scholar PubMed PubMed Central
4. National Resident Matching Program. Charting outcomes in the match: senior students of U.S. DO medical schools. National Resident Matching Program; 2022.Suche in Google Scholar
5. National Resident Matching Program. Charting outcomes in the match: international medical graduates. National Resident Matching Program; 2022.Suche in Google Scholar
6. National Resident Matching Program. Charting outcomes in the match: senior students of U.S. MD medical schools. National Resident Matching Program; 2022.Suche in Google Scholar
7. Hedgepeth, D, Wlasowicz, S, Lott, R, Smith, T. The early impact of deciding to take the United States medical licensing examination Step 1 for osteopathic medical students in the pass/fail era. Cureus 2023;15:e36154. https://doi.org/10.7759/cureus.36154.Suche in Google Scholar PubMed PubMed Central
8. National Resident Matching Program. Data release and research committee: results of the 2022 NRMP program director survey. National Resident Matching Program; 2022.Suche in Google Scholar
9. National Resident Matching Program. Charting outcomes in the match for U.S. Osteopathic medical students and graduates. National Resident Matching Program; 2016.Suche in Google Scholar
10. National Resident Matching Program. Charting outcomes in the match for international medical graduates. National Resident Matching Program; 2016.Suche in Google Scholar
11. National Resident Matching Program. Charting outcomes in the match for U.S. Allopathic seniors. National Resident Matching Program; 2016.Suche in Google Scholar
12. National Resident Matching Program. Charting outcomes in the match: senior students of U.S. Osteopathic medical schools. National Resident Matching Program; 2018.Suche in Google Scholar
13. National Resident Matching Program. Charting outcomes in the match: international medical graduates. National Resident Matching Program; 2018.Suche in Google Scholar
14. National Resident Matching Program. Charting outcomes in the match: U.S. Allopathic seniors. National Resident Matching Program; 2018.Suche in Google Scholar
15. National Resident Matching Program. Charting outcomes in the match: senior students of U.S. DO medical schools. National Resident Matching Program; 2020.Suche in Google Scholar
16. National Resident Matching Program. Charting outcomes in the match: international medical graduates. National Resident Matching Program; 2020.Suche in Google Scholar
17. National Resident Matching Program. Charting outcomes in the match: senior students of U.S. MD medical schools. National Resident Matching Program; 2020.Suche in Google Scholar
18. Results from the 2020 NRMP program director survey. National Resident Matching Program; 2020. https://public.tableau.com/app/profile/national.resident.matching.program/viz/PDSurvey2020-Final/Desktoptablet [Accessed 20 Apr 2023].Suche in Google Scholar
19. Heard, MA, Buckley, SE, Burns, B, Conrad-Schnetz, K. Identifying attitudes toward and acceptance of osteopathic graduates in surgical residency programs in the era of single accreditation: results of the American college of osteopathic surgeons medical student section questionnaire of program directors. Cureus 2022;14:e22870. https://doi.org/10.7759/cureus.22870.Suche in Google Scholar PubMed PubMed Central
20. Electronic Residency Application Service. 2023 ERAS program director’s workstation (PDWS) user guide. Association of American Medical Colleges; 2023. https://www.aamc.org/media/55096/download?attachment [Accessed 20 Apr 2023].Suche in Google Scholar
21. National Resident Matching Program. Match data & report archives. National Resident Matching Program; 2023. https://www.nrmp.org/match-data-analytics/archives/ [Accessed 27 May 2023].Suche in Google Scholar
22. Ahmed, H, Carmody, JB. Double jeopardy: the USMLE for osteopathic medical students. Acad Med 2020;95:666. https://doi.org/10.1097/ACM.0000000000003180.Suche in Google Scholar PubMed
23. Ahmed, H, Carmody, JB. COMLEX-USA and USMLE for osteopathic medical students: should we duplicate, divide, or unify? J Grad Med Educ 2022;14:60–3. https://doi.org/10.4300/JGME-D-21-01196.1.Suche in Google Scholar PubMed PubMed Central
24. Nikolla, DA, Stratford, CV, Bowers, KM. Reported completion of the USMLE Step 1 and match outcomes among senior osteopathic students in 2020. J Osteopath Med 2022;122:347–51. https://doi.org/10.1515/jom-2021-0262.Suche in Google Scholar PubMed
25. Smith, T, Kauffman, M, Carmody, JB, Gnarra, J. Predicting osteopathic medical students’ performance on the United States medical licensing examination from results of the comprehensive osteopathic medical licensing examination. Cureus 2021;13:e14288. https://doi.org/10.7759/cureus.14288.Suche in Google Scholar PubMed PubMed Central
26. Bender, R, Lange, S. Adjusting for multiple testing-when and how? J Clin Epidemiol 2001;54:343–9. https://doi.org/10.1016/s0895-4356(00)00314-0.Suche in Google Scholar PubMed
27. Peters, AS, Clark-Chiarelli, N, Block, SD. Comparison of osteopathic and allopathic medical schools’ support for primary care. J Gen Intern Med 1999;14:730–9. https://doi.org/10.1046/j.1525-1497.1999.03179.x.Suche in Google Scholar PubMed PubMed Central
28. National Resident Matching Program. Data release and research committee: results of the 2020 NRMP program director survey. National Resident Matching Program; 2020.Suche in Google Scholar
29. National Resident Matching Program. Data release and research committee: results of the 2018 NRMP program director survey. National Resident Matching Program; 2018.Suche in Google Scholar
30. National Resident Matching Program. Data release and research committee: results of the 2016 NRMP program director survey. National Resident Matching Program; 2016.Suche in Google Scholar
31. Brazdzionis, J, Savla, P, Oppenheim, R, Kim, GJ, Conrad-Schnetz, K, Burns, B, et al.. Comparison of osteopathic (DO) and allopathic (MD) candidates matching into selected surgical subspecialties. Cureus 2023;15:e40566. https://doi.org/10.7759/cureus.40566.Suche in Google Scholar PubMed PubMed Central
Supplementary Material
This article contains supplementary material (https://doi.org/10.1515/jom-2023-0143).
© 2024 the author(s), published by De Gruyter, Berlin/Boston
This work is licensed under the Creative Commons Attribution 4.0 International License.
Artikel in diesem Heft
- Frontmatter
- Innovations
- Commentary
- Medical malpractice liability in large language model artificial intelligence: legal review and policy recommendations
- Medical Education
- Original Articles
- Examining differences in trends in the orthopedic surgery match for osteopathic and allopathic medical graduates after the transition to single accreditation
- DO seniors and IMGs have lower match probabilities than MD seniors after adjusting for specialty choice and USMLE Step 1 score
- Musculoskeletal Medicine and Pain
- Review Article
- Use of person-centered language in obesity-related publications across sports medicine journals: a systematic review of adherence to person-centered language guidelines in sports medicine
- Neuromusculoskeletal Medicine (OMT)
- Original Articles
- The short- and long-term effect of osteopathic manipulative treatment on pain, and psychosocial factors in adults with chronic low back pain
- Interoceptive bodily awareness in patients seeking pain relief with osteopathic manipulative treatment: an observational cohort pilot study
- Clinical Image
- A masquerading presentation of dermatofibrosarcoma protuberans