Evaluating disease outbreaks with syndromic surveillance using medical student clinical rotation patient encounter logs
-
Gabrielle Bruzda

Abstract
Context
While the data generated by medical students at schools that require electronic patient encounter logs is primarily used to monitor their training progress, it can also be a great source of public health data. Specifically, it can be used for syndromic surveillance, a method used to analyze instantaneous health data for early detection of disease outbreaks.
Objective
To analyze how the International Classification of Diseases, 10th Revision (ICD-10) codes input by medical students at the Edward Via College of Osteopathic Medicine into the Clinical Rotation Evaluation and Documentation Organizer (CREDO) patient encounter logging system could act as a new syndromic surveillance tool.
Methods
A CREDO database query was conducted for ICD-10 codes entered between November 1, 2019 and March 13, 2020 using the World Health Organization’s 2011 revised case definitions for Influenza Like Illness (ILI). During that period, medical students had an approximated mean of 3,000 patient encounters per day from over 1,500 clinical sites. A cumulative sum technique was applied to the data to generate alert thresholds. Breast cancer, a disease with a stable incidence during the specified timeframe, was used as a control.
Results
Total ILI daily ICD-10 counts that exceeded alert thresholds represented unusual levels of disease occurred 11 times from November 20, 2020 through February 28, 2020. This analysis is consistent with the COVID-19 pandemic timeline. The first statistically significant ILI increase occurred nine days prior to the first laboratory confirmed case in the country.
Conclusion
Syndromic surveillance can be timelier than traditional surveillance methods, which require laboratory testing to confirm disease. As a result of this study, we are installing a real-time alert for ILI into CREDO, so rates can be monitored continuously as an indicator of possible future new infectious disease outbreaks.
Syndromic surveillance is a method used to analyze instantaneous health data for early detection of disease outbreaks.1 Using real-time analysis, illness clusters can be identified before confirmed diagnoses, and epidemiologists can be alerted to potential outbreaks.2,3 Syndromic surveillance provides the most accurate assessment when data is tracked continuously in a setting with universal access.4,5 This approach places emergency medicine at the frontline of an emerging disease, and the data (i.e., diagnostic codes) retrieved from emergency visit records are an invaluable source for surveillance.5 Therefore, those charged with investigating outbreaks classically rely on electronic health records obtained from emergency department visits.
Syndromic surveillance does not replace traditional surveillance methods, which require laboratory testing to confirm disease and physician reporting of the disease activity.2 Syndromic surveillance was developed in response to the bioterrorism-related cases of anthrax in 2001,6 which motivated the United States to pass the Public Health Security and Bioterrorism Preparedness and Response Act (2002 Bioterrorism Act).3 The objective of the 2002 Bioterrorism Act was early and rapid response to the intentional release of biologic agents.7 To fulfill this objective, government, academic, and private sectors formed a partnership titled The National Syndromic Surveillance Program.3 This collaboration between the Center for Disease Control (CDC), state and local health departments, and private facilities established a system whereby electronic health data could be collected, shared, and analyzed rapidly to respond to public health concerns.3 In 2003, the CDC launched a program to integrate electronic health data from participating health facilities called BioSense, a shared platform program with tools to analyze health data received within 24 h.3,7
The goals of syndromic surveillance extend beyond bioterrorism and include early warning systems for seasonal flu or influenza-like illnesses (ILI) such as severe acute respiratory syndrome (SARS), Middle East respiratory syndrome (MERS), severe acute respiratory syndrome-coronavirus 2 (SARS-CoV2), notable outbreaks like the Ebola and Zika viruses, and food-borne illnesses such as Escherichia coli (E. coli).8 Additionally, noninfectious public health concerns like heart disease and opioid overdoses can be monitored,7 though syndromic surveillance is most useful for conditions that spread throughout the population, like acute respiratory illnesses.9
As an example of syndromic surveillance utility, 403,000 Milwaukee-area residents became infected in 1993 by cryptosporidium after a water treatment plant was contaminated.10 After the outbreak, the Milwaukee Health Department created SurvNet, a communicable disease reporting system. This public health surveillance tool helped identify an outbreak of E. coli, alerted public health officials to a heatwave (a warning they used to take measures that reduced the overall mortality by 50%), and diagnosed the first outbreak of monkeypox in the Western hemisphere.10,11,12
Syndromic surveillance is also a useful tool during public health events of international concern. For example, in March 2003, the SARS Surveillance Project demonstrated the ability to rapidly establish multiregional syndromic surveillance during a global epidemic.13,14,15 Similarly, by tracking discharge diagnoses during the 2009 flu pandemic (hemagglutinin 1 neuroaminidases 1 [H1N1]), an alert was triggered five days before the CDC press release and 18 days before the first laboratory confirmed H1N1 case in the country.1,16
In December 2019, a cluster of mysterious pneumonia cases manifested in Wuhan, China. These cases were caused by novel coronavirus disease 2019 (COVID-19), an infectious disease caused by SARS-CoV-2.17 Rapid transmission and high mortality rates quickly made this a public health emergency of international concern, and the World Health Organization (WHO) declared COVID-19 a pandemic on March 11, 2020.18 The COVID-19 symptom complex continues to evolve, and current indications of possible infection include elevated temperature, fatigue, headache, cough, loss of taste or smell, muscle aches, nausea, sore throat or vomiting.19
The 2003 SARS outbreak, which resulted in approximately 8,000 cases and 800 deaths worldwide, was eradicated by interrupting all human-to-human transmission. This eradication was accomplished by means of syndromic surveillance with aggressive measures including prompt isolation, strict quarantine procedures, and law enforcement lockdown of communities most affected by the virus.20 Whole genome analysis conducted in January 2020 demonstrated an 86% similarity between SARS-CoV and SARS-CoV-2. Both have similar incubation periods, pattern of progression to severe disease, and basic reproduction numbers.20 The trajectory of the COVID-19 epidemic, however, is much different. On December 14, 2020, 12 months after the “beginning” of the COVID-19 pandemic, WHO reported 70,835,171 confirmed cases with 1,605,243 deaths across 220 countries, territories, or areas.21 With such widespread disease, the worldwide pandemic is past the point of containment and the focus has shifted to broad mitigation strategies through social distancing and other hygienic techniques.20
We hypothesized that in the setting of community spread of COVID-19, syndromic surveillance data could have been analyzed to detect and alert public health professionals of early transmission because there would have been an increase in the number of ILI codes entered in electronic tracking systems. As a demonstration of this potential, we retrospectively analyzed diagnostic data collected from medical student patient encounters completed during core clinical and international rotations at Edward Via College of Osteopathic Medicine (VCOM)-affiliated hospitals and clinics during the pandemic period.
Methods
This study was reviewed and was approved by the VCOM institutional review board (#1172780, effective until 1/15/2021). We retrospectively analyzed International Classification of Diseases, 10th Revision (ICD-10) codes logged by medical students completing core clinical (US-based) and international rotations at VCOM-affiliated hospitals and clinics during the COVID-19 pandemic period. Data was accumulated throughout the Appalachian and Delta regions of the US and in developing communities across Central America; it had been entered into the CREDO system, in which ICD-10 codes were recorded in real-time for each patient encounter.22 The CREDO logging system collects only basic patient demographics (e.g., age range, sex); unique identifiers that conflict with the Health Insurance Portability and Accountability Act regulations are not captured by the system.
Data from November 1, 2019, through March 13, 2020 was gathered; on March 13, 2020, VCOM was closed because of the COVID-19 pandemic and students were no longer able to participate in clinical rotations. During the study period, approximately 900 third- and fourth-year medical students from VCOM on clinical rotations logged approximately 3,000 patient encounters per day from over 1,500 clinical sites. A CREDO database query was conducted for ICD-10 codes using WHO’s 2011 revised case definitions for ILI and severe acute respiratory infections (SARI); these codes are presented in Table 1 and included J00, J01, J06, J09, J10, J11, J12, J18, J20, J22, J40, R05.23,24 Each patient interaction (encounter) can generate multiple ICD-10 codes; each diagnostic, procedure, and drug entry are independently tracked and counted.
International Classification of Diseases, 10th Revision (ICD-10) codes for influenza-like illnesses (ILI) and severe acute respiratory infections (SARI).
| J00 | Acute nasopharyngitis [common cold] |
| J01 | Acute sinusitis |
| J06 | Acute upper respiratory infections of multiple and unspecified site |
| J09 | Influenza due to certain identified influenza viruses |
| J10 | Influenza due to other identified influenza viruses |
| J11 | Influenza due to unidentified influenza virus |
| J12 | Viral pneumonia, not elsewhere classified 646 entries |
| J18 | Pneumonia, unspecified organism |
| J20 | Acute bronchitis |
| J22 | Unspecified acute lower respiratory infection |
| J40 | Bronchitis, not specified as acute or chronic |
| R05 | Cough |
We calculated the sum for each ICD-10 code reported each day, then entered the data into a Microsoft Excel spreadsheet (Appendix). The total daily syndrome count (the sum of all reported instances of all relevant ICD-10 codes per day) was also recorded (Table 2). A modified cumulative sum (CUSUM) algorithm was applied to the syndromic data to detect temporal aberrant events (Figure 1). The CUSUM algorithm is used in statistical quality control to monitor variance over time. The algorithm uses sequential analysis to display the cumulative sums of deviation from a target value. The CUSUM control chart provides an objective measure to monitor changes in disease activity and has been proven useful in monitoring respiratory syndromic data.1,25,26
Sample calculation for total syndrome count on January 31.
| Date | ICD-10 diagnosis code | Total counts | ||||||||||||
|---|---|---|---|---|---|---|---|---|---|---|---|---|---|---|
| J00 | J01 | J06 | J09 | J10 | J11 | J12 | J18 | J20 | J22 | J40 | R05 | |||
| Day 102 (N102) | 1/31/2020 | 15 | 75 | 74 | 166 | 2 | 10 | 0 | 70 | 34 | 6 | 0 | 49 | 501 |
| Total syndrome count = J00 + J01 + J06 + J09 + J10 + J11 + J12 + J18 + J20 + J22 + J40 + R05 | ||||||||||||||
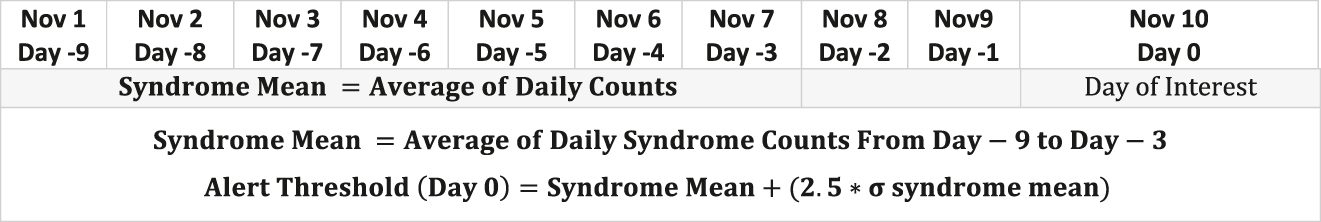
Equation for syndrome mean and alert threshold using a modified cumulative sum technique.
The mean of daily syndrome counts from days three through nine before the day of interest (“moving mean”) was calculated. The alert threshold, or the upper limit, was calculated as the moving mean plus 2.5× the standard deviation during the same time period:
Total daily counts that exceeded this threshold represented unusual levels of disease and indicated a potential outbreak. A sample calculation for the alert threshold on interest day January 31, 2020 is shown in Table 3. In this example, the total daily count (501) exceeded the alert threshold (32.6951), indicating a notable change in disease activity. Total syndrome counts were also obtained for the 2018–2019 flu season using the same case definitions. Lastly, total daily counts for breast malignancy—a disease with a stable incidence during the specified time frame—were used as a control.
Sample calculation for alert threshold on interest day January 31.
| Date | ICD-10 diagnosis code | Total counts | Alert threshold | ||||||||||||
|---|---|---|---|---|---|---|---|---|---|---|---|---|---|---|---|
| J00 | J01 | J06 | J09 | J10 | J11 | J12 | J18 | J20 | J22 | J40 | R05 | ||||
| N93 | 1/22/2020 | 7 | 21 | 42 | 32 | 1 | 10 | 1 | 40 | 15 | 0 | 0 | 33 | 202 | 239.9814 |
| N94 | 1/23/2020 | 11 | 15 | 27 | 33 | 2 | 2 | 0 | 35 | 7 | 0 | 0 | 21 | 153 | 248.3825 |
| N95 | 1/24/2020 | 4 | 27 | 13 | 42 | 1 | 2 | 0 | 11 | 5 | 0 | 0 | 18 | 123 | 267.2127 |
| N96 | 1/25/2020 | 6 | 5 | 5 | 7 | 0 | 0 | 0 | 7 | 3 | 0 | 0 | 2 | 35 | 287.1224 |
| N97 | 1/26/2020 | 14 | 4 | 10 | 25 | 3 | 5 | 0 | 29 | 4 | 0 | 0 | 6 | 100 | 288.0848 |
| N98 | 1/27/2020 | 13 | 23 | 32 | 47 | 2 | 10 | 1 | 16 | 10 | 0 | 0 | 15 | 169 | 284.6464 |
| N99 | 1/28/2020 | 7 | 39 | 53 | 70 | 4 | 6 | 0 | 33 | 21 | 0 | 0 | 30 | 263 | 308.0681 |
| N100 | 1/29/2020 | 18 | 47 | 52 | 73 | 3 | 10 | 0 | 27 | 17 | 0 | 0 | 26 | 273 | 300.8173 |
| N101 | 1/30/2020 | 11 | 56 | 39 | 78 | 2 | 12 | 0 | 44 | 7 | 1 | 0 | 18 | 268 | 293.5103 |
| N102 | 1/31/2020 | 15 | 75 | 74 | 166 | 2 | 10 | 0 | 70 | 34 | 6 | 0 | 49 | 501 | 332.6951 |
| Alert threshold = (MEAN(N93:N99) + (2.5 × (STDEVA(N93:N99)))) | |||||||||||||||
Results
Daily total counts that exceeded alert thresholds for ILI/SARI are depicted in red in Figure 2. The first significant alert would have occurred on January 6 (daily count 120/alert threshold 53), which was three days before the Chinese Center for Disease Control and Prevention linked the mysterious cluster of pneumonia cases to COVID-19,27 nine days before the first confirmed case in the United States, and 24 days before WHO declared the novel virus a Public Health Emergency of International Concern (PHEIC).28 These alerts were tracked along a timeline of critical moments in the COVID-19 pandemic (Figure 3).
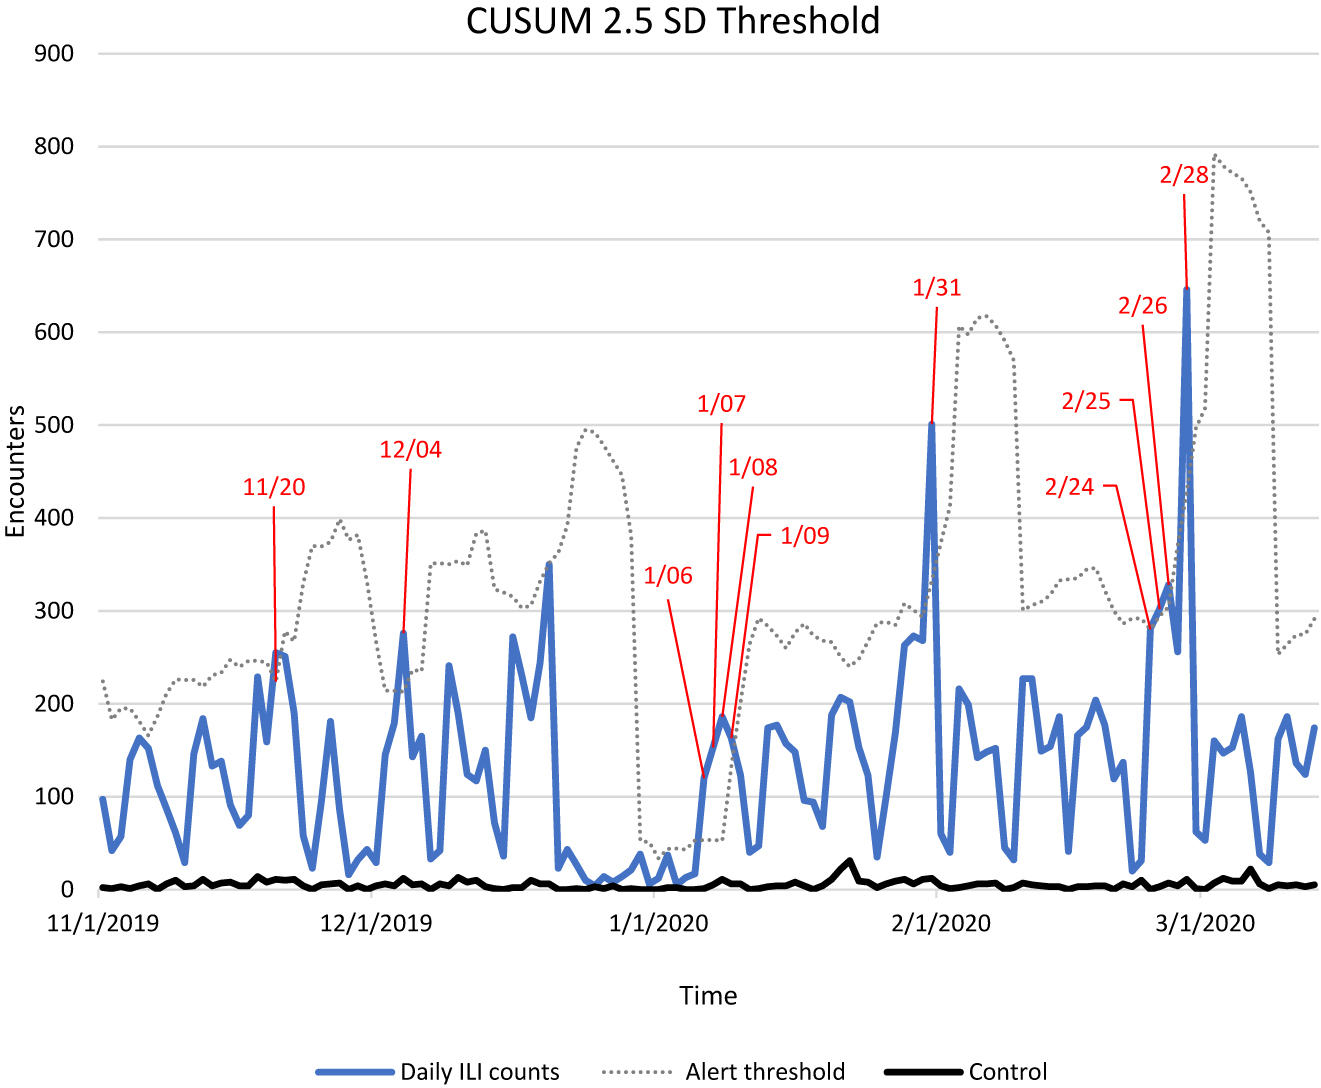
This figure shows total daily influenza-like illness (ILI) and severe acute respiratory infections (SARI) counts from November 1, 2019 through March 13, 2020 (blue), the cumulative sum (CUSUM) + 2.5 standard deviation (SD) alert threshold (broken line). Exceeded alert threshold dates are depicted in red. Breast malignancy acted as a control and is shown in black.
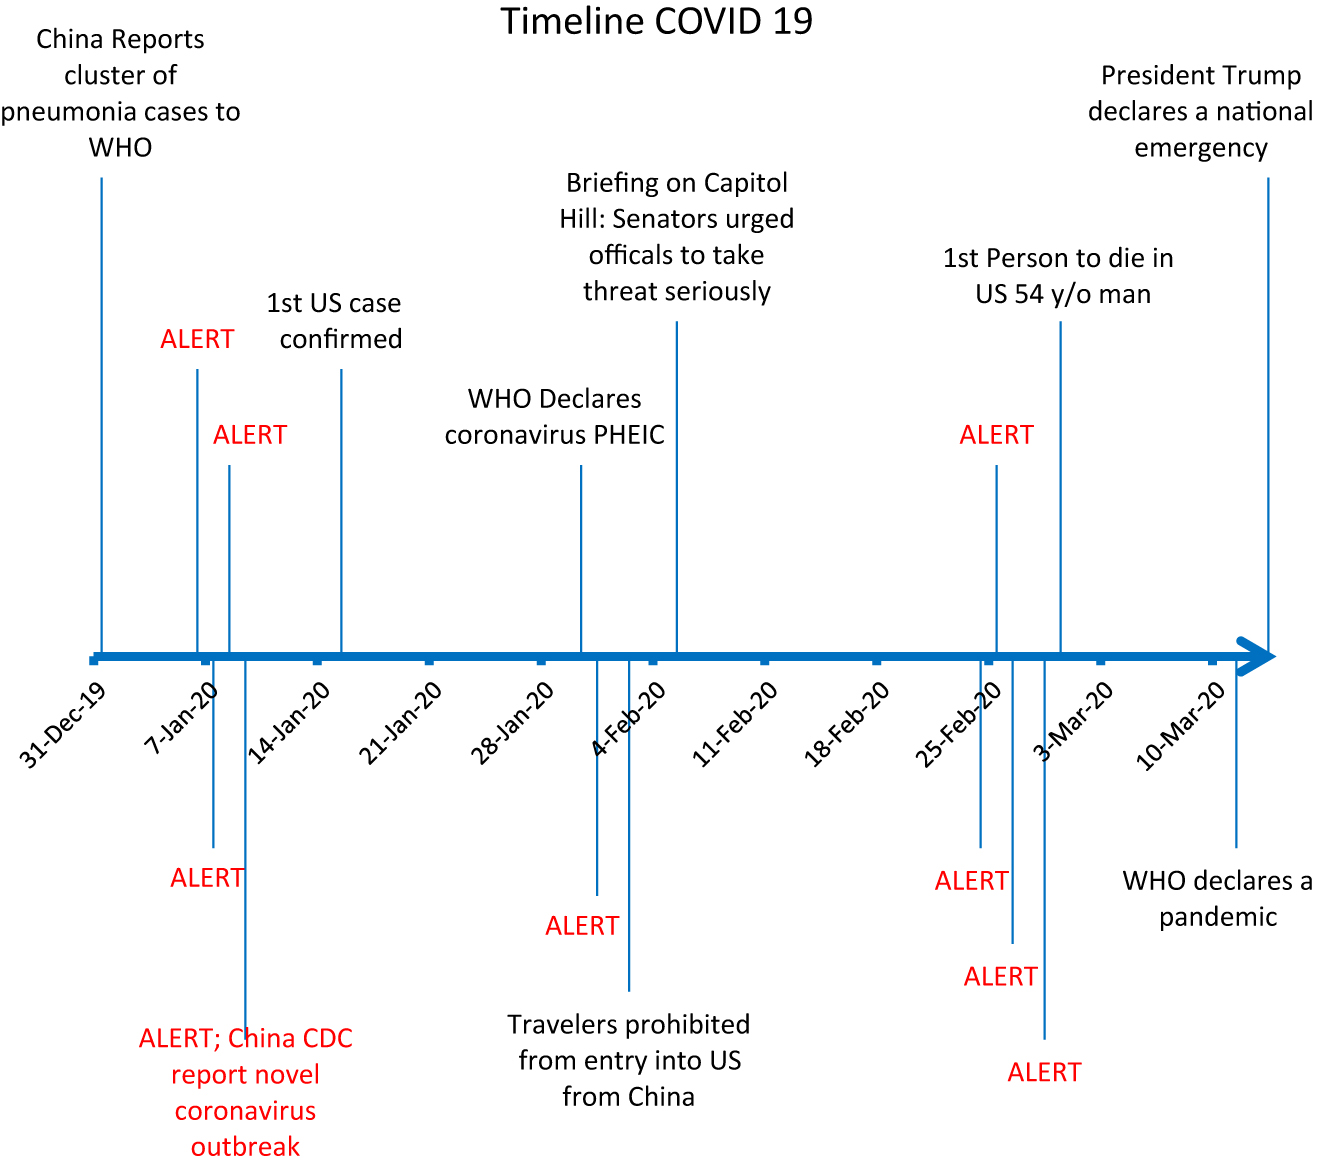
A timeline of the coronavirus outbreak may be explained by the statistically significant increases in influenza-like illnessactivity, shown here as an exceeded alert threshold.
The second alert would have been triggered on January 31 (daily count 501/alert threshold 333), two days before the US suspended entry for people who had traveled to China29 in the prior 14 and five days before a briefing on Capitol Hill where Senators urged administration officials to take the threat more seriously.30 The third important alert would have been triggered for February 24 (daily count 281/alert threshold 280), five days prior to the first confirmed COVID related death in the United States,31 16 days before WHO declared a pandemic,32 and 18 days before the US declared a national emergency.33
Additional data from the 2018–2019 flu season was included for comparison, with an adjusted timeframe to overlay ILI/SARI activity for both seasons (Figure 4). The total monthly counts of the designated ICD-10 codes were higher in 2019–2020 compared with 2018–19 (17,738 vs. 6,598)
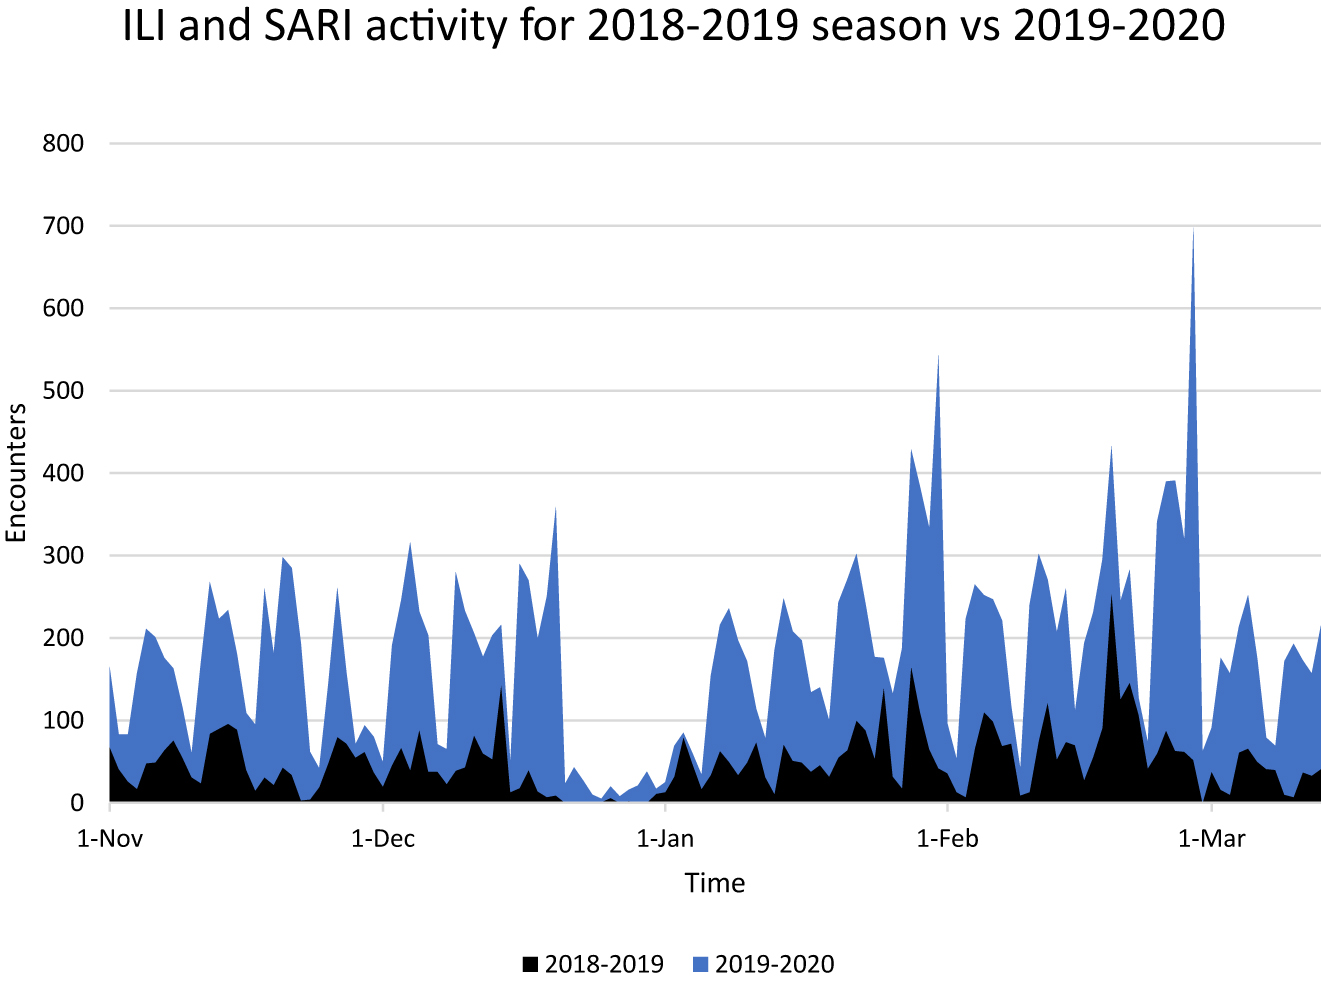
Influenza-like illness (ILI) and severe acute respiratory infections (SARI) total daily counts comparing 2018–2019 flu season (black) to 2019–2020 season (blue). Data was accumulated from November 1 through March 13 for both seasons. Note, the diminished data from approximately December 20 to January 1 in each year is a consequence of students on holiday and thus not reporting patient encounters.
The CUSUM control chart provides an objective measure to monitor changes in disease activity and has been proven useful in monitoring respiratory syndromic data.34 This method was effective in identifying statistically significant spikes in ILI activity. These alerts were overlaid along the pandemic timeline in Figure 3 as an indicator of the potential clinical significance and likelihood of a true outbreak. Further, the overall ILI activity level as illustrated in Figure 4 was significantly larger than the previous year (17,738 vs. 6,598).
Discussion
Diagnostic codes entered by medical students to document each patient encounter across all rotations as a standard component of their clinical training were used for surveillance in this study. For respiratory syndromes, prior studies have shown the superiority of diagnosis codes over chief complaint alone for surveillance.5,35,36 A study5 by George Washington University compared surveillance between complaint and diagnostic codes and found despite a potential delay in detection using diagnostic codes, the additional information obtained is more reliable and beneficial than surveillance using chief complaint. Children’s Hospital of Boston also demonstrated that diagnosis was superior to chief complaint for respiratory illness in the pediatric population.35 The use of diagnosis codes also demonstrates good sensitivity and specificity. A study by the University of Pittsburgh Center for Biomedical Informatics showed the sensitivity of detection of acute respiratory illness using ICD-9 coded diagnoses was 44% with a 97% specificity.36
The results of our syndromic surveillance COVID-19 validation demonstration are consistent with recent reported studies.37,38 In one study,37 a group at University of California-Los Angeles Health System performed a retrospective observational EMR inpatient and outpatient chart review across three hospitals for patients who presented with a “cough” and for patients hospitalized with acute respiratory failure. The researchers found a statistically-significant excess in symptoms as early as December 22, 2019, and concluded these were most likely early COVID-19 infections. In another recent study, a group from the CDC and the American Red Cross, among others, tested blood bank samples for COVID-19 reactive antibodies.38 They found samples with reactive antibodies from California, Oregon, and Washington as early as December 13–16, 2019.
Traditional surveillance methods rely on confirmed laboratory testing and physician reporting. This has important health implications, as traditional surveillance may delay the time to response in an evolving outbreak; for example, our results indicated a lag of nine days. Today, approximately 70% of emergency departments and 4,000 health care facilities across the nation transmit electronic health data to the CDC’s BioSense Platform daily. Therefore, this method can be used to monitor infectious disease activity across much larger populations enhancing detection of evolving disease outbreaks. Our results have potential instructional value for medical students, as they illustrate a unique approach that utilizes student generated data for entirely new purposes, as well as a relevant statistical approach for time-dependent surveillance data analysis. Given the annual influenza season and the potential for new and emerging infectious diseases to surface from anywhere on the planet and affect health in America, it is important for future clinicians to be familiar with approaches like the one illustrated here, because it is likely to be valuable for future epidemics and pandemics.
A limitation of this study is that the increase in ILI/SARI activity could have resulted from any number of possible infectious diseases, limiting our ability to conclude causation; however, it is consistent with the timeline of the COVID-19 pandemic and other similar reports.37,38 Additionally, surveillance data is subject to confounding factors. Another limitation is the data is representative of the VCOM associated hospitals and clinics throughout Appalachia and Central America (Dominican Republic, Honduras, and El Salvador) and does not represent the entire US population. A strength of the study was that data was accumulated from thousands of patients at many hospitals/clinics. Another advantage was the accuracy of discharge diagnosis codes as compared with chief complaints as this eliminates variability and results in higher outbreak detection sensitivity. Finally, the study was quick and easy to conduct with few resources and can easily be reproduced and enhance collaboration among public health, academic investigators, and industry.
As a result of this study, we are installing a real-time alert for ILI into CREDO, so it can be added to those diseases that are currently monitored by VCOM faculty. This significant, high quality data is amenable to automated computational analysis for generating automated alerts for identifying and tracking the progress of future pandemics. There are a number of advantages to using CREDO data. First, it is real-time, as medical students are continuously logging their clinical training patient encounters. Second, data are collected over a very large number of distributed rural and urban sites, from large, urban metropolitan hospitals to small clinics and individual practices in socioeconomically disadvantaged areas, and thus provides a method for surveilling a large region of the US and the Caribbean area without the need to extract and merge data from a variety of EMR systems. Third, the data is uniformly collected by clinically trained professionals simultaneously across a plurality of indications, thus providing well matched controls. Last, the CREDO system is extensible and if used by most or all health care trainees (medical, physician assistants, nursing, pharmacy students), could ensure coverage across the entire US at even higher data rates, thus improving surveillance performance.
Conclusion
One of the tenets of public health is prevention, and we deduce that syndromic surveillance is timelier than traditional surveillance methods and can be used in conjunction with them to enhance outbreak detection. Earlier detection can lead to more efficient laboratory testing and prompt infection control measures to interrupt human-to-human transmission during disease outbreaks. This study demonstrates the potential to use medical student clinical experience logs and the VCOM CREDO medical student patient encounter logging system as a real-time surveillance and rate-triggered alert tool.
Funding source: VCOM internal funding for CREDO none
Award Identifier / Grant number: none
Research funding: This work was supported by New Initiative internal funding provided by the Edward Via College of Osteopathic Medicine. This funding was used for programmer salaries and for cloud computing charges to create CREDO, the software system that acquired the data for this project.
Author contributions: Drs Rawlins and Garner provided substantial contributions to conception and design, acquisition of data, analysis and interpretation of data; all authors drafted the article or revised it critically for important intellectual content; all authors gave final approval of the version of the article to be published; and all authors agree to be accountable for all aspects of the work in ensuring that questions related to the accuracy or integrity of any part of the work are appropriately investigated and resolved.
Competing interests: Authors state no conflict of interest.
Ethical approval: This study was reviewed and was approved by the Institutional Review Board at Edward Via College of Osteopathic Medicine (#1172780, effective until 1/15/2021).
References
1. Bellazzini, MA, Minor, KD. ED syndromic surveillance for novel H1N1 spring 2009. Am J Emerg Med. 2011;29(1):70-74. https://doi.org/10.1016/j.ajem.2009.09.00910.1016/j.ajem.2009.09.009Suche in Google Scholar PubMed PubMed Central
2. Henning, K. Overview of syndromic surveillance: what is syndromic surveillance? MMWR Suppl. 2004;53(suppl):5-11.10.1037/e307182005-001Suche in Google Scholar
3. National Syndromic Surveillance Program (NSSP). Centers for Disease Control and Prevention website. http://www.cdc.gov/nssp/overview.html. Published May 27, 2020. Accessed May 28, 2020.Suche in Google Scholar
4. Mandl, KD, Overhage, JM, Wagner, MM, et al.. Implementing syndromic surveillance: a practical guide informed by the early experience. J Am Med Inform Assoc. 2004;11(2):141-150. https://doi.org/10.1197/jamia.M135610.1197/jamia.M1356Suche in Google Scholar PubMed PubMed Central
5. May, LS, Griffin, BA, Bauers, NM, et al.. Emergency department chief complaint and diagnosis data to detect influenza-like illness with an electronic medical record. West J Emerg Med. 2010;11(1):1-9.Suche in Google Scholar
6. Hiller, KM, Stoneking, L, Min, A, Rhodes, SM. Syndromic surveillance for influenza in the emergency department-A systematic review. PLoS One. 2013;8(9):e73832. https://doi.org/10.1371/journal.pone.007383210.1371/journal.pone.0073832Suche in Google Scholar PubMed PubMed Central
7. Thomas, MJ, Yoon, PW, Collins, JM, Davidson, AJ, Mac Kenzie, WR. Evaluation of syndromic surveillance systems in 6 US state and local health departments. J Public Health Manag Pract. 2018;24(3):235-240. https://doi.org/10.1097/PHH.000000000000067910.1097/PHH.0000000000000679Suche in Google Scholar PubMed PubMed Central
8. Integrated Surveillance Information Systems/NEDSS. Centers for Disease Control and Prevention website; 2017. https://wwwn.cdc.gov/nndss/nedss.html. Accessed March 15, 2020.Suche in Google Scholar
9. Buehler, JW, Whitney, EA, Smith, D, Prietula, MJ, Stanton, SH, Isakov, AP. Situational uses of syndromic surveillance. Biosecur Bioterror. 2009;7(2):165-177. https://doi.org/10.1089/bsp.2009.001310.1089/bsp.2009.0013Suche in Google Scholar PubMed
10. Corso, PS, Kramer, MH, Blair, KA, Addiss, DG, Davis, JP, Haddix, AC. Cost of illness in the 1993 waterborne Cryptosporidium outbreak, Milwaukee, Wisconsin. Emerg Infect Dis. 2003;9(4):426-431. https://doi.org/10.3201/eid0904.02041710.3201/eid0904.020417Suche in Google Scholar PubMed PubMed Central
11. Foldy, SL. Linking better surveillance to better outcomes. MMWR Suppl. 2004;53:12-17.10.1037/e307182005-002Suche in Google Scholar
12. Cunha, BE. Monkeypox in the United States: an occupational health look at the first cases. AAOHN J. 2004 Apr;52(4):164-8. PMID: 15119816.10.1177/216507990405200422Suche in Google Scholar
13. SARS. Centers for Disease Control and Prevention website. https://www.cdc.gov/sars/index.html. Accessed March 9, 2020.Suche in Google Scholar
14. Summary of probable SARS cases with onset of illness from 1 November 2002 to 31 July 2003. World Health Organization; 2003. https://www.who.int/csr/sars/country/table2004_04_21/en/. Accessed March 12, 2020.Suche in Google Scholar
15. Foldy, SL, Barthell, E, Silva, J, et al.. SARS Surveillance Project--Internet-enabled multiregion surveillance for rapidly emerging disease. MMWR Suppl. 2004;53:215-220.10.1037/e307182005-037Suche in Google Scholar
16. 2009 H1N1 Pandemic (H1N1pdm09 virus). Centers for Disease Control and Prevention website. https://www.cdc.gov/flu/pandemic-resources/2009-h1n1-pandemic.html. Accessed March 15, 2020.Suche in Google Scholar
17. Coronavirus Disease 2019 (COVID-19). Centers for Disease Control and Prevention website. https://www.cdc.gov/coronavirus/2019-ncov/index.html. Accessed March 15, 2020.Suche in Google Scholar
18. Cucinotta, D, Vanelli, M. WHO declares COVID-19 a pandemic. Acta Biomed. 2020;91(1):157-160. https://doi.org/10.23750/abm.v91i1.9397Suche in Google Scholar
19. https://www.cdc.gov/coronavirus/2019-ncov/symptoms-testing/symptoms.html. Accessed on December 14, 2020.Suche in Google Scholar
20. Wilder-Smith, A, Chiew, CJ, Lee, VJ. Can we contain the COVID-19 outbreak with the same measures as for SARS?. Lancet Infect Dis. 2020;20(5):e102-e107. https://doi.org/10.1016/S1473-3099(20)30129-810.1016/S1473-3099(20)30129-8Suche in Google Scholar
21. WHO health emergency dashboard. World Health Organization website. https://extranet.who.int/publicemergency. Accessed December 14, 2020.Suche in Google Scholar
22. Rawlins, F, Sumpter, C, Sutphin, D, Garner, HR. Quantifying medical student clinical experiences via an ICD Code Logging App. Int J Med Inform. 2018;111:51–7. https://doi.org/10.1016/j.ijmedinf.2017.12.01710.1016/j.ijmedinf.2017.12.017Suche in Google Scholar PubMed
23. Fitzner, J, Qasmieh, S, Mounts, AW, et al.. Revision of clinical case definitions: influenza-like illness and severe acute respiratory infection. Bull World Health Organ. 2018;96(2):122-128. https://doi.org/10.2471/BLT.17.19451410.2471/BLT.17.194514Suche in Google Scholar PubMed PubMed Central
24. Global Epidemiological Surveillance Standards for Influenza. World Health Organization. https://www.who.int/influenza/resources/documents/WHO_Epidemiological_Influenza_Surveillance_Standards_2014.pdf?ua=1. Accessed March 8, 2020.Suche in Google Scholar
25. Hutwagner, LC, Thompson, WW, Seeman, GM, Treadwell, T. A simulation model for assessing aberration detection methods used in public health surveillance for systems with limited baselines. Stat Med. 2005;24(4):543-550. https://doi.org/10.1002/sim.203410.1002/sim.2034Suche in Google Scholar PubMed
26. Yuan, CM, Love, S, Wilson, M. Syndromic surveillance at hospital emergency departments--southeastern Virginia. MMWR Suppl. 2004;53(suppl):56-58.10.1037/e307182005-012Suche in Google Scholar
27. https://www.who.int/china/news/detail/09-01-2020-who-statement-regarding-cluster-of-pneumonia-cases-in-wuhan-china Accessed December 14, 2020.Suche in Google Scholar
28. http://www.who.int/news/item/30-01-2020-statement-on-the-second-meeting-of-the-international-health-regulations-(2005)-emergency-committee-regarding-the-outbreak-of-novel-coronavirus-(2019-ncov) Accessed December 14, 2020.Suche in Google Scholar
29. https://www.whitehouse.gov/presidential-actions/proclamation-suspension-entry-immigrants-nonimmigrants-persons-pose-risk-transmitting-2019-novel-coronavirus/ Accessed December 14, 2020.Suche in Google Scholar
30. https://www.washingtonpost.com/us-policy/2020/02/05/some-lawmakers-confront-trump-administration-over-coronavirus-response/ Accessed December 14, 2020.Suche in Google Scholar
31. https://www.cdc.gov/media/releases/2020/s0229-COVID-19-first-death.html Accessed December 14, 2020.Suche in Google Scholar
32. Cucinotta, D, Vanelli, M. WHO Declares COVID-19 a Pandemic. Acta Biomed. 2020 Mar 19;91(1):157-160. https://doi.org/10.23750/abm.v91i1.9397 PMID: 32191675; PMCID: PMC7569573.Suche in Google Scholar
33. https://www.fema.gov/news-release/20200726/declaracion-de-emergencia-covid-19 Accessed December 14, 2020.Suche in Google Scholar
34. Chen, H, Huang, C. The use of a CUSUM residual chart to monitor respiratory syndromic data. IIE Transactions. 2014;46(8)790-797. https://doi.org/10.1080/0740817X.2012.76136910.1080/0740817X.2012.761369Suche in Google Scholar
35. Beitel, AJ, Olson, KL, Reis, BY, Mandl, KD. Use of emergency department chief complaint and diagnostic codes for identifying respiratory illness in a pediatric population. Pediatr Emerg Care. 2004;20(6):355-360. https://doi.org/10.1097/01.pec.0000133608.96957.b910.1097/01.pec.0000133608.96957.b9Suche in Google Scholar PubMed
36. Espino, JU, Wagner, MM. Accuracy of ICD-9-coded chief complaints and diagnoses for the detection of acute respiratory illness. Proc AMIA Symp. 2001;164-168.Suche in Google Scholar
37. Elmore, JG, Wang, PC, Kerr, KF, Schriger, DL, Morrison, DE, Brookmeyer, R, Pfeffer, MA, Payne, TH, Currier, JS. Excess Patient Visits for Cough and Pulmonary Disease at a Large US Health System in the Months Prior to the COVID-19 Pandemic: Time-Series Analysis. J Med Internet Res. 2020 Sep 10;22(9):e21562. https://doi.org/10.2196/21562 PMID: 32791492; PMCID: PMC7485935.10.2196/21562Suche in Google Scholar PubMed PubMed Central
38. Basavaraju, SV, Patton, ME, Grimm, K, et al.. Serologic Testing of U.S. Blood Donations to Identify SARS-CoV-2-Reactive Antibodies: December 2019-January 2020. Clinical Infectious Diseases. Published Ahead of Print (November 30, 2020). https://doi.org/10.1093/cid/ciaa178510.1093/cid/ciaa1785Suche in Google Scholar PubMed PubMed Central
Appendix. Raw data for total daily diagnostic code counts and calculated alert thresholds
| Date | J09 | J00 | J18 | J01 | J06 | J10 | R05 | J20 | J11 | J12 | J22 | J40 | Counts/day | Alert threshold |
|---|---|---|---|---|---|---|---|---|---|---|---|---|---|---|
| 10/23/2019 | 5 | 9 | 10 | 29 | 50 | 1 | 47 | 6 | 6 | 0 | 0 | 10 | 173 | |
| 10/24/2019 | 0 | 7 | 6 | 19 | 23 | 0 | 8 | 3 | 3 | 1 | 0 | 3 | 73 | |
| 10/25/2019 | 3 | 6 | 7 | 31 | 23 | 0 | 24 | 0 | 3 | 0 | 0 | 1 | 98 | |
| 10/26/2019 | 0 | 1 | 0 | 0 | 2 | 0 | 7 | 0 | 0 | 0 | 0 | 0 | 10 | |
| 10/27/2019 | 0 | 0 | 0 | 4 | 16 | 0 | 1 | 1 | 0 | 0 | 0 | 0 | 22 | |
| 10/28/2019 | 1 | 9 | 8 | 6 | 39 | 0 | 20 | 3 | 2 | 0 | 0 | 1 | 89 | |
| 10/29/2019 | 4 | 3 | 34 | 18 | 29 | 1 | 19 | 10 | 2 | 0 | 0 | 1 | 121 | |
| 10/30/2019 | 6 | 6 | 14 | 16 | 31 | 0 | 25 | 11 | 2 | 0 | 0 | 0 | 111 | |
| 10/31/2019 | 0 | 8 | 17 | 15 | 39 | 1 | 17 | 18 | 0 | 0 | 0 | 0 | 115 | |
| 11/1/2019 | 1 | 2 | 30 | 11 | 20 | 0 | 20 | 10 | 2 | 0 | 1 | 0 | 97 | 224.2 |
| 11/2/2019 | 5 | 0 | 6 | 2 | 20 | 0 | 3 | 4 | 2 | 0 | 0 | 0 | 42 | 182.7 |
| 11/3/2019 | 1 | 11 | 6 | 7 | 9 | 0 | 10 | 7 | 6 | 0 | 0 | 0 | 57 | 195.1 |
| 11/4/2019 | 6 | 13 | 26 | 23 | 25 | 2 | 28 | 13 | 2 | 2 | 0 | 0 | 140 | 194.8 |
| 11/5/2019 | 3 | 13 | 23 | 25 | 50 | 0 | 31 | 13 | 4 | 0 | 0 | 1 | 163 | 181.3 |
| 11/6/2019 | 7 | 8 | 32 | 25 | 33 | 0 | 31 | 11 | 3 | 1 | 0 | 1 | 152 | 165.8 |
| 11/7/2019 | 2 | 7 | 32 | 16 | 23 | 0 | 18 | 13 | 0 | 0 | 0 | 1 | 112 | 186.4 |
| 11/8/2019 | 3 | 8 | 13 | 18 | 11 | 1 | 16 | 11 | 5 | 0 | 0 | 1 | 87 | 210.8 |
| 11/9/2019 | 1 | 5 | 16 | 4 | 17 | 1 | 8 | 6 | 1 | 1 | 1 | 0 | 61 | 226.2 |
| 11/10/2019 | 2 | 3 | 5 | 3 | 9 | 0 | 3 | 4 | 0 | 0 | 0 | 0 | 29 | 225.7 |
| 11/11/2019 | 5 | 6 | 26 | 22 | 54 | 0 | 15 | 17 | 1 | 0 | 0 | 0 | 146 | 225.7 |
| 11/12/2019 | 11 | 5 | 35 | 28 | 52 | 0 | 28 | 23 | 0 | 1 | 0 | 1 | 184 | 218.4 |
| 11/13/2019 | 3 | 14 | 24 | 16 | 25 | 1 | 38 | 9 | 1 | 0 | 0 | 2 | 133 | 230.7 |
| 11/14/2019 | 13 | 11 | 18 | 19 | 43 | 0 | 21 | 9 | 3 | 0 | 1 | 0 | 138 | 233.4 |
| 11/15/2019 | 6 | 3 | 14 | 22 | 25 | 0 | 7 | 13 | 1 | 0 | 0 | 0 | 91 | 247.2 |
| 11/16/2019 | 1 | 5 | 9 | 20 | 21 | 0 | 8 | 4 | 1 | 0 | 0 | 0 | 69 | 239.5 |
| 11/17/2019 | 7 | 1 | 10 | 20 | 21 | 0 | 13 | 7 | 0 | 1 | 0 | 0 | 80 | 246.4 |
| 11/18/2019 | 7 | 19 | 31 | 34 | 71 | 1 | 50 | 13 | 1 | 1 | 0 | 1 | 229 | 246.3 |
| 11/19/2019 | 10 | 10 | 26 | 34 | 35 | 0 | 24 | 15 | 5 | 0 | 0 | 0 | 159 | 244.5 |
| 11/20/2019 | 11 | 4 | 37 | 33 | 97 | 0 | 49 | 18 | 4 | 1 | 0 | 1 | 255 | 223.8 |
| 11/21/2019 | 13 | 8 | 68 | 42 | 59 | 1 | 32 | 25 | 3 | 0 | 0 | 0 | 251 | 278.1 |
| 11/22/2019 | 8 | 9 | 56 | 28 | 48 | 0 | 12 | 24 | 3 | 1 | 1 | 0 | 190 | 267.0 |
| 11/23/2019 | 0 | 4 | 19 | 7 | 11 | 0 | 16 | 0 | 1 | 0 | 0 | 0 | 58 | 329.3 |
| 11/24/2019 | 1 | 0 | 15 | 4 | 2 | 0 | 0 | 1 | 0 | 0 | 0 | 0 | 23 | 369.9 |
| 11/25/2019 | 2 | 6 | 9 | 34 | 21 | 1 | 20 | 2 | 0 | 0 | 0 | 0 | 95 | 369.3 |
| 11/26/2019 | 8 | 22 | 29 | 28 | 47 | 1 | 25 | 14 | 4 | 1 | 1 | 1 | 181 | 374.3 |
| 11/27/2019 | 7 | 5 | 20 | 19 | 23 | 0 | 6 | 3 | 3 | 0 | 0 | 0 | 86 | 398.8 |
| 11/28/2019 | 0 | 0 | 9 | 3 | 3 | 0 | 0 | 1 | 0 | 0 | 0 | 0 | 16 | 376.6 |
| 11/29/2019 | 1 | 0 | 10 | 4 | 8 | 1 | 2 | 2 | 4 | 0 | 0 | 0 | 32 | 381.8 |
| 11/30/2019 | 1 | 0 | 8 | 26 | 5 | 0 | 0 | 2 | 1 | 0 | 0 | 0 | 43 | 331.8 |
| 12/1/2019 | 2 | 0 | 7 | 5 | 4 | 0 | 5 | 6 | 0 | 0 | 0 | 0 | 29 | 267.3 |
| 12/2/2019 | 4 | 19 | 21 | 29 | 28 | 1 | 22 | 14 | 5 | 0 | 1 | 1 | 145 | 214.2 |
| 12/3/2019 | 8 | 20 | 21 | 48 | 34 | 3 | 27 | 13 | 3 | 1 | 1 | 0 | 179 | 214.0 |
| 12/4/2019 | 7 | 33 | 34 | 50 | 67 | 9 | 51 | 16 | 6 | 1 | 1 | 1 | 276 | 213.1 |
| 12/5/2019 | 5 | 9 | 19 | 51 | 24 | 0 | 18 | 15 | 0 | 0 | 2 | 0 | 143 | 236.5 |
| 12/6/2019 | 9 | 14 | 40 | 33 | 27 | 1 | 15 | 22 | 3 | 1 | 0 | 0 | 165 | 234.8 |
| 12/7/2019 | 2 | 4 | 4 | 10 | 8 | 1 | 1 | 1 | 2 | 0 | 0 | 0 | 33 | 351.1 |
| 12/8/2019 | 9 | 5 | 5 | 13 | 6 | 0 | 3 | 1 | 0 | 0 | 0 | 0 | 42 | 351.3 |
| 12/9/2019 | 10 | 22 | 57 | 64 | 43 | 0 | 23 | 12 | 7 | 2 | 0 | 1 | 241 | 350.2 |
| 12/10/2019 | 17 | 25 | 24 | 51 | 36 | 3 | 13 | 14 | 7 | 0 | 0 | 0 | 190 | 353.7 |
| 12/11/2019 | 10 | 11 | 33 | 28 | 17 | 3 | 13 | 6 | 3 | 0 | 0 | 0 | 124 | 348.9 |
| 12/12/2019 | 18 | 9 | 19 | 18 | 30 | 0 | 10 | 10 | 2 | 0 | 0 | 1 | 117 | 383.5 |
| 12/13/2019 | 12 | 16 | 18 | 43 | 23 | 0 | 23 | 10 | 3 | 2 | 0 | 0 | 150 | 386.6 |
| 12/14/2019 | 21 | 16 | 9 | 6 | 6 | 1 | 8 | 4 | 1 | 0 | 0 | 0 | 72 | 323.3 |
| 12/15/2019 | 3 | 4 | 6 | 13 | 8 | 0 | 1 | 1 | 0 | 0 | 0 | 0 | 36 | 319.9 |
| 12/16/2019 | 29 | 31 | 21 | 60 | 84 | 2 | 23 | 12 | 9 | 0 | 1 | 0 | 272 | 315.4 |
| 12/17/2019 | 27 | 16 | 32 | 37 | 76 | 1 | 26 | 14 | 0 | 0 | 1 | 0 | 230 | 303.1 |
| 12/18/2019 | 29 | 14 | 26 | 42 | 27 | 0 | 21 | 16 | 8 | 2 | 0 | 0 | 185 | 305.7 |
| 12/19/2019 | 28 | 10 | 33 | 70 | 48 | 1 | 18 | 32 | 3 | 1 | 0 | 0 | 244 | 331.5 |
| 12/20/2019 | 57 | 48 | 64 | 56 | 52 | 4 | 38 | 25 | 5 | 1 | 0 | 0 | 350 | 351.6 |
| 12/21/2019 | 2 | 1 | 6 | 5 | 2 | 0 | 6 | 1 | 0 | 0 | 0 | 0 | 23 | 362.5 |
| 12/22/2019 | 1 | 13 | 6 | 8 | 4 | 0 | 7 | 0 | 0 | 1 | 0 | 3 | 43 | 392.7 |
| 12/23/2019 | 1 | 7 | 7 | 1 | 4 | 0 | 0 | 2 | 5 | 0 | 0 | 0 | 27 | 476.1 |
| 12/24/2019 | 0 | 4 | 1 | 1 | 0 | 0 | 1 | 3 | 0 | 0 | 0 | 0 | 10 | 495.0 |
| 12/25/2019 | 0 | 0 | 1 | 3 | 0 | 0 | 0 | 0 | 0 | 0 | 0 | 0 | 4 | 492.3 |
| 12/26/2019 | 6 | 0 | 3 | 0 | 3 | 0 | 2 | 0 | 0 | 0 | 0 | 0 | 14 | 478.2 |
| 12/27/2019 | 1 | 0 | 2 | 1 | 0 | 0 | 1 | 1 | 1 | 1 | 0 | 0 | 8 | 461.9 |
| 12/28/2019 | 7 | 1 | 3 | 2 | 0 | 0 | 1 | 0 | 0 | 0 | 0 | 0 | 14 | 446.3 |
| 12/29/2019 | 1 | 1 | 4 | 3 | 8 | 0 | 0 | 0 | 4 | 0 | 0 | 0 | 21 | 380.6 |
| 12/30/2019 | 3 | 2 | 30 | 0 | 2 | 0 | 1 | 0 | 0 | 0 | 0 | 0 | 38 | 52.4 |
| 12/31/2019 | 0 | 1 | 3 | 0 | 1 | 0 | 0 | 1 | 0 | 0 | 0 | 0 | 6 | 50.9 |
| 1/1/2020 | 0 | 0 | 9 | 0 | 2 | 0 | 0 | 1 | 0 | 0 | 0 | 0 | 12 | 33.6 |
| 1/2/2020 | 5 | 0 | 10 | 1 | 4 | 15 | 1 | 1 | 0 | 0 | 0 | 0 | 37 | 43.7 |
| 1/3/2020 | 1 | 0 | 3 | 0 | 0 | 0 | 0 | 1 | 0 | 0 | 0 | 0 | 5 | 44.2 |
| 1/4/2020 | 2 | 0 | 8 | 0 | 2 | 0 | 0 | 1 | 0 | 0 | 0 | 0 | 13 | 43.1 |
| 1/5/2020 | 7 | 0 | 0 | 1 | 4 | 0 | 2 | 3 | 0 | 0 | 0 | 0 | 17 | 52.5 |
| 1/6/2020 | 21 | 4 | 27 | 24 | 13 | 1 | 20 | 7 | 2 | 0 | 1 | 0 | 120 | 53.3 |
| 1/7/2020 | 15 | 8 | 21 | 27 | 30 | 0 | 34 | 17 | 1 | 0 | 0 | 0 | 153 | 53.3 |
| 1/8/2020 | 28 | 14 | 26 | 33 | 40 | 1 | 27 | 11 | 4 | 2 | 0 | 0 | 186 | 52.7 |
| 1/9/2020 | 19 | 4 | 22 | 31 | 35 | 3 | 31 | 15 | 3 | 0 | 0 | 0 | 163 | 132.7 |
| 1/10/2020 | 20 | 1 | 32 | 17 | 20 | 0 | 12 | 17 | 2 | 0 | 1 | 1 | 123 | 201.0 |
| 1/11/2020 | 9 | 2 | 7 | 4 | 10 | 2 | 1 | 5 | 0 | 0 | 0 | 0 | 40 | 264.0 |
| 1/12/2020 | 13 | 0 | 12 | 7 | 3 | 0 | 7 | 2 | 3 | 0 | 0 | 0 | 47 | 292.3 |
| 1/13/2020 | 24 | 4 | 31 | 45 | 29 | 0 | 16 | 21 | 4 | 0 | 0 | 0 | 174 | 283.8 |
| 1/14/2020 | 25 | 8 | 23 | 24 | 43 | 3 | 26 | 8 | 16 | 1 | 0 | 0 | 177 | 273.0 |
| 1/15/2020 | 12 | 5 | 34 | 23 | 30 | 0 | 31 | 13 | 7 | 1 | 1 | 0 | 157 | 259.6 |
| 1/16/2020 | 22 | 8 | 31 | 33 | 15 | 0 | 23 | 11 | 4 | 1 | 0 | 0 | 148 | 276.7 |
| 1/17/2020 | 11 | 1 | 27 | 22 | 9 | 1 | 21 | 4 | 0 | 0 | 0 | 0 | 96 | 286.2 |
| 1/18/2020 | 33 | 7 | 16 | 5 | 18 | 0 | 7 | 4 | 3 | 1 | 0 | 0 | 94 | 273.3 |
| 1/19/2020 | 19 | 2 | 18 | 4 | 11 | 2 | 3 | 6 | 3 | 0 | 0 | 0 | 68 | 267.9 |
| 1/20/2020 | 38 | 15 | 29 | 28 | 43 | 0 | 18 | 12 | 5 | 0 | 0 | 0 | 188 | 266.4 |
| 1/21/2020 | 38 | 40 | 41 | 24 | 28 | 1 | 16 | 14 | 4 | 0 | 1 | 0 | 207 | 250.5 |
| /22/2020 | 32 | 7 | 40 | 21 | 42 | 1 | 33 | 15 | 10 | 1 | 0 | 0 | 202 | 240.0 |
| 1/23/2020 | 33 | 11 | 35 | 15 | 27 | 2 | 21 | 7 | 2 | 0 | 0 | 0 | 153 | 248.4 |
| 1/24/2020 | 42 | 4 | 11 | 27 | 13 | 1 | 18 | 5 | 2 | 0 | 0 | 0 | 123 | 267.2 |
| 1/25/2020 | 7 | 6 | 7 | 5 | 5 | 0 | 2 | 3 | 0 | 0 | 0 | 0 | 35 | 287.1 |
| 1/26/2020 | 25 | 14 | 29 | 4 | 10 | 3 | 6 | 4 | 5 | 0 | 0 | 0 | 100 | 288.1 |
| 1/27/2020 | 47 | 13 | 16 | 23 | 32 | 2 | 15 | 10 | 10 | 1 | 0 | 0 | 169 | 284.6 |
| 1/28/2020 | 70 | 7 | 33 | 39 | 53 | 4 | 30 | 21 | 6 | 0 | 0 | 0 | 263 | 308.1 |
| 1/29/2020 | 73 | 18 | 27 | 47 | 52 | 3 | 26 | 17 | 10 | 0 | 0 | 0 | 273 | 300.8 |
| 1/30/2020 | 78 | 11 | 44 | 56 | 39 | 2 | 18 | 7 | 12 | 0 | 1 | 0 | 268 | 293.5 |
| 1/31/2020 | 166 | 15 | 70 | 75 | 74 | 2 | 49 | 34 | 10 | 0 | 6 | 0 | 501 | 332.7 |
| 2/1/2020 | 32 | 3 | 11 | 3 | 5 | 0 | 1 | 4 | 1 | 0 | 0 | 0 | 60 | 373.8 |
| 2/2/2020 | 5 | 2 | 6 | 13 | 7 | 0 | 5 | 0 | 2 | 0 | 0 | 0 | 40 | 412.9 |
| 2/3/2020 | 67 | 9 | 38 | 29 | 33 | 6 | 23 | 7 | 4 | 0 | 0 | 0 | 216 | 606.9 |
| 2/4/2020 | 64 | 4 | 20 | 24 | 29 | 9 | 28 | 11 | 10 | 0 | 0 | 0 | 199 | 597.5 |
| 2/5/2020 | 44 | 1 | 17 | 19 | 38 | 4 | 14 | 4 | 1 | 0 | 0 | 0 | 142 | 615.3 |
| 2/6/2020 | 50 | 3 | 25 | 14 | 33 | 0 | 12 | 5 | 5 | 1 | 0 | 0 | 148 | 617.5 |
| 2/7/2020 | 44 | 0 | 23 | 30 | 29 | 0 | 19 | 5 | 2 | 0 | 0 | 0 | 152 | 607.7 |
| 2/8/2020 | 8 | 0 | 5 | 1 | 23 | 0 | 6 | 1 | 0 | 1 | 0 | 0 | 45 | 590.9 |
| 2/9/2020 | 11 | 0 | 8 | 2 | 9 | 0 | 0 | 1 | 1 | 0 | 0 | 0 | 32 | 569.6 |
| 2/10/2020 | 70 | 20 | 22 | 29 | 40 | 0 | 19 | 12 | 15 | 0 | 0 | 0 | 227 | 300.6 |
| 2/11/2020 | 80 | 6 | 22 | 30 | 46 | 6 | 26 | 5 | 6 | 0 | 0 | 0 | 227 | 306.2 |
| 2/12/2020 | 50 | 2 | 24 | 18 | 23 | 4 | 14 | 6 | 7 | 1 | 0 | 0 | 149 | 309.8 |
| 2/13/2020 | 38 | 2 | 27 | 12 | 30 | 4 | 19 | 12 | 6 | 2 | 0 | 2 | 154 | 316.9 |
| 2/14/2020 | 57 | 3 | 26 | 32 | 26 | 6 | 19 | 10 | 7 | 0 | 0 | 0 | 186 | 332.7 |
| 2/15/2020 | 13 | 1 | 13 | 1 | 5 | 0 | 8 | 0 | 0 | 0 | 0 | 0 | 41 | 334.0 |
| 2/16/2020 | 51 | 10 | 13 | 15 | 38 | 2 | 11 | 9 | 17 | 0 | 0 | 0 | 166 | 335.2 |
| 2/17/2020 | 41 | 3 | 29 | 16 | 46 | 5 | 19 | 12 | 3 | 1 | 0 | 0 | 175 | 344.6 |
| 2/18/2020 | 51 | 12 | 31 | 30 | 33 | 3 | 23 | 10 | 9 | 1 | 1 | 0 | 204 | 346.2 |
| 2/19/2020 | 62 | 1 | 20 | 31 | 29 | 1 | 13 | 14 | 6 | 0 | 0 | 0 | 177 | 322.0 |
| 2/20/2020 | 41 | 2 | 10 | 14 | 28 | 0 | 14 | 6 | 4 | 0 | 0 | 0 | 119 | 300.0 |
| 2/21/2020 | 28 | 1 | 21 | 20 | 40 | 1 | 12 | 10 | 4 | 0 | 0 | 0 | 137 | 286.3 |
| 2/22/2020 | 3 | 0 | 7 | 1 | 4 | 0 | 1 | 2 | 2 | 0 | 0 | 0 | 20 | 291.9 |
| 2/23/2020 | 15 | 1 | 5 | 2 | 2 | 2 | 1 | 2 | 1 | 0 | 0 | 0 | 31 | 291.8 |
| 2/24/2020 | 70 | 8 | 89 | 36 | 34 | 12 | 13 | 14 | 5 | 0 | 0 | 0 | 281 | 280.2 |
| 2/25/2020 | 89 | 8 | 50 | 54 | 63 | 5 | 19 | 12 | 2 | 0 | 0 | 0 | 302 | 294.5 |
| 2/26/2020 | 99 | 17 | 44 | 41 | 71 | 1 | 24 | 13 | 15 | 1 | 1 | 1 | 328 | 304.3 |
| 2/27/2020 | 46 | 19 | 42 | 46 | 46 | 33 | 14 | 3 | 5 | 0 | 0 | 2 | 256 | 371.3 |
| 2/28/2020 | 214 | 29 | 91 | 83 | 133 | 0 | 45 | 21 | 13 | 8 | 9 | 0 | 646 | 428.5 |
| 2/29/2020 | 14 | 6 | 15 | 1 | 10 | 1 | 5 | 9 | 1 | 0 | 0 | 0 | 62 | 496.9 |
| 3/1/2020 | 16 | 0 | 10 | 4 | 21 | 1 | 0 | 0 | 0 | 1 | 0 | 0 | 53 | 518.1 |
| 3/2/2020 | 36 | 24 | 27 | 22 | 22 | 1 | 21 | 7 | 0 | 0 | 0 | 0 | 160 | 792.3 |
| 3/3/2020 | 32 | 3 | 36 | 14 | 22 | 1 | 14 | 14 | 11 | 0 | 0 | 0 | 147 | 778.9 |
| 3/4/2020 | 46 | 9 | 26 | 14 | 23 | 3 | 10 | 14 | 8 | 0 | 0 | 0 | 153 | 771.5 |
| 3/5/2020 | 51 | 10 | 21 | 16 | 43 | 2 | 25 | 16 | 2 | 0 | 0 | 0 | 186 | 765.8 |
| 3/6/2020 | 39 | 5 | 21 | 14 | 23 | 0 | 11 | 10 | 2 | 1 | 0 | 0 | 126 | 750.8 |
| 3/7/2020 | 7 | 5 | 9 | 5 | 6 | 1 | 3 | 1 | 1 | 0 | 0 | 0 | 38 | 719.8 |
| 3/8/2020 | 3 | 3 | 2 | 6 | 11 | 0 | 3 | 0 | 1 | 0 | 0 | 0 | 29 | 707.6 |
| 3/9/2020 | 47 | 14 | 21 | 11 | 43 | 0 | 15 | 8 | 3 | 0 | 0 | 0 | 162 | 253.2 |
| 3/10/2020 | 27 | 13 | 23 | 16 | 42 | 1 | 51 | 9 | 4 | 0 | 0 | 0 | 186 | 263.8 |
| 3/11/2020 | 26 | 10 | 25 | 15 | 35 | 1 | 9 | 8 | 4 | 1 | 1 | 1 | 136 | 274.0 |
| 3/12/2020 | 18 | 7 | 14 | 18 | 32 | 1 | 23 | 7 | 2 | 2 | 0 | 0 | 124 | 274.9 |
| 3/13/2020 | 36 | 24 | 24 | 12 | 37 | 0 | 19 | 13 | 9 | 0 | 0 | 0 | 174 | 291.5 |
| Total | 3251 | 1087 | 2973 | 2807 | 3609 | 206 | 2057 | 1170 | 467 | 52 | 35 | 24 | 17738 |
© 2020 Gabrielle Bruzda et al., published by De Gruyter, Berlin/Boston
This work is licensed under the Creative Commons Attribution 4.0 International License.
Artikel in diesem Heft
- Frontmatter
- Editorial
- The language of race and ethnicity in academic medical publishing
- Behavioral Health
- Original Article
- Associations between stress, anxiety, depression, and emotional intelligence among osteopathic medical students
- Cardiopulmonary Medicine
- Clinical Practice
- Straight back syndrome as a clue to diagnosing asymptomatic congenital valvular heart disease and limiting the risk of weightlifting
- Innovations
- Review Article
- Toward the use of medical scent detection dogs for COVID-19 screening
- Medical Education
- Original Article
- Osteopathic students and graduates matching into pathology residency, 2011–2020
- Medical Education
- Special Communication
- Diversity in osteopathic medical school admissions and the COMPASS program
- Medical Education
- Commentary
- The history of medical education: a commentary on race
- Musculoskeletal Medicine and Pain
- Original Article
- Effect of occipitoatlantal decompression on cerebral blood flow dynamics as evaluated by Doppler ultrasonography
- Neuromusculoskeletal Medicine (OMT)
- Review Article
- Osteopathic manipulative treatment and the Spanish flu: a historical literature review
- Obstetrics and Gynecology
- Original Article
- Untangling the roots of the West Virginia opioid crisis: relationships in adolescent pregnancy, drug misuse, and future outcomes
- Public Health and Primary Care
- Original Article
- The seroprevalence of SARS-CoV-2 in a rural southwest community
- Public Health and Primary Care
- Original Article
- Evaluating disease outbreaks with syndromic surveillance using medical student clinical rotation patient encounter logs
- Public Health and Primary Care
- Original Article
- Red blood cell distribution width and outcome in trauma patients
- Public Health and Primary Care
- Review Article
- SGLT2 inhibitors: a narrative review of efficacy and safety
- Clinical Images
- Retained colon in the subcutaneous fat after colostomy reversal
- Gonococcal arthritis