3D concept creation of permanent geodetic monitoring installations and the a priori assessment of systematic effects using Virtual Reality
-
 and
and

Abstract
Logistic processes of construction sites are transferred into virtual and full 3D environments to increase the interoperability for all project partners. These digital twins are emerging for the construction process of modern building processes and are already designed to be used for the operation of the building afterwards. In structural health monitoring (SHM) the sensor installations are also designed to monitor the structure over its whole lifespan. Therefore, the embedding process and the operation of the sensor systems and the Building Information Modelling (BIM) have overlapping long-term goals. Beside these 3D software advances in civil engineering, the working environments in the field of geodesy still follow more established approaches. In many cases using only 2D CAD plans and on-site visits at the existing structure are best practice for the design of geodetic monitoring installations. This paper describes the improvement of the concept creation of permanent monitoring systems with geodetic total stations in an interactive virtual 3D environment. The simulated instruments are behaving according to their specification data and are linked with a physics engine to automatically detect common problems in a network design like obstructed line of sights, disadvantageous incidence angles at the targets or automatic aiming issues due to multiple targets in the field of view. Furthermore, the Virtual Reality (VR) technology is introduced as a user interface for a virtual 3D planning environment. The functionality of the developed VR application is tested in a real-life use case for the feasibility study of the automatic monitoring of a railway tunnel.
1 Introduction
Geodetic methods have always been driven by major technological advances to keep up with the requirements of the construction sector and to open up new possibilities in land administration. Nowadays, surveyors operate in a highly dynamic and full 3D working environment and in many cases, conventional 2D software solutions and visualisations have already reached their limits.
As displayed in figure 1 the application of geodetic network design has always been adapted to the current state-of-the-art technologies and underwent many paradigm shifts. Especially the invention of the electronic distance measurement (EDM) in the 1970s triggered new approaches and use cases for more precise classical trigonometric measurements also on a local scale. Furthermore, the introduction of GNSS devices in the 80 s made large scale trigonometric networks nearly obsolete as seen at the examples of national surveying institutes [1] or large land construction sites e. g. the Semmering [2] and the Gotthard Base Tunnel [3].
An important step was the introduction of robotic total stations (RTS) with automatic aiming technologies in the early 1990s [4]. Not only have they increased the manual performance of a surveyor in the field, they also enable fully automatic and permanent monitoring installations. Besides the advantage of higher temporal resolution and large scale coverage of several simultaneous operating stations, also new challenges have emerged. The remote operation of a total station at a construction site lacks the mobility and flexibility of a human surveyor. The fixed setup points of the instrument can hardly be adjusted to temporal or permanent obstructions of the line of sight. Moreover, due to the increasing number of contributing systems in modern total stations and the high measurement precision, systematic effects become more significant and relevant for an a priori investigation during the design phase.

Geodetical advances in surveying techniques and their impact on geodetic networks.
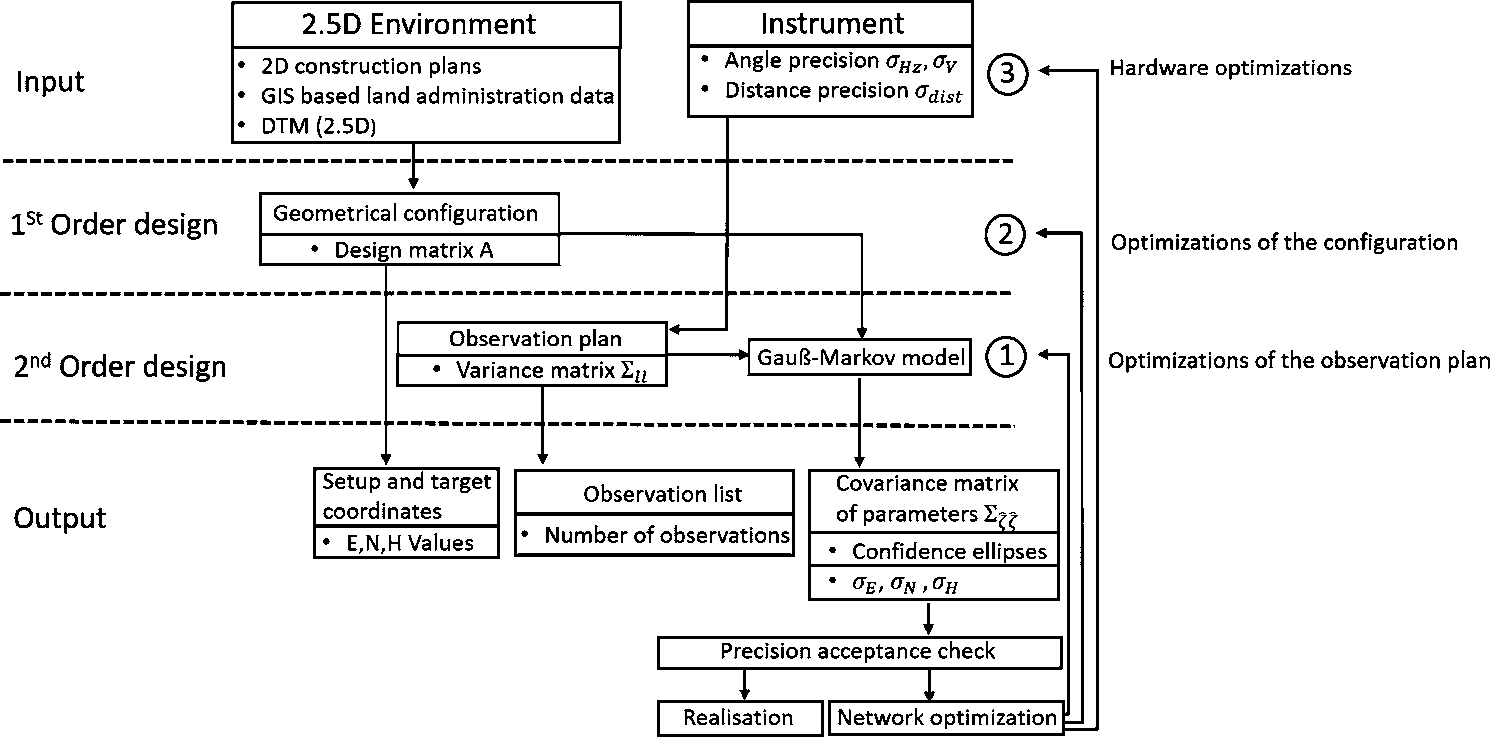
Flowchart regarding the 1st and 2nd order design for geodetic network planning and optimization steps.
The mathematical foundations for geodetic adjustments originate from Carl Friedrich Gauß and have been known since the early 1800s (see Equation (1) & (2)). With the Gauß-Markov model redundant measurements (l) can be adjusted. Additionally, the variance (
Based on that work, authors like Pelzer [5], Cooper [6], Caspary [7] as well as Niemeier [8] have predominantly contributed to the concepts of modern network design. Although their concepts are still valid today, many constraints of a modern construction site must be added to their workflows and have to be seen in a dynamic and 3D perspective. According to Niemeier [9], the design steps of a geodetic network can be divided into three categories: the zero order design (geodetic datum), 1st order design (geometrical configuration) and the 2nd order design (stochastic model and observation plan) as it is demonstrated in figure 2. Until the introduction of GNSS devices in the late 20th century, the definition of the coordinate system was a major decision to correctly approximate the local earth curvature. The focus was on the zero order design and the 2nd order design to fulfil the accuracy demands for large scale triangulations. The 1st order design was applied with much freedom, because the surveying campaigns took place in remote areas to carry out measurements between mountain tops. Due to the priority and resources of the national surveys, also obstructions in populated areas could be overcome by the erection of huge observation towers.
Nowadays, well established earth reference frames and geoid determination through satellite geodesy are available. On the other hand, the 1st order design has become more challenging, due to many projects in small scale urban scenarios. The integration of the surveying equipment into a dynamic construction environment is a key issue at modern sites, because the monitoring instrument has to function alongside many other installation and logistic processes. This also applies for the 2nd order design because the observation plan and the measurement accuracy are dependent on the dynamic working environment as well.

User with VR gear (1), surveying catalogue (2), placement with VR controllers (3), and context menu (4).
2 Motivation for an object orientated 3D approach
The standard workflow of a network design is shown in figure 2 with the selection of the geometrical configuration, the definition of the observation plan and the calculation of confidence ellipses for all coordinates. If the result does not meet the requirements, the design is iteratively optimized by adding observations in the 2nd order design (1), inserting additional observation points in the first order design (2) or by choosing more precise instruments for the 2nd order design (3). However, this workflow is not suitable for complex 3D scenarios and requires improvements.
Today, investigations of obstructions and interferences are predominantly carried out manually in a 2.5D CAD or GIS environments and are strongly depended of the human perception. Although geodetic experts are aware of systematic effects in the automatic aiming process and prism orientation dependent accuracy losses, these issues are not covered with the required detail in today’s best practice examples of network design. Therefore, the manual investigation of the systematic effects has to be replaced by semi-automatic computation approaches to work in dense urban scenarios with high accuracy, reasonable effort and increased reproducibility. A 3D planning software for network design should automatically indicate if the modelled systematic effects are within an acceptable accuracy range and answer the following questions:
Can the developed design be realised? (instrument mounting and obstructions of the line of sight)
Does the prism orientation cause significant accuracy issues in the network configuration?
Is the automatic instrument aiming distracted by multiple prisms in the field of view?
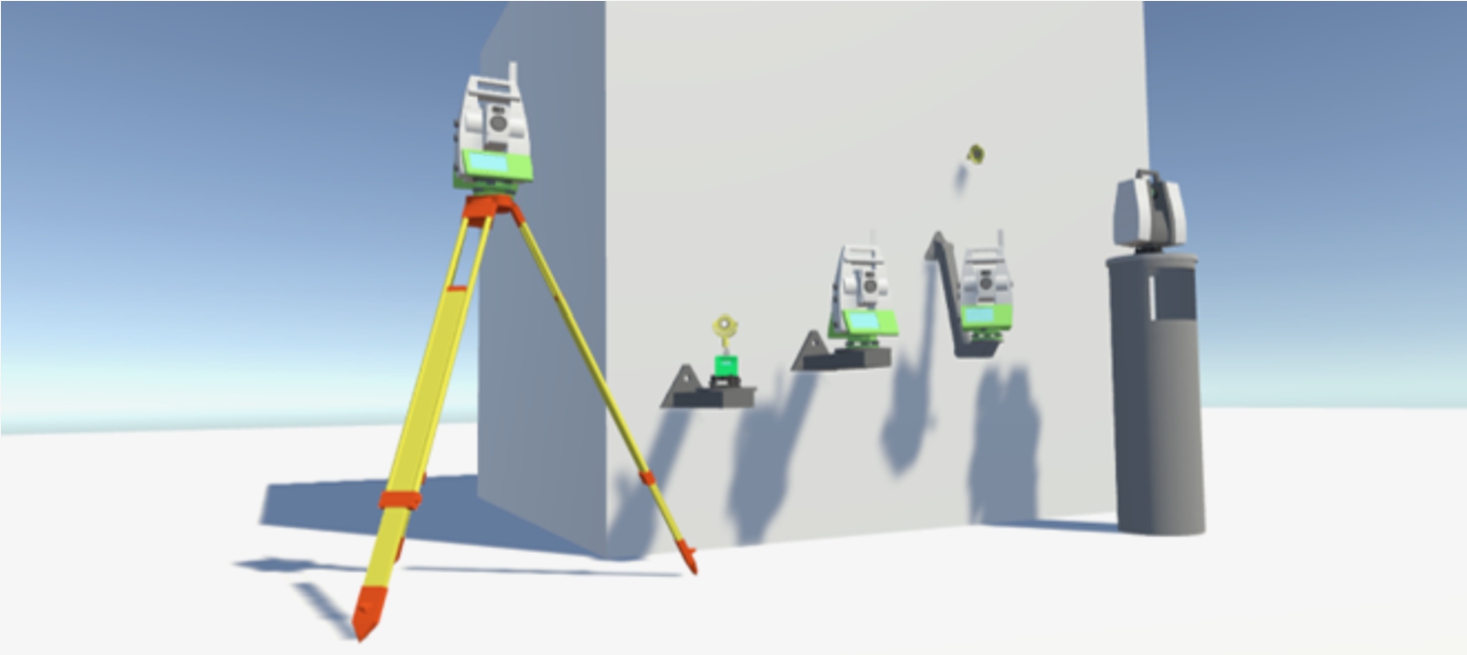
3D representations of the virtual surveying equipment.
Nevertheless, the adequate usage of these 3D models in a geodetic context and the adequate integration into geodetic workflows is still a major discussion. Therefore, this paper investigates an object orientated software approach for the simulation of systematic sensor effects within an interactive 3D environment. 3D representations of the intended monitoring scenario can be imported and virtual surveying equipment can be placed in real time. The virtual surveying objects are modelled with representative functionality to interact with each other and the imported surrounding area. During the concept creation the user can access status information of all objects and gets visual feedback on the current quality of the connections between objects. This enables a network design with higher detail and integrity compared to conventional approaches. Not only the influence of systematic effects on the measurement setup can be reduced, also a more stable configuration can be found for the stochastic evaluation with the Gauß-Markov model. In the end, the final mounting points of the instruments and quality information can be derived and passed onto the contractor.
3 Working principle of the developed planning software
3.1 Software environment
A broad spectrum of geodetic software products is available for the handling of 3D models and spatial analysis. There are point cloud additions for CAD software solutions [14], 3D modelling software from laser scanner distributors [15], BIM analysis software [16] and 3D GIS [17]. The functionality of these products is aimed at the analysis of measurement data, geometrical topology and spatial queries and visualisation. Although most of these software products provide the possibility to implement user customizable functionalities by coding interfaces, the dynamic simulation of virtual surveying instruments with mechanical functionalities is hardly possible in real time.
The required functionality for the simulation of the instrument behaviour and sensoric effects in a three dimensional, dynamic and object orientated environment can be found in game engines from the entertainment sector. These software developing environments, which are originally designed for the production of video games, like Unity, the Unreal Engine or the CRYENGINE offer a suitable object oriented 3D coding environment and provide also rudimental physics and light engines [18].
For the development of the experimental software, described in this paper, the game engine Unity (2019.3.3f1) was used. It provides the required degree of freedom with an easy-to-use C# coding interface and supports the usage of Virtual Reality (VR) gear (HTC Vive Pro [20]) to provide a suitable access point to the interactive 3D environment for a user (figure 3). The viewpoint with VR from the ego perspective on the task enables a better estimation of dimensional relations and provides a comparable experience of the scene as a user would get on site. The improved 3D data perception of geodetic datasets with VR gear has already been demonstrated by several other geodetic institutions (see [21] and [22]). In general, the adaption of 3D modelling and data interaction approaches from the entertainment sector is a common process throughout many industries, because this sector has a long tradition in human-computer interaction. The improvement of technical applications with well established concepts from the film industry or video games is widely known as gamification or gameful design [19].

Collision Control with a Autodesk Revit model in the VR application in overview mode (a) and ego perspective with VR (b).
3.2 The virtual surveying equipment
The central element of the 3D simulation is the virtual surveying equipment. The user is provided with a catalogue of items which can be selected and placed directly in an imported 3D model, as it can be seen in figure 3. The current available surveying gear is orientated at commercially available products and not limited to any specific manufacturers. All used items have been modelled in 3D construction software according to public available schemes and available open source meshes. The attributes have been extracted from the corresponding data sheets and laboratory investigations.
Therefore, all items are separate objects that consist of detailed 3D meshes (figure 4), attributes and functions. The attributes and functions are implemented in C# scripts which are attached to the objects in Unity.
These functions handle the interaction between objects and enable basic mechanical functionality. For instance, the total station is able to turn and lock onto prisms, the tripod legs automatically adjust to the ground for a horizontal setup, the joints of the console are moving according to the orientation of the mounting point and the optimal orientation of a prism is automatically calculated.
With this virtual surveying equipment another synergy is created with BIM. For future applications an exchangeable format for surveying equipment would be beneficial to increase the interoperability. Approaches for modelling surveying equipment with the open IFC format [23] do exist, but can still be seen as experimental [24] and are not supported as data templates by any manufacturer yet.
4 Quality assessment of the monitoring configuration
4.1 Collision control
Basic requirements for a monitoring installation are an obstacle free mounting position and an undisturbed line of sight to the target points. For the computation of the intersection of objects the physics engine in Unity provides colliders. A collider is an abstracted 3D polygon of the 3D model with a lower level of detail which is used in mathematical operations for performance reasons. When placing 3D objects into the scene the intersections with all adjacent colliders are computed. If the object interferes with a collider which is restricted (e. g. instrument and building facade), the placement is aborted.
A similar procedure is applied for the validation of the line of sight. Here the intersection of a vector and a collider polygon is computed. Only if the vector intersects the collider of the corresponding prism, the line of sight is set as valid. The operation of vector intersection is referred to as raycast in Unity. Because the method of raytracing [25] is widely used for the computation of shadows and lightning conditions in media productions the raycast in Unity can be carried out in nearly real time. In figure 5 the raycast is performed on a building model, which was designed in Autodesk Revit.

Schematic monitoring setup with two total stations in an urban environment.
According to the result of the raycast the line of sight is coloured. The colour red is applied when an obstacle is detected. If it is valid, it is coloured blue (if the hierarchy of the prism was set as a reference point) or green (if the hierarchy of the prism was set as a monitoring point). This way the user gets direct visual feedback about the possibility of sightings and can directly readjust the placement if needed.

Results of the rotation tests at 7 m (a) and results of the rotation tests at 25 m (b).
As seen in the figure 5 only the geometry information is used for quality assessment at the current stage of development. If a scenario requires a distinction between different materials during the raytracing, for instance, glas facades and concrete walls, the implementation of a loading algorithm for more complex models (with metadata) has to be implemented. This would also effect the placement of the instrumentation, because further restrictions could be implemented. An example would be the stability of the mounting point where the placement of the object is aborted when the required drilling for the rawlplugs is prohibited due to the material of the wall.
4.2 Incidence angles on prisms
It is known that the achievable accuracy of angle and distance measurements onto a surveying prism is directly correlated to the incidence angle of the line of sight [26]. This systematic behaviour has to be taken into account especially when multiple total stations are measuring at the same prism from different setup points. In such a scenario, a situation can occur as it is displayed in figure 6. If not all observation points (green dots in figure 6) are visible form one setup point, multiple total stations have to be operated in a common coordinate system and overlapping measurements have to be carried out onto stable reference points (blue dots in figure 6).
To highlight this issue, laboratory investigations have been performed where a Leica TM50 carried out measurements to different target types (Leica GPR121, Leica GMP101 and a Goecke spherical-prism) mounted on a rotation platform. The deviations of the horizontal angle of the total station measurements are displayed for different rotation angles in figure 7a for a distance of 7 m and in figure 7b for a distance of 25 m.
The Goecke spherical prism shows a more asymmetric behaviour in comparison to the GMP101. Only the standard GPR121 round prim shows at both distances the same systematic behaviour which enables the user to model this effect and apply it to actual measurements. However, the numerical corrections for the GPR121 could be also very high and therefore, a detailed knowledge of the actual orientation of the prism on site would be crucial to apply them accordingly.

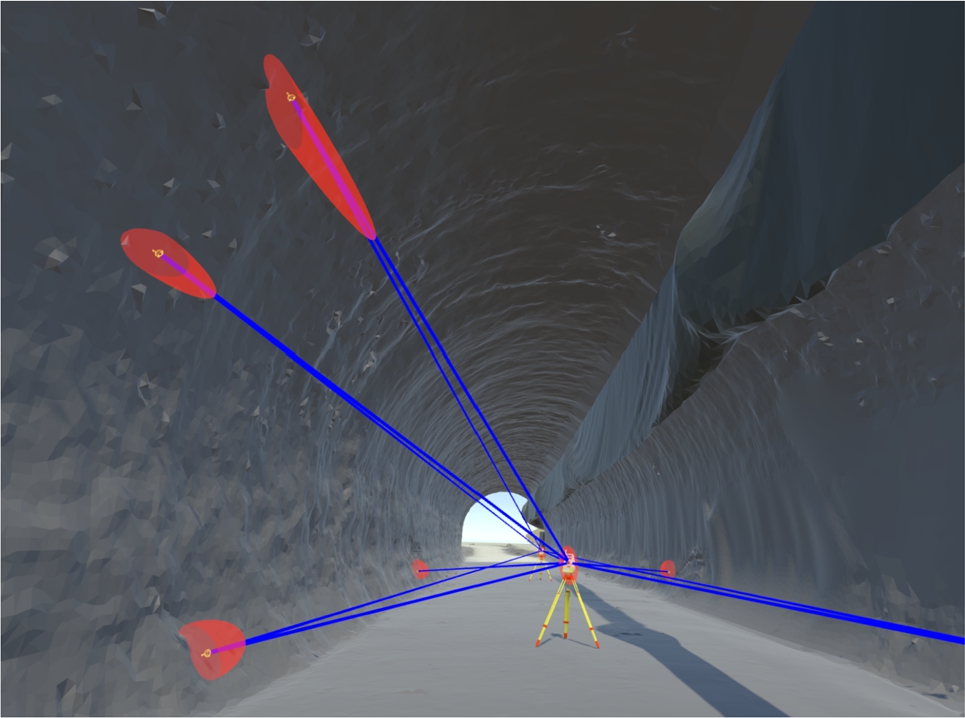
(a) Underground monitoring situation with multiple targets (b) Usage of the light engine in Unity onto prisms.
It is better to avoid this effect already in the network design and to operate all target points under safe conditions without applying any corrections in the post processing. Therefore, it is necessary to define an accuracy level for the monitoring installation which represents the safe operation. In figure 7 an accuracy level of 1 mm is assumed for demonstration purposes which leads to an capable working range of ±25° for the GPR101. For the GMP101 an orientation below ±35° is still sufficient and because of the inhomogeneous effect and the increased standard deviation the acceptable orientation of the Goecke sphere was set to only ±20°.
By defining a certain accuracy level in the VR application, the working ranges for the available prism types are automatically set. Based on the implemented mechanical functionality of the prisms and the known normal vector of the 3D surface of the model, also the optimal prism orientation for the setup is computed. The prism’s centreline is oriented towards the normal vector of the surface or it is matched to an existing mounting point. Afterwards the prism is virtually turned towards the centroid of all contributing total stations. At this stage all incidence angles are calculated with vector geometry and marked in red colour if the angle exceeds the defined limit. The final prism orientations (with respect to the rotation axis of the prism) can then be exported along with the mounting coordinates in ASCII format to support the installation on site.
4.3 Proximity of adjacent prisms in the field of view
A monitoring system based on total station measurements delivers only deformation data at discrete points which are stabilised with a reproducible target sign. To increase the spatial resolution of the monitoring setup, a high number of prisms is usually placed into the scene as seen in figure 8a for an underground tunnelling scenario. Due to the high dynamic of a tunnel excavation site (trucks, blasts) and the fast progress of the drilling these convergence measurements are carried out manually on a movable tripod. Therefore, distinguishing between prisms is done by the human operator and is not the major problem in the displayed scenario. If this scenario takes place in a geotechnical challenging area where long term observations have to take place with a high temporal resolution, the automatic operation of a permanent installation is more feasible. This applies even more when the site is inaccessible to humans because the effort of reaching it with the required temporal resolution is unreasonable or if the site is exposed to life threatening conditions such as unstable geology or radioactivity.
In this case the aiming of the total station has to be carried out by automatic aiming technologies which are implemented in all modern robotic total stations. The majority of the used aiming technologies base on the emission of infrared light, its reflection at the prism and the evaluation of the backscattered light with an infrared detector. Depending on the used approach the total station can detect multiple prisms in the field of view of an infrared camera [27] or aims at the intensity centre with a quadrant detector [28].
Field of view specifications of different total stations (* only specific versions).
| Trimble S-Series [29] | Topcon MS [30] | Leica TS60 [31] | Leica TM50 [32] | |
| Visual | 1°30’ | 1°30’ | 1°30’ | 1°30’ |
| Auto Aiming | 2.1° | 1°30’ | 1°25’ | 28’ |
| Narrow Aiming | 8.4’* | — | 30’ | 9’ |
Each technology has a different realisation in the instruments. Therefore, the field of view of the aiming mechanism differs between instruments (table 1). It can be seen that the visual fields of view of most available instruments are the same with an opening angle of 1.5°. Regarding the automatic aiming technologies the Leica TM50 has a standard field of view of only 1/3 of its visual field of view (28’). Contrarily the Trimble S-Series has a bigger field of view of the Autolock technology (2.1°) compared to its visual field of view (1.5°). This means that prisms can contribute to the aiming process of Trimble S-Series instruments even if they can not be seen through the telescope. For long range applications the field of views of the automatic aiming technologies can be additionally reduced with narrow aiming with specific Leica and Trimble instruments.
Depending on the technology, failures in the automatic aiming process show different behaviour. On the one hand, a quadrant detector is more likely to aim at the common centre of multiple prisms on the other hand, camera-based approaches are more likely to snap to a false prism. Either way, when having multiple prisms in the search cone the likelihood of a system failure is dramatically increased.
To avoid any distractions, a monitoring configuration should foresee only one prism in the search cone for a safe operation of the system. Therefore, an abstracted automatic aiming process was integrated in the VR application to make the user aware of this problem while placing the targets. In a first step the search cone is implemented as a collider that detects all prism colliders within it. This reduces the amount of prisms that have to be further investigated. In a second step, the light engine in Unity is used to detect if a prism is in the search cone, but is not hit by the search light due to obstructions. A virtual camera which is placed in front of the prism detects the colour shift of the prism when it is hit by emitted red light. Therefore, it is also possible to detect if the prism is only partly hit by the red light as seen in figure 8b.
Underground scenario with confidence ellipsoids.
The working principle of emitting a red light and detecting it with a virtual camera has worked out stable with the physics engine that is provided in Unity. This opens up the possibility of a more detailed modelling of the automatic aiming technology in future applications by using reflective surfaces at the prisms and by placing the virtual camera directly in the optical context of the telescope of the simulated instrument.

3D model of the tunnel interior and measurement concept.
4.4 3D simulation of the error distribution and confidence ellipsoids
The line of sights of the network configuration are stored in a database, which is updated with every user input. If a feasible configuration is found by the user a traditional network simulation with a Gauß-Markov model can be carried out to obtain confidence information for the planned setup points. Based on the line of sights between instruments and reference points the design matrix is automatically derived. Also the variance matrix of the observations (
5 Real world application for a permanent tunnel monitoring concept with total stations
5.1 Task description and requirements
The installation of a 3D permanent monitoring in a geologically challenging area in a railway tunnel has been considered by the tunnel operator. The concept foresees six cross sections which are approximately 30 m apart from each other, see figure 10. The distance between the cross sections is related to the common measurement setups in tunnelling defined in the monitoring handbook by the Austrian Society for Geomechanics (OeGG) [33]. Also based on the OeGG handbook in this measurement setup, each section should be equipped with at least five well distributed observation points. Due to the remote location of the deformation area the automatic operation of a total station was intended because the train operation of the tunnel should not be disturbed by unscheduled transportation of surveying personal into and out of the tunnel.
The monitoring concept had to be investigated at a time when the excavation of the tunnel was still in progress, therefore an on site visit was not possible and the concept creation had to be carried out virtually. The complexity of the task resulted from the curvature of the tunnel walls at the cross sections but also from the curvature of the tunnel itself. Moreover many inventory objects for the train operation like marker boards, railroad signals, power lines may obstruct the line of site in the final building. Furthermore, safety regulations had to be considered, e. g. the pedestrian walkway should be kept free of obstacles and any instrumentation must not interfere with the safety space of the trains or the power lines.
To cover all requirements in a single environment and to sustain a reliable concept creation the object orientated approach inside the VR application was preferred to a conventional approach of manual construction inside a CAD environment.
The design of the monitoring system required a 3D data foundation which was not available for the required tunnel section. Instead, construction schemata of representative tunnel cross sections, inventory plans and a georeferenced centreline of the tunnel were provided by the tunnel operator. The 3D model that can be seen in figure 10, which was then used for the concept creation, was modelled according to the given information within the conventional 3DReshaper software. Every inventory object has been modelled separately and placed into the scene according to the construction plans.
5.2 Console design and placement of the total station
The first step of the design process was to define the mounting method of the total station. The stabilization should not interfere with the safety area of the pedestrian area, nor should the stabilization affect the handrails of the sidewalk. The placement should also take into account that the total station should be accessed without the use of a ladder for maintenance purposes and should be easily operable if needed. To decide which of the available console solutions fit for this scenario several types have been modelled in 3D according to the construction plans of the distributors. Two commonly used types can be seen in figure 11.
The safety spaces were introduced as separate objects with colliders which have been taken into account while placing the consoles and the instrument.
Both consoles have been placed in an user operable height into the scene without intersecting any relevant colliders, therefore, both displayed console types would fit according to the formal requirements. Because of stability reasons (console 14-TK3 has a long lever) the usage of the 14-TK400 is preferred in this tunnel setup. Moreover, the VR application showed clearly that the standard model of the console can be used without any customizations.

Placement of the total station on (a) console 14-TK3 and (b) console 14-TK400 in the scene.

(a) Number of prisms in the field of view of 28’ (b) Tunnel cross section with target mounting points and restricted space (highlighted in red).
5.3 Prism configuration and automatic target aiming
The required cross sections have been imported as polylines into the VR application to highlight the area of interest to the user. During the placement of the prisms several obstructions have been indicated by the collision detection at the top position near the power line. To avoid any interference with the power line, these top points have been moved to the right-hand side of the power line afterwards, as seen in figure 12b. Obstructions have also occurred for several prisms at the same height as the total station. Therefore, these prisms have been moved in height to avoid an alignment of the line of sights.
To cover a wide selection of possible instruments for the simulation of the automatic aiming process the most common field of views (2.1°, 1.5°, 28’ and 9’) have been used, according to the instruments in table 1. The simulation of 2.1° and 1.5° revealed a very limited operability of the configuration. A slightly better result has been obtained with an opening angle of 28’. The result of this investigation can be seen in 12a, where the table displays the number of prisms in the search cone when aiming at specific positions. Barely, the fist two cross sections can be operated remotely in an automatic setup under the assumption that multiple prisms have to be avoided. Especially, the prisms at position 5 are likely to cause disturbances. The requirement of only on prism in the search cone can only be fulfilled by instruments supporting an automatic aiming with 9’.

Enhanced flowchart regarding the 1st and 2nd order design for geodetic network planning: Standard procedure (black) and enhanced modules (green).
5.4 Results of the feasibility study
For all placed items in the scene, the required mounting points on the tunnel wall are calculated automatically. A list of ASCII coordinates with the drilling locations for the wall plugs can be exported and delivered to the contractor. Also the instrument height and the prism orientation can be extracted to support an optimal installation of the system. This should guarantee the operability of the real permanent installation as it was simulated in the VR application. For future applications also the sharing of the simulated 3D objects would be possible if the contractor prefers to work in a BIM related environment. Therefore, the shared datasets in an object orientated approach deliver more information, because the result is not only a list of coordinates with an accuracy estimation, moreover, each coordinate can be linked to a 3D object and its metadata (e. g. costs or installation procedure).
The automatization of the quality checks of the network design resulted in a reduced time effort. For comparison and evaluation purposes several automatic aiming scenarios have been checked also manually inside the 3DReshaper software by drawing lines in a CAD like environment and checking their intersection with objects visually. Double the time was needed for a single configuration compared to the VR application. The improvement can be seen in the adjustment and the recalculation of setups. In the CAD environment the manual operation time scales linearly with the number of tasks. In an object orientated approach most of the tasks are carried out automatically without human input. In the given task, where four different types of instruments have been simulated at 30 targets and the configuration had to be readjusted twice, the time reduction can be assumed in a total ratio of 1:5 and the result can be reproduced any time by different experts.
6 Summary and discussion
The workflow of the geodetic network design has to be augmented and transferred into a dynamic and interactive 3D environment, to keep up with the demands of complex 3D surveying tasks. The introduction of fully functional 3D objects has replaced manual feasibility studies by a semi-automatic approach in order to increase the 3D integrity of the network design (see figure 13) and to reduce the effort for a human operator. Also the 3D environment enables a detailed simulation and estimation of possible systematic instruments effects with regard to the virtual representation of the monitoring scenario. In addition to the geometry information in the 3D models, it is planned to take the material properties into account in future software versions.
Beside the high degree of automatization in the application, the intuition and experience of the geodetic expert is a key element. All modelled restrictions should raise awareness to the user of possible systematic effects and should provide a guiding system. However, it is up to the user to trade one benefit for another and to decide individually in a specific situation.
Moreover, the usage of Virtual Reality gear offers the human user the possibility to investigate real (as built) models and fictional (conceptual) models from a first person perspective without the need of being on-site in person. This way the planning process is not limited to already existing structures and accessibility for on site visits (threats to human lives, e.g radiation). Shared VR sessions have great potential for future applications. In such a virtual conference the monitoring concept could be visualized for all stakeholders with different backgrounds (civil engineers and architects) and interferences with the building process could be easily discussed together on a unified discussion basis. Nevertheless, the long term usage of VR is still an issue of the current state of the technology. Therefore, the optimal usage is a balanced combination between well established desktop approaches and VR simulations. The demonstrated VR application is designed as an augmentation that takes over when conventional software reaches its limits and not to make these approaches obsolete.
The object orientated approach opens up synergies with the basic concept of BIM. Beside the geodetic aspects of a permanent installation the instruments and its components are also facility objects. The definition of the mounting methods, determination of power supplies and aesthetic design decisions are critical issues in large scale projects. With increasing maturity of BIM processes in the construction sector, such issues will significantly affect the implementation of the installations and has to be covered also in the design phase. The developed VR software has already implemented basic functionalities such as the simulation of mounting methods and the export of automatic equipment lists and renderings for architects. With the availability of data templates for surveying equipment basic cost estimations would also be possible.
Funding source: TU Graz, Internationale Beziehungen und Mobilitätsprogramme
Funding statement: Supported by TU Graz Open Access Publishing Fund.
References
[1] A. Bannister, S. Raymond, R.Baker: Surveying. 6th ed., John Wiley and Sons, Inc., 605 Third Avenue, New York (1992). p. 180–184. ISBN 0-470-21845-2.Search in Google Scholar
[2] K. Macheiner, H. Döller, W. Jachs, N. Kühtreiber, A. Eder et al.: Das dynamische Grundlagennetz für den Semmering Basistunnel: Herausforderungen seit der Netzerstellung. Proc. 17.Internationeler Kurs für Ingenieurvermessung Graz, Wichmann Verlag (2017). pp. 441–456.Search in Google Scholar
[3] R. Stengele, I. Schätti-Stählin: Grundlagen- und Hauptkontrollmessung im Gotthard-Basistunnel, Geomatik Schweiz: Geoinformation und Landmanagement, Heft 12: AplTransit, ETH Zürich (2010).Search in Google Scholar
[4] A. Wagner, P. Wasmeier, T. Wunderlich, H. Ingensand: Vom selbstzielenden Theodolit zur Image Assisted Total Station. avn – Allgemeine Vermessungs-Nachrichten (2014). 171–180.Search in Google Scholar
[5] H.Pelzer: Statische, kinematische und dynamishce Punktfelder. Geodätische Netze in der Landes und der Ingenieurvermessung II. Stuttart, Germany (1985).Search in Google Scholar
[6] M. Cooper: Control Surveys in Civil Engineering. Collins, London, UK (1987).Search in Google Scholar
[7] W.F. Caspary: Concepts of Network and Deformation Analysis. Monograph. UNSW, School of Surveying, Australia (1998).Search in Google Scholar
[8] W. Niemeier: Deformationsanalyse aktueller Stand in der Theorie und Praxis. Proc. X. Internationaler Kurs für Ingenieurvermessung, Munich, Germany (1985).Search in Google Scholar
[9] W. Niemeier: Ausgleichungsrechnung: Statistische Auswertemethoden. De Gruyter, Berlin, New York (2018). p. 332. 10.1515/9783110206784.Search in Google Scholar
[10] M. Grabe, C. Ullerich, M. Wenner, M. Herbrand: smartBridge Hamburg – prototypische Pilotierung eines digitalen Zwillings. Bautechnik. 97 (2020). 10.1002/bate.201900108.Search in Google Scholar
[11] C. Eastman, P. Teicholz, R. Sacks, K. Liston: BIM Handbook, A guide to building information modelling for owners, managers, designers, engineers, and contractors. 2nd ed., Wiley, Haboken, New Jersey (2011). ISBN 9781119287537.Search in Google Scholar
[12] buildingSmart: Regelwerke – BIM Regelwerk (AIA+BAP). Homepage. Accessed: https://www.buildingsmart.co.at/muster-aia-und-muster-bap/ (9.8.2022).Search in Google Scholar
[13] Bundesministerium für Verkehr und digitale Infrastruktur: Stufenplan Digitales Planen und Bauen, Einführung moderner, IT-gestützter Prozesse und Technologien. Berlin (2015). Available online: https://www.bmvi.de/SharedDocs/DE/Publikationen/DG/stufenplan-digitales-bauen.pdf?__blob=publicationFile (accessed on 21.December 2021).Search in Google Scholar
[14] Autodesk Homepage: Civil3D Product Overview. Homepage. Accessed: https://www.autodesk.de/products/civil-3d/overview?term=1-YEAR&tab=subscription (9.8.2022).Search in Google Scholar
[15] Leica Homepage: Cyclone 3DR Product Overview. Homepage. Accessed: https://leica-geosystems.com/de-at/products/laser-scanners/software/leica-cyclone/leica-cyclone-3dr (9.8.2022).Search in Google Scholar
[16] Autodesk Homepage: Revit Product Overview. Homepage. Accessed: https://www.autodesk.de/products/revit/overview?term=1-YEAR&tab=subscription (9.8.2022).Search in Google Scholar
[17] S. Zlatanova: Advances in 3D GIS. Quarterly Review of Disegno Digitale e Design, 1(4) (2002). 24–29.Search in Google Scholar
[18] GameSparks, Game Engine Analysis. Available online: https://www.gamesparks.com/blog/game-engine-analysis/ (accessed on 3 August 2021).Search in Google Scholar
[19] S. Deterding, R. Khaled, L. Nacke, D. Dixon: Gamification: Toward a definition. Conference: CHI 2011 Gamification Workshop Proceedings (2011). pp. 12–15.Search in Google Scholar
[20] HTC: Homepage. Product Overview (2018). Available online: https://www.vive.com/de/product/vive-pro/ (accessed on 3 August 2021).Search in Google Scholar
[21] M. Lütjens, Th. Kersten, B. Dorschel, F. Tschirschwitz: Virtual Reality in Cartography: Immersive 3D Visualization of the Arctic Clyde Inlet (Canada) Using Digital Elevation Models and Bathymetric Data. Multimodal Technologies and Interaction, Special Issue “Interactive 3D Cartography”. 3(1) (2019). 9. 10.3390/mti3010009.Search in Google Scholar
[22] C. Traxler, G. Hesina, K. Chmelina: Immersive tunnel monitoring by data driven navigation in 3D. Tunnels and Underground Cities: Engineering and Innovation meet Archaeology, Architecture and Art (2019). 10.1201/9780429424441-344.Search in Google Scholar
[23] buildingSmart: Industry Foundation Classes (IFC) – An Introduction. Homepage. Accessed: https://technical.buildingsmart.org/standards/ifc/ (8.4.2022).Search in Google Scholar
[24] J.Rio, B. Ferreira, J.Martins: Expansion of IFC model with structural sensors. Informes de la Construcción. 65 (2013). 219–228. 10.3989/ic.2013.v65.i530.Search in Google Scholar
[25] O. Abert, M. Geimer, S.Muller: Direct and fast ray tracing of NURBS surfaces. Symposium on Interactive Ray Tracing (2006). pp. 161–168. 10.1109/RT.2006.280227.Search in Google Scholar
[26] S. Lackner, W. Lienhart: Impact of Prism Type and Prism Orientation on the Accuracy of Automated Total Station Measurements. Joint International Symposium on Deformation Monitoring At: Vienna (2016).Search in Google Scholar
[27] Leica, ATRplus White paper. 2015.10.15 – INT (2015). Available online: https://globalsurvey.co.nz/wp-content/uploads/2014/10/ATRplus_WP.pdf (accessed on 3 August 2021).Search in Google Scholar
[28] Trimble, Timble Knowledeg Center: Trimble S8 Total Station: Locking with FineLock Technology onto a Passive Target. (2009). Available online: https://mytrimbleprotected.com/knowledge/docushare/retrieve?handle=File-456319 (accessed on 3 August 2021).Search in Google Scholar
[29] Trimble, Timble Knowledeg Center Trimble: S8 Total Station: FineLock Technology Field of View. (2008). Available online: https://mytrimbleprotected.com/knowledge/docushare/retrieve?handle=File-436526 (accessed on 3 August 2021).Search in Google Scholar
[30] Topcon, Instruction Manual: Measuring Station MSXXAX. (2014). Available online: https://mrtachymeter.de/WebRoot/Store22/Shops/f0902491-2862-441f-bfd3-1ff90467a7e0/MediaGallery/Bedienungsanlei-tungen/IM_MS05AX_1AX.pdf (accessed on 3 August 2021).Search in Google Scholar
[31] Leica, TS60 MS60 User Manual. 819179-2.0.0en, (2016). Available online: http://www.naic.edu/~phil/hardware/theo-dolites/ms60_ts60_usersManual_leica.pdf (accessed on 3 August 2021).Search in Google Scholar
[32] Leica, TM50 User Manual.805805-1.1.1en (2013). Available online: https://surveyequipment.com/assets/index/download/id/219/ (accessed on 3 August 2021).Search in Google Scholar
[33] W. Schubert, A.B. Moritz (Hrsg.): Geotechnical Monitoring in Conventional Tunnelling: Handbook. GEOAUSTRIA (2014). ISBN:978-3-9503898-0-7.Search in Google Scholar
© 2022 the author(s), published by De Gruyter
This work is licensed under the Creative Commons Attribution 4.0 International License.
Articles in the same Issue
- Frontmatter
- Research Articles
- 3D concept creation of permanent geodetic monitoring installations and the a priori assessment of systematic effects using Virtual Reality
- Modeling the gravitational effects of ocean tide loading at coastal stations in the China earthquake gravity network based on GOTL software
- Comparison of different global DTMs and GGMs over Sri Lanka
- Performance tests of geodetic receivers with tilt sensors in obstructed environments using the NRTK GNSS technique
- Fitting a triaxial ellipsoid to a set of quasi-selenoidal points
- A real-time algorithm for continuous navigation in intelligent transportation systems using LiDAR-Gyroscope-Odometer integration
- Ionospheric scintillation characteristics from GPS observations over Malaysian region after the 2011 Valentine’s day solar flare