Kernel-Based Measure of Variable Importance for Genetic Association Studies
-
Vicente Gallego

 and
Ramon Oller
and
Ramon Oller

Abstract
The identification of genetic variants that are associated with disease risk is an important goal of genetic association studies. Standard approaches perform univariate analysis where each genetic variant, usually Single Nucleotide Polymorphisms (SNPs), is tested for association with disease status. Though many genetic variants have been identified and validated so far using this univariate approach, for most complex diseases a large part of their genetic component is still unknown, the so called missing heritability. We propose a Kernel-based measure of variable importance (KVI) that provides the contribution of a SNP, or a group of SNPs, to the joint genetic effect of a set of genetic variants. KVI can be used for ranking genetic markers individually, sets of markers that form blocks of linkage disequilibrium or sets of genetic variants that lie in a gene or a genetic pathway. We prove that, unlike the univariate analysis, KVI captures the relationship with other genetic variants in the analysis, even when measured at the individual level for each genetic variable separately. This is specially relevant and powerful for detecting genetic interactions. We illustrate the results with data from an Alzheimer’s disease study and show through simulations that the rankings based on KVI improve those rankings based on two measures of importance provided by the Random Forest. We also prove with a simulation study that KVI is very powerful for detecting genetic interactions.
1 Introduction
The identification of genetic variants that are associated with disease risk is one of the challenging problems in genetic epidemiology. The usual study design for exploring the genetic basis of human diseases is a case-control study where single nucleotide polymorphisms (SNPs) are genotyped and differences in genotype frequencies between cases and controls are analyzed. The standard statistical analysis for genetic association studies is the single marker analysis where each SNP is tested separately for association with disease status. Though many genetic variants have been identified and validated so far using this univariate approach, for most complex diseases a large part of their genetic component is still unknown, the so called missing heritability. Indeed, unless very large sample sizes are available, the univariate approach is not going to be powerful enough for detecting new causal variants because of the small individual effect sizes that most causal variants have, as has been shown in the genetic variants detected up to now in genome wide association studies (GWAS) [1], and because of the restrictive multiple testing corrections that are required. Moreover, the power of the univariate approach is also affected by the correlation between genetic markers that are analyzed (Linkage Disequilibrium) and because this approach ignores possible non-linear joint effects or epistasis.
Random Forest (RF) [2] is an alternative to the univariant approach that can capture non-linear effects. It has been applied in genetic association studies for identification and selection of the most informative SNPs, see, for instance, [3] and [4]. However, the most widely used measures of variable importance provided by Random Forests, mean decrease accuracy (MDA) and mean decrease Gini (MDG), have important limitations. While MDA is very unstable, as described in a simulation study about the stability of RF rankings [5], MDG is strongly biased, favoring SNPS’s with large minor allele frequency [6, 7]. How correlation impacts on both measures of importance is another issue that has been studied in [8, 9] and [10]. In order to overcome these difficulties and reduce computational burden, new RF importance measures and RF implementations have been proposed [11, 12, 13]. For nice reviews on Random Forests see [14] and [15].
In this work we center on the Kernel methodology that has proven to be an efficient multi-marker approach to study nonlinear joint effects of a set of genetic variants [16, 17]. The genetic information is captured by the Kernel matrix that measures similarities between individuals on the basis of their SNP genotypes. One of the advantages of this approach is that it can encompass situations with large number of variables and small number of individuals [18]. Kernel machine logistic regression and support vector machine (SVM) are two alternative approaches for classification with a bivariate phenotype that have been used for biomarker discovery using the Kernel methodology [19, 20, 21]. Though computationally more expensive than SVM, Kernel machine logistic regression has the advantage of providing estimates of the class probabilities and it is easily extended to more than two classes classification and to continuous phenotypes. For further reading on Kernel machine regression see [22, 23, 24] or [25]; for support vector machine (SVM) methods on feature selection with high dimensional data sets, see also [26, 27] or [28].
Kernel machine regression provides a test for the joint nonparametric effect of a set of SNPs. However, the result of such a multi-marker global test can be difficult to interpret and a question naturally arises as to which genetic markers are driving the observed joint effect. In order to answer this question and to guide the interpretation of a multiple marker analysis we propose a Kernel-based measure of variable importance (KVI) that provides the contribution of a SNP, or a group of SNPs, to the joint genetic effect of a set of genetic variants. KVI depends on a statistic
KVI can be used for ranking genetic markers individually, sets of markers that form blocks of linkage disequilibrium or sets of genetic variants that lie in a gene or a genetic pathway. We prove that, unlike the univariate analysis, KVI captures the relationship with other genetic variants in the analysis, even when measured at the individual level for each genetic variable separately. This is specially relevant and powerful for detecting genetic interactions.
In summary, the proposed Kernel-based methodology provides a new insight into genetic association studies by providing a measure of importance of the genetic variants or sets of genetic variants. We illustrate the results with data from an Alzheimer’s disease study and show through simulations that the rankings based on KVI improve those rankings based on two measures of importance provided by the Random Forest [2]. We also prove with a simulation study that KVI is very powerful for detecting genetic interactions.
The paper is organized as follows. Section 2 describes the proposed Kernel-based measure of variable importance. In Section 3 we present the results of applying the proposed methodology to the genes of the Reelin pathway from a genome-wide association study on Alzheimer’s disease. We provide both, the KVI rankings of the genes in the pathway and the rankings of the SNPs within the two most important genes. In Section 4 we outline the results of several simulation analysis which confirm that our proposal identifies the most relevant genetic variants better than other techniques. The paper ends with a discussion of the main issues of this work.
2 Methods
2.1 Kernel-based variable importance
We consider a case-control association study involving
The Kernel machine method is based on projecting the genotypes,
The inner product in
(1)Any unknown function of the genetic component,
(2)
The Kernel function applied to every pair of subjects defines a
In order to define the importance of each genetic variable (SNP) we use a measure
From eq. (1), the squared distance in
We denote by
The squared distance between the centre of masses of cases and controls is given by:
Given all these distances, we define the following measure of discrimination,
where the numerator gives the separation of the two centres of masses and the denominator gives the separation of cases and controls to their respective centres of mass. Large values of
where
We propose the Kernel-based measure of importance for the
where
where
In the following sections we will illustrate the performance of the proposed
where
is the number of alleles shared identical by state between subjects
The second one is the polygenic Kernel [32], which is a linear Kernel applied to standardized genotype data,
where
Finally, we also consider Hadamard (or element-wise) products between two Kernel matrices. These Kernel products have proven to be useful for detecting gene interaction effects [32].
3 Alzheimer data analysis
Alzheimer’s disease (AD), one of the most common neurodegenerative diseases, is characterized by the extracellular accumulation of the
To illustrate our methodology we will explore the role of the genetic variation in the Reelin signaling pathway in Alzheimer’s disease. The Reelin signaling pathway contributes to the formation of synaptic circuits in the central nervous system and interacts with ApoE protein, whose isoform
Distribution of SNPs in the genes of the Reelin signaling pathway. The table contains the name of the gene, the chromosome (Chr), the number of genotyped SNPs in the gene coding region (CDS) and the number of genotyped SNPs in the promoter region.
| SNPs in | SNPs in | SNPs in | SNPs in | ||||
| Gene | Chr | CDS | promoter | Gene | Chr | CDS | promoter |
| ABL1 | 9 | 27 | 0 | LRP2 | 2 | 43 | 1 |
| ABL2 | 1 | 6 | 2 | PIK3R1 | 5 | 8 | 2 |
| APOE | 19 | – | – | CDK5R1 | 17 | – | – |
| APOER2 | 1 | 11 | 0 | CDK5R2 | 2 | – | – |
| APP | 21 | 49 | 1 | TP73 | 1 | 4 | 0 |
| BDNF | 11 | 5 | 1 | AKT1 | 14 | 2 | 1 |
| CAMK2A | 5 | 10 | 1 | PLK2 | 5 | 1 | 0 |
| CASK | X | – | – | PSEN1 | 14 | 4 | 0 |
| CDC42 | 1 | 10 | 2 | PSEN2 | 1 | 5 | 1 |
| CDK5 | 7 | 4 | 0 | RAC1 | 7 | 5 | 0 |
| CNR1 | 6 | 6 | 2 | RELN | 7 | 80 | 2 |
| DAB1 | 1 | 251 | 1 | RHO | 3 | 1 | 1 |
| EMX2 | 10 | 0 | 1 | RHOA | 3 | 0 | 4 |
| EPHA1 | 7 | 1 | 2 | SHIP | 2 | 18 | 0 |
| FYN | 6 | 36 | 1 | SRC | 20 | 4 | 0 |
| GSK3B | 3 | 7 | 0 | TAU | 17 | 31 | 0 |
| ITGA3 | 17 | 4 | 6 | TBR1 | 2 | 2 | 4 |
| LDLR | 19 | 4 | 0 | VLDLR | 9 | 5 | 2 |
We computed the KVI measure of importance for each gene in the Reelin signaling pathway. Figure 1 represents the ranking of the genes in the Reeling signaling pathway given by the KVI measure of importance using the Polygenic Kernel. The
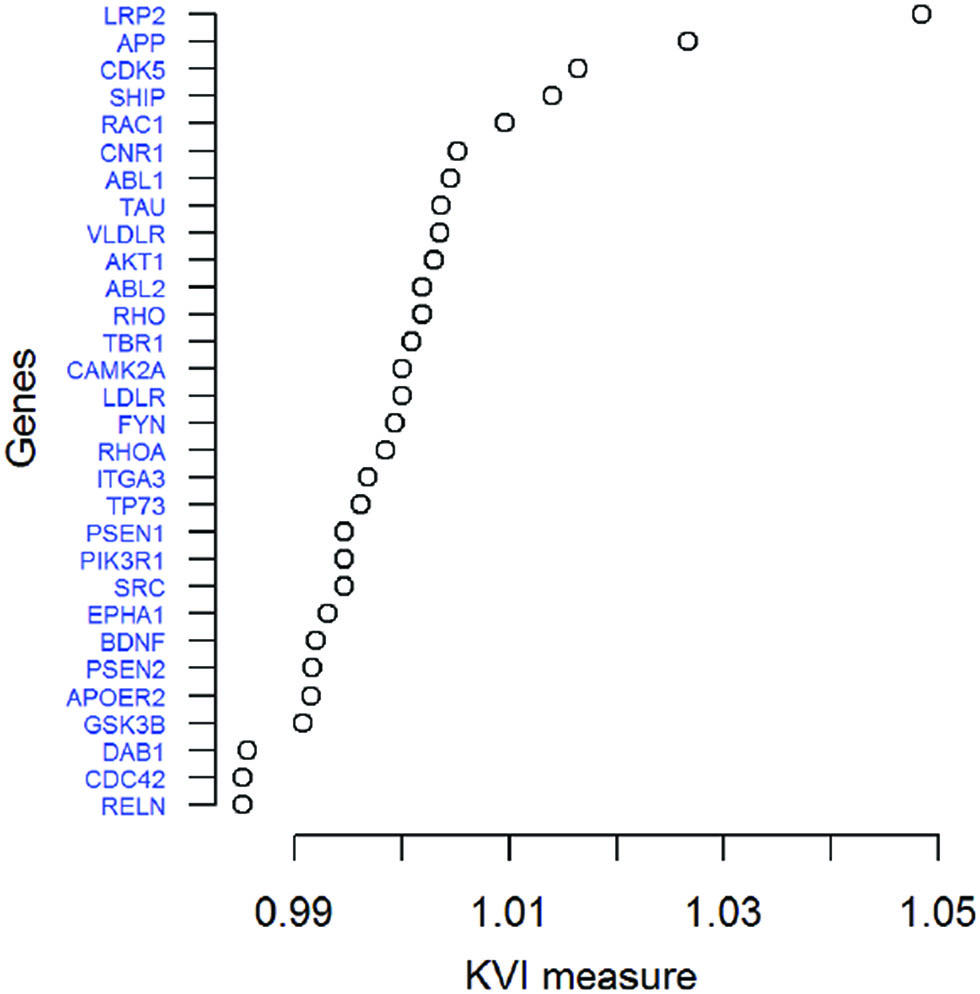
KVI ranking of the genes in the Reelin signaling pathway.
The three genes have been implicated in AD in previous works. The LRP2 gene codifies for the LDL receptor related protein 2 (LRP2), also called megalin, that has apolipoprotein E as a common ligand. Megalin has been recognized as an important component of many pathological conditions, including Alzheimer’s disease. In addition, the expression of megalin and some of its ligands in the central and peripheral nervous system suggests a role for this receptor in neural regeneration processes [37]. The amyloid precursor protein (APP) is a transmembrane protein expressed at high levels in the brain. Several works suggest the implication of APP in the generation of the neurotoxic A
As a second step, we explored the SNPs within the two genes with a larger number of genotyped SNPs, LRP2 and APP. The ranking of the SNPs within each gene are given in Figure 2. The 4 top SNPs in LRP2 are rs2239594, rs11689553, rs830959 and rs2239598; the top 4 in APP are rs2830076, rs436011, rs2830005 and rs2830075 and the 4 SNPs genotyped in CDK5 are rs891507, rs2069456, rs2069454 and rs1549759. The discussion on the possible mechanisms that relate these markers to AD is out of the scope of this work.
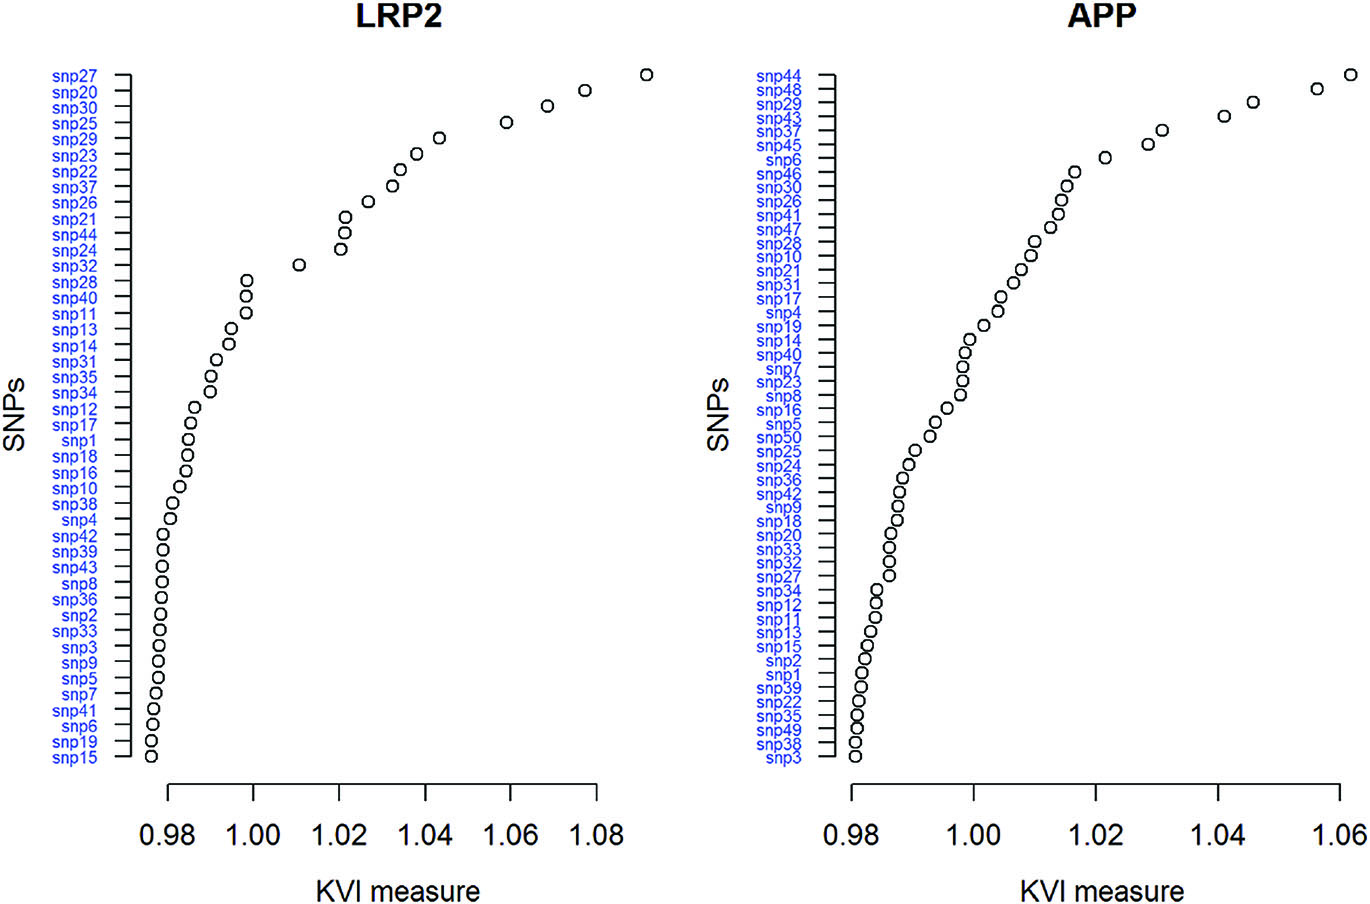
KVI ranking of the SNPs in gene LRP2 (left) and APP (right).
In order to explore the robustness of the rankings with respect to the selected Kernel we reanalyzed the Alzheimer study using the IBS Kernel which counts the number of alleles shared identical by state (IBS) between two individuals. The results obtained were very similar to the ones discussed previously provided by the polygenic Kernel. Both, the IBS and polygenic Kernel, identified the same 5 more important genes and assigned them the same order of importance: LRP2
4 Simulation study
We conducted a simulation study to assess the performance of KVI. We considered several scenarios including independent SNPs, correlated SNPs and epistasis. In each scenario, our purpose is to evaluate if KVI ranks the causal variants on the top of the list and compare the results with the rankings provided by the usual univariate approach and the Random Forest variable importance measures. The Random Forest, as implemented in the R-package randomForest [40], provides two different importance measures, mean decrease accuracy (MDA) and mean decrease Gini (MDG). MDA quantifies the importance of a variable by measuring the change in prediction accuracy, when the values of the variable are randomly permuted compared to the original observations. MDG is the sum of all decreases in Gini impurity due to a given variable (when this variable is used to form a split in the Random Forest), normalized by the number of trees.
4.1 Ranking performance for independent SNPs
In this section we display the results of a simulation study for comparing the performance of four importance measures for ranking a set of SNPs according to their association with a simulated disease-status phenotype. The four measures compared are the proposed Kernel based measure of importance, KVI, two measures of importance provided by the Random Forest methodology, MDA and MDG, and the rankings denoted by IND (for individual) based on the marginal
The performance of the four measures of importance is compared in terms of the mean percentage of causal SNPs at the top ranking positions. Figure 3 shows the mean percentage of causal SNPs being at the top
The results for
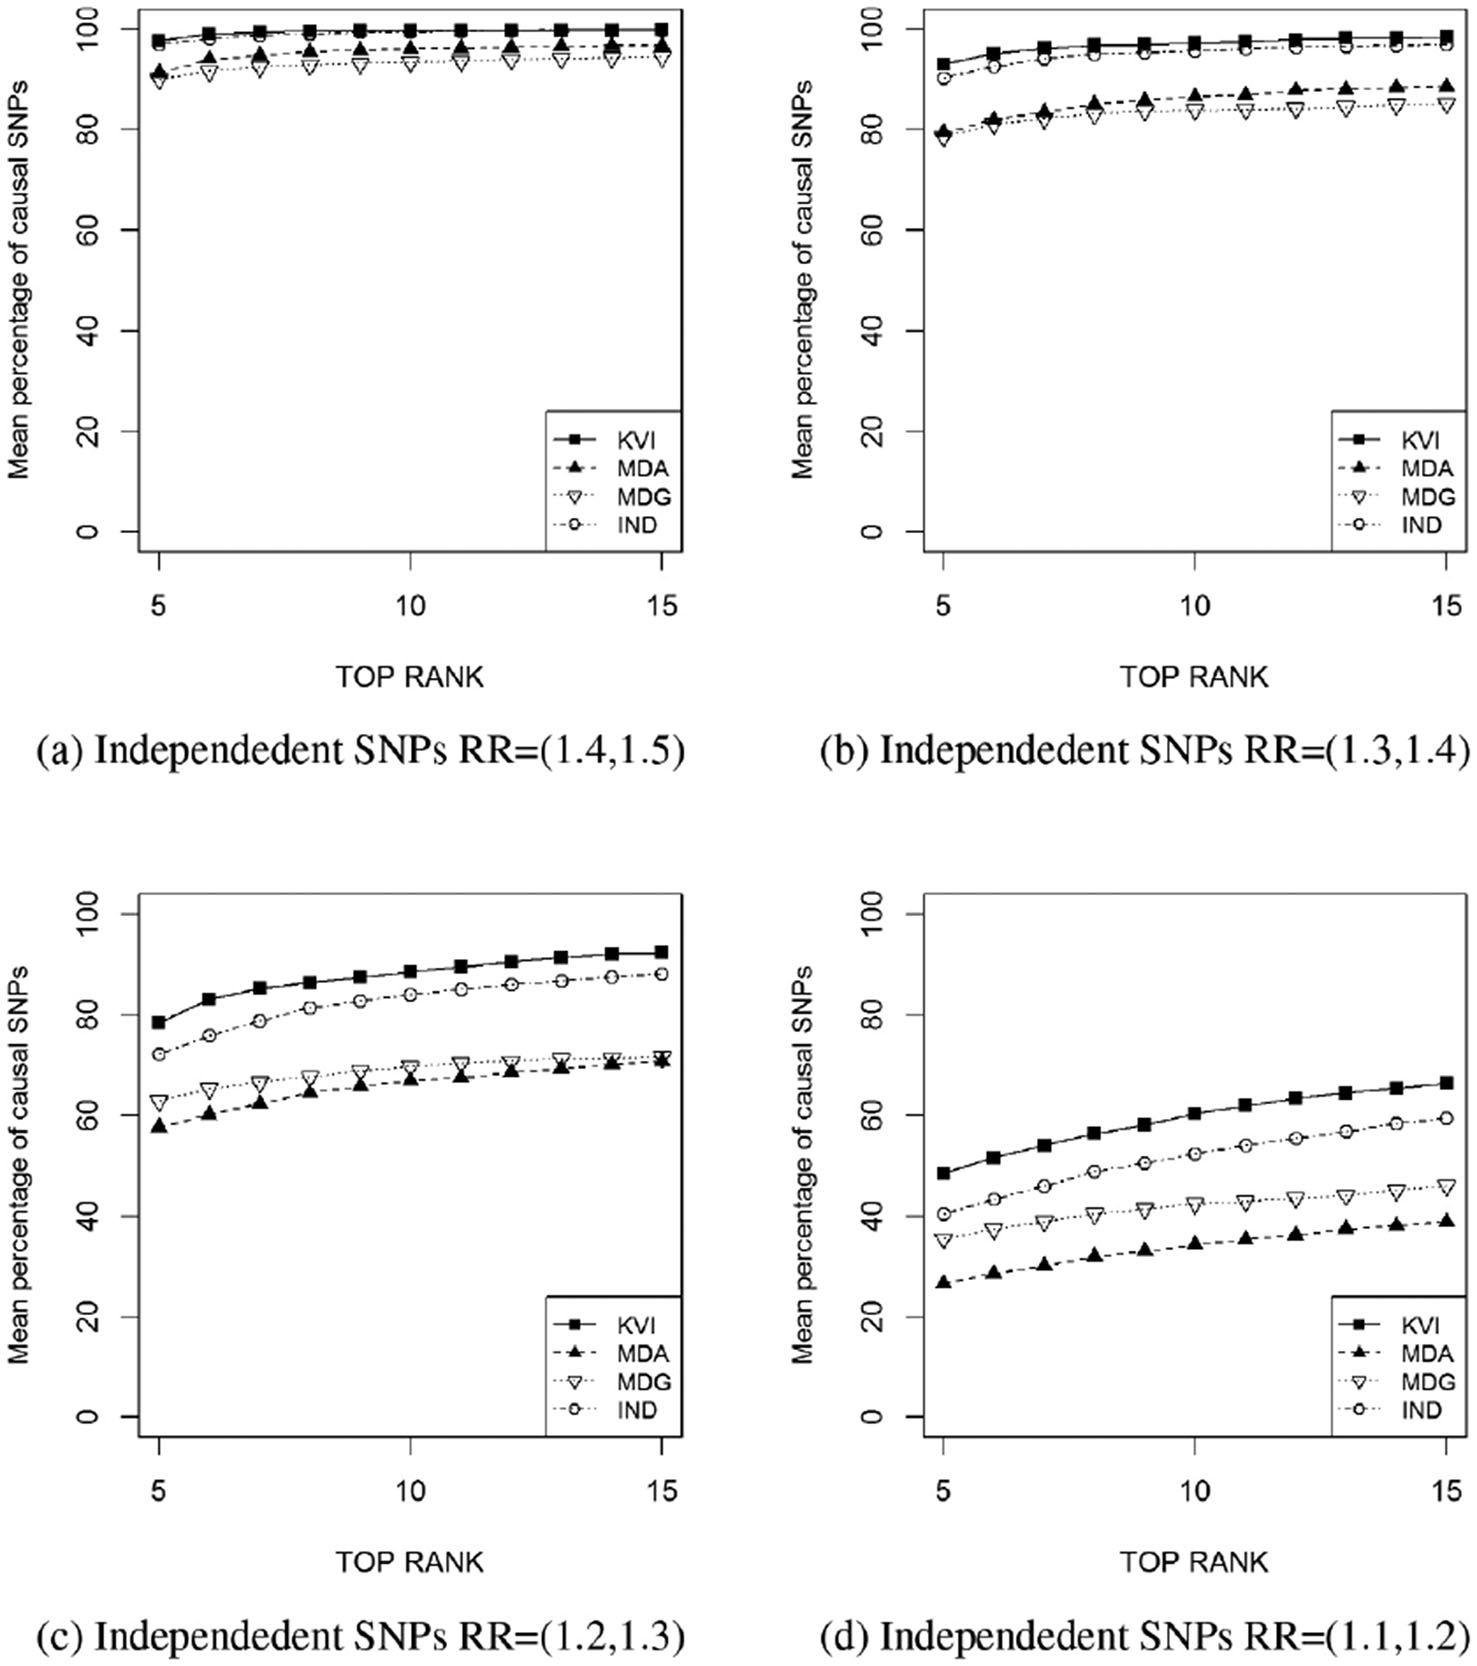
Mean percentage of causal SNPs ranked at the top
Mean number and percentage (in parenthesis) of causal SNPs ranked in the top 5 positions of the rankings for the independent SNPs scenario.
| RR = (1.5, 1.4) | RR = (1.4, 1.3) | RR = (1.3, 1.2) | RR = (1.1, 1.2) | |
|---|---|---|---|---|
| KVI | 4.88 (97.7) | 4.65 (93.0) | 3.92 (78.4) | 2.42 (48.5) |
| MDA | 4.56 (91.3) | 3,97 (79.4) | 2.88 (57.6) | 1.33 (26.6) |
| MDG | 4.5 (90.0) | 3,93 (78.6) | 3.14 (62.9) | 1.77 (35.4) |
| IND | 4.84 (96.8) | 4,51 (90.2) | 3.60 (72.1) | 2.01 (40.3) |
We observe that in all scenarios KVI captures higher percentages of causal variants at the top of the ranking list than the other approaches. The power of the four methods for ranking correctly the causal SNPs decreases as does their marginal effects. Random Forest rankings, both MDA and MDG, performs systematically worse than KVI and rankings based on marginal
We performed an additional simulation study with 2000 individuals and 5000 independent SNPs, among which, the first 5 are causal, with the goal of exploring the performance of the method when the number of subjects is smaller than the number of SNPs. As it was expected, the power of the methods for detecting the causal SNPs was affected by the amount of noise (proportion of non-causal SNPs), the sample size and the relative risk of the causal SNPs. In comparison to the results with 200 SNPs, in the new scenario with 5000 SNPs all methods suffered from a reduction of power due to an increase of noise. However, the relative performance of the 4 methods considered is similar in both scenarios: the proposed KVI ranking has the best performance, followed by the ranking based on the individual p-value and finally, the RF rankings. Increasing the number of SNPs affects the computational time of all methods. However, KVI is not very affected by this because it relies on the Kernel matrix that has the dimension of the number of individuals. It is feasible from a computational point of view to use KVI method in a genome-wide study.
Ranking stability is an important issue for the reliability of any ranking procedure. We explored the stability of the four ranking methods by comparing the ranking of the variables with the whole dataset with the rankings of 100 Jackknife samples. For each Jackknife sample, a 5% of the observations were randomly selected and removed from the dataset. Figure 4 provides a scatter plot of the original rankings (x-axis) and the 100 Jackknife rankings (y-axis). KVI rankings and those based on marginal p-values are clearly much more stable than the RF rankings based on MDA and MDG.
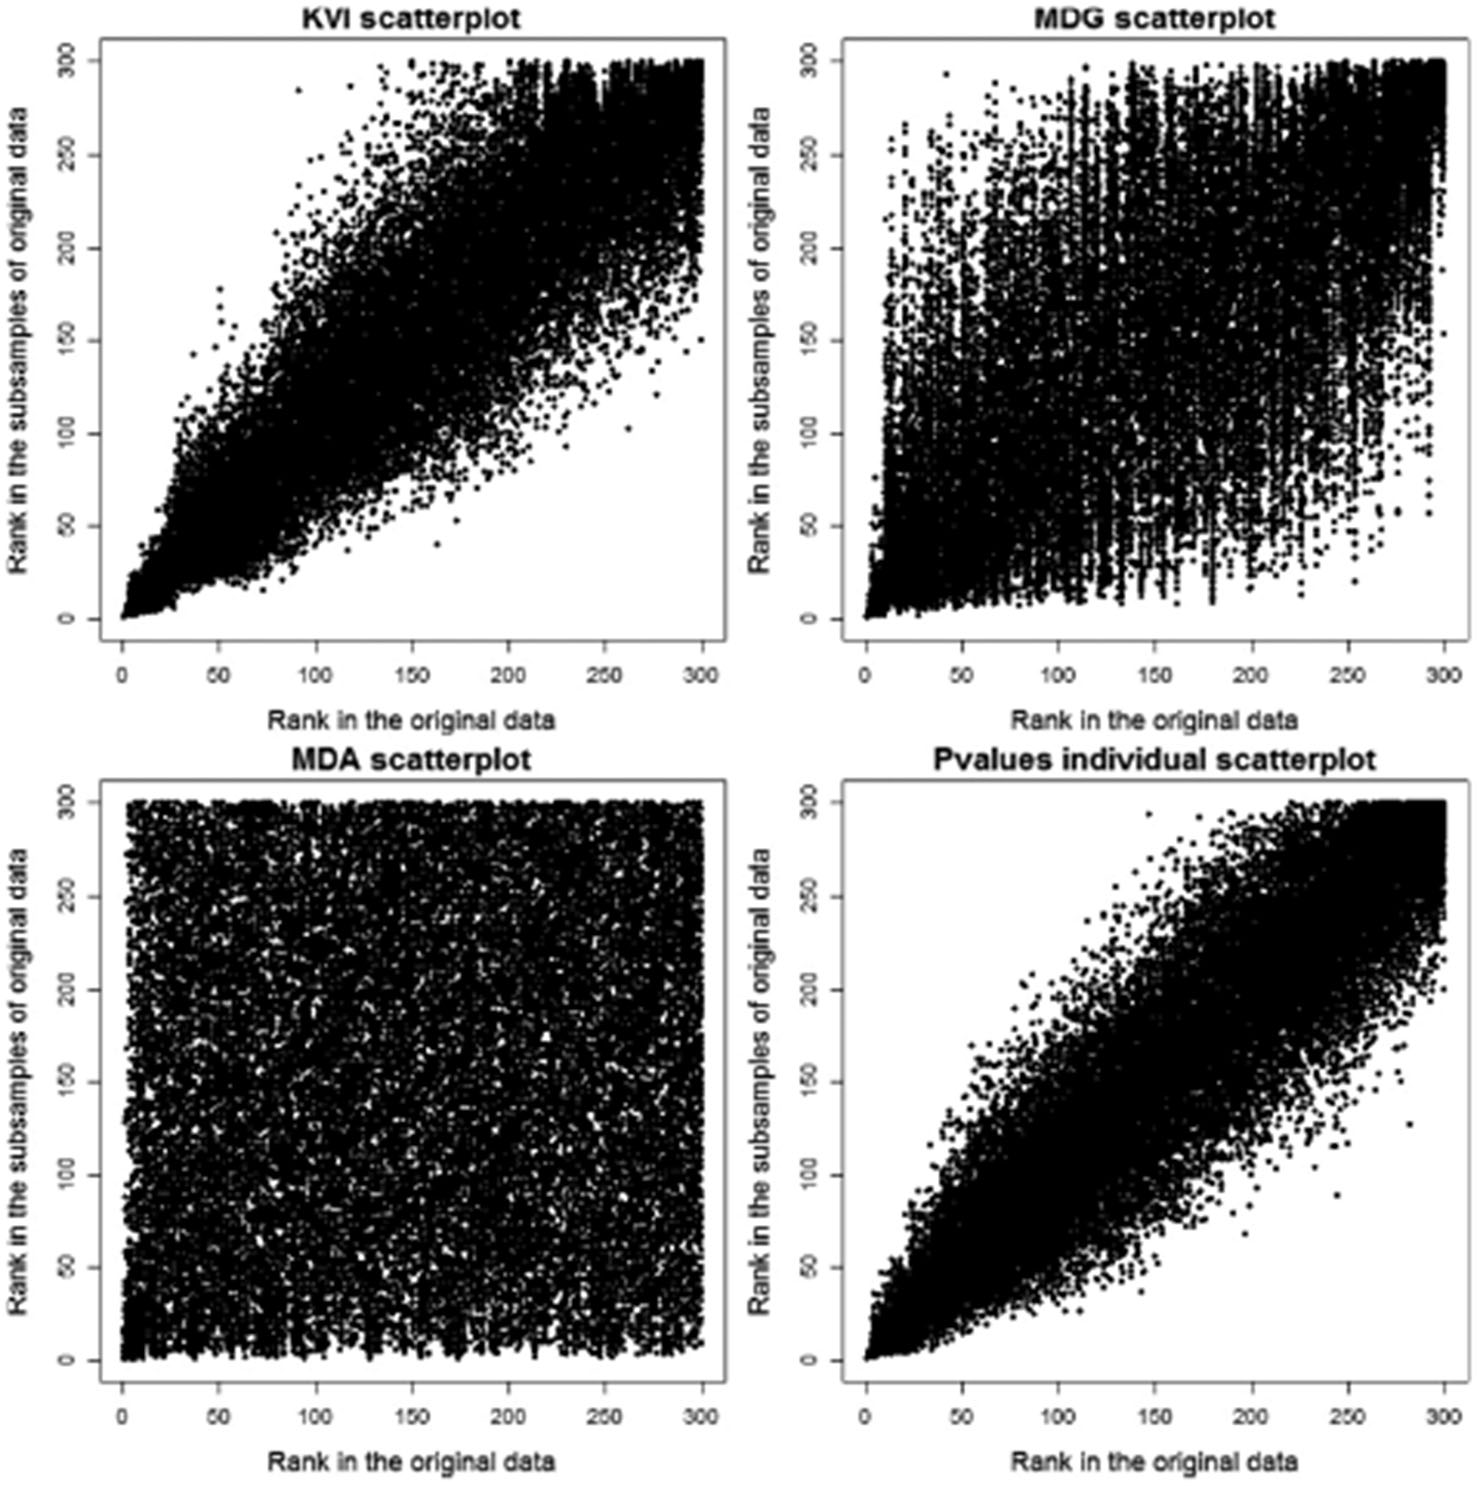
Rank in the original dataset against rank in the Jackknife datasets (5% left out).
4.2 Ranking of a set of correlated SNPs
In the previous section we assumed that the different SNPs were independent but a more realistic situation in real applications is that the different markers are correlated due to Linkage Disequilibrium. In this section we compare the performance of KVI, MDA, MDG and the marginal
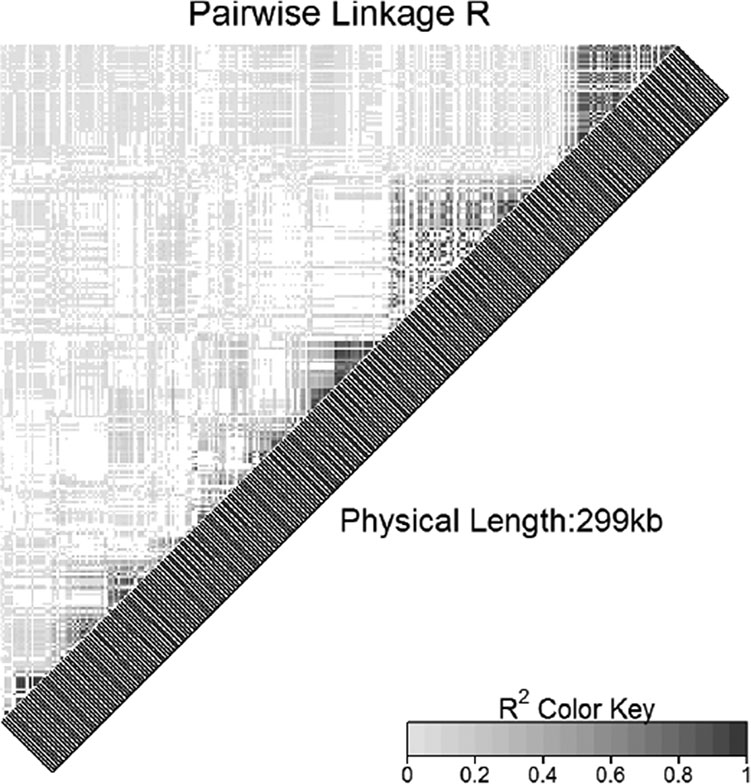
Linkage disequilibrium plot of the set of
Similarly than Figure 3, Figure 6 provides the mean percentage of causal SNPs among the top
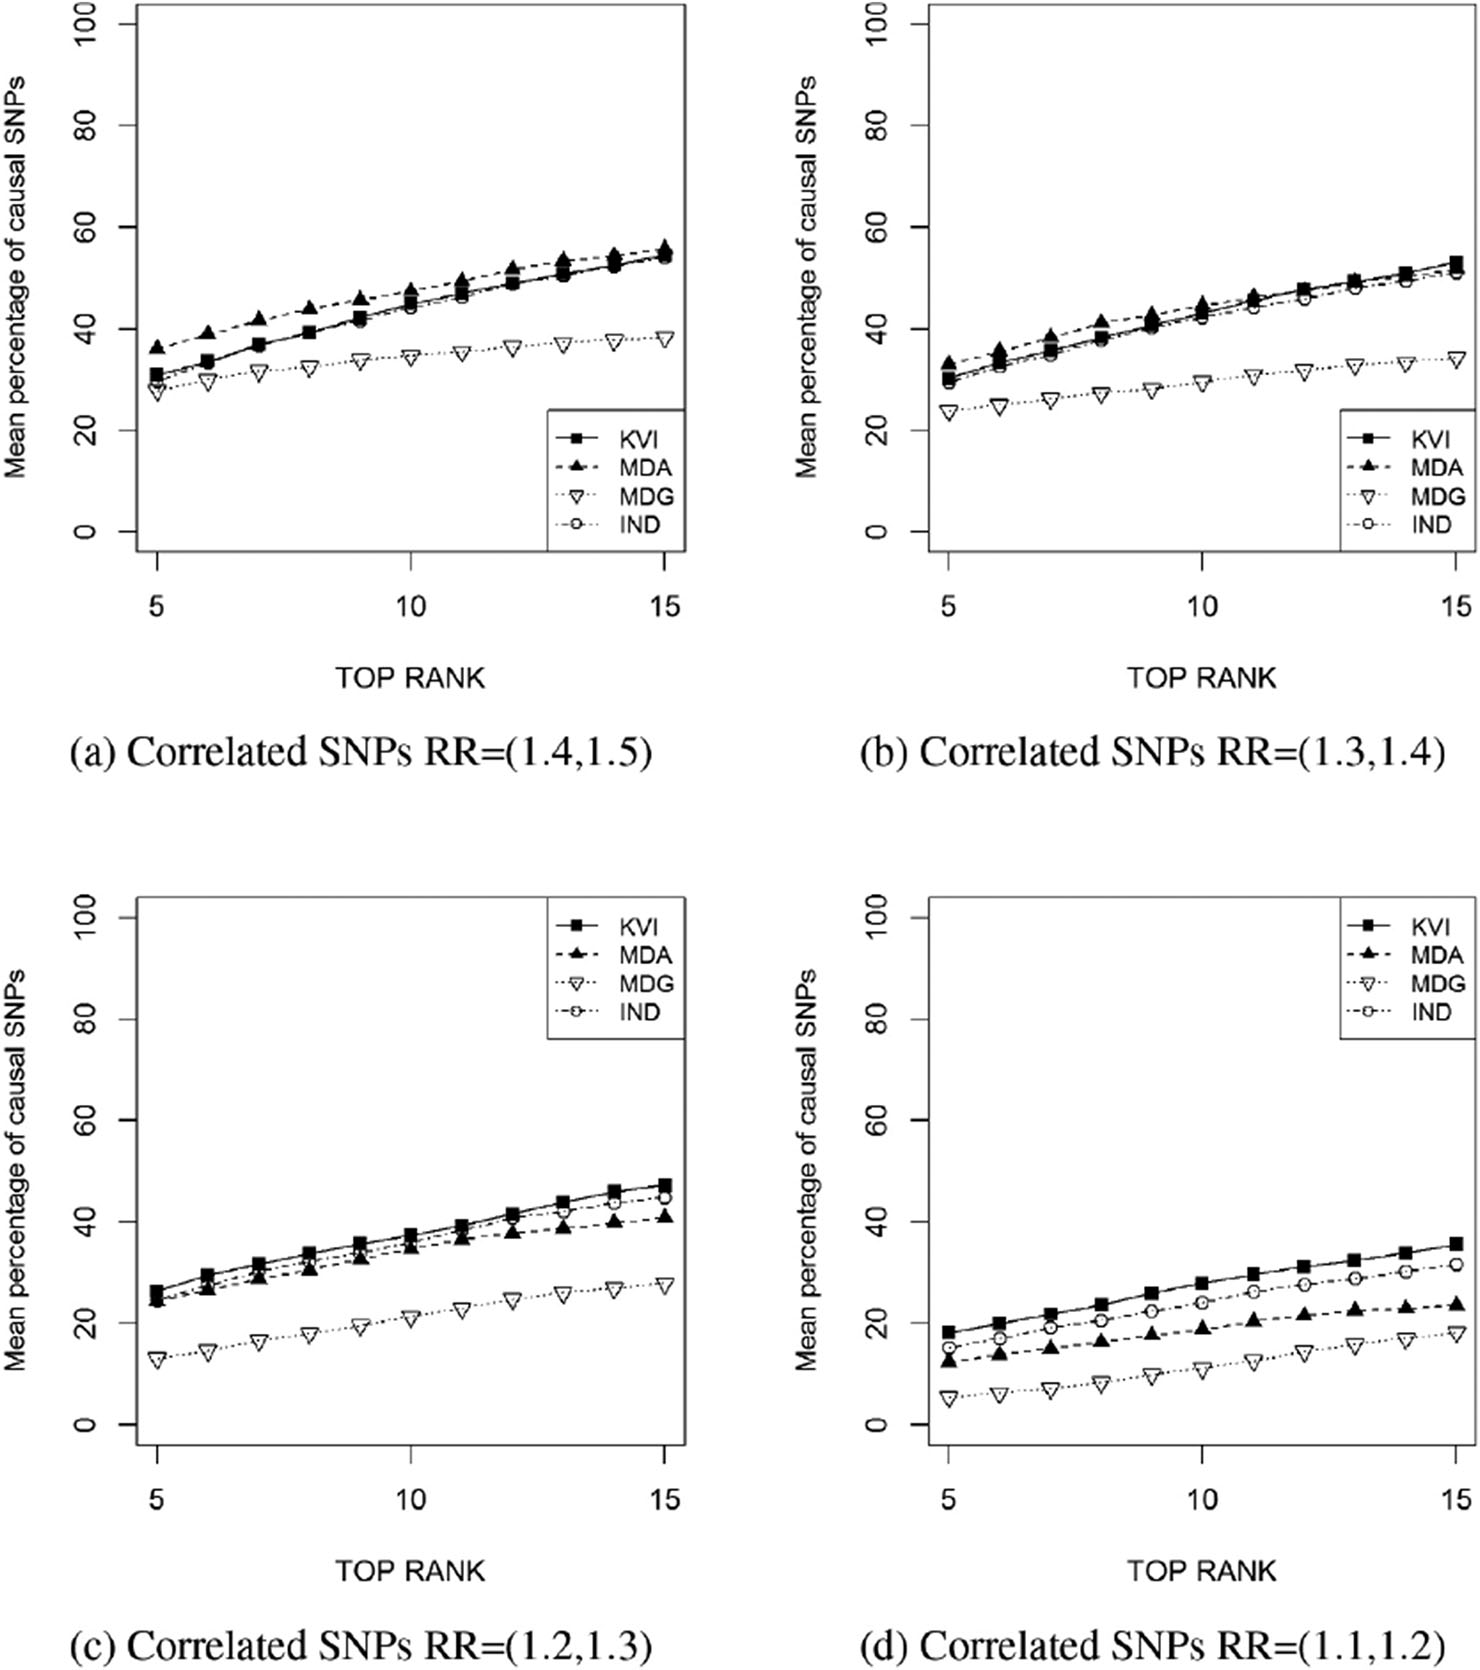
Mean percentage of causal SNPs ranked at the top
Mean number and percentage (in parenthesis) of causal SNPs ranked in the top 5 positions of the rankings for the correlated SNPs scenario.
| RR = (1.5, 1.4) | RR = (1.4, 1.3) | RR = (1.3, 1.2) | RR = (1.1, 1.2) | |
|---|---|---|---|---|
| KVI | 1.50 (31.0) | 1.51 (30.3) | 1.32 (26.4) | 0.91 (18.2) |
| MDA | 1.80 (36.0) | 1.65 (33.0) | 1.22 (24.4) | 0.62 (12.4) |
| MDG | 1.40 (27.9) | 1.19 (23.8) | 0.65 (13.1) | 0.27 (5.4) |
| IND | 1.48 (29.7) | 1.47 (29.4) | 1.23 (24.6) | 0.76 (15.2) |
Thus, in order to improve the detection of causal variants in scenarios with highly correlated SNPs, we propose to measure the importance of blocks of correlated SNPs instead of single SNPs. In this case, KVI measure will provide a ranking of blocks of SNPs and the goal is that causal blocks, that is, those blocks that contain a causal SNP, are in the top of the ranking. We compare the KVI measure at the block level with the minimum marginal
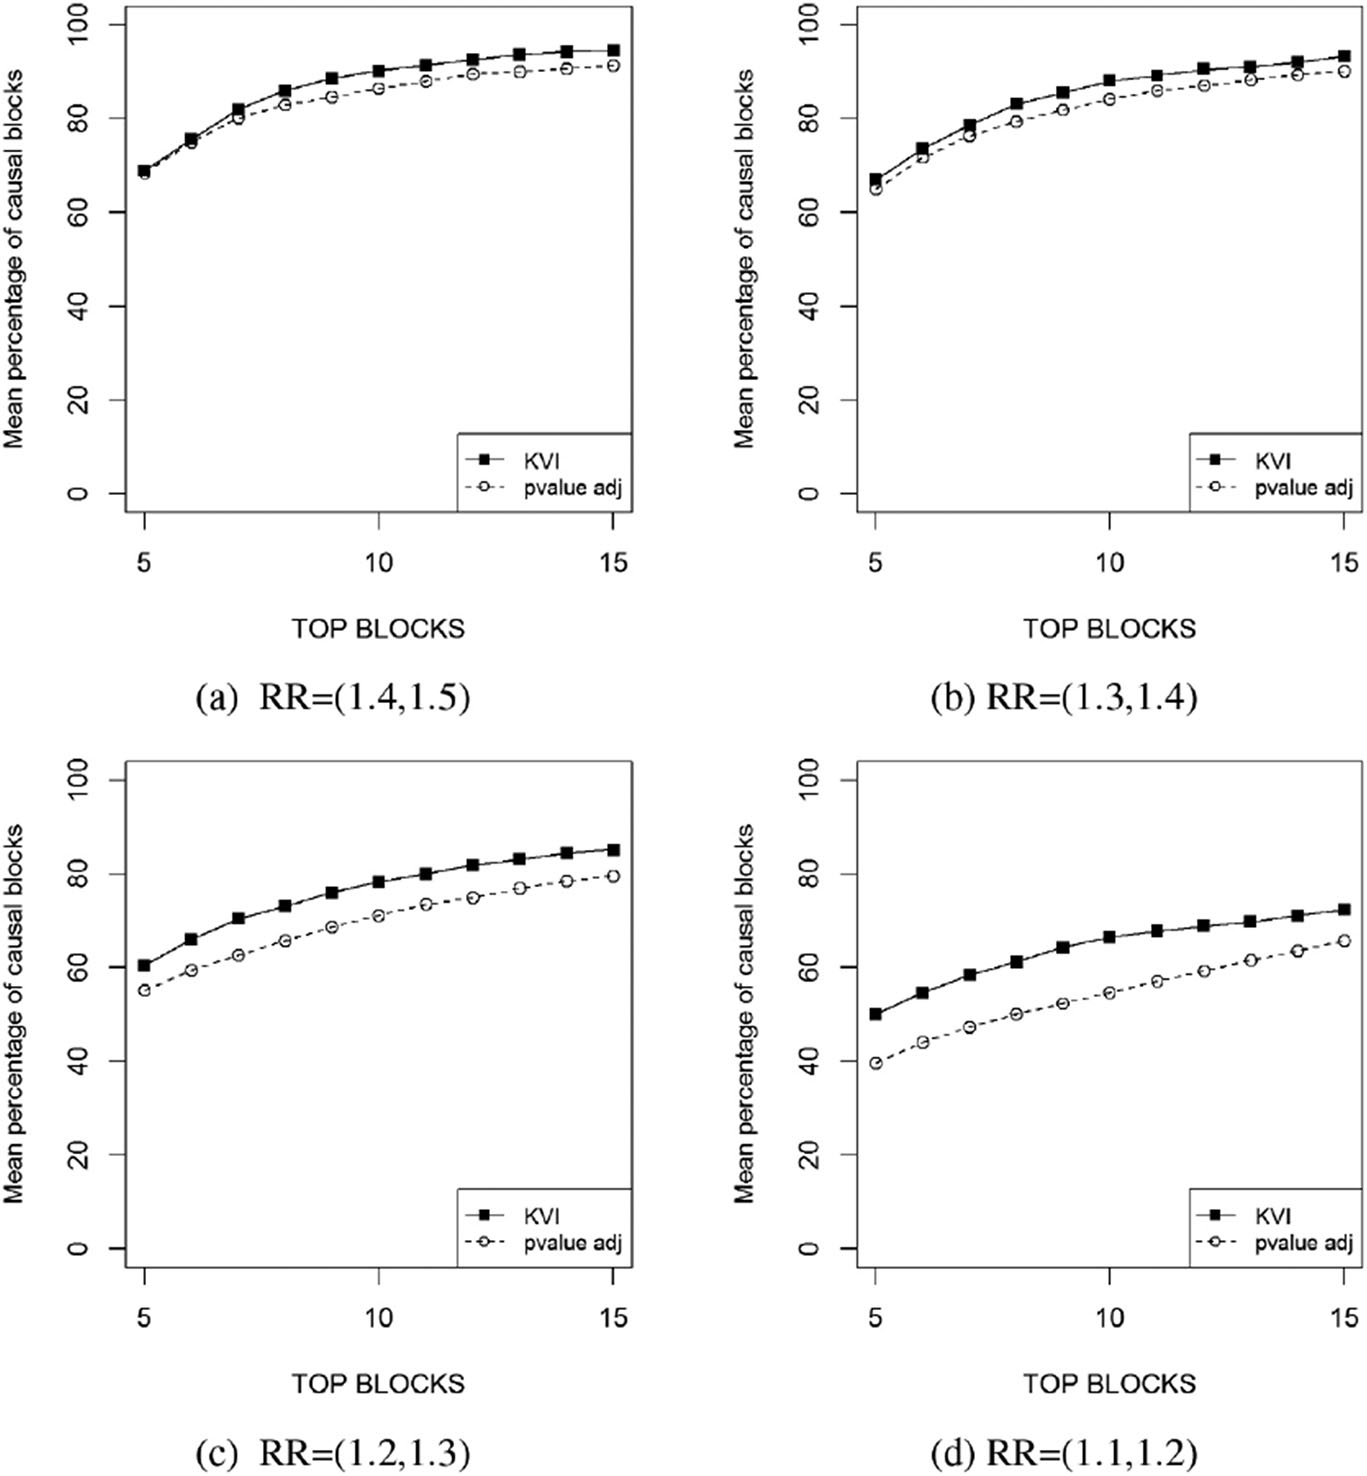
Mean percentage of blocks of SNPs containing a causal SNP ranked at the top
4.3 KVI for detecting epistasis
For the analysis of epistasis we considered the simulated data sets available at http://discovery.dartmouth.edu/epistatic\_data/ http://discovery. dartmouth.edu/epistatic\_data/ that have been used for evaluating the performance of several methods for exploring gene-gene interactions [3, 43, 44]. Each data set contains 1,000 variables, the first 2 being functional through an epistatic effect but without a marginal main effect and the remainder 998 variables being randomly generated. Different scenarios were simulated but we only show the results for a sample size of 1,600 (800 cases and 800 controls), disease prevalence
Following [32], we consider the interaction Kernel matrix
Figure 8 provides the power of detecting the functional second-order interaction that we define as the percentage of times that the two causal SNPs are ranked on the first two positions. We compare the power of the measures of importance KVI, MDA and MDG. Since the epistatic effect was simulated to have no marginal effect, the power of the rankings based on the marginal
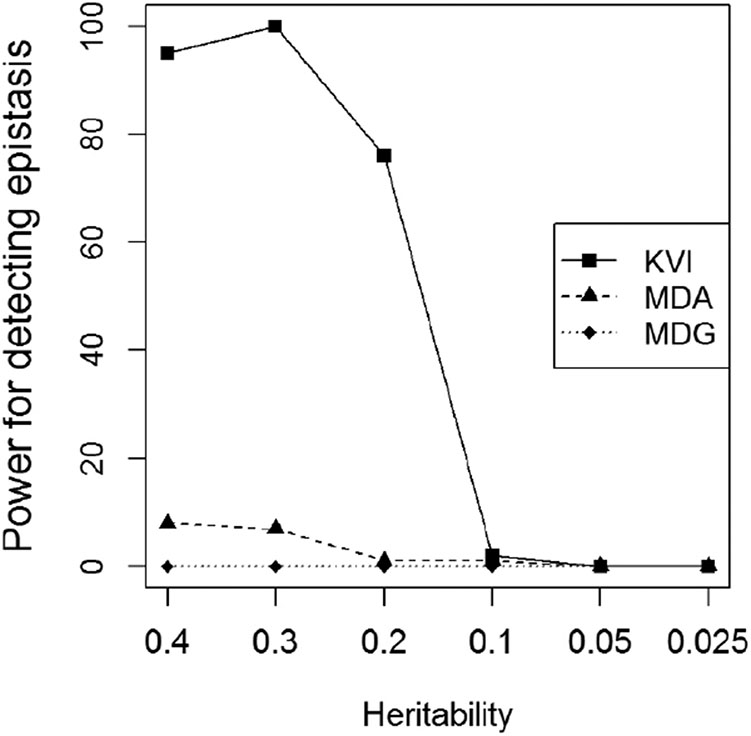
Power for detecting second-order interactions as a function of heritability using rankings based on KVI, MDA and MDG.
5 Conclusions
The Kernel methodology provides a powerful approach to study nonlinear joint effects of a set of genetic variants on the risk of disease. In this context we propose a measure of importance for individual genetic markers, or for groups of them, that measures their contribution to the joint genetic effect. KVI can be used for ranking genetic variants individually, groups of variants that are in linkage disequilibrium, or sets of variants linked by a specific biological condition, for instance, variants that are in the same gene or pathway. KVI can also be useful as a posthoc analysis for interpreting the results of a multivariate nonparametric analysis such as the Kernel machine regression [19, 20]. Kernel machine regression provides a global test of association of a set of variables with a phenotype and KVI could help to identify those genetic markers that have the largest contribution to the observed joint genetic effect. An important advantage of KVI is that it captures both main and epistatic effects. Though computationally intensive, it is feasible to use KVI in genome wide studies using a two-stage procedure similar to the one proposed in [4].
We checked the performance of KVI rankings under different situations such as independent SNPs, correlated SNPs and epistasis, giving very interesting results in extreme scenarios with low relative risks and high level of noise.
For independent SNPs, the results proved that the proposed Kernel measure of importance (KVI) outperforms other ranking measures such as mean decrease accuracy (MDA) and mean decrease Gini (MDG) provided by the Random Forest and rankings based on the individual
The primary goal of the simulation study with correlated SNPs was to emphasize the poor performance of any ranking method, including KVI, in presence of correlation among predictors, which is a very common situation in real GWAS analysis. Variable importance bias induced by correlation among predictors has been extensively discussed in the context of RF importance measures. Predictors that are highly correlated with some of the other predictors tend to receive smaller importance measures than uncorrelated predictors [6, 15]. Some alternatives have been proposed to handle this issue [8, 12] though, in our opinion, none is completely satisfactory because correlated predictors are essentially indistinguishable. In this context, a specific strategy for handling correlated predictors is required. We support the use of a multi-marker approach that measures the importance of sets of correlated variables (LD blocks, genes) instead of individual variables. KVI can be measured on single variables but also on groups of variables and this gives KVI an additional advantage over RF importance measures MDA and MDG.
Thus, KVI provides a variable importance measure that can be used at a multi-marker level for ranking sets of correlated predictors providing, in some cases, more meaningful and reliable results than rankings of individual predictors. The advantage of the multi-marker strategy is also supported by the fact that GWAS are indirect association studies and SNPs are only markers of genomic regions. A multi-marker analysis that measures the association of all the SNPs in this genomic region is expected to be more powerful than the individual analysis of each marker separately. We illustrate the use of such a multi-marker approach with an Alzheimer study. KVI provides a ranking of the genes in the Reelin pathway and allows identifying three genes, LRP2, APP and Cdk5, which genetic variability is associated with Alzheimer status. We do think that providing association results at the gene level in GWAS can be sometimes more meaningful or informative than providing lists of SNPs that are very unlikely to be real causal genetic variants.
We also proved through simulations that KVI is very powerful for capturing epistasis provided that the heritability of the epistatic effect is moderately large. The advantage of KVI over RF measures in this setting is remarkable.
The proposed KVI measure can also be used for weighting or filtering SNPs in order to increase the signal-to-noise and to improve the power of Kernel machine regression. Our future research plans include the implementation of such improvements and the extension of the KVI measure by using an alternative distance to the Euclidean distance induced by the Kernel function in the Hilbert space.
We think the proposed Kernel measure of importance KVI and future modifications will contribute to the identification of new genetic markers and genes associated with complex diseases.
Acknowledgements
This work was partially supported by grants MTM2012-38067-C02-02 and MTM2015-64465-C2-1-R from the Ministerio de Economía e Innovación (Spain).
References
1. Wray NR, Goddard ME, Visscher PM. Prediction of individual genetic risk of complex disease. Current Opinion in Genetics & Development 2008;18:257–263.10.1016/j.gde.2008.07.006Search in Google Scholar PubMed
2. Breiman L. Random forests. Machine Learning 2001;45:5–32.10.1023/A:1010933404324Search in Google Scholar
3. Calle ML, Urrea V, Boulesteix A-L, Malats N. Auc-rf: A new strategy for genomic profiling with random forest. Human Heredity 2011;72:121–132.10.1159/000330778Search in Google Scholar PubMed
4. Nguyen T-T, Huang JZ, Wu Q, Nguyen TT, Li MJ. Genome-wide association data classification and snps selection using two-stage quality-based random forests. BMC Genomics 2015;16:S5.10.1186/1471-2164-16-S2-S5Search in Google Scholar PubMed PubMed Central
5. Calle ML, Urrea V. Letter to the editor: stability of random forest importance measures. Briefings in Bioinformatics 2011;12:86–89.10.1093/bib/bbq011Search in Google Scholar PubMed
6. Nicodemus KK, Malley JD, Strobl C, Ziegler A. The behaviour of random forest permutation-based variable importance measures under predictor correlation. BMC Bioinformatics 2010;11:110.10.1186/1471-2105-11-110Search in Google Scholar PubMed PubMed Central
7. Boulesteix A-L, Bender A, Bermejo JL, Strobl C. Random forest gini importance favours snps with large minor allele frequency: impact, sources and recommendations. Briefings in Bioinformatics 2012a;13:292–304.10.1093/bib/bbr053Search in Google Scholar PubMed
8. Meng YA, Yu Y, Cupples LA, Farrer LA, Lunetta KL. Performance of random forest when SNPs are in linkage disequilibrium. BMC Bioinformatics 2009;10:78.10.1186/1471-2105-10-78Search in Google Scholar PubMed PubMed Central
9. Walters R, Laurin C, Lubke GH. An integrated approach to reduce the impact of minor allele frequency and linkage disequilibrium on variable importance measures for genome-wide data. Bioinformatics 2012;28:2615–2623.10.1093/bioinformatics/bts483Search in Google Scholar PubMed PubMed Central
10. Gregorutti B, Michel B, Saint-Pierre P. Correlation and variable importance in random forests. Statistics and Computing 2017;27(3):659–678.10.1007/s11222-016-9646-1Search in Google Scholar
11. Hothorn T, Hornik K, Zeileis A. Unbiased recursive partitioning: A conditional inference framework. Journal of Computational and Graphical statistics 2006;15:651–674.10.1198/106186006X133933Search in Google Scholar
12. Strobl C, Boulesteix A-L, Kneib T, Augustin T, Zeileis A. Conditional variable importance for random forests. BMC Bioinformatics 2008;9:307.10.1186/1471-2105-9-307Search in Google Scholar PubMed PubMed Central
13. Schwarz DF, König IR, Ziegler A. On safari to random jungle: a fast implementation of random forests for high-dimensional data. Bioinformatics 2010;26:1752–1758.10.1093/bioinformatics/btq257Search in Google Scholar PubMed PubMed Central
14. Chen X, Ishwaran H. Random forests for genomic data analysis. Genomics 2012;99:323–329.10.1016/j.ygeno.2012.04.003Search in Google Scholar PubMed PubMed Central
15. Boulesteix A-L, Janitza S, Kruppa J, König IR. Overview of random forest methodology and practical guidance with emphasis on computational biology and bioinformatics. Wiley Interdisciplinary Reviews: Data Mining and Knowledge Discovery (2012b);2:493–507.10.1002/widm.1072Search in Google Scholar
16. Schaid DJ. Genomic similarity and kernel methods I: advancements by building on mathematical and statistical foundations, Human Heredity 2010a;70:109–131.10.1159/000312641Search in Google Scholar PubMed PubMed Central
17. Schaid DJ. Genomic similarity and kernel methods II: methods for genomic information. Human Heredity 2010b;70:132–140.10.1159/000312643Search in Google Scholar PubMed PubMed Central
18. Guyon I, Bitter H-M, Ahmed Z, Brown M, Heller J. Multivariate non-linear feature selection with kernel methods. In: Nikravesh, Masoud and Zadeh, Lotfi A. and Kacprzyk, Janusz editors. Soft computing for information processing and analysis. Springer: Springer Berlin Heidelberg, 2005:313–326.10.1007/3-540-32365-1_12Search in Google Scholar
19. Liu D, Ghosh D, Lin X. Estimation and testing for the effect of a genetic pathway on a disease outcome using logistic kernel machine regression via logistic mixed models. BMC Bioinformatics 2008;9:292.10.1186/1471-2105-9-292Search in Google Scholar PubMed PubMed Central
20. Wu MC, Kraft P, Epstein MP, Taylor DM, Chanock SJ, Hunter DJ, Lin X. Powerful snp-set analysis for case-control genome-wide association studies. The American Journal of Human Genetics 2010;86:929–942.10.1016/j.ajhg.2010.05.002Search in Google Scholar PubMed PubMed Central
21. Mittag F, Büchel F, Saad M, Jahn A, Schulte C, Bochdanovits Z, Simón-Sánchez J, Nalls MA, Keller M, Hernandez DG, et al. Use of support vector machines for disease risk prediction in genome-wide association studies: Concerns and opportunities. Human Mutation 2012;33:1708–1718.10.1002/humu.22161Search in Google Scholar PubMed PubMed Central
22. Ionita-Laza I, Lee S, Makarov V, Buxbaum JD, Lin X. Sequence kernel association tests for the combined effect of rare and common variants. The American Journal of Human Genetics 2013;92:841–853.10.1016/j.ajhg.2013.04.015Search in Google Scholar PubMed PubMed Central
23. Chen J, Chen W, Zhao N, Wu MC, Schaid DJ. Small sample kernel association tests for human genetic and microbiome association studies. Genetic Epidemiology 2016;40:5–19.10.1002/gepi.21934Search in Google Scholar PubMed PubMed Central
24. Yang H-C, Hsieh H-Y, Fann CS. Kernel-based association test. Genetics 2008;179:1057–1068.10.1534/genetics.107.084616Search in Google Scholar PubMed PubMed Central
25. Wu MC, Maity A, Lee S, Simmons EM, Harmon QE, Lin X, Engel SM, Molldrem JJ, Armistead PM. Kernel machine snp-set testing under multiple candidate kernels Genetic epidemiology 2013;37:267–275.10.1002/gepi.21715Search in Google Scholar PubMed PubMed Central
26. Paul J, D’Ambrosio R, Dupont P. Kernel methods for heterogeneous feature selection. Neurocomputing 2015;169:187–195.10.1016/j.neucom.2014.12.098Search in Google Scholar
27. Mieth B, Kloft M, Rodríguez JA, Sonnenburg S, Vobruba R, Morcillo-Suárez C, Farré X, Marigorta UM, Fehr E, Dickhaus T, et al. Combining multiple hypothesis testing with machine learning increases the statistical power of genome-wide association studies. Scientific Reports 2016;6. doi: 10.1038/srep36671.Search in Google Scholar PubMed PubMed Central
28. Roshan U, Chikkagoudar S, Wei Z, Wang K, Hakonarson H. Ranking causal variants and associated regions in genome-wide association studies by the support vector machine and random forest. Nucleic Acids Research 2011;39:e62.10.1093/nar/gkr064Search in Google Scholar PubMed PubMed Central
29. Shawe-Taylor J, Cristianini N. Kernel methods for pattern analysis. Cambridge University Press, 2004.10.1017/CBO9780511809682Search in Google Scholar
30. Pan W. Relationship between genomic distance-based regression and kernel machine regression for multi-marker association testing. Genetic Epidemiology 2011;35:211–216.10.1002/gepi.20567Search in Google Scholar PubMed PubMed Central
31. Wessel J, Schork NJ. Generalized genomic distance–based regression methodology for multilocus association analysis. The American Journal of Human Genetics 2006;79:792–806.10.1086/508346Search in Google Scholar PubMed PubMed Central
32. Larson NB, Schaid DJ. A kernel regression approach to gene-gene interaction detection for case-control studies. Genetic Epidemiology 2013;37:695–703.10.1002/gepi.21749Search in Google Scholar PubMed PubMed Central
33. Kolarova M, García-Sierra F, Bartos A, Ricny J, Ripova D. Structure and pathology of tau protein in alzheimer disease. International Journal of Alzheimer’s Disease 2012;2012: Article ID 731526. doi: 10.1155/2012/731526.Search in Google Scholar PubMed PubMed Central
34. Rice DS, Curran T. Role of the reelin signaling pathway in central nervous system development. Annual Review of Neuroscience 2001;24:1005–1039.10.1146/annurev.neuro.24.1.1005Search in Google Scholar PubMed
35. Seshadri S, Drachman DA, Lippa CF. Apolipoprotein E ε4 allele and the lifetime risk of alzheimer’s disease: What physicians know, and what they should know. Archives of Neurology 1995;52:1074–1079.10.1001/archneur.1995.00540350068018Search in Google Scholar PubMed
36. Reiman EM, Webster JA, Myers AJ, Hardy J, Dunckley T, Zismann VL, Joshipura KD, Pearson JV, Hu-Lince D, Huentelman MJ, et al. GAB2 alleles modify alzheimer’s risk in APOE epsilon4 carriers. Neuron 2007;54:713–720.10.1016/j.neuron.2007.05.022Search in Google Scholar PubMed PubMed Central
37. Marzolo M-P, Farfán P. New insights into the roles of megalin /LRP2 and the regulation of its functional expression. Biological Research 2011;44:89–105.10.4067/S0716-97602011000100012Search in Google Scholar PubMed
38. O’Brien RJ, Wong PC. Amyloid precursor protein processing and alzheimer’s disease. Annual Review of Neuroscience 2011;34:185.10.1146/annurev-neuro-061010-113613Search in Google Scholar PubMed PubMed Central
39. Vázquez-Higuera JL, Mateo I, Sánchez-Juan P, Rodríguez-Rodríguez E, Infante J, Berciano J, Combarros O. No association of CDK5 genetic variants with alzheimer’s disease risk. BMC Medical Genetics 2009;10:1.10.1186/1471-2350-10-68Search in Google Scholar PubMed PubMed Central
40. Liaw A, Wiener M. randomForest: Breiman and Cutler’s Random Forests for Classification and Regression 2015, http://CRAN.R-project.org/package=randomForest, r package version 4.6-12.Search in Google Scholar
41. Wray NR, Goddard ME. Multi-locus models of genetic risk of disease. Genome Medicine 2010;2:1.10.1186/gm131Search in Google Scholar PubMed PubMed Central
42. Su Z, Marchini J, Donnelly P. Hapgen2: simulation of multiple disease snps. Bioinformatics 2011;27:2304–2305.10.1093/bioinformatics/btr341Search in Google Scholar PubMed PubMed Central
43. Moore JH, Gilbert JC, Tsai C-T, Chiang F-T, Holden T, Barney N, White BC. A flexible computational framework for detecting, characterizing, and interpreting statistical patterns of epistasis in genetic studies of human disease susceptibility. Journal of Theoretical Biology 2006;241:252–261.10.1016/j.jtbi.2005.11.036Search in Google Scholar PubMed
44. Wan X, Yang C, Yang Q, Xue H, Fan X, Tang NL, Boost: Yu W. A fast approach to detecting gene-gene interactions in genome-wide case-control studies. The American Journal of Human Genetics 2010;87:325–340.10.1016/j.ajhg.2010.07.021Search in Google Scholar PubMed PubMed Central
© 2017 Walter de Gruyter GmbH, Berlin/Boston
Articles in the same Issue
- Estimation and Inference for the Mediation Proportion
- Adaptation of Chain Event Graphs for use with Case-Control Studies in Epidemiology
- Modelling Mixed Types of Outcomes in Additive Genetic Models
- A Comparison of Methods for Estimating the Determinant of High-Dimensional Covariance Matrix
- Generalized Confidence Intervals for Intra- and Inter-subject Coefficients of Variation in Linear Mixed-effects Models
- Kernel-Based Measure of Variable Importance for Genetic Association Studies
- A Generally Efficient Targeted Minimum Loss Based Estimator based on the Highly Adaptive Lasso