Design and implement a mobile-based system to teach traffic signs to illiterate people
-
Zainab Hameed Alfayez
Zainab Hameed Alfayez was awarded MSC degree in Computer Science (Advance Computer Science) with a distinction from Swansea University, in 2015, UK and B.Sc. in Computer science from University of Basrah. She currently works as an instructor at the Computer Science & Information Technology college, University of Basrah, Iraq. Her research interests are focused on Human Computer Interaction, Mobile Human Computer Interaction, and Software Engineering.


Abstract
Nowadays, most information and communication technologies target literate users and neglect the 800 million illiterate individuals around the world. Although there have been several attempts to develop systems that help illiterate people and try to reduce the digital gap between them and those who are literate, it is still challenging to find accessible systems for illiterate people. This research aims to reduce the digital gap between illiterate and literate people in Iraq through developing a mobile application for learning traffic signs. Firstly, a requirement elicitation study was conducted to explore a set of design considerations and build an accessible interface for illiterate people. The study resulted in several design principles, such as using voice instructions, focusing on graphic content, and using the local language. Then, the mobile application was developed based on these design principles. Finally, an evaluation study was conducted to measure the usability of the developed application. The results revealed that the built application is efficient and effective, and the users were extremely satisfied in several aspects, such as easy usage and learnability, and declared that they would use it in the future and recommend it to others.
1 Introduction
Approximately 800 million individuals around the world are unable to read or write in their native language. Most of them are found in developing countries, especially in rural areas [1]. Some of these areas are suffering from infrastructural shortages, like electricity, water supplies, and so on. However, there have been huge improvements in technology in these areas, and most of the mobile providers are trying to attract customers there. The statistics have shown that the usage of smart mobile phones is about 43% with a significant percentage from developing countries [2]. This proves that smart phones play a big role in people’s lives. People who use smart phones use a variety of applications in addition to making phone calls and sending text messages. For example, smart phones are now frequently used to bring the information to their users. They have made a revolutionary change in helping people to obtain essential information through mobile-based applications. This has enhanced the way people communicate with society and the world [2]. However, most of the mobile-based applications use texts in their user interface [3]. Written text is a form of knowledge encoding which necessitates decoding for comprehension, and thus, it requires the decoder to be literate. As a result, most of the information and communication technologies, including mobile applications, target literate users while neglecting the world’s 800 million illiterate population.
Several researchers noticed this problem and tried to develop various systems to help illiterate people and improve their quality of life. For example [4], presented a web-based system to support learning for rural farmers, while [5] devised a visual phonebook, and finally [3], developed a website to help illiterate people in Pakistan in searching for a job. However, it is still challenging to find access solutions to the information and communication systems, especially for illiterate people [3]. Therefore, this research highlights this issue and presents an IT solution to help illiterate drivers in Iraq to access information and learn traffic signs through by using smart phones.
Having a driving license is essential for drivers, since it is the legal document which proves that a person is allowed to drive vehicles on the public roads. Before getting their driving license, the driver must pass a special test that is related to knowing traffic signs. Usually, passing this test is difficult especially for illiterate drivers, because they do not have access to traditional learning facilities like the traffic signs manual, as it requires reading the meaning of each sign. Moreover, the existing IT-based solutions like websites use only texts in the user interface which makes them accessible only for literates.
This paper aims to reduce the digital gap between literates and illiterates through building a mobile based application that helps illiterate drivers to learn traffic signs without needing to read or write. The app relies on voice instructions and is based mainly on graphical content (icons) that is designed especially for illiterate people. The app also provides a special test that simulates the real test taken by drivers before they can get their license. The test contains a number of random questions and multiple-choice answers, which enable the users to test their knowledge about the traffic signs.
2 Related work
Several studies have attempted to give solutions to illiterate people and reduce the digital gap between them and literates. Most of these studies have focused on the user interface design and interaction process to provide digital services for illiterates in different areas around the world. For example [3], conducted a study to provide access to information and digital services for illiterate people in Pakistan. The authors developed a website that helps illiterate people in the country to apply for an appropriate job without any human assistance. The design was based on the features of background audio and graphical content that are culturally relevant to Pakistani users. With the same purpose, a more recent study was conducted by [6] to digitize the job search for illiterate and semi-illiterate people in Bangladesh. Firstly, the authors conducted a requirement elicitation study to explore the considerations that should be taken before designing a mobile application that targets illiterates and semi-literates. The study came up with several recommendations, such as using the native language and relying more on voice, symbols, pictures and less on text in the user interfaces. Then, based on these recommendations, the authors developed an effective mobile application for searching employment in Bangladesh.
Similarly, in another study done by [2], the authors also developed a mobile app to support job seeking for illiterate people in Bangladesh. The app was mainly based on voices, symbols, intuitive icons, and touch-based interaction to explain the process of applying for a job. The Bengali language was used throughout the app interface and the voices.
Authors in [7] proposed a solution for the illiterate and semi-illiterate population in Pakistan using e-mail. The authors suggested a mobile application that contained several pages. Each of these pages reflected a step for building the profile of the illiterate user. The application interface was simple, rich in icons, and free of text.
In addition [8], presented a mobile health application to help illiterate and semi-illiterate pregnant women in Uganda. The app provides several functions, like an appointments reminder and making calls to health practitioners. The study suggested solutions for data input that could be utilized for illiterate people; for example, the login process is executed by entering depicted icons and a pictorial password. The app also relies on multimedia (video and audio) to display information about maternal health content and about reminders. Videos were used also by [9] as a solution for illiterate Moroccan people. The authors designed a useable E-government portal which served and was accessible by both illiterate and literate Moroccan populations. Table 1 illustrates the previous studies that have targeted illiterate or semi-illiterate people.
Previous studies for illiterate or semi-illiterate people.
| Research | Application type | Environment | Design considerations |
|---|---|---|---|
| [3] | Web app | Pakistan | Background audio, graphical content culturally relevant to the Pakistani users |
| [9] | Web app | Morocco | Video, audio, icons |
| [6] | Mobile app | Bangladesh | Native language, voice, symbols, pictures, less text |
| [2] | Mobile app | Bangladesh | Voices, symbols, intuitive icons, touch-based interaction, Bengali language |
| [8] | Mobile app | Uganda | Multimedia (video and audio), icon and pictorial for input |
| [7] | Mobile app | Pakistan | Icons, free of text |
| [1] | Mobile app | Illiterates in general | Audio, icons |
From all of the abovementioned studies, the author concluded that designing for an illiterate population must consider several factors, such as reducing or eliminating the usage of texts and utilizing vocal audios instead, all sounds must be in the local language, the focus should be on graphical content, conventional icons should be used, and finally, using videos could be helpful. However, it obvious that none of the previous studies had tried to give illiterates the necessary knowledge or to teach them through technologies. Therefore, this research attempts to fill the gap in the previous studies by developing a mobile application that targets illiterate people and tries to teach them using modern technologies like smart phones. Another critical issue is that there was only one study conducted in an Arabic environment [9]. However, this study gave the design considerations for building an accessible website interface for illiterates. Therefore, when developing mobile applications, it is important to understand the illiterate Arabic users and explore which design considerations are important to them.
3 Methodology
This study was conducted following the six steps of Design Science Research (DSR) suggested by [10] and used in [6, 11]. These steps are as follows: I- problem identification, II- objectives for the solution, III- design and development, IV- demonstration, V- evaluation, and VI- communication.
The first step aims to define the research specific problem and explain the solution. The illiterate people in Iraq do not have access to traditional facilities for learning traffic signs like the traffic signs manual, as it uses text for guiding and learning. Moreover, the existing ICT solutions, like some websites, rely solely on text in the user interface, which makes them inaccessible to illiterate people. As a result, the facilities for learning traffic signs in Iraq mainly target educated drivers and neglect illiterates. Therefore, an ICT (Information Communication Technology) solution for illiterate and probably semi-illiterate drivers is needed to help them learn the traffic signs without the need for reading texts.
The second step of DSR is to identify the objective of the solution. The goals of this research were to determine the design considerations for the illiterate population and to then build a mobile application that helps illiterate people in Iraq to learn traffic signs without assistance from others. There were some previous studies that suggested design considerations for illiterate people as it was mentioned in Section 2 of this study. However, these studies did not conduct in the Arabic culture and environment except one study by [9]. Although this study was carried out in Morocco (Arabic country), it was conducted on a web based application. Therefore, in this study we aim to identify the design consideration for illiterate people in Arabic culture and for mobile apps.
In order to define the design considerations for illiterate people and collect the user requirements, the author conducted a qualitative study with 25 participants. The results from interviewing these participants showed that using mobile applications for learning signs is preferable compared to using other tools. However, the participants were looking for an easy interface and interactive application. The requirement elicitation step resulted in several design considerations, which were used later in the application design and development.
The next step was to design and develop the application. The feedback received from interviewees in the previous stage was used to determine the application’s functionalities and the look of its screens. The following step was demonstration, where the developed app was used by several scholars, who gave their feedback on it. Then, the next step was the evaluation step where 25 illiterate people used the app and expressed their opinion about it. The data were collected and analyzed to measure the usability of the application. The final step was communication, where the study findings are reported. Figure 1 illustrates the steps of the research methodology used in this study.

Steps of research methodology.
3.1 Qualitative study
The main objectives of conducting the qualitative study were to specify the user requirements and find out the design considerations for developing a traffic sign learning application for the illiterate population in Iraq. Previous studies proved that involving users at the beginning of the design and development process enables the developers to acquire useful information for building useable mobile apps [12, 13]. Therefore, a qualitative study was conducted which included interviewing 25 illiterate people from Iraq.
3.1.1 Selection of participants
The study began with the selection of participants who satisfied the criteria required to meet the study’s objectives. A total of 25 illiterate participants were recruited to give their perspectives of and preferences about the app. There were 15 males and 10 females aged between 25 and 57 (average 39). None of them could read or write in their mother tongue (Arabic). All of them had little experience with smart phone usage and its features, namely, phone calls and voice messages. However, five of them had a basic knowledge of some traffic signs.
3.1.2 Place and instruments
The study was conducted in Al-Basrah city, Iraq. The participants were interviewed in different places of the city that offered a suitable environment, such as being quiet. The participants were interviewed separately over a period of one week with an average of four interviews per day. During each interview session, an audio recording device was used to record the participants’ answers and save them for the analysis stage.
3.1.3 Procedure
The study process started by preparing some documents, like the participants’ ethical rights, the questionnaire, and the interview questions, which were selected to obtain detailed answers from the study participants. The interview was scheduled to have thirty open-ended questions. The questions were divided into two groups: first, personal questions about the participants themselves, such as age, education, and experience with smart phones, and second, questions about their preferences in terms of the application design.
The practical steps of the study started with welcoming the participants, then reading and explaining their ethical rights to them. Once the interviewee had agreed to participate, the interview session started by reading out the first group of questions (the personal ones). Next, the second group of questions, which were related to the application for learning traffic signs, were asked. Mostly, the participants were asked about the application interface, whether they were interested in learning traffic signs, if they would be willing to learn through a mobile app, and so on. Some of the additional questions were derived during the interview sessions to clarify the themes and gain more information. At the end, the interviewees were asked whether they had any additional ideas that had not been covered in the session.
3.1.4 The results
The audio recorded files from the interviews were transcribed and converted into text. For transcribing, the phonetic method was followed where each word was transcribed [14]. This process produced several textual files. The next step was to analyze these texts and code them using interpretive phenomenological analysis (IPA). The text was read several times, as each read through might produce new insights. During each reading, the researcher highlighted the most important and interesting texts. These highlighted texts were separated into smaller notes and then categorized into themes and sub-themes. Finally, the researcher identified three themes, which are summarized in Table 2 and explained below:
Themes and examples of quotes from requirement elicitation study.
| Theme | Sub theme | Examples of participants’ quote |
|---|---|---|
| The needs for | Independence | – “Being able to learn by myself is a wonderful thing.” |
| mobile app | – “I will be proud if I learn these signs without someone helping.” | |
| Available anywhere | – “I could access the app and learn at any time.” | |
| and anytime | – “The app is always available at any time I want.” | |
| Making more use | – “I could benefit more from my phone rather than only making calls.” | |
| of smart phones | ||
| Difficulties | Not much experience | – “I could not read or write; I am worried about using |
| with smart phones | advanced technology like smart phones.” | |
| – “I have a phone for only making calls What is mobile app?!” | ||
| Design consideration | Voice guide | – “Definitely, using voices all over the app would be helpful.” |
| – “I could use the app if it includes voice in every step.” | ||
| Symbols | – “I am familiar with some icons like speaker for hearing; however, | |
| I would prefer using the same symbol all over the app.” | ||
| Formal Arabic | – “Yes, I can understand formal Arabic language, but I do not know about others.” | |
| – “I am ok with formal Arabic” | ||
| No text entry | – “I cannot read or write, so I would definitely prefer | |
| not to type anything, even well-known symbols.” | ||
| Free or less texts | – “If the app had texts, I would not be able to read it; however, using texts might | |
| be helpful for literates so that they could use the app as well.” |
3.1.4.1 The need for mobile app
Most of the participants, around (73%) expressed an interest in using a mobile app for learning traffic signs. They highlighted that this kind of application would make them feel independent and enable them to learn without the need for assistance from others, in contrast to the traffic signs manual, which meant they had to have someone who could read the text below each sign to know the meaning of it. The participants also mentioned that this kind of app gives them the freedom to learn anywhere and at any time, as they would have access to the app whenever they wanted. In addition, several participants said learning through their mobile phone is an opportunity to use their phone for more varied purposes rather than just for calls. Therefore, the study shows that building a mobile app that has the necessary characteristics to serve illiterate people will be beneficial for the users in several ways.
3.1.4.2 Difficulties of using a mobile app
Although most of participants expressed an interest in using a mobile app for learning traffic signs, they had concerns about using digital tools. Many participants (around 61%) were surprised about the extra functions that smart phones could provide. They had no idea about mobile apps and how they could benefit from them. Some of them mentioned that even with phone calls and voice messages, sometimes they need help from others. Therefore, they were worried and thought they would not be able to deal with a smart phone and use its apps.
3.1.4.3 Design considerations
One of the main aims of this study is to point out the design considerations for developing mobile applications for illiterate people in Iraq. The study reported five aspects that should be considered to create an intuitive user interface for this community. These aspects are voice guide, symbols, formal local language (Arabic), no text entry, and no or minimal text. Interviewees preferred having a voice guide for all the application’s pages, so they could know how to use the application and what to do on each page. However, when the participants were asked if they preferred this voice to be in the informal local language (slang Arabic) to make it clearer and more understandable for them, they all said they did not mind using formal Arabic and would have no problems with it. In terms of using symbols like the speaker icon in the proposed applications, some participants (around 52%) confirmed that they were familiar with some conversion icons and said they could identify their function. They also suggested that the same symbol be used for every application page, as it would be easier for them to memorize.
In addition, most of the participants (around 90%) welcomed the idea of having a test in the app, so they could practice for the real test and test their knowledge about what they have learned. However, they preferred not to do any typing or entering even one symbol, for example, entering the symbol of the correct option. Finally, some participants (45%) suggested eliminating texts in the app and depending only on graphic content. The other participants did not mind having texts along with pictures and sounds in the app. They justified that by saying that the inclusion of both meant the app would be beneficial for both illiterates and literates.
To sum up, the collecting requirements phase of the study revealed that the illiterates were attracted to using smart phones for more functions rather than simply making calls. They also had a strong interest in using mobile applications for learning traffic signs independently. However, they showed some concerns about using the technology involved. Therefore, they raised several suggestions about the application design, such as voice guide, symbols, formal local language, no text entry, and little or no text. Table 2 presents the most important themes that were highlighted during the requirement elicitation study.
4 Application design and development
4.1 Application design
Based on the design considerations mentioned by participants in the requirement elicitation study, the author designed and built a mobile application for learning traffic signs based on serving illiterate people in Iraq. The goal was to design an application that was primarily based on graphical visual content and sounds with no text entry. Moreover, the app should be simple for users, so they will not need human assistance [15, 16]. Therefore, the app was developed with a simple visual interface and background audio that supports the users’ local language (Arabic). The main objective of the learning traffic signs application for illiterate drivers is to deliver the information about each sign using only sounds. The user can hear the sound by clicking on the “speaker” symbol. The same symbol is used on every page of the app. Then, the user can take a test that includes 20 random questions. The app uses sounds to read the questions and the answers options for users; the user can choose the right option by clicking on it and thus avoid any text entry. After answering each question, the app informs its users with their scores by speaking the score out loud. Figure 2 illustrates the design framework of the application.
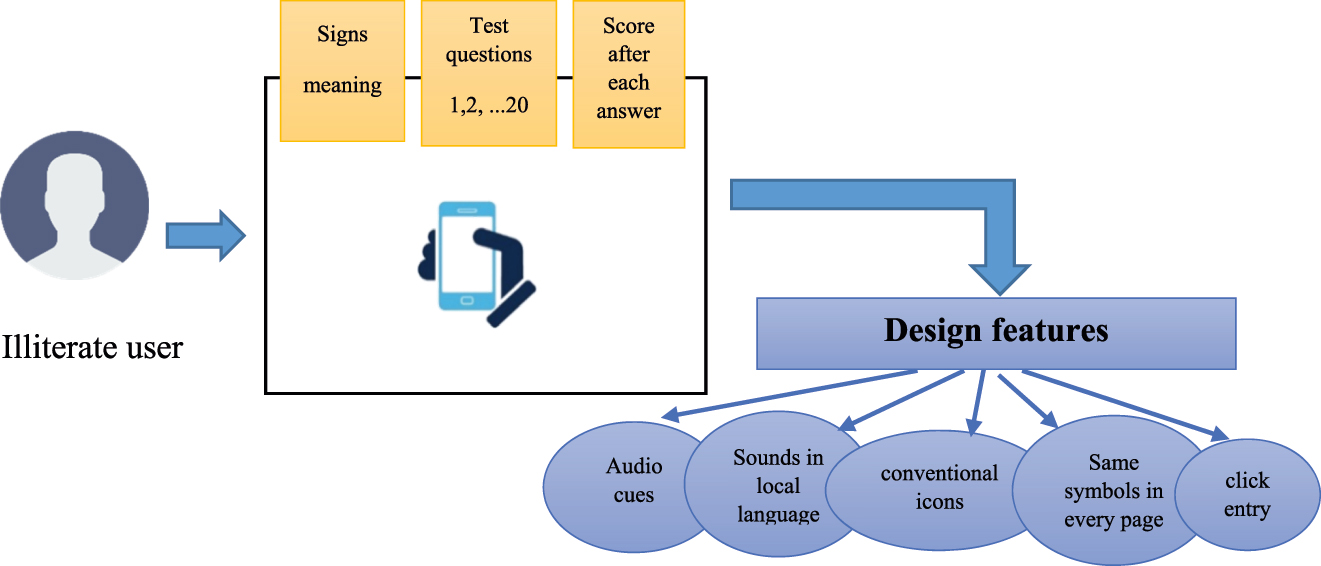
Learn traffic signs application framework.
4.2 Application development
Flutter, a cross-platform tool kit, was used to develop the app because it is an easy, high performance framework, and it supports both Android and IOS operating systems which makes the app available for a bigger number of users [17]. Flutter is based on Dart programming language, which has a large repository of software packages [18].
When the user launches the application, they will hear vocal instructions on how to use the app. Then, they can choose from “Learn”, to learn what each sign refers to, or “Test” to answer several questions about the signs. Users can identify which button is “Learn” or “Test” by clicking the “speaker” icon that is beside each one. In case of choosing the “Learn” button, a new screen that contains the sign groups will be displayed. In order to identify which sign group it is, the user should click on the “speaker” icon so they can select the one they would like to know more about. After the sign group has been selected, the app will launch another screen, which contains various signs that each driver must know in order to get their driving license. When the user has learned all the signs, they can take a test to make sure they have learned them and see if they are ready to take the real test or not. In this case, the user should click on the “Test” button and start answering the questions. Figure 3 demonstrates the activities flow of the application.

Flow chart of the application.
4.3 Application implementation
Figure 4 depicts a few screens from the proposed application. As is shown, the entire application is developed with voices and graphical indications. The voice-guide is in the local language (Arabic) and is present on every page of the application interface. This will assist the users in understanding what to do in the current situation. The user is able to hear the explanation of each sign’s meaning by clicking the “speaker” icon, which is located on the right side of each sign. Obviously, the same symbol in the same location is used across the app in order to make it easier for users to memorize how to use the app. Additionally, the app provides its users with a test where the user can answer several questions by clicking on the correct option without the need to enter any text. Once the user has finished the test, the score is displayed on the screen with a background sound which tells the score. When the user passes the test (answers more than half the questions correctly), a green symbol appears to confirm that the user has passed. On the other hand, if the user has not passed the test and answers fewer than 10 questions, a red symbol is shown with “Try again” as a background voice message.

Screen shoots from learn traffic signs application.
5 Application evaluation
The step after developing and testing the application was the application evaluation. A laboratory study was conducted with a number of illiterates to obtain feedback on the developed app.
5.1 Participant demographic
The evaluation study was conducted with 25 participants, who were recruited from different areas from Albasrah city in Iraq. Of the participants, 15 were from the initial study (requirement elicitation study) and 10 were new participants; 12 were female, and 13 were male. Their age ranged from 18 to 57 years with an average of 38 years. None of the participants could read or write even in their native language (Arabic). In terms of using phones, all the participants had used normal phones for calls, and 17 had used a smart phone for sending and receiving voice messages through a calling app like WhatsApp or Viber. However, none of them had any experience with any mobile app for learning or testing. In addition, only five of the participants had any knowledge about traffic signs.
5.2 Study process
The evaluation session started with the interviewer welcoming the participant then reading them their ethical rights whereby they were informed of the goal of the experiment, and told that they could withdraw at any point of the experiment, and that they should feel free to give an honest assessment about the app. After collecting the participant profile information, such as age and experience with a smart phone, they were given the app, and they started using it. Meanwhile, the author was calculating and registering the time spent by each participant to complete each of the following tasks:
Task1: Pick any three signs and try to know the meaning of each of them.
Task2: Do the test and answer any three of the given questions.
Task3: Identify your score.
Moreover, the author was also taking notes in order to address any difficulties that the user might face while they were trying to complete the given tasks. At the end, the interviewees were asked several questions related to user satisfaction, such as ease of usage, learnability, and intent of using the app in the future. The answers were measured according to a Likert Scale on a range of 1 (strongly disagree) to 5 (strongly agree).
5.3 Results
The data derived from the evaluation sessions were analyzed to measure the application usability in terms of three parameters: efficiency, effectiveness, and satisfaction [19, 20]. Table 3 summarize the results of evaluation sessions.
Summary of the evaluation results.
| Evaluation criteria | Type of data | Task | Average | SD |
|---|---|---|---|---|
| Efficiency | Time to complete a task | Task1 | 30.2 | ±2.5 |
| Task2 | 52.04 | ±3.16 | ||
| Task3 | 5.48 | ±1.04 | ||
| Times the participant listened to the voice instructions | Task1 | 1.36 | ±0.63 | |
| Task2 | 1.48 | ±0.7 | ||
| Task3 | 1.04 | ±0.2 | ||
| Times the participant asked for help | Task1 | 0.08 | ±0.276 | |
| Task2 | 0.12 | ±0.331 | ||
| Task3 | 0 | ±0 | ||
| Effectiveness | Number of taps required to perform a task | Task1 | 3.5 | ±0.714 |
| Task2 | 6.16 | ±0.8 | ||
| Task3 | 1.76 | ±0.59 | ||
| User satisfaction | User satisfaction with the application | – | 4.4 | ±0.7 |
| Easiness of the app | – | 3.92 | ±0.8 | |
| Using this application to learn traffic signs | – | 4.52 | ±0.7 | |
| Recommend this app to others | – | 4.8 | ±0.4 |
5.3.1 Efficiency
According to [21], efficiency refers to when no time is wasted. In this study, three metrics were considered to measure the application efficiency: the time spent to complete a single task, the number of times the participant listened to the voice instructions, and how many times the participant asked for help. Figure 5 demonstrates the results of the three efficiency metrics.
The time to complete a task

The results of three metrics used to measure the application efficiency.
The interface will be considered efficient if it requires less time to complete a single task [3]. In this study, the participants took an average of 30.2, 52.04, and 5.48 s to complete Task1, Task2, and Task3 respectively. The Standard Deviation (SD) for these three tasks were ±2.5 for Task1, ±3.16 for Task2, and ±1.04 for Task3. Figure 5(a) shows the average time to complete each task with SD values. The minimum time spent to complete Task1 was 25 and the maximum was 34. For Task2, the minimum time was 45 and the maximum was 57. Finally, Task3 took a minimum of 4 s and a maximum of 7. The number of participants who took longer than the average time to complete Task1, Task2, and Task3 was 6 (24%), 8 (32%), and 5 (20%) respectively. These results revealed that around 75% of participants had completed the tasks within the average time, which confirmed that most of the participants used the application efficiently.
Number of times the participant listened to the voice instructions
The application has Arabic voice instructions about how to use the app. If the participant listened one time to these instructions, this would be an indication of an optimal user interface design. On the other hand, listening several times to the instructions would indicate that the user interface was poorly designed [6]. To do Task1, seven of the participants (28%) in our study listened to the instructions more than once. For Task2, the number of participants who repeated the instructions was 9 (36%). However, only one participant (4%) went back to the voice instructions in order to know how to identify their score (Task3). This means about two thirds of participants were able to complete the tasks after listening to the voice instructions only one time. These results indicate that the voice instructions were clear enough, understandable to the participants, and supported the application’s efficiency by guiding the participants on how to perform the tasks.
The number of times the participant asked for help
The interface is considered efficient when the participants do not ask for help from the researcher to complete the tasks [6]. Our study findings revealed that only 2 participants (8%) needed to ask the researcher for help to complete Task1, and 3 participants (12%) needed help to complete Task2, while no one needed additional help on how to do Task3. These findings indicate that the participants found the application user interface to be clear and understandable. Moreover, the voice instructions helped the participants to learn how to use the application to perform the required tasks.
5.3.2 Effectiveness
Effectiveness is defined as the accuracy and success in achieving goals [21]. The parameter considered to measure the effectiveness of the learning traffic signs application is as follows:
The number of taps required to perform a task.
The minimum number of taps needed to do Task1, Task2, and Task3 was 3, 5, and 10 respectively. In the evaluation session, the participants tapped an average of 3.5, 6.16, and 1.76 times to perform Task1, Task2, and Task3 respectively. These results show that the participants took 0.5, 1.16, 0.76 more time than the optimal value of taps which was mentioned before (3, 5, 1 for Task1, Task2, Task3 respectively). Despites some of the participants needing slightly more taps for each task, the application is still considered an effective app. The biggest number of taps difference was for Task2 with 1.11, because this task is the most complex one in comparison with Task2 and Task1. Figure 6 explains the average number of taps required to perform a task.

The results of measuring the application effectiveness.
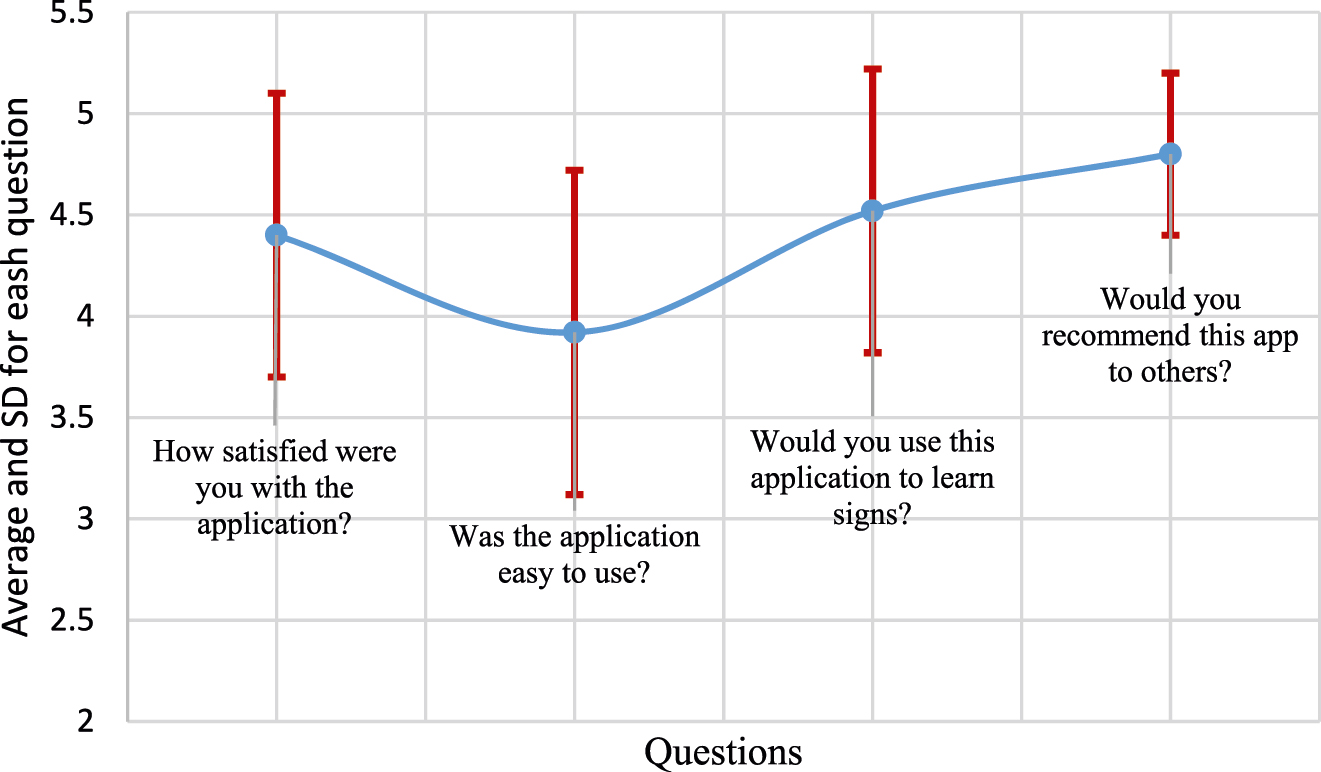
5.3.3 User satisfaction
Satisfaction was described by [22] as “the expressed attitude towards a system by the user: emotions of contentment, pleasure, delight, relief and ambivalence”. In this research, the participants were asked four questions to measure their satisfaction with the application. The first question was ‘How satisfied were you with the application?’ The answers were classified according to a Likert scale ranging from 1 ‘Not satisfied at all’ to 5 ‘Very satisfied’. The second question was ‘Was the application easy to use?’ The answers ranged from 1 ‘Not easy at all’ to 5 ‘Very easy’. The third question was ‘Would you use this application to learn signs?’ The answers ranged from 1 ‘Not willing at all’ to 5 ‘Very willing’. The fourth question was ‘Would you recommend this app to others?’ The answers ranged from one for ‘Not recommend at all’ to 5 ‘Would strongly recommend’. The hypothesis was that the users would be considered to be satisfied if their average satisfaction ratings were equal to or more than 2.5 (the Likert scale mean value for satisfactory). The study results revealed that the users were extremely satisfied with the learning traffic signs application (mean 4.4). They also found the app was easy to use (mean 3.92). Moreover, the participants showed interest in the application and had a desire to use it for learning traffic signs (mean 4.5). Finally, they would strongly recommend the app to others (mean 4.8). Figure 7 illustrates the average results of users’ satisfaction on the application.
The results of measuring users’ satisfaction on the application.
6 Discussion
In this paper, a mobile application was designed and implemented that would help the illiterate population in Iraq to learn traffic signs. The app was developed following the steps mentioned in the DSR method.
Firstly, the author conducted a requirement elicitation study to address the main design considerations that illiterates would like to add to or eliminate from the application design. The study revealed that one of the most frequent user preferences was that the app must focus totally on voices with as little text as possible. This issue was also addressed in the results of previous studies, such as [3, 9, 23]. These studies recommended mainly using audios in any application that target illiterates. However, these studies were based on web or computer applications. Therefore, this paper confirmed that using less text and depending on voices in the local language is also essential for mobile interfaces which are designed for illiterate people.
Secondly, after analyzing the data from the requirement elicitation study, the author found that focusing on graphical content is extremely important. The use of pictures, conventional or cultural symbols, and metaphors will assist illiterates to understand the user interface. The previous studies such as [3, 6], also recommended paying attention to these design principles. Thus, this study verifies these principles to develop mobile applications for illiterate people in Iraq. This research provides these principles which could be a template for designing interactive mobile applications for illiterate people even if these apps include learning and tests (questions and answers). In future, researchers could consider these principles for example, voice instruction and graphical content, when they decide to design a mobile app for the illiterate community in their countries.
On the other hand, the requirement elicitation study revealed that illiterate people expressed anxiety about using technology. As they had only little or no experience with using smart phones, they were concerned about using these devices; they thought that they would not be able to use the mobile app. The participants in the study by [6] expressed the same issue. However, after the proposed application had been developed and evaluated, most of the participants, who were all illiterates, showed an extremely competent performance doing the given tasks. They proved that based on the previously mentioned design principles (voice instructions, symbols, and local language), the developed learning traffic sign application was effective and efficient and achieved high user satisfaction. As a result, this study proves that developing mobile applications which target this group of people will increase their technological knowledge and reduce the gap between them and the people who have access to the information through modern technology.
Finally, the research has one limitation, which is the small sample size of participants who were recruited in the evaluation study. The number of participants recruited to give their feedback on the application was 25, which might be considered a small number. However, it was reported that 25–30 is an adequate number to reach data saturation in quantitative studies [24] and 12 participants in qualitative [25]. Therefore, the author thought that 25 participants were enough to address the research questions and obtain valuable results.
7 Conclusions
This paper presents a mobile application for illiterate people in Iraq to learn traffic signs. Two studies were conducted: the first, which was conducted to collect the user requirements in terms of the application design and their desire to use smart phones for learning, came up with several design recommendations for illiterate people, such as using voices throughout the application, focusing on graphic content with cultural icons, and using the local language.
The second study was conducted after the application was built in order to evaluate its usability and to obtain the users’ perspective on it. The evaluation results revealed that the developed application is efficient and effective, as the participants completed their given tasks within or less than the average time. The application had also gained user satisfaction, as they showed high interest in using it in the future. They would recommend it to others as well. These results proved that developing useable applications will motivate illiterates to use modern technologies more and will help them overcome their concerns about smart gadgets. Consequently, this will help to reduce the digital gap between literates and illiterates.
About the author

Zainab Hameed Alfayez was awarded MSC degree in Computer Science (Advance Computer Science) with a distinction from Swansea University, in 2015, UK and B.Sc. in Computer science from University of Basrah. She currently works as an instructor at the Computer Science & Information Technology college, University of Basrah, Iraq. Her research interests are focused on Human Computer Interaction, Mobile Human Computer Interaction, and Software Engineering.
-
Author contributions: All the authors have accepted responsibility for the entire content of this submitted manuscript and approved submission.
-
Research funding: None declared.
-
Conflict of interest statement: The authors declare no conflicts of interest regarding this article.
References
1. Friscira, E., Knoche, H., Huang, J. Getting in touch with text: designing a mobile phone application for illiterate users to harness SMS. In 2nd ACM Symposium on Computing for Development, 2012; pp. 1–10. https://doi.org/10.1145/2160601.2160608.Search in Google Scholar
2. Ahmed, A., Islam, M. N., Jannat, F., Sultana, Z. Towards developing a mobile application for illiterate people to reduce digital divide. In 2019 International Conference on Computer Communication and Informatics (ICCCI); Coimbatore, India, 2019; pp. 1–5. https://doi.org/10.1109/ICCCI.2019.8822036.Search in Google Scholar
3. Khan, I. A., Hussain, S. S., Shah, S. Z. A., Iqbal, T., Shafi, M. Job search website for illiterate users of Pakistan. Telematics Inf. 2017, 34, 481–489. https://doi.org/10.1016/j.tele.2016.08.015.Search in Google Scholar
4. Wirastuti, N., Luckin, R., Sheriff, R. E., Walker, K., Underwood, J. L., Dunckley, L. Development of a knowledge management system integrated with local communication channels and knowledge management initiatives for Kenyan rural farming communities. In Fifth IEEE International Conference on Wireless, Mobile, and Ubiquitous Technology in Education (wmute 2008); Beijing, China, 2008; pp. 1–5. https://doi.org/10.1109/WMUTE.2008.18.Search in Google Scholar
5. Joshi, A., Welankar, N., Bagalkot, N., Kanitkar, K., Sheikh, R. Rangoli: a visual phonebook for low-literate users. In 10th Conference on Human-Computer Interaction with Mobile Devices and Services; Amsterdam, the Netherlands, 2008; pp. 217–223. https://doi.org/10.1145/1409240.1409264.Search in Google Scholar
6. Islam, M. N., Ahmed, M. A., Islam, A. K. M. N. Chakuri-bazaar: a mobile application for illiterate and semi-literate people for searching employment. Int. J. Mobile Hum. Comput. Interact. 2020, 12, 22–39. https://doi.org/10.4018/IJMHCI.2020040102.Search in Google Scholar
7. Jan, S., Maqsood, I., Ahmed, S., Wadud, Z., Ahmad, I. Investigating the use of email application in illiterate and semi-illiterate population. Comput. Mater. Contin. 2020, 62, 1473–1486. https://doi.org/10.32604/cmc.2020.08917.Search in Google Scholar
8. Katusiime, J., Pinkwart, N. A mobile app for illiterate and semi-illiterate pregnant women- a user centered approach. In 17th IFIP Conference on Human-Computer Interaction (INTERACT), 2019; pp. 617–620.10.1007/978-3-030-29390-1_48Search in Google Scholar
9. Taoufik, I., Kabaili, H., Kettani, D. Designing an e-government portal accessible to illiterate citizens. In 1st International Conference on Theory and Practice of Electronic Governance, 2007; pp. 327–336.10.1145/1328057.1328125Search in Google Scholar
10. Peffers, K., Tuunanen, T., Rothenberger, M. A., Chatterjee, S. A design science research methodology for information systems research. J. Manag. Inf. Syst. 2007, 24, 45–77. https://doi.org/10.2753/MIS0742-1222240302.Search in Google Scholar
11. Lapão, L. V., da Silva, M. M., Gregório, J. Implementing an online pharmaceutical service using design science research. BMC Med. Inf. Decis. Making 2017, 17, 1–14. https://doi.org/10.1186/s12911-017-0428-2.Search in Google Scholar PubMed PubMed Central
12. van de Kar, E., den Hengst, M. Involving users early on in the design process: closing the gap between mobile information services and their users. Electron. Mark. 2009, 19, 31–42.10.1007/s12525-008-0002-ySearch in Google Scholar
13. Alfayez, Z. H. Designing educational videos for university websites based on students’ preferences. Online Learn. 2021, 25, 280–298. https://doi.org/10.24059/olj.v25i2.2232.Search in Google Scholar
14. Biggerstaff, D., Thompson, A. R. Interpretative phenomenological analysis (IPA): a qualitative methodology of choice in healthcare research. Qual. Res. Psychol. 2008, 5, 173–183.10.1080/14780880802314304Search in Google Scholar
15. Islam, M. N., Inan, T. T., Promi, N. T., Diya, S. Z., Islam, A. K. M. N. Design, implementation, and evaluation of a mobile game for blind people: toward making mobile fun accessible to everyone. In Information and Communication Technologies for Humanitarian Services; The Institution of Engineering and Technology: Herts, United Kingdom, 2020; pp. 291–296. https://doi.org/10.1049/PBTE089E_ch13.Search in Google Scholar
16. Alfayez, Z. H. A review of mobile applications developed by academics for COVID-19. Int. J. Adv. Technol. Eng. Explor. 2021, 8, 529–536. https://doi.org/10.19101/IJATEE.2021.874058.Search in Google Scholar
17. Payne, R. Beginning App Development with Flutter: Create Cross-Platform Mobile Apps; Apress: Dallas, TX, USA, 2019.10.1007/978-1-4842-5181-2Search in Google Scholar
18. Clow, M. Learn Google Flutter Fast: 65 Example Apps; Independently published: 2019. ISBN: 978–1092297370.Search in Google Scholar
19. ISO. Ergonomic requirements for office work with visual display terminals (VDTs) — part 11: guidance on usability. ISO Stand. 9241-11 1998, 1998.Search in Google Scholar
20. Alfayez, Z. H., Altawriy, H. M. Usability evaluation of educational websites: a case study of university of Basrah website. Solid State Technol. 2020, 63, 9865–9886.Search in Google Scholar
21. Bevan, N., Carter, J., Harker, S. ISO 9241-11 revised: what have we learnt about usability since 1998? In Human-Computer Interaction: Design and Evaluation; Kurosu, M. Ed., Vol. 9169, Los Angeles, CA, USA, 2015; pp. 143–151.10.1007/978-3-319-20901-2_13Search in Google Scholar
22. Braun-Münker, M., Kahriman, B., Ecker, F. The package barrier to user adherence: comparative analysis of various types of opening instructions on the ease of opening comprising effectiveness, efficiency and user satisfaction. Br. Pharmacol. Soc. 2020, 86, 1982–1988. https://doi.org/10.1111/bcp.14060.Search in Google Scholar PubMed PubMed Central
23. Patel, N., Agarwal, S., Rajput, N., Nanavati, A., Dave, P., Parikh, T. S. No experiences designing a voice interface for rural India. In 2008 IEEE Spoken Language Technology Workshop, 2008; pp. 21–24.10.1109/SLT.2008.4777830Search in Google Scholar
24. Dworkin, S. L. Sample size policy for qualitative studies using in-depth interviews. Arch. Sex. Behav. 2012, 41, 1319–1320. https://doi.org/10.1007/s10508-012-0016-6.Search in Google Scholar PubMed
25. Fugard, A. J. B., Potts, H. W. W. Supporting thinking on sample sizes for thematic analyses: a quantitative tool. Int. J. Soc. Res. Methodol. 2015, 18, 669–684. https://doi.org/10.1080/13645579.2015.1005453.10.1080/13645579.2015.1005453Search in Google Scholar
© 2022 Walter de Gruyter GmbH, Berlin/Boston
Articles in the same Issue
- Frontmatter
- Editorial
- Editorial
- Research Article
- There’s more than one metaverse
- Case Report
- Industry goes metaverse – the fusion of real and virtual industrial worlds exemplified by the wastewater industry
- Research Articles
- Self-touch: an immersive interaction-technique to enhance body awareness
- Time related changes of affective dimensions and distinct emotions in the interaction with a tablet PC
- Design and implement a mobile-based system to teach traffic signs to illiterate people