CT investigation of 3D liquid pathways in the anatomical structure of Norway spruce wood during imbibition
-
Benoît Martin

 ,
Julien Colin
,
Julien Colin

Abstract
Wood permeability is a macroscopic property resulting from complex pathways at the cellular level. In this study, high-resolution X-ray CT scans were performed during longitudinal imbibition in Norway spruce to investigate the role of wood rays and tracheids network in liquid migration. A customized setup was designed to maintain the bottom face of a wooden cylinder in contact with water, without vibration, despite the sample rotation required during each scan. The results highlighted a contrasted role of latewood and earlywood in water migration. Liquid imbibition was fast in latewood, because the bordered pits are less prone to aspiration than in earlywood, due to their smaller diameter and larger cell wall thickness. In earlywood, the migration pattern was complex due to pit aspiration that isolate tracheids clusters. Indeed, the images revealed a significant contribution of wood rays in the migration pathways. Consequently, tracheids were not progressively filled in the longitudinal direction from one tracheid to the next, but they were filled laterally with water coming from wood rays at different heights of the cells. This explained entrapped air bubbles in the lumens and led to a 3D heterogeneous liquid distribution.
1 Introduction
Wood has a complex 3D anatomical structure that ensures three vital functions during tree life: the ascent of sap, the mechanical support of the plant, and storage (Dixon 1914; Plavcová et al. 2015; Tyree and Ewers 1991; Zimmermann 1983). The anatomical pattern is specific to each species, including the genotype (Schoch et al. 2004; Wilson and White 1986), but its expression depends on the environmental growth conditions (Donaldson and Singh 2016; Parham and Gray 1984; Polge 1978). A description of functional wood anatomy is essential to understand moisture flow in wood products during use and, thus, predict their performance. For softwood species, tracheids ensure both longitudinal conduction of sap at the trunk periphery and mechanical support in the whole section of the tree trunk (Bamber 1976; Taylor et al. 2002). Fluid flow redistribution and nutrient storage are the functions of wood rays in the radial direction (Carlquist 2018). The softwood rays are composed of ray parenchyma, and ray tracheids arranged one above the other in one row width, thus called uniseriate rays. In addition, some species, such as Norway spruce, pine, and Douglas fir, present resin canals in the longitudinal and radial directions. Small openings – called pits – ensure the conduction of fluid from one cell to another, with different features according to the cells they connect and the species (Trouy 2015). Three types of pits are present in softwood species: simple pits connecting ray parenchyma cells, bordered pits linking tracheids, and half bordered pits between ray parenchyma cells and tracheids (Howard and Manwiller 1968). These pits are all composed of a membrane and a cavity but with some specific features. For bordered pits, the partially hydrolyzed membrane – called margo – is composed of an impermeable dense mater of microfibril in its center: the torus (Kollmann and Côté 1968; Parham and Gray 1984). This feature is specific to the bordered pits and is not present in simple and half-bordered pits. It acts as a valve during the tree’s life and can be in two positions: open or close to the fluid flow. Indeed, air bubbles can be formed within the tracheids during periods of drought in summer or frost in winter and interrupt the ascent of sap from the roots to the leaves. In this case of embolism, the pressure difference on both sides of the membrane induces its movement against the secondary wall of the cell wall. The torus located in the center of the membrane close the opening in the secondary wall and remain in its position preventing liquid flow (Siau 1984). The tracheids become isolated from the other functional tracheids ensuring the transport of sap. Pits aspiration also occurs during the drying process, when the liquid in the lumens of tracheids is removed (Comstock and Côté 1968; Petty and Puritch 1970). Liese and Bauch (1967) and Bolton and Petty (1978) showed that the percentage of aspirated bordered pits was lower in latewood due to a more rigid membrane than in earlywood. In addition, extractives or resin may (Bertaud and Holmbom 2004) obstruct simple or half-bordered pits during drying (Thomas and Kringstad 1971). As a result, the pathways of fluid flow between the cells involved in sap migration during the life of the tree may be different once a piece of softwood has been dried.
When used, a piece of wood usually undergoes variations of environmental conditions and can be temporally in contact with water, which migrates from the interface to the core (Schmidt and Riggio 2019). These variations of moisture content impact properties of wood material as for instance color, stiffness, durability (Gerhards 1982; Kollmann and Côté 1968). Moisture transport needs to be understood to prevent degradation and maintain the performance of massive timber. In the hygroscopic domain corresponding to an MC below the fiber saturated point (FSP) close to 30% (dry basis) at room temperature (Siau 1984), moisture transport involves diffusion of bound water in the cell wall and water vapor in lumens. Above the FSP, in addition to bound water and water vapor, water in the liquid state is present. The capillary forces and the related liquid pressure gradient cause a liquid flow through the interconnected pores (Perré 2007; Stamm 1967). Thus, moisture movement through wood structure is strongly related to the orthotropic properties of wood (longitudinal, radial, and tangential) (Buckman and Rees 1935; Comstock 1969) and its location in the trunk (heartwood or sapwood) (Scheiding et al. 2016).
To better understand liquid flow in solid wood at the tissue level, non-destructive and non-invasive techniques (NMR, MRI, X-ray imaging or neutron imaging) have been developed in laboratories (Davis and Wells 1992; Kobori et al. 2013; Lindgren 1992; Niemz and Mannes 2012; Perré 2011). Heterogeneity of water migration has been observed during imbibition through X-ray CT, with a lower moisture velocity in heartwood compared to sapwood (Sandberg and Salin 2012). At the growth ring scale, moisture migration rate is faster in latewood (LW) than in earlywood (EW) during drainage with initially saturated samples as showed by Almeida et al. (2008) using MRI and during imbibition with initially dry samples using 2D neutron imaging (Derome et al. 2005; Desmarais et al. 2016) and 2D X-ray imaging (Martin et al. 2021). The authors explained that these heterogeneities came from chemical and physical modifications in heartwood compared to sapwood from the higher probability of aspirated pits in earlywood than in latewood. However, the role of softwood rays and tracheids network for liquid migration was not accessible in these studies and needs to be further investigated. X-ray CT showed its great potential to study the wood anatomy with high resolution to observe the presence of liquid within the cell lumina. Recently, water migration in the longitudinal direction has been observed in hardwood using a synchrotron beamline (Zhou et al. 2019). Phase-contrast imaging allowed visualization of water directly in cell lumens at early stages of imbibition, highlighting different water propagation between vessels and fibers. The authors suggested that liquid migration occurs once the cell wall is saturated with bound water from their observations. They only focused on hardwoods, but a thorough investigation of water migration in softwoods is required for their importance in building construction.
The present work focuses on liquid pathways in Norway spruce wood during imbibition to investigate the contribution of wood rays and tracheids network to liquid flow. For this purpose, a custom setup was designed to perform high-resolution X-ray CT during imbibition to visualize the evolution of 3D liquid pathways in the anatomical structure of wood.
2 Materials and methods
2.1 Norway spruce sample
The sample came from a board selected from a Norway spruce (Picea abies) tree harvested in Auvergne (France) with 73 rings from pith to cambium at 50 cm height. During several months, the board was dry and then stored in a climatic chamber (25 °C and RH 50%). A small cylinder with a diameter of 3 mm and a height of 20 mm in the longitudinal direction was carved by a five axes CNC machine (SCM morbidelli 100). The sample was located at the growth ring transition between the rings 50 (LW) and 51 (EW). From this location, it can be stated that the material is 22–23 years old and suggested that the sample was in mature wood and in heartwood (Alteyrac et al. 2006; Longuetaud et al. 2006; Sandberg 2009). During imbibition, the kinetics presented by Martin et al. (2021) showed a capillary migration preceded by a bound water migration. The initial state of wood in the hygroscopic domain has thus a significant influence on the liquid flow and emphasizes the importance of homogeneous initial moisture content. Therefore, after being processed, the sample was stored in a climatic chamber (Mermmert HPP2200) with a temperature set at 25 °C and relative humidity (RH) at 50% until the equilibrium moisture content (EMC) was reached, i.e., until the sample mass – measured periodically – became stable. Then, the lateral surface was coated with a waterproof sealant (AquaStop v33) to limit mass transfer through this surface and thus to impose mainly a water migration along the longitudinal direction. For this step, a craft lathe was designed to suit the small size of the sample to apply the paint evenly along the periphery. The wood surface was previously sanded using a 320 grit sandpaper and after the first coat to remove the lifted fibers. Then, a second coat was applied to perfect the cover. After that, the cross-section at the ends of the sample were machined using a microtome (Thermo Scientific Microm HM 450) to obtain the final length. The use of a microtome instead of a blade saw prevented damaging the cell wall structure and obstruction the lumens with dust (Choong et al. 1975). Finally, the sample was stored in the climatic chamber (T = 25 °C and RH = 50%) until mass stabilization.
Because of the long duration of the experiment, only one sample was used in this work. The connection pattern of the different types of anatomical elements was repeated in the wood many times, providing a statistical relevance to the observed phenomena.
2.2 X-ray CT
2.2.1 Experimental setup
The challenge here was to complete one rotation of the sample without vibration – due to mechanical constraints – during the scans while maintaining contact with water. For this purpose, an original setup was designed, as seen in Figure 1. The imbibition experiment was performed by placing a sample vertically and by ensuring contact of its lower surface with water. The custom setup was composed of a hollow sample holder located at the top of an aluminum tube in which the sample was tightened and a water container that were interconnected by a flexible tube (Figure 1a and b). The 3D printed water container was divided into two compartments to control a constant water level using an overflow supply. The water stored in one compartment was delivered to the second one by a pump controlled outside the tomograph. As the flexible tube was connected to the second compartment, water went to the aluminum tube after activation of the water pump. The water level at the end of the aluminum tube was adjusted using a micro-metric vertical stage (Newport model M-UMR5.5). This assembly worked as a communicating vessel system where the height of the water overflow in the container was the same at the top of the aluminum tube. This assembly ensured a continuous contact of the sample bottom with water. The fastening of the water container to an aluminum frame separated from the sample holder with the use of a flexible tube to connect the container to the aluminum tube was chosen to limit vibration. During the experiment, the environmental conditions (T = 26.9 ± 0.5 °C and RH = 38 ± 1%) were monitored using an SHT85 capacitive sensor (Sensirion AG with ±1.5 RH and ±0.1 °C of accuracy) located close to the sample (Figure 1a).

(a) Global view on the experimental setup placed near the nano X-ray source (1), CCD camera (2), flexible tube (3), aluminum tube (4), the liquid container holding on a micro-metric vertical axis (5), and the sensor SHT85 Sensirion (6). (b) Zoom on the location of the sample at the top of the aluminum tube. (c) Scheme of the sample with the corresponding position of 3D scans volume (green dashed rectangle).
The scans performed during imbibition were carried out using a last generation nano-tomograph (RX Solution, EasyTom XL Ultra 150–160). The nano focal spot of the X-ray source was combined to a 16 bits CCD camera composed of 4032
The bottom of the scanned volume in the sample was set at 5 mm from the liquid surface contact (Figure 1c) to ensure that the liquid meniscus crossed at least one tracheid end (and more likely two) through bordered pits before reaching the observed zone. Before putting the wooden cylinder in contact with water, the initial state was recorded at air-dry state (MC equal to 8%, d.b.). Then, a precaution was taken to ensure the absence of air trapped between liquid and wood sample during imbibition. For that purpose, the sample and the sample holder were removed from the aluminum tube, and the water pump was switched on. After that, once the liquid reached the top of the aluminum tube, the sample holder was re-positioned (Figure 1c), which started the imbibition process. Finally, the absence of air bubbles was checked and validated by X-ray imaging. Indeed, the low thickness of the tube and the chosen emission parameters made it possible to see the presence or not of air bubbles inside the aluminum sample holder through X-ray imaging. The experiment lasted 24 hours in total. This duration was defined according to the imbibition results from Martin et al. (2021) to observe liquid water throughout the scanned sample height. Several scans were performed after 1 h, 3 h, 19 h and 24 h of imbibition to follow the evolution of 3D liquid migration within the sample. After each scan, the sample was rotated back to angular position manually to guide the flexible tube when returning and to avoid winding this flexible tube. To obtain a 3D reconstruction without blurring, the swelling of the sample should remain negligible throughout an entire scan. A CT scan was performed 50 min after the beginning of imbibition, but the swelling variation did not allow a tomographic reconstruction with a clear visualization of the cell contours because of the overlapping of the cell walls. For this reason, the first CT scan analyzed was obtained 1 h 20 min after the beginning of imbibition, once the swelling changed more slowly over the whole scanned volume.
2.2.2 Image processing
The 3D reconstructions from the 2D projections were carried out using X-act – software provided by RX Solutions – based on the principle of filtered back projection. The following steps of image processing were done using MATLAB. The cross-section slices – obtained along the z-axis (Figure 2a) – were processed into binary images using a local adaptive threshold through the function imbinarize with the following parameters: imbinarize(img,’adaptive’,’Sensitivity’,0.6). Next, isolated clusters of less than eight pixels black and white were removed to obtain slices without noise (Figure 2b). The X-rays attenuation of water and lignocellulosic material were too close to differentiate them by thresholding (see Appendix 1). Thus, the binary images were composed of white pixels (air) and black pixels (cell walls and/or water), as shown in Figure 2b. A region of interest (ROI) was established to exclude the periphery of the sample (marked in light grey) damaged during machining (Figure 2c). For this step, the cross-section contour was detected using the edge function in MATLAB after applying the filled holes function to obtain a single region corresponding to the cross-section area of the sample. The center of this region was then determined using the centroid function, which allowed the contour to be redrawn with a reduction factor to eliminate 19% of the periphery.
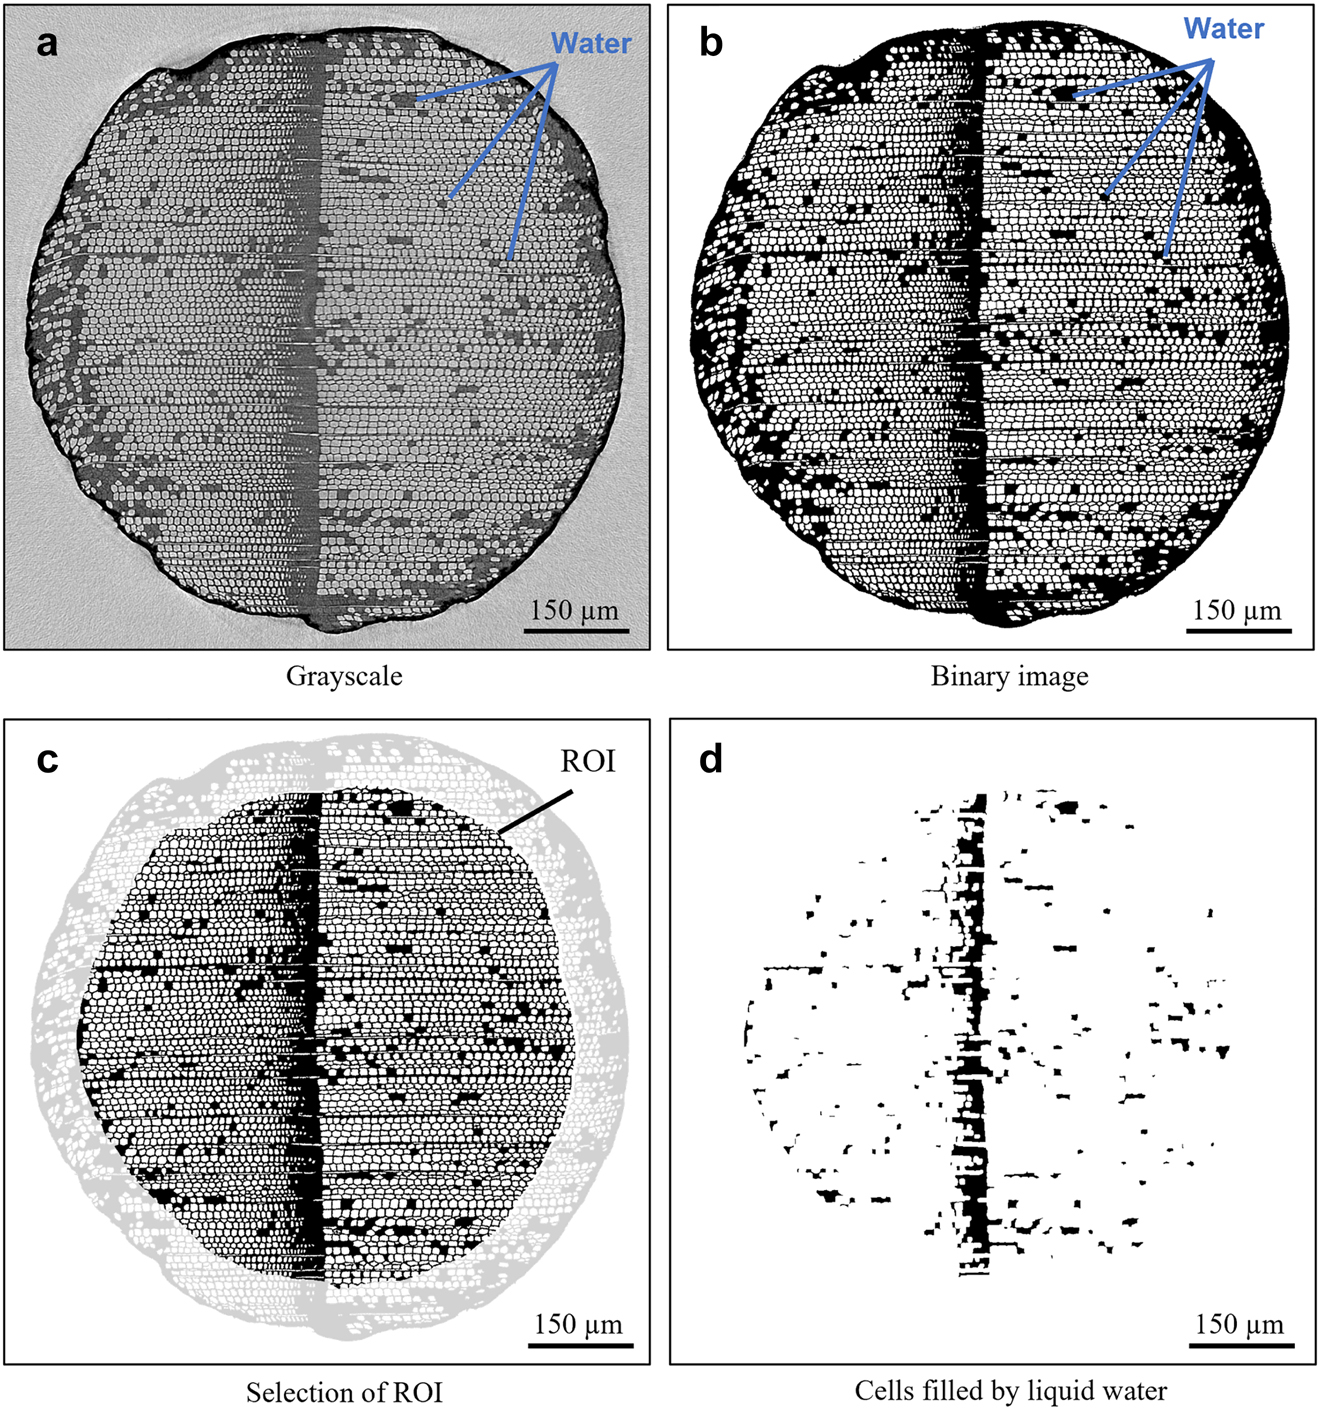
Cross-section of sample with the presence of water with (a) raw image, (b) slice after thresholding, (c) selection of region of interest (ROI) and (d) lumens filled with water in the ROI.
Finally, to visualize liquid pathways into the structure, the cell walls were removed using an erosion function with four iterations and, again, followed by removal isolated clusters less than eight pixels. Thus, the lumens of isolated tracheids filled with water and clusters of tracheids filled with water – lumens and cell walls – appeared in black (Figure 2d). This method was chosen to highlight liquid in the tracheids located in earlywood. In latewood, the voxel size close to the pore size created continuous black areas with no possibility to visualize liquid pathways in 3D views but still accessible in slices (Appendix 1). A similar drawback of image processing was observed within resin canals initially filled by substances (e.g., resin) at the dry state. However, this method gave access to 3D overview of the location of water in the pore network for qualitative analysis. Slices in the plans longitudinal-radial (L-R) and longitudinal-tangential (L-T) were also extracted from 3D reconstruction using FIJI ImageJ. On these slices, an adjustment of the brightness and contrast were performed for better observation and to compare the additional filled lumens during imbibition from the initial state (air dry). The colors were inverted (using the function invert Look Up Table (LTU) in FIJI Image J) from the initial CT images to keep the same rules than for binary images: dark pixels corresponded to dense material (liquid of cell wall) and light grey to air. Indeed, grayscale values of CT images are related to the X-ray attenuation of the material. Thus, a voxel localized in the cell wall has a lighter gray value than a voxel localized in a cell lumina filled with air (Kak and Slaney 2001).
3 Results and discussion
Figure 3 depicts the cross-sections of the sample located at 5 and 8.3 mm from the water surface after image processing at different times. The liquid was highlighted using two colors: orange corresponds to the water-filled lumens during the current acquisition and green during the previous ones. The results showed a contrasting behavior between EW and LW during imbibition. After 1 h, liquid progressed in most of the tracheids located in LW to the top of the scanned volume (8.3 mm from the contact surface), while only a few isolated tracheids were filled in earlywood. In the second acquisition, which was recorded 2 h later, the new tracheids filled with liquid (orange colors) were mainly located next to the previous ones. After 19 and 24 h of imbibition, water was present in a significant number of clusters of tracheids at first glance randomly distributed but with relatively large areas free of water. Areas with empty cells remained present in earlywood at both heights but did not seem to be linked.

Cross-section located at 5 mm (bottom) and 8.30 mm (top) from the water surface during imbibition. The orange color corresponds to the lumens filled during the current acquisition and the green color during the previous ones.
The difference in liquid migration between EW and LW in softwood species was already observed (Almeida et al. 2008; Derome et al. 2005; Desmarais et al. 2016; Sandberg and Salin 2012) and measured (Martin et al. 2021) using non-destructive methods. The ability of the liquid to migrate in solid wood is linked to its permeability and thus to its connected porosity. In softwood, gas permeability is lower after drying because of the aspiration of bordered pits (Comstock 1969; Wilson and White 1986). Due to the increasing cell wall thickness and decreasing bordered pit size from EW to LW, almost all pits can be aspirated in earlywood and none in latewood (Bolton and Petty 1978; Perré and Turner 2001). It should be noted that pits aspiration is an irreversible phenomenon occurring during the drying of wood when the water is removed from the lumens. Therefore, no additional pits aspiration and no pits opening occurred during the sample preparation and the imbibition. The observations made from Figure 3 confirmed that the latewood part remained conductive despite the small lumen sizes allowing the liquid to rise the top of the scanned volume in a relatively short time. On the contrary, the high percentage of pit aspiration in earlywood reduced the lumens connectivity of tracheids resulting in very few continuous pathways explaining a very low and incomplete imbibition in this part of the growth ring. The few cells used as pathway to liquid were reported in previous works using stained fluids (Ghazil 2010; Petty and Preston 1970). However, contrary to the apparent longitudinal pathway in latewood, the position of tracheids filled with water between the two heights (5 and 8.3 mm from the water surface) did not coincide in earlywood. The few remaining pathways to fill neighboring tracheids may then be either transverse or longitudinal due to the aspiration of bordered pits in earlywood.
To assess the distribution of liquid over the height of the scanned volume, the total area of the empty cell lumens was estimated by summing the number of white pixels inside the ROI of each slice (Figure 2c). This analysis could be performed over the whole section of the sample, including in latewood. Indeed, although it was not possible to visualize the 3D liquid pathways in latewood – due to the high filling rate of lumens with water from the beginning of the experiment –, the pixel size was compatible with the observation of empty lumens in this zone. The curves in Figure 4 depicted the total surface area of the cell lumens in the ROI along the scanned cross-section. As expected from the previous results, the surface area of the empty cells decreased over time and increased along the height (Figure 4). The interesting results came from the local deviations on the curves, particularly at 19 and 24 h. These local deviations increased over time, but their peaks remained at the same position from water surface, reflecting the development of interconnected filled cells. Therefore, these results are linked to the wood anatomical structure, which is not uniform along the longitudinal direction, for example, with ray cells.
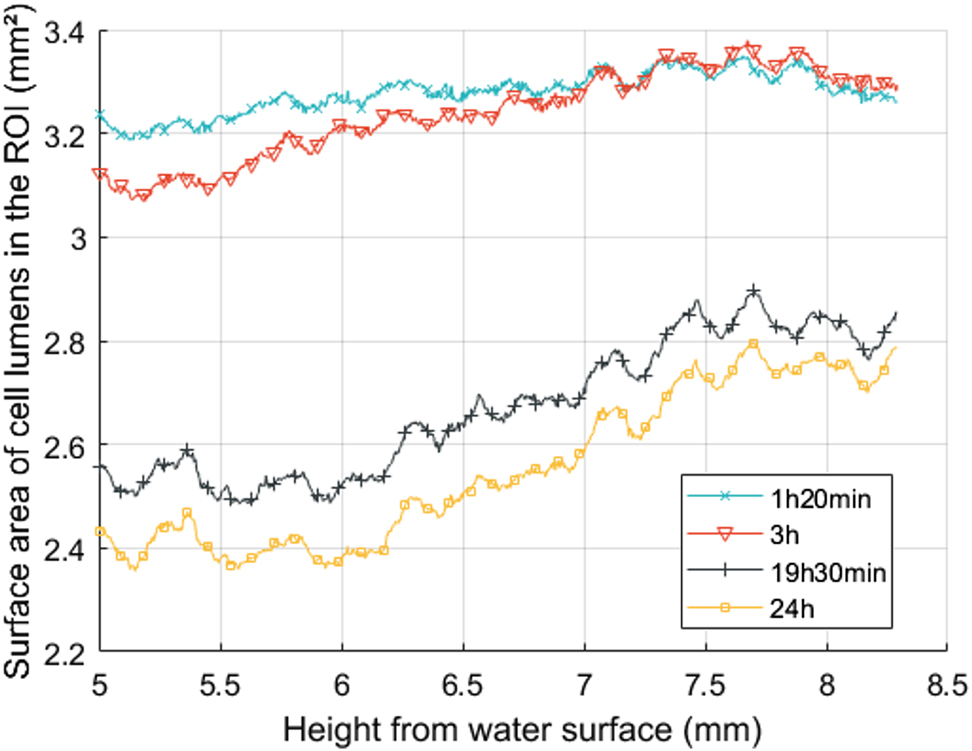
Total surface area of cell lumens in the regions of interest (ROI) along the height of the scanned volume during imbibition.
To have an overview of the pattern of liquid migration, 3D views of the selected volume were plotted along a longitudinal-tangential (L-T) plane in Figure 5a, and a longitudinal-radial (L-R) plane in Figure 5b for different imbibition times. The cell walls were removed to highlight the presence of liquid (image processing steps depicted in Figure 2d). Here again, the orange color corresponds to the water-filled lumens during the current acquisition and the green color during the previous ones. The L-T volume, located in earlywood, revealed liquid migration within some tracheids reaching different heights after 1 h of imbibition (Figure 5a.1). After 3 h (Figure 5a.2), the liquid pathway between two successive tracheids in the longitudinal direction was clearly exhibited (blue arrow), meaning that liquid went through open bordered pits. On the same image, new filled cells (orange color) appeared at several heights but did not seem to be directly linked to the others. The two scans performed the following day (after 19 and 24 hours of imbibition) showed a large number of tracheids filled with liquid distributed along longitudinal direction but with some large vertical regions free of liquid (black circles in Figure 5a.4). Moreover, the liquid did not seem to entirely fill the tracheids lumens, as revealed by the small isolated orange zones in Figure 5a.4. This observation was also visible in the 3D liquid mapping in the L-R plane (Figure 5b.4). Beyond this similarity, a significant difference in liquid distribution was clearly visible in this L-R plane compared to the L-T plane (Figure 5a.4 and b.4). In Figure 5b.1, the 3D views point out the difference in liquid invasion between EW and LW. Liquid reached the top of the scanned volume in latewood, while in earlywood, liquid migrates only in rare lines of connected tracheids. In L-R plane, the liquid was spatially distributed in successive horizontal layers (brackets in Figure 5b.3 and b.4) with intermediate empty areas. The cells in orange and green colors indicated that liquid migrated discontinuously in the longitudinal direction. These layers of liquid, perpendicular to the longitudinal direction, could explain the slope of the curves in Figure 4 after 19 and 24 h of imbibition. This heterogeneity of water distribution highlights the complex water pathways into the connected pore network linked to the wood anatomical structure. The spatial distribution of liquid in L-R plane observed here tempts to indicate that wood rays (ray parenchyma, ray tracheids or resin canals in multiseriate rays) could play a role in liquid invasion.

3D views of liquid migration for a selected volume in tangential-longitudinal (top) and radial-longitudinal (bottom) plans. The blue arrows indicate the same tracheid filled by water. The orange color corresponds to the water-filled lumens during the current acquisition and the green color during the previous ones. Dashed black circles indicated large vertical regions free of liquid.
To better understand the significant role of each type of cell in the liquid pathways, slices in the L-T plane were depicted in LW (Figure 6a) and EW (Figure 6b) using FIJI Image J. As expected, almost all tracheids were filled in latewood after 3 h of imbibition with almost no air bubbles. As proved by some examples highlighted by orange circles, some ray cells were filled with water during imbibition.

Slices in the longitudinal-tangential plane at different times.
(a) In latewood, and (b) in earlywood. Orange and yellow circles are added to highlight the contribution of wood rays in water migration in some specifics regions.
In earlywood, the penetration of liquid into tracheids was detailed at two locations after 3 h of imbibition (yellow circles in Figure 6 and Figure 5b.2). By taking a closer look, liquid came from the adjacent wood rays. Figure 6b.3 shows that a large number of tracheids were filled with water at different heights, related to the presence of wood ray cells previously filled with water. As a result, air bubbles were trapped within the tracheids adding resistance to water migration due to the difficulty of air to escape. From this figure, it is possible to observe that only some cells in wood rays participated in liquid flow. Manual counting of the number of active cells in wood rays indicated that around 16 and 26% of cells were filled in EW and about 20 and 36% in LW after 3 h and 24 hours, respectively. The higher percentage in LW could be explained by the higher number of tracheids filled. Despite a relatively small region of interest, the count of 164 cells in LW and 98 in EW in total indicated that about 1/3 of these cells in the wood rays participated in the water migration. It was also possible to see that the number of cells increased with time. The non-impregnation of liquid into some cells of wood rays was already reported for preservative treatment (Flynn 1995). In Norway spruce, wood rays are composed of ray parenchyma and ray tracheids (Schoch et al. 2004). During tree life, ray parenchyma has two main functions: production and storage of nutrients. During the industrial drying process, the elaborated substances (from extractives or resin) could migrate and accumulate against the membrane of half bordered pits (in ray tracheids) or plug simple pits (in ray parenchyma), leading to reduce the permeability (McGinnes and Rosen 1984; Nuopponen et al. 2003). From the slice in L-T plane, it could be concluded that both ray parenchyma and ray tracheids acted as a pathway to liquid migration. The absence of air bubbles in latewood confirmed the ability of the liquid to migrate from one tracheid to an upper one. To investigate how liquid migrated within wood rays, slices in L-R plane over a larger region were depicted in Figure 7.

Slices in the longitudinal-radial plane of a selected locations spaced 12 µm apart. Filled green arrows indicate liquid in cells of wood rays (empty green arrows indicate the same cells with no liquid at the dry state).
Two slices were selected 12 µm apart in the tangential direction to visualize liquid invasion in a row of tracheids adjacent to an uniseriate wood rays (Figure 7a and b spaced of 12 µm). As wood rays were not perfectly straight, green stars were added to indicate the location of several horizontal wood rays starting on the left side (Figure 7a.1) and ending at the right side of the slice (Figure 7b.1). Detail of wood rays (dashed green rectangles) showed that liquid appeared within some cells marked by green arrows as well as droplets against the cell wall of longitudinal tracheids located at the same height (dashed orange rectangles). At the dry state, no particular shapes within these tracheids were visible (Figure 7a.1 and b.1), confirming that the liquid appeared in these locations (Figure 7a.3 and b.3). In wood rays, the cells filled with water after 3 h of imbibition were also empty at the dry state (empty green arrows in the zoom of Figure 7a.1 and b.1). The same observation could be done in other regions of the slice where these droplets indicated the first step of tracheid invasion in earlywood. The possibility of liquid to migrate through cross-field pits (linking wood ray and longitudinal tracheids) was already observed at the end of the preservative treatment process in previous studies (Tondi et al. 2013; Wardrop and Davies 1961). From the current observation, liquid flow in the radial direction seemed to be mainly due to wood rays from which the water reached the tracheids at different heights, explaining the isolated cells partially filled with water in the 3D views in Figure 5a.2 and b.2. Ends of the tracheids might also have played a role, as visible in the purple rectangles but in a lower magnitude than wood rays. Further investigations should be carried out to explore this hypothesis with, for example, an imbibition experiment in the tangential direction.
4 Conclusions
A custom setup was developed and placed in a microtomograph to visualize liquid pathways in Norway spruce during water imbibition in the longitudinal direction. The time-resolved 3D images depicted a heterogeneous distribution of liquid in wood strongly linked to its anatomical structure. From the observations, liquid pathways in the anatomical structure of this softwood species could be described as follows:
In earlywood, the direct migration from tracheids to tracheids was hindered due to the aspirated bordered pits. Instead, the ray cells contributed significantly to liquid migration as an intermediate pathway likely to connect clusters of tracheids. As a result, a complex invasion of liquid was observed in earlywood with an incomplete saturation of tracheids and remaining air bubbles,
In latewood, the liquid rose in most tracheids that remain connected due to the very low aspiration rate of bordered pits. In addition, this allows water to invade ray cells from these filled tracheids, an important mechanism for earlywood imbibition as stated above,
Approximately 30% of cells in wood rays participated in liquid flow in the radial direction.
Further work might explore other imbibition experiments performed in the radial or tangential direction. The experimental setup presented here could also be used or adapted to investigate liquid pathways in other porous materials.
Funding source: Agence de l’Environnement et de la Maîtrise de l’Energie
Funding source: Conseil régional du Grand Est
Funding source: Grand Reims
Funding source: Conseil départemental de la Marne
Funding source: European Regional Development Fund
Funding source: Recherches Avancées sur la Biologie de l’Arbre et les Ecosystèmes Forestiers
Award Identifier / Grant number: ANR-11-LABX-0002-01
-
Author contributions: All the authors have accepted responsibility for the entire content of this submitted manuscript and approved submission.
-
Research funding: None declared.
-
Conflict of interest statement: The authors declare no conflicts of interest regarding this article.
Figure 8 depicted the slices located at 5 mm from the water surface after 3D reconstruction (Figure 8a: grayscale and Figure 8b: binary image) at the initial state and after 1 h 20 min of imbibition. The swelling of the sample was visible between the slices. The dark grey color corresponds to the location of high-density matter (wood or water) and the light grey color to the voids (air). On the zooms, the liquid within the voids had a grey level close to the cell walls explaining that the shape of the tracheids in latewood was no longer distinguished. For this reason, on the binary image, the cluster of tracheids filled with water could not be separated. However, it appears that lumens were filled with water.

Grayscale cross section located at 5 mm from the water surface at the dry state and after 1 h 20 min of imbibition.
References
Almeida, G., Leclerc, S., and Perré, P. (2008). NMR imaging of fluid pathways during drainage of softwood in a pressure membrane chamber. Int. J. Multiphas. Flow 34: 312–321. https://doi.org/10.1016/j.ijmultiphaseflow.2007.10.009.Search in Google Scholar
Alteyrac, J., Cloutier, A., and Zhang, S.Y. (2006). Characterization of juvenile wood to mature wood transition age in black spruce (Picea mariana (Mill.) B.S.P.) at different stand densities and sampling heights. Wood Sci. Technol. 40: 124–138. https://doi.org/10.1007/s00226-005-0047-4.Search in Google Scholar
Bamber, R.K. (1976). Heartwood, its function and formation. Wood Sci. Technol. 10: 1–8. https://doi.org/10.1007/bf00376379.Search in Google Scholar
Bertaud, F. and Holmbom, B. (2004). Chemical composition of earlywood and latewood in Norway spruce heartwood, sapwood and transition zone wood. Wood Sci. Technol. 38: 245–256, doi:https://doi.org/10.1007/s00226-004-0241-9.Search in Google Scholar
Bolton, A.J. and Petty, J.A. (1978). A model describing axial flow of liquids through conifer wood. Wood Sci. Technol. 12: 37–48. https://doi.org/10.1007/bf00390009.Search in Google Scholar
Buckman, S.J. and Rees, L.W. (1935). Moisture movement in coniferous wood below the fiber-saturation point, Minnesota Agricultural Experiment Station, Bul. 108. University of Minnesota.Search in Google Scholar
Carlquist, S. (2018). Living cells in wood 3: overview. Functional anatomy of the parenchyma network. Bot. Rev. 84: 242–294. https://doi.org/10.1007/s12229-018-9198-5.Search in Google Scholar
Choong, E.T., McMillin, C.W., and Tesoro, F.O. (1975). Effect of surface preparation on gas permeability of wood. Wood Sci. 7: 319–322.Search in Google Scholar
Comstock, G.L. (1969). Directional permeability of softwoods. Wood Fiber Sci. 1: 283–289.Search in Google Scholar
Comstock, G.L. and Côté, W.A. (1968). Factors affecting permeability and pit aspiration in coniferous sapwood. Wood Sci. Technol. 2: 279–291. https://doi.org/10.1007/bf00350274.Search in Google Scholar
Davis, J. and Wells, P. (1992). Computed tomography measurements on wood. Ind. Metrol. 2: 195–218. https://doi.org/10.1016/0921-5956(92)80004-d.Search in Google Scholar
Derome, D., Roels, S., and Carmeliet, J. (2005). Qualitative work to study water movement in wood. Proceedings of the 7th symposium on building physics in the Nordic countries. Reykjavik, Iceland, pp. 173–180.Search in Google Scholar
Desmarais, G., Gilani, M.S., Vontobel, P., Carmeliet, J., and Derome, D. (2016). Transport of polar and nonpolar liquids in softwood imaged by neutron radiography. Transport Porous Media 113: 383–404. https://doi.org/10.1007/s11242-016-0700-4.Search in Google Scholar
Dixon, H.H. (1914). Transpiration and the ascent of sap in plants. London: Macmillan.10.5962/bhl.title.44194Search in Google Scholar
Donaldson, L.A. and Singh, A.P. (2016). Chapter 6: reaction wood. In: Kim, Y.S., Funada, R., and Singh, A.P. (Eds.), Secondary xylem biology. Boston: Academic Press, pp. 93–110.10.1016/B978-0-12-802185-9.00006-1Search in Google Scholar
Flynn, K.A. (1995). A review of the permeability, fluid flow, and anatomy of spruce (Picea spp.). Wood Fiber Sci. 27: 278–284.Search in Google Scholar
Gerhards, C.C. (1982). Effect of moisture content and temperature on the mechanical properties of wood: an analysis of immediate effects. Wood Fiber Sci. 14: 4–36.Search in Google Scholar
Ghazil, S. (2010). Étude de la migration des fluides dans le bois. Thèse de doctorat thesis. Nancy: Université Henri Poincaré.Search in Google Scholar
Howard, E.T. and Manwiller, F.G. (1968). Anatomical characteristics of southern pine stemwood. Wood Sci. 2: 77–86.Search in Google Scholar
Kak, A.C. and Slaney, M. (2001). Principles of computerized tomographic imaging. Classics in applied mathematics, Vol. 33. Philadelphia: Society for Industrial and Applied Mathematics.10.1137/1.9780898719277Search in Google Scholar
Kobori, H., Gorretta, N., Rabatel, G., Bellon-Maurel, V., Chaix, G., Roger, J.-M., and Tsuchikawa, S. (2013). Applicability of Vis-NIR hyperspectral imaging for monitoring wood moisture content (MC). Holzforschung 67: 307–314. https://doi.org/10.1515/hf-2012-0054.Search in Google Scholar
Kollmann, F.F.P. and Côté, W.A. (1968). Principles of wood science and technology: I solid wood, Vol. 1. Springer-Verlag, New York.10.1007/978-3-642-87928-9Search in Google Scholar
Liese, W. and Bauch, J. (1967). On the closure of bordered pits in conifers. Wood Sci. Technol. 1: 1–13. https://doi.org/10.1007/bf00592252.Search in Google Scholar
Lindgren, O. (1992). Medical CT-scanners for non-destructive wood density and moisture content measurements. Thesis, Luleå University of Technology.Search in Google Scholar
Longuetaud, F., Mothe, F., Leban, J.-M., and Mäkelä, A. (2006). Picea abies sapwood width: variations within and between trees. Scand. J. For. Res. 21: 41–53. https://doi.org/10.1080/02827580500518632.Search in Google Scholar
Martin, B., Colin, J., Lu, P., Mounkaila, M., Casalinho, J., Perré, P., and Rémond, R. (2021). Monitoring imbibition dynamics at tissue level in Norway spruce using X-ray imaging. Holzforschung 75: 1081–1096. https://doi.org/10.1515/hf-2020-0269.Search in Google Scholar
McGinnes, E.A. and Rosen, H.N. (1984). Macroscopic and microscopic analyses of color changes of wood pressure steam-dried above atmospheric pressure. Wood Fiber Sci. 16: 48–56.Search in Google Scholar
Niemz, P. and Mannes, D. (2012). Non-destructive testing of wood and wood-based materials. J. Cult. Herit. 13: S26–S34. https://doi.org/10.1016/j.culher.2012.04.001.Search in Google Scholar
Nuopponen, M., Vuorinen, T., Jämsä, S., and Viitaniemi, P. (2003). The effects of a heat treatment on the behaviour of extractives in softwood studied by FTIR spectroscopic methods. Wood Sci. Technol. 37: 109–115. https://doi.org/10.1007/s00226-003-0178-4.Search in Google Scholar
Parham, R.A. and Gray, R.L. (1984). Formation and structure of wood. In: Rowell, R. (Ed.), The chemistry of solid wood. Advances in Chemistry. Washington, DC: American Chemical Society, pp. 3–56.10.1021/ba-1984-0207.ch001Search in Google Scholar
Perré, P. (2007). Fundamentals of wood drying. Nancy: ARBOLOR.Search in Google Scholar
Perré, P. (2011). A review of modern computational and experimental tools relevant to the field of drying. Dry. Technol. 29: 1529–1541. https://doi.org/10.1080/07373937.2011.580872.Search in Google Scholar
Perré, P. and Turner, I.W. (2001). Determination of the material property variations across the growth ring of softwood for use in a heterogeneous drying model. Part 2. Use of homogenisation to predict bound liquid diffusivity and thermal conductivity. Holzforschung 55: 417–425. https://doi.org/10.1515/hf.2001.069.Search in Google Scholar
Petty, J.A. and Preston, R.D. (1970). Permeability and structure of the wood of Sitka spruce. Proc. R. Soc. Lond. Ser. B Biol. Sci. 175: 149–166.10.1098/rspb.1970.0016Search in Google Scholar
Petty, J.A. and Puritch, G.S. (1970). The effects of drying on the structure and permeability of the wood of Abies grandis. Wood Sci. Technol. 4: 140–154. https://doi.org/10.1007/bf00365299.Search in Google Scholar
Plavcová, L., Jansen, S., and Hacke, U. (2015). Functional and ecological xylem anatomy. University of Alberta, Edmonton, AB, Canada.Search in Google Scholar
Polge, H. (1978). Fifteen years of wood radiation densitometry. Wood Sci. Technol. 12: 187–196. https://doi.org/10.1007/bf00372864.Search in Google Scholar
Sandberg, K. (2009). Norway spruce heartwood: properties related to outdoor use, Thesis. Skellefteå: Luleå University of Technology.Search in Google Scholar
Sandberg, K. and Salin, J.-G. (2012). Liquid water absorption in dried Norway spruce timber measured with CT scanning and viewed as a percolation process. Wood Sci. Technol. 46: 207–219. https://doi.org/10.1007/s00226-010-0371-1.Search in Google Scholar
Scheiding, W., Direske, M., and Zauer, M. (2016). Water absorption of untreated and thermally modified sapwood and heartwood of Pinus sylvestris L. Eur. J. Wood Wood Prod. 74: 585–589. https://doi.org/10.1007/s00107-016-1044-z.Search in Google Scholar
Schmidt, E. and Riggio, M. (2019). Monitoring moisture performance of cross-laminated timber building elements during construction. Buildings 9: 144. https://doi.org/10.3390/buildings9060144.Search in Google Scholar
Schoch, W., Heller, I., Schweingruber, F., Kienast, F., and Schmatz, C. (2004). Wood anatomy of central European species, Available at: www.woodanatomy.ch.Search in Google Scholar
Siau, J.F. (1984). Transport process in wood. Berlin: Springer-Verlag.10.1007/978-3-642-69213-0Search in Google Scholar
Stamm, A.J. (1967). Movement of fluids in wood. Part I: flow of fluids in wood. Wood Sci. Technol. 1: 122–141. https://doi.org/10.1007/bf00353384.Search in Google Scholar
Taylor, A.M., Gartner, B., and Morrell, J.J. (2002). Heartwood formation and natural durability - a review. Wood Fiber Sci. 34: 587–611.Search in Google Scholar
Thomas, R.J. and Kringstad, K.P. (1971). The role of hydrogen bonding in pit aspiration. Holzforschung 25: 143–149, doi:https://doi.org/10.1515/hfsg.1971.25.5.143.Search in Google Scholar
Tondi, G., Thevenon, M.F., Mies, B., Standfest, G., Petutschnigg, A., and Wieland, S. (2013). Impregnation of Scots pine and beech with tannin solutions: effect of viscosity and wood anatomy in wood infiltration. Wood Sci. Technol. 47: 615–626. https://doi.org/10.1007/s00226-012-0524-5.Search in Google Scholar PubMed PubMed Central
Trouy, M.-C. (2015). Anatomie du bois: formation, fonctions et identification, Editions Quæ, Versailles., ISSN: 1777-4624.Search in Google Scholar
Tyree, M.T. and Ewers, F.W. (1991). The hydraulic architecture of trees and other woody plants. New Phytol. 119: 345–360. https://doi.org/10.1111/j.1469-8137.1991.tb00035.x.Search in Google Scholar
Wardrop, A.B. and Davies, G.W. (1961). Morphological factors relating to the penetration of liquids into wood. Holzforschung 15: 129–141.10.1515/hfsg.1961.15.5.129Search in Google Scholar
Wilson, K. and White, D.J.B. (1986). The anatomy of wood: its diversity and variability. London: Stobart & Son Ltd.Search in Google Scholar
Zhou, M., Caré, S., King, A., Courtier-Murias, D., Rodts, S., Gerber, G., Aimedieu, P., Bonnet, M., Bornert, M., and Coussot, P. (2019). Wetting enhanced by water adsorption in hygroscopic plantlike materials. Phys. Rev. Res. 1: 033190. https://doi.org/10.1103/physrevresearch.1.033190.Search in Google Scholar
Zimmermann, M.H. (1983). Xylem structure and the ascent of sap. Berlin, Heidelberg: Springer.10.1007/978-3-662-22627-8Search in Google Scholar
© 2022 Walter de Gruyter GmbH, Berlin/Boston
Articles in the same Issue
- Frontmatter
- Original Articles
- Comparison of VIS/NIR spectral curves plus RGB images with hyperspectral images for the identification of Pterocarpus species
- CT investigation of 3D liquid pathways in the anatomical structure of Norway spruce wood during imbibition
- A tailored fast thioacidolysis method incorporating multi-reaction monitoring mode of GC-MS for higher sensitivity on lignin monomer quantification
- In situ microstructural evolution of spruce wood during soda pulping using synchrotron X-ray tomography
- Bacterial decay in waterlogged archaeological compression wood varies with severity of compression wood
- Enhancing the mechanical properties and hydrophobicity of heat-treated wood by migrating and relocating sulfonated lignin
- Effect of post-heat treatment on fire retardant treated wood properties
- Optical properties of transparent wood composites prepared using transverse sections of poplar wood
- Short Notes
- XET activity determination in powdered wood samples as an indicator of tension wood, tested on juvenile Populus x euramericana exposed to severe long-term static bending
- Natural tyrosinase inhibitors from Betula platyphylla barks