Wood-adhesive bond loaded in mode II: experimental and numerical analysis using elasto-plastic and fracture mechanics models
-
Václav Sebera

 ,
Jaka Gašper Pečnik
,
Boris Azinović
,
Jaromír Milch
and
Sabina Huč
,
Jaka Gašper Pečnik
,
Boris Azinović
,
Jaromír Milch
and
Sabina Huč

Abstract
The goal of the study was to analyze fracture properties of adhesive bond using a three-point end-notched flexure test and the compliance-based beam method. Critical strain energy release rates (GIIc) and cohesive laws were obtained for adhesive bonds made of European beech (Fagus sylvatica L.) and adhesives such as EPI, MUF, PRF and PUR. The experiments were assisted with FE analyses employing three different material models of wood: elastic (Elas), symmetric elasto-plastic (EP) and elasto-plastic with different compressive and tensile yield stresses parallel to fiber (EP+). The highest mean GIIc was achieved for PUR (5.40 Nmm−1) and then decreased as follows: 2.33, 1.80, 1.59 Nmm−1 for MUF, EPI, and PRF, respectively. The failure of bondline was brittle and occurred at bondline for EPI, MUF and PRF, and ductile and commonly occurring in wood for PUR adhesive. The FE simulations employing cohesive models agreed well with the experimental findings for all adhesives. FE model with Elas material was found accurate enough for EPI, MUF and PRF adhesives. For PUR adhesive, the model EP+ was found to be the most accurate in prediction of maximal force. The impact of friction between lamellas may be up to 4.2% when varying friction coefficient from 0 to 1. The impact of the grain angle distortion (α) with respect to longitudinal specimen axis showed its high influence on resulting stiffness and maximal force. It was found that three-point end-notched test is suitable for EPI, MUF, and PRF, while it is less appropriate for a bond with PUR adhesive due to notable plastic behavior.
1 Introduction
Adhesive bonding of wood in any shape and size is necessary for production of modern wood products. For the production of high-performance wood composites, a fundamental understanding of adhesive bond behavior and properties, including involved materials, is essential (Stoeckel et al. 2013). Mechanical tests of adhesive materials are primarily made on a macroscopic scale (e.g., following EN 302-1 2013), but microscopic investigations also bring important findings about adhesive bond, especially when coupled with X-ray µCT (McKinley et al. 2018). Adhesive-wood complex is a very complicated mechanical system where many local events such as non-uniform cracking in adherend/adhesive, fiber bridging, etc. occur and, therefore, use of full-field technique such as digital image correlation (DIC) is advantageous when analyzing strains and crack openings around the bond area (Brault et al. 2013; Kamke et al. 2014; McKinley et al. 2019). An adhesive bond between adherents is strongly affected by the quality of manufacturing, which, consequently, significantly affects the physical properties of the bond and its service life in a material or construction. To investigate mechanical performance of adhesive bonds, lap shear test is often employed to reveal the basic properties such as shear strength of wood-adhesive complex. Adhesive bond can have similar and higher bearing capacity and stiffness to bonds using dowels connecting lamellas in laminated beams (Jelušič and Kravanja 2018). Another important property of adhesive bond is the fracture energy that needs to be spent on adhesive bond to initiate and propagate the crack in wood-adhesive complex. Fracture energy, specifically strain energy release rate (G), can be studied in three fundamental modes: mode I (tension), mode II (in-plane shear) and mode III (out-of-plane shear) as well as in mixed modes (Anderson 1995).
In the last two decades, the measurement of G in mode II (GII) has undergone a big development from simple analytical models, over superposition, to models considering crack tip openings and compliance-based methods (Arrese et al. 2010; Wang and Qiao 2004; Yoshihara 2005). Models including crack propagation phenomena are most accurate because of their direct relation to strain energy release. This approach was successfully proved for both synthetic and wood-based composites (Matsumoto and Nairn 2009; Wang et al. 2009) and modified wood (Kutnar et al. 2008). Mode II fracture is often tested in bending by employing end-notched flexural tests (ENF), either in three-point (3ENF) or four-point (4ENF) schemes, or so-called end loaded split (ELS) tests (Silva et al. 2007). All reveal comparable and reliable data if certain qualitative measurement conditions and sample dimensions, such as span-to-height ratio, are met (Schuecker and Davidson 2000; Yoshihara 2001). Yoshihara and Ohta (2000) found that fracture properties of wood are dependent on a ratio of initial crack length and half span, which has to be considered in experimental designs. De Moura et al. (2006) employed a so-called equivalent crack length approach (ECLA) and incorporated it into the compliance-based beam method (CBBM). This combination was shown to be advantageous because it did not require tracking of crack propagation, which can be conveniently derived directly from the current compliance. Also, using Iosipescu specimen geometry and Arcan test was successfully demonstrated to reveal fracture properties of orthotropic materials (Khansaria et al. 2019; Murata et al. 2017).
Use of ECLA on pine wood was shown by Silva et al. (2006), who also developed the finite element (FE) model of crack propagation for wood in mode II that was successfully verified by ECLA. For medium density fiberboard, ECLA shows that fracture toughness in mode II continuously increased during crack propagation (Yoshihara 2010). Because of its relative ease, ENF in combination with ECLA is well suited for analysis of wood-adhesive bonds, too (Xavier et al. 2011), and for determination of cohesive zone models of a material (Silva et al. 2014; Xavier et al. 2014) or for adhesive bonds of composite materials (Fernandes et al. 2013). Cohesive laws are especially important as input data in numerical modeling of composite materials and structures. Using DIC and FEM may conveniently provide data enabling separation of mode I and mode II without considering local elastic mechanical properties as shown in Meite et al. (2013). More recently, Clerc et al. (2019) showed a simplified four-point ENF test to examine GII for the adhesive bond of wood and PRF and one-component PUR adhesives without the need for DIC. They showed that performance of all adhesive bonds has similar behavior under quasi-static loading in mode II.
In the last two decades, environmental aspects and considerations have pushed forestry to plant more broadleaved species that, consequently, initiated innovations in development of wood-based composites (WBCs) for glued timber structures (Vallée et al. 2017). Therefore, WBCs, such as GluedLaminated Timber (GLT), cross-laminated timber (CLT) and laminated veneer lumber (LVL), made from various hardwoods were developed, including hybrid softwood-hardwood compositions (Fortuna et al. 2019; Franke 2016; Pollmeier 2019; Tapia and Aicher 2018). Due to their advantageous properties, they can replace steel elements (e.g., trusses). Therefore, knowledge about mechanical performance of adhesive bond with hardwoods, including fracture properties, is necessary to utilize its potential in timber structures as well as to increase the use of local raw materials that will be crucial for next generations.
The general goal of the study was to provide more insight into fracture properties of adhesive bond for beech wood glued by various adhesives loaded in mode II. The specific objectives are: (i) to carry out 3ENF tests of adhesive bonds with Emulsion Polymer Isocyanate (EPI), Melamine-Urea Formaldehyde (MUF), Phenol-Resorcinol Formaldehyde (PRF) and Polyurethane (PUR) adhesives; (ii) to compute strain energy release rate of adhesive bond using ECLA and DIC data; (iii) to assess whether 3ENF tests are suitable for all the tested adhesives; (iv) to develop and validate finite element model of the test including contact and cohesive zone model; (v) to assess whether elasto-plastic material models of wood bring higher accuracy into FE modeling of crack growth for given adhesives, and (vi) to perform FE sensitivity analyses to examine an influence of friction and fiber angle on the outputs of 3ENF test.
2 Materials and methods
European beech wood (Fagus sylvatica L.) was used to prepare all the samples for testing. The samples were conditioned and submitted to 3ENF test. All tests were accompanied with a stereoscopic system to obtain optical data about the displacement slip around the crack tip (w) that was calculated by DIC later on.
2.1 Test specimens
Test specimens were cut from a defect-free board of European beech by cutting with standard band and circular saws. For the 3ENF test, the specimens were prepared with dimensions of 17 × 20 × 500 mm3 in radial (R), tangential (T) and longitudinal (L) directions, respectively, according to Yoshihara (2001) as orthotropic blocks and with the necessary span-to-height ratio to induce stable crack propagation and insignificant plastic deformation due to contact with supports and loading head (Figure 1). An artificial crack of length ≈ 182 mm was introduced in L direction at the end of the specimen across the whole width of the specimen. All the specimens were weighed and dimensionally measured prior to the mechanical testing and without crack introduced. Test groups were defined as follows: (i) bond with EPI adhesive (Advantage EP-915 FS); (ii) bond with MUF adhesive (Prefere 4535); (iii) bond with PRF adhesive (Cascosinol 1711 with hardener 2520); and (iv) bond with PUR adhesive (PURBOND PR 3105). Lamellas were bonded using the recommended amount, pressure, time and temperature (20 °C) for particular adhesive as follows: EPI – 400 g/m2, 1.4 MPa, 120 min; MUF – 460 g/m2, 1.4 MPa, 270 min; PRF – 535 g/m2, 1.0 MPa, 240 min; PUR – 790 g/m2, 1.2 MPa, 120 min.

(a) Scheme of sample geometry for 3ENF test with marked AoI for DIC analysis and two points (u+, u−) for obtaining displacement slip; L = 230 mm, L′ = 20 mm, a0 = 182 mm, b = 17 mm, h = 10 mm, α is fiber angle, R and T denote radial and tangential directions, respectively. The solid line represents crack, the dashed line represents adhesive bond. (b) Experimental setup at universal testing machine including stereovision set accompanied with lights.
2.2 Physical testing
3ENF tests were performed on a universal testing machine (UTM) Zwick/Roell Z050 equipped with a 50 kN load cell; the load rate was set to 3 mmmin−1 (Figure 1b). A deflection of the specimen was measured using cross-head of the UTM. The 3ENF provided force-deflection data that were further processed using CBBM and ECLA to obtain fracture properties. Before testing, Teflon paper was inserted into the crack to reduce friction between lamellas. At the side of the samples, a stochastic black-and-white speckle pattern was applied before testing to create the area of interest (AoI) for later computation of displacement slip using DIC (Figure 1a). All 3ENF tests were recorded at a 2 Hz acquisition rate by means of an optical stereo-vision system consisting of two 9MPx CCD cameras focusing on one side of the AoI. The optical system was synchronized with the UTM. The images were further processed in 3D-DIC software Aramis 2016 (GOM Inc.) to obtain the full-field displacements and compute the strains over the AoI. The analysis used a subset size of 27 × 27 px2 and a step size of 3 px. Postprocessing of the DIC results provided the displacement slip (w) that was obtained from two points at the introduced crack tip, one above and one below the assumed neutral axis (Figure 1a). The displacement slip is calculated from wII = |u+ − u−|, where u+ is for the upper component, u− is for the lower component and both are in horizontal directions. After removing invalid measurements, such as for weakly bonded specimens, the total count was 17, 19, 16 and 20 specimens for EPI, MUF, PRF and PUR adhesive, respectively.
2.3 Calculation of strain energy release rate
The theoretical derivation of the strain energy release rate (GII) by 3ENF and equivalent crack length (aeqv) has been described by Yoshihara (2010), and Fernandes et al. (2013), so it is omitted here only for principal steps. The ECLA procedure does not require crack length monitoring during the test and leads to direct derivation of GII respecting Irwin–Kies equation, which is for strain energy release rate as follows:
where P is force (N), aeqv is equivalent crack length (m), b and h are specimen width and height (m) respectively, Ef is flexural elastic modulus. The main advantage of such a data reduction scheme is that the R-curve, i.e., GII = f(aeqv), can be obtained solely from the force-deflection (P/δ) curve. To obtain the GII-wII curve, the procedure shown in Xavier et al. (2014) was followed. To derive the cohesive law, the GII-wII curve was truncated at the beginning of the steady-state crack propagation (i.e., at maximal force). The truncated GII-wII curve was then differentiated to obtain the cohesive law in mode II. For this purpose, a continuous logistic function Q(t) (Eq. (2)) was used to approximate the data points in the reconstruction of the fracture cohesive law. The logistic fit (Q) searched for parameters t, R and α with lowest residuals according to:
where Q is the logistic function, Qinf is curve maximum, t is quasi-time, R is symmetric inflection point, α is time decay constant. Once the continuous function of GII(wII) was obtained, the GII was differentiated to obtain cohesive law as follows:
where σII is stress (Pa) and wII is displacement slip (m). Above mentioned calculations were made on an averaged force-deflection (P/δ) curve. The average P/δ curve was obtained by calculating arithmetic mean P/δ curve from all specimens in the group. Average curve was subsequently fitted by polynomial of 6th degree, which resulted in representative P/δ curve for each group. These curves were further processed to calculate GII and critical strain-energy release rate (GIIc). To examine the differences between studied group mean values, single and multiple one-way analysis of variance test (one-way ANOVA) was used, assuming significance level of 0.05. The multiple 1way ANOVA was made using ‘multcompare’ function. This test provided answers whether adhesive groups differ in terms of Pmax and δ. Postprocessing, statistical analyses and other calculations were performed in Matlab 2014b (Mathworks Inc.).
2.4 Numerical modeling
The physical test carried out at UTM was modeled using finite element method (FEM) implemented in software Ansys 19.1 R1 (ANSYS Inc., USA). The 3D sample and boundary conditions reflected the physical test at UTM, so the geometry included the sample, steel supports and loading head (Figure 2). The wood material was modeled using quadratic finite element SOLID95, and the adhesive bond was modeled using cohesive zone model (CZM) and finite element INTER204. The traction-separation behavior in CZM was modeled using bilinear function, and the GII for this function was taken as a mean value from the measurement for given adhesive. Lamellas below and above the introduced crack were covered by quadratic contact elements (CONTA170 and TARGE174) to simulate their interaction during the bending test. This contact pair was modeled as flexible-to-flexible. The contact of wood with steel supports and loading head was modeled as rigid-to-flexible, so deformation of steel parts was neglected. The element size was set to 3 mm in longitudinal direction, but around supports and load head, the FE mesh was refined. Element size of 2 mm was set thickness-wise, so each lamella consisted of five elements in thickness. The total number of elements/nodes, including contact and cohesive ones, was 18000/55366. After validation of the FE model based on the comparison with experimentally obtained data, FE sensitivity analyses were performed to analyze an influence of: (i) friction coefficient between wooden lamellas (μWW) by varying it from 0 to 1; (ii) fiber angle with respect to the longitudinal axis of the specimen (α) from 0° to 18°; (iii) fiber angle with respect to the cross-section axes from 0° to 90°. The sensitivity analysis was performed to examine the impact of these three parameters on resulting P/δ curves, namely stiffness and Pmax.

Geometrical and finite element model of the 3ENF test.
Within the FE analyses, three material models of beech wood (Table 1) were employed: (i) orthotropic elastic model (Elas); (ii) orthotropic elasto-plastic model with the same compression and tension yield stresses (EP) and (iii) orthotropic elasto-plastic model with different compression and tension yield values (EP+). The first two models were taken from Milch et al. (2016). The third one was developed based on the second model using a procedure that aimed to extend the difference between compression and tension yield values while preserving Hill plasticity conditions (Hill 1983). The coefficient of friction between steel supports, loading head and wood was set constant to μsw = 0.33, and the same value was used for wood-wood interaction between wooden lamellas (μww), except for analysis of impact of μww on resulting P/δ response.
Material models of beech wood used in FE simulations (moisture content 12%).
| Elas | EL = 13439, ER = 1880, ET = 1031, GLR = 1608, GRT = 460, GLT = 1059 [MPa] νLR = 0.073, νRT = 0.360, νLT = 0.043 [−]. Taken from Milch et al. (2016). |
| EP (MPa) | Elas, σL,Te = σL,Co = 47.5, σR,Te = σR,Co = 9.49, σT,Te = σT,Co = 8.11, EL, Te, Tan = EL, Co, Tan = 10.39, ER, Te, Tan = ER, Co, Tan = 22.36, ET, Te, Tan = ET, Co, Tan = 14.38, ELR, Tan = 16.08, ERT, Tan = 7.61, ELT, Tan = 10.59, σLR = 12.6, σRT = 14.2, σLT = 12.6. Taken from Milch et al. (2016). |
| EP+ (MPa) | Elas, σL,Te = 114, σL,Co = 47.5, σR,Te = 8.03, σR,Co = 9.49, σT,Te = 8.59, σT,Co = 8.11, EL, Te, Tan = 0.001, EL, Co, Tan = 10.39, ER, Te, Tan = 0.001, ER, Co, Tan = 22.36, ET, Te, Tan = 0.001, ET, Co, Tan = 14.38, ELR, Tan = 16.08, ERT, Tan = 7.61, ELT, Tan = 10.59, σLR = 12.6, σRT = 14.2, σLT = 12.6 |
Ei is normal elastic modulus, Gij is shear elastic modulus, νij is Poisson’s ratio, σi,Te is yield stress in tension, σi,Co is yield stress in compression, σij is shear yield stress, Ei, Te, Tan is normal tangent modulus in tension, Ei Co, Tan is normal tangent el. modulus in compression, Eij, Tan is shear tangent el. modulus. Indices i and j characterize anatomical directions L, R, and T. Elas is orthotropic elastic model, EP orthotropic elasto-plastic with same tension and compression behavior, and EP+ is orthotropic elasto-plastic with different behavior in compression and tension parallel to fiber.
3 Results and discussion
3.1 End-notched flexural tests
The analytical calculation of strain energy release rate (GII) follows the equivalent crack length approach (ECLA) for determination of the resistance curve (R-curve) that is explicitly determined from the experimental force-displacement (P/δ) curves (Figure 3). Figure 3 shows that slopes of the elastic zone for all samples is more or less within the same range no matter what adhesive was used; the scatter in stiffnesses may be explained by natural variability of wood properties rather than the type of adhesive. Mean values and standard deviations (in brackets) for flexural stiffnesses (Ef), as calculated according to Eq. (3) in Silva et al. (2014), are 16.1 GPa (251 MPa), 15.6 GPa (563 MPa), 19.0 GPa (434 MPa) and 16.9 GPa (327 MPa) for EPI, MUF, PRF, and PUR adhesive, respectively. Multiple one-way ANOVA test for Ef revealed that all groups do not have significantly different means (at α = 0.05). The moisture content (MC) level of all groups was also proved as statistically equal using an ANOVA test and was in a range of 10.5–11.0%; the same holds true for the density having mean values between 705 and 728 kg/m3. These results imply that adhesive type did not influence mean Ef for the groups. Further, the highest maximal force (Pmax) and maximal deflection at Pmax (δmax) was achieved for PUR adhesive that also possesses significant plastic region between yield point and Pmax. This fact implies that PUR group has the highest apparent fracture toughness (i.e., area under the P/δ curve), which can be attributed to adhesive properties having a larger range of elastic and plastic deformation compared to other studied adhesives. On the other hand, EPI and PRF adhesives showed the most brittle-like behavior because deflection at Pmax is lowest, so they would likely have the lowest apparent fracture toughness among studied adhesives.

Experimental and numerical P/δ curves for tested adhesives.
Variability of Pmax and δmax for all adhesive groups is shown in the box plots in Figure 4. As seen in the EPI, MUF and PRF are more alike, contrary to PUR that has a significantly higher median value (red line in box plot). A one-way ANOVA test for adhesive groups revealed the same findings for both Pmax and δmax. For both physical quantities, significant differences between mean values were found only between PUR and all other adhesives (α = 0.05). This phenomenon can be attributed to both higher elastic and plastic capacity of adhesive and plastic deformation that occurred in wood due to bending. PUR adhesive belongs with the elastomeric adhesives that show rigidity comparable to other used adhesives, but it also shows higher flexibility due to the aliphatic portions of the polymer, which could contribute to this behavior (Troughton 2009). Martins et al. (2019) examined the same groups of adhesives as in the presented study, but they did so only in terms of shear strength according to EN 14080. Their results showed very similar shear strengths and force vs. deflection diagrams in terms of both elastic and plastic ranges of strain for all adhesives, which is slightly different from findings of this study where PUR group had the highest Pmax. However, PUR group results may be partially attributed to significant plastic strains developed in wood due to bending. It is also necessary to mention Martins et al. (2019) used a different test, with higher strain rate (failure till 20 s) and different wood species (Maritime pine), so the comparison with this case is only partially valid. The effect of the bonding pressure on Pmax was not studied in this work, but Santos et al. (2019) found no differences in shear strength of Maritime pine elements glued with PUR adhesive in this respect. Despite the pressure applied to the analyzed adhesives being slightly different, due to their specific technical recommendations, it is assumed it did not influence the test to a great extent, so it will not be discussed further. Mean relative difference between deflections at Pmax obtained by cross-head and DIC was 2.57%.

Box plots showing variability for tested adhesives in terms of Pmax (left) and δmax (right). The red line denotes median value, plus denotes outliers.
3.2 DIC analysis
Optical image series were processed with 3D-DIC software (Aramis), which provided displacements in three directions with respect to fiber direction (L, R, T), normal strains in two directions (εLL, εRR) and shear strain (εLR). Since mode II is shear mode, εLR is the best to show strain concentration at the bondline (Figure 5a). Figure 5a clearly shows the shear opening and deformation at the adhesive bondline and, further, two points below and above the crack tip (green dots) that enabled obtaining displacement slip (wII). The typical experimental horizontal displacements (u+ and u−) for these two points are plotted in Figure 5b. It shows that the horizontal displacement below and above the sample’s ideal neutral axis (NA) follows different paths which, consequently, creates the wII; it may also identify linear zones and a moment of Pmax where the specimen failed. The position of these points is crucial for further correct calculations of GII. These points should be located as close as possible to a crack tip that is ideally located at the NA. However, to achieve this for bonded wood lamellas is very difficult due to variability of wood properties, their geometry and possible different elastic moduli in tension and compression as found for various species, for instance for beech at MC below 13% (Ozyhar et al. 2013) or for cherry and walnut (Bachtiar et al. 2017). In addition to the unknown position of the NA, these uncertainties contribute to the fact that it is very difficult to obtain true fracture toughness in mode II for wood-bonded specimens. Figure 5c shows three pairs of points above and below NA and their horizontal displacements vs. relative time (pseudo-time of analysis) obtained from FE model that has symmetry of both material properties and geometry with respect to the NA. Curves are paired from outer to inner, and they demonstrate that the closer the pair of points is to the NA, the greater the displacement slip (wII) is, in this case, wII is 2, 4 and 6 mm. The wII is important for deriving a track-separation model, as seen below.
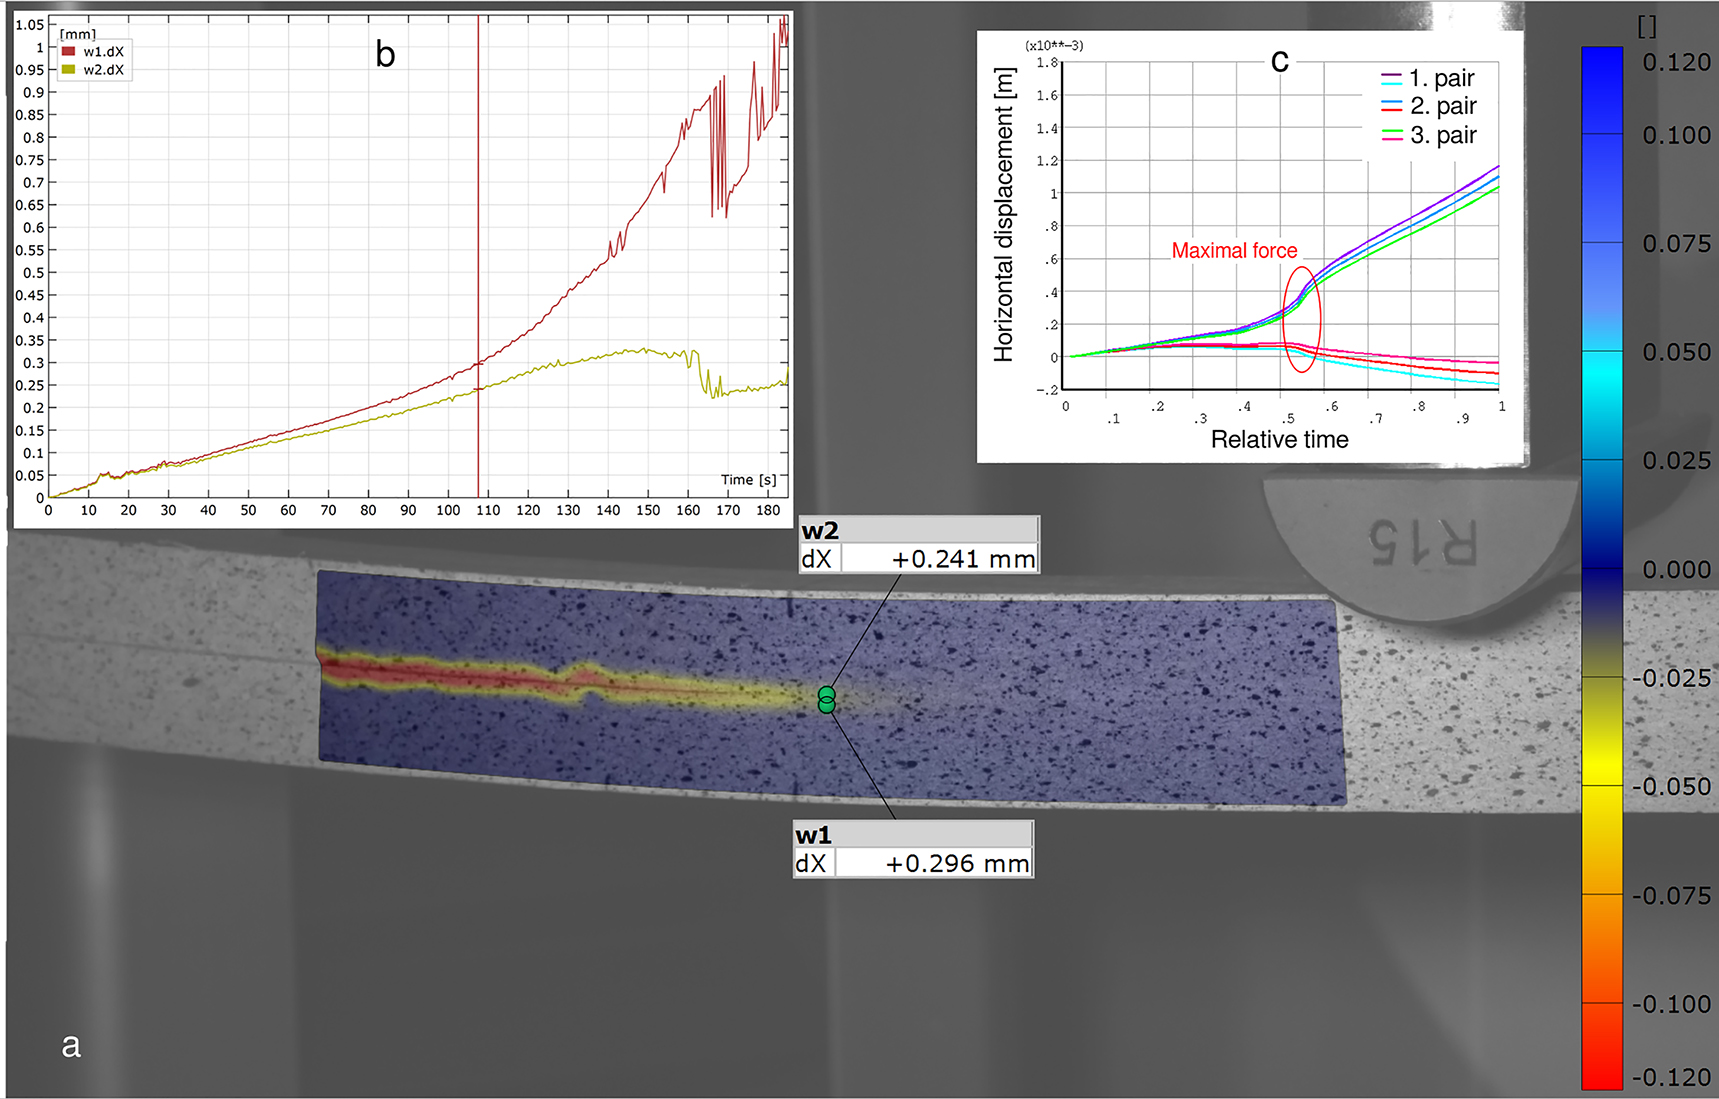
(a) Shear strain (εxy) computed using DIC with the two points used for calculation of displacement slip highlighted (w). (b) Graph showing displacements in horizontal direction vs. time for the two green points at crack tip; (c) horizontal displacements from FE simulation for 3 pairs of points with various vertical distance from the crack tip.
The w versus deflection for all specimens, including the averages for all adhesive groups, is presented in Figure 6. For the EPI, MUF and PRF adhesives, it shows mild increase with loading, and at the point of reaching elastic limit, the curves start progressing steeply. PUR group does not have such rapid change of steepness at the elastic limit. As visible, scatter of the w is very high, especially after reaching the elastic limit. The scatter is caused by progression of the crack at the bondline that often has a tooth-like effect on a curve. Progression of the crack was not studied for individual specimens, so it is not possible to say whether it happened in the wood or adhesive for a given tooth-like step. Looking at the PUR, it may also be noticed that the polynomial curve experiences an inflection point at a deflection of about 25 mm. This is caused by w data and could be removed by limiting to a certain maximal deflection. However, because the Pmax was achieved for several specimens after deflection of 25 mm, it would not be consistent to do this within the group and, therefore, it was left it as it is. The question that arises from results of PUR (Figures 3 and 6) is whether the methodology used is convenient for testing wood-adhesive bonds made with PUR or PUR-like adhesives, i.e., adhesives with large elastic and plastic strain capacity. Furthermore, using 3D-DIC cannot fully assist in exploration of microcracking at adhesive bond loaded in mode II at such a level of observation. Wood-adhesive bond is a very different situation compared to the adhesive bonds in man-made composites (e.g., carbon-adhesive) where identification of differences for adhesives of various toughness is possible, including the pattern of microcracking because the crack predominantly propagates through adhesive (Bradley 1991). Therefore, displaying raw data is important and useful for wood-adhesive bondline because it may reveal common phenomena within individual specimen’s behavior.

Displacement slip (w) vs. deflection for tested adhesives. Raw data are plotted as grey. The black dashed line represents arithmetic average of curves, and the blue solid line is polynomial fit of 6th degree.
3.3 Strain energy release rate and cohesive model
The procedure of ECLA and Eq. (1) for average P/δ curves and average w enabled to obtain a relationship between GII and equivalent crack length (aeq). The result of this procedure is shown in Figure 7a as four average curves for particular adhesive groups. The curves include mean critical strain energy release rate GIIc (denoted as red asterisk), which attributes for Pmax. The mean GIIc is 1.80, 2.33, 1.59 and 5.40 Nmm−1 for EPI, MUF, PRF and PUR, respectively. PUR has the highest GIIc because the Pmax was achieved much later after reaching the elastic limit for other groups of adhesives. All obtained mean values of GIIc are higher than the value for clear beech wood (1.41 Nmm−1) at similar MC presented by Sebera et al. (2019). However, with respect to wood variability, it can be claimed that only EPI, MUF and PUR have likely significantly higher GIIc than mentioned value of clear wood due to a presence of adhesive bond. The increase of shear stiffness and shear strength due to a presence of adhesive bondline may happen; for instance, it was reported for balsa wood tested in pure shear using Iosipescu specimens (Osei-Antwi et al. 2013). Such increase is attributed to higher rigidity and shear strength of adhesive compared to wood at loaded plane. From a practical perspective, it is important to know that adhesive bond enhances stiffness and strength of beam elements which might be used to an advantage when designing timber construction elements.

(a) Average strain energy release rate (GII) vs. average equivalent crack length (aeq). Red asterisk denotes average critical strain energy release rate at Pmax (GIIc). (b) Average GII vs. average displacement slip (wII). Red lines represent data up to GIIc and blue lines represent logistic function fitted to the averaged curves. (c) Cohesive model computed by differentiating logistic functions (blue part of the curves) shown in Figure 7b and extrapolated cohesive model using Gaussian fit from Table 1 (red dashed parts of curves).
Using Eq. (2) enabled to find parameters to fit the relationships of GII vs. wII with a logistic function. This functional fit, together with average curves ending at GIIc, is plotted in Figure 7b. The use of logistic function decreased the value of GIIc, which is the value logistic function asymptotically converges to on a given range.
It may also be noticed that those fits do not start at zero of the y-axis, which is due to the fact that the best logistic fit to the GII vs. wII data was used. Differentiation of the logistic curves following Eq. (3) led to a cohesive model for studied adhesives (Figure 7c). The fact that logistic curves do not have a zero tangent at position of x = 0 resulted in cohesive models that do not start at zero y-axis (stress) positions (see blue sections of the curves in Figure 7c). Such cohesive models are not complete; i.e., the area under the curves is not equal to the GIIc, so they need to be extrapolated up to y = 0. For this, the Gaussian model of 2nd order (GM2) was used, and the result of the fit is listed in Table 1 and plotted as red dashes on the cohesive model in Figure 7c. The GM2 has a form of a1 × e(−((x − b1)/c1)ˆ2) + a2 × e(−((x − b2)/c2)ˆ2), where x is variable and e is Euler’s number. It is also necessary to mention a certain error affecting the derivation of GII stemming from the fact that residual stresses in specimens were neglected. This also implies that obtained toughness is apparent and not true. However, assessing this issue is out of the scope of this study; a method to address this problem was published for double cantilever beams loaded in mode I (Nairn 2000).
3.4 FE model
Cohesive models for all adhesives in the form of 2nd order Gaussian function in Table 2 can be easily transformed into the bilinear cohesive model (BCM) because the Gaussian fit is an evenly symmetric function. The BCM presented in Table 2 was used in FE simulations of the physical test for all adhesives. The results of the simulations are shown in Figure 3 as three solid lines (black for Elas, green for EP and red for EP+). FE prediction of force-displacement response in the elastic part of the test is sufficient compared to polynomial fit (blue line); only the PRF group shows a certain bump in the middle of the elastic part due to using arithmetic average as the base for polynomial fit. An agreement of FE model with the experiments regarding stiffness is determined by an orthotropic material model taken from the literature (Milch et al. 2016). This implies that wood used in this work had very similar properties as one in the Milch et al. (2016), despite the fact that both woods came from different growing positions within the region of Central Europe.
Coefficients for 2nd order Gaussian fits (R>0.99 for all) and data for bilinear cohesive model.
| Group | a1 | a2 | b1 | b2 | c1 | c2 | GIic (Nmm−1) | σmax (MPa) | wmax (mm) |
|---|---|---|---|---|---|---|---|---|---|
| EPI | 5.062 | 6.096 | 0.06555 | 0.06649 | 0.09984 | 0.05697 | 1.51 | 11.2 | 0.25 |
| MUF | 4.433 | 3.56 | 0.1166 | 0.1153 | 0.1068 | 0.187 | 2.02 | 7.99 | 0.43 |
| PRF | 5.783 | 4.816 | 0.06234 | 0.06144 | 0.05283 | 0.09262 | 1.33 | 10.6 | 0.24 |
| PUR | 3.693 | 6.161 | 0.3222 | 0.324 | 0.204 | 0.3507 | 4.69 | 9.85 | 0.80 |
σmax is the peak of the bilinear model and wmax is displacement slip at the σmax.
The prediction of FE models in terms of relative difference (RD) regarding the maximal force (Pmax) is shown in Table 3. It shows that using the elastic model with cohesive zone predicts Pmax very accurately for EPI, MUF and PRF groups (RD <5%), but for the PUR adhesive it reaches RD about 13.5%. The EP material model predicts Pmax within the same accuracy as the elastic one (RD <5.2%), except for the PUR, which has RD of about 15%. This is due to the fact that wood in PUR group started to plasticize parallel to the fiber before reaching stress needed to open the crack. The crack in PUR group opened later at higher load levels and propagated less than for other adhesive groups. This is clearly visible from the green line in Figure 3 that shows the scenario of beech wood with the same tensile and compressive yield stresses. The FE model with EP+ material predicts Pmax with the lowest RD’s (<3.4%); although for EPI, MUF and PRF adhesive, it sometimes exceeds RD compared to Elas and EP material models. The biggest improvement in using EP+ was achieved for PUR adhesive, whose RD decreased to −3.35%. This means the material model with different tensile and compressive yield stresses is the most suitable for modeling PUR-like adhesives for this test. Illustration of this phenomenon when using EP+ material model for the 3ENF test is depicted in Figure 8. It shows that when using elastic material only (Figure 8a), the maximal deflection, and also maximal compressive strain (3rd principal strain ≈ 0.013), occur in the middle of the specimen; meanwhile, when using EP+ material (Figure 8b), the maximal deflection and compressive strain (3rd principal strain ≈ 0.037) occur away from the specimen center near the introduced crack tip due to reaching yield stress in compression parallel to fiber in the upper part of lamellas. This phenomenon was also observed within the experiments with the PUR group that showed the highest deflection and failure at the crack tip (Figure 8c).
Relative differences of FE models (%) for various material models of beech wood (constant friction coefficient and no fiber angle distortion), ΣRD is summation of absolute values of RD’s of all groups for given material model.
| Material model | EPI | MUF | PRF | PUR | ΣRD |
|---|---|---|---|---|---|
| Elas | 4.15 | 0.28 | 2.52 | 13.5 | 20.45 |
| EP | 0.92 | −5.14 | −0.16 | −14.8 | 21.04 |
| EP+ | 2.74 | −3.27 | −0.47 | −3.35 | 9.83 |

(a) Computed 3rd principal strain at max. deflection for PUR adhesive with Elas material. (b) Computed 3rd principal plastic strain for PUR at δmax with EP+ material. (c) Typical specimen from PUR group with denoted specimen center (grey line) and the δmax at crack tip (red ellipse), photographed after the test.
To evaluate the most precise material model of wood for all adhesive bonds altogether, the summation of absolute values of RD’s for a given material model can be used (see ΣRD in Table 3). Then, the EP+ performs the best, followed by Elas and EP. However, for a quick, simple, valid and sound prediction of Pmax, the orthotropic elastic material model is a high-quality choice for EPI, MUF and PRF adhesive bonds. To model adhesive bonds made with PUR, this work suggests using orthotropic elasto-plastic material models of wood with different tensile and compressive yield stresses. This holds true especially for Mode II-dominating problems or problems of bending where induced stresses might get higher yield than stress parallel to fiber of wood. This work implies that used geometrical configuration needs to be modified for testing PUR adhesive bond to achieve deformations only at adhesive bond, i.e., without having plastic strains at surface fibers of specimen. It has been shown that using orthotropic elasto-plastic material models to analyze phenomena occurring when wooden elements are mechanically loaded has become a valid approach leading to more precise predictions. This was demonstrated for clear pine wood (Pěnčík 2015), spruce and beech wood (Milch et al. 2017), and glulam beams made from softwoods with various connection surfaces (Uzel et al. 2018).
3.5 Friction
In the experiment, Teflon paper to reduce the friction between non-glued lamellas was used since it affects the measurement of force and displacement and, consequently, the obtained GII values. The FE model enabled analysis of the impact of friction coefficient between lamellas (μWW) on stiffness and Pmax of the specimen. The friction between specimen and steel grips was kept at constant value of μSW = 0.33. Varying μWW from 0 to 1 resulted in an increase in Pmax of ∼4.3% and increase of stiffness (P/δ) of ∼2.5%. The impact μWW on both is depicted in Figure 9a; only a scenario with EPI adhesive was computed to illustrate this effect. This means that it is physically justified to insert Teflon paper into the crack to obtain more precise results. The Teflon paper should be located right above the support where the highest contact pressure occurs (Figure 9b). Visual comparison of the two most typical failures that occurred is shown in Figure 9c. It shows that the failure of adhesive bond with PUR adhesive occurred primarily in wood (Figure 9c left); meanwhile, for EPI adhesive (Figure 9c right), it showed brittle-like failure at adhesive-wood interface, which was found to be a typical failure of PRF and MUF groups, too.

(a) FE analysis of impact of μWW on stiffness and Pmax. (b) FE computed friction stress (Pa) at introduced crack (red zone is located right above the support, top view). (c) Typical failure for PUR (left) and EPI & PRF (right). (d) FE analysis of impact of α on stiffness and Pmax using EP+ material. (e) FE analysis of impact of α on stiffness and Pmax using Elas material.
3.6 Fiber angle
The specimens for 3ENF test are relatively long (0.5 m) and, therefore, there is higher probability that fiber direction will not be precisely aligned with specimen main axis. Therefore, the impact of fiber angle distortion on Pmax and stiffness response with respect to longitudinal axis was analyzed using Elas and EP+ material models because these two were shown to be the best to simulate the 3ENF test for given adhesives. Results of these 80 simulations are displayed in Figure 9d and 9e. Figure 9e shows scenarios with Elas material, and it reveals the Pmax is more impacted by angle distortion than stiffness on average, e.g., at 6° angle distortion, Pmax is reduced by 5%; meanwhile, stiffness is reduced the same at an angle of 9°. It is clear that by using Elas material, all the adhesive groups behave very alike. On the contrary, using EP+ material shows that the more brittle the adhesive bond is, the less impact the fiber angle has on Pmax. For instance, for PUR, the 5% or RD is reached at 6°, but for EPI, this RD is achieved at 9°. The impact of grain angle on stiffness using EP+ is similar when Elas material is used. This concludes in a finding that adhesive bonds made by various adhesives react differently to grain angle distortion. If angle distortion below 4° is kept, the impact will be maximally 2.5% in RD for all the adhesives in terms of Pmax and even lower in terms of stiffness. FE analysis of the effect of fiber angle distortion at specimen cross section (RT plane) on stiffness and Pmax is not shown since it does not influence the behavior as much; changing the angle at RT plane from 0 to 90° impacted resulting Pmax until 2% and stiffness below 1%.
4 Conclusions
The presented work deals with an experimental and numerical assessment of fracture behavior for adhesive bond loaded in mode II using 3-point end-notched flexure tests when various adhesives are used. The work showed results for materials commonly used in wood composites and timber structures, and it also demonstrated applicability of the test to determine fracture properties of wood composites that are suitable for numerical modeling. The work resulted in several important findings that can be concluded as follows:
– Adhesive bond with EPI, PRF and MUF showed rather brittle behavior as the failure and crack occurred primarily at the interface of adhesive and wood. These three adhesives can be conveniently investigated by 3-point end-notched flexure test to obtain apparent fracture toughness and strain energy release rate (GII).
– Adhesive bond with PUR showed substantial nonlinear response due to plastic strains occurring in specimens’ outermost fibers and PUR elastomeric nature. This phenomenon was also confirmed by numerical analysis and, altogether, results suggest modifying the test configuration to reveal more accurate values of GIIc for bondline made with PUR. Failure and crack propagation in specimens with PUR bondline occurred mostly in wood.
– For EPI, MUF and PRF, elastic material model with cohesive zone offers accurate prediction of maximal force (relative difference below 5%) and character of failure.
– For PUR adhesive, elastic and elasto-plastic model with same tension and compression yields parallel to grain do not offer such high accuracy (relative difference ∼13.5%) compared to model with distinguished yield stresses in tension and compression parallel to fiber (rel. diff. ∼3.4%).
– Friction between wooden lamellas in 3-point end-notched flexure test has negligible effect on stiffness (max. ∼2%) and minor effect on Pmax (max. ∼4%). However, to get a more accurate GIIc, introducing any material to reduce friction in between lamellas is recommended.
– Grain angle distortion with respect to longitudinal specimen axis impacts the flexural stiffness and Pmax variously depending on adhesive type. In general, having fiber angle below 4° results in a maximal relative difference of 2.5%.
Funding source: Republic of Slovenia and the European Union’s European Regional Development Fund
Funding source: European Commission for funding the InnoRenew project (Grant Agreement #739574) under the Horizon 2020 Widespread-Teaming program
Award Identifier / Grant number: 739574
Funding source: Javna Agencija za Raziskovalno Dejavnost RS
Award Identifier / Grant number: P2-0273
Funding source: Slovenian Research Agency infrastructural program
Award Identifier / Grant number: IO-0035
Author contributions: All the authors have accepted responsibility for the entire content of this submitted manuscript and approved submission.
Research funding: The authors gratefully acknowledge the financial support from the European Commission for funding the InnoRenew project (grant agreement #739574) under the Horizon 2020 Widespread-Teaming program and the Republic of Slovenia (investment funding from the Republic of Slovenia and the European Union’s European Regional Development Fund), Slovenian Research Agency (Research Core Funding no. P2-0273), Slovenian Research Agency infrastructural program (IO-0035) and company KLP d.o.o. for providing the adhesives for testing.
Conflict of interest statement: The authors declare that they have no conflicts of interest.
References
Anderson, T. (1995). Fracture mechanics: fundamentals and applications, 2nd ed. B. Raton: CRC.Search in Google Scholar
Arrese, A., Carbajal, N., Vargas, G., and Mujika, F. (2010). A new method of determining mode II R-curve by the End-Notched Flexure test. Eng. Fract. Mech. 77: 51–70, https://doi.org/10.1016/j.engfracmech.2009.09.008.Search in Google Scholar
Bachtiar, E.V., Rüggeberg, M., and Niemz, P. (2017). Mechanical behavior of walnut (Juglans regia L.) and cherry (Prunus avium L.) wood in tension and compression in all anatomical directions. Revisiting the tensile/compressive stiffness ratios of wood. Holzforschung 72: 71–80, https://doi.org/10.1515/hf-2017-0053.Search in Google Scholar
Bradley, W.L. (1991). Understanding the translation of neat resin toughness into delamination toughness in composites. Key Eng. Mater. 37: 161–198, https://doi.org/10.4028/www.scientific.net/kem.3710.4028/www.scientific.net/kem.37.161.Search in Google Scholar
Brault, R., Germaneau, A., Dupre, J.C., Doumalin, P., Mistou, S., and Fazzini, M. (2013). In-situ analysis of laminated composite materials by X-ray micro-computed tomography and digital volume correlation. Exp. Mech. 53: 1143–1151, https://doi.org/10.1007/s11340-013-9730-9.Search in Google Scholar
Clerc, G., Brunner, A., Josset, S., Niemz, P., Pichelin, F., and Van de Kuilen, J.W.G. (2019). Adhesive wood joints under quasi-static and cyclic fatigue fracture Mode II loads. Int. J. Fatig. 123: 40–52, https://doi.org/10.1016/j.ijfatigue.2019.02.008.Search in Google Scholar
de Moura, M.F.S.F., Silva, M.A.L., de Morais, A.B., and Morais, J.J.L. (2006). Equivalent crack based mode II fracture characterization of wood. Eng. Fract. Mech. 73: 978–993, https://doi.org/10.1016/j.engfracmech.2006.01.004.Search in Google Scholar
EN 302-1 (2013). Adhesives for load-bearing timber structures – Test methods – Part 1: determination of bond strength in longitudinal tensile shear. European Committee for Standardization, Brussels, Belgium.Search in Google Scholar
Fernandes, R.M.R.P., Chousal, J.A.G., de Moura, M.F.S.F., and Xavier, J. (2013). Determination of cohesive laws of composite bonded joints under mode II loading. Compos. Part B 52: 269–274, https://doi.org/10.1016/j.compositesb.2013.04.007.Search in Google Scholar
Fortuna, B., Azinović, B., Plos, M., Šuligoj, T., and Turk, G. (2019). Tension strength capacity of finger joined beech lamellas. In: International scientific conference on hardwood processing. ISCHP, Delft, Netherlands, pp. 244–251.10.1007/s00107-020-01588-9Search in Google Scholar
Franke, S. (2016). Mechanical properties of beech CLT. World Conference for Timber Engineering (WCTE), Vienna, Austria.Search in Google Scholar
Hill, R. (1983). The mathematical theory of plasticity. Oxford University Press, New York.Search in Google Scholar
Jelušič, P. and Kravanja, S. (2018). Flexural analysis of laminated solid wood beams with different shear connections. Construct. Build. Mater. 174: 456–465.10.1016/j.conbuildmat.2018.04.102Search in Google Scholar
Kamke, F.A., Nairn, J.A., Muszynski, L., Paris, J.L., Schwarzkopf, M., and Xiao, X. (2014). Methodology for micromechanical analysis of wood adhesive bonds using X-ray computed tomography and numerical modeling. Wood Fiber Sci. 46: 15–28.Search in Google Scholar
Khansaria, N.M., Farrokhi, A., and Mosavid, A. (2019). Orthotropic mode II shear test fixture: iosipesque modification. Eng. Solid Mech. 7: 93–108.10.5267/j.esm.2019.4.003Search in Google Scholar
Kutnar, A., Kamke, F., Nairn, J., and Sernek, M. (2008). Mode II fracture behavior of bonded viscoelastic thermal compressed wood. Wood Fiber Sci. 40: 362–373.Search in Google Scholar
Martins, C., Dias, A.M.P.G., and Cruz, H. (2019). Bonding performance of Portuguese Maritime pine glued laminated timber. Construct. Build. Mater. 223: 520–529, https://doi.org/10.1016/j.conbuildmat.2019.06.143.Search in Google Scholar
Matsumoto, N. and Nairn, J.A. (2009). The fracture toughness of medium density fiberboard (MDF) including the effects of fiber bridging and crack-plane interference. Eng. Fract. Mech. 76: 2748–2757, https://doi.org/10.1016/j.engfracmech.2009.04.007.Search in Google Scholar
McKinley, P., Kamke, F.A., Sinha, A., De Andrade, V., and Jakes, J.E. (2018). Analysis of adhesive penetration into wood using nano-X-ray computed tomography. Wood Fiber Sci. 50: 66–76, https://doi.org/10.22382/wfs-2018-007.Search in Google Scholar
McKinley, P., Sinha, A., and Kamke, F.A. (2019). Understanding the effect of weathering on adhesive bonds for wood composites using digital image correlation (DIC). Holzforschung 73: 155–164, https://doi.org/10.1515/hf-2018-0024.Search in Google Scholar
Méité, M., Dubois, F., Pop, O., and Absi, J. (2013). Mixed mode fracture properties characterization for wood by digital images correlation and finite element method coupling. Eng. Fract. Mech. 105: 86–100, https://doi.org/10.1016/j.engfracmech.2013.01.008.Search in Google Scholar
Milch, J., Tippner, J., Sebera, V., and Brabec, M. (2016). Determination of the elasto-plastic material characteristics of Norway spruce and European beech wood by experimental and numerical analyses. Holzforschung 70: 1081–1092, https://doi.org/10.1515/hf-2015-0267.Search in Google Scholar
Milch, J., Brabec, M., Sebera, V., and Tippner, J. (2017). Verification of the elastic material characteristics of Norway spruce and European beech in the field of shear behaviour by means of digital image correlation (DIC) for finite element analysis (FEA). Holzforschung 71: 405–414, https://doi.org/10.1515/hf-2016-0170.Search in Google Scholar
Murata, K., Bachtiar, E.V., and Niemz, P. (2017). Determination of mode I and mode II fracture toughness of walnut and cherry in TR and RT crack propagation system by the Arcan test. Holzforschung 71: 985–990https://doi.org/10.1515/hf-2017-0063.Search in Google Scholar
Nairn, J.A. (2000). Energy release rate analysis for adhesive and laminate double cantilever beam specimens emphasizing the effect of residual stresses. Int. J. Adhesion Adhes. 20: 59–70, https://doi.org/10.1016/s0143-7496(99)00016-0.Search in Google Scholar
Osei-Antwi, M., de Castro, J., Vassilopoulos, A.P., and Keller, T. (2013). Shear mechanical characterization of balsa wood as core material of composite sandwich panels. Construct. Build. Mater. 41: 231–238, https://doi.org/10.1016/j.conbuildmat.2012.11.009.Search in Google Scholar
Ozyhar, T., Hering, S., and Niemz, P. (2013). Moisture-dependent orthotropic tension-compression asymmetry of wood. Holzforschung 67: 395–404, https://doi.org/10.1515/hf-2012-0089.Search in Google Scholar
Pěnčík, J. (2015). Modelling of experimental tests of wooden specimens from Scots pine (Pinus sylvestris) with the help of anisotropic plasticity material model. Drv. Ind. 66: 27–33.10.5552/drind.2015.1362Search in Google Scholar
Pollmeier. (2019). Comparison of BauBuche and other building materials. Pollmeier Massivholz GmbH & Co.KG, Available at: http://www.abc.net.au/science/articles/2009/03/31/2530686.htm?site=science&topic=latest.Search in Google Scholar
Santos, P., Correia, J.R., Godinho, L., Dias, A.M.P.G., and Dias, A. (2019). Bonding quality assessment of cross-layered Maritime pine elements glued with one-component polyurethane adhesive. Construct. Build. Mater. 211: 571–582, https://doi.org/10.1016/j.conbuildmat.2019.03.064.Search in Google Scholar
Schuecker, C. and Davidson, B.D. (2000). Evaluation of the accuracy of the four-point bend end-notched flexure test for mode II delamination toughness determination. Compos. Sci. Technol. 60: 2137–2146, https://doi.org/10.1016/s0266-3538(00)00113-5.Search in Google Scholar
Sebera, V., Redón-Santafé, M., Brabec, M., Děcký, D., Čermák, P., Tippner, J., and Milch, J. (2019). Thermally modified (TM) beech wood: compression properties, fracture toughness and cohesive law in mode II obtained from the three-point end-notched flexure (3ENF) test. Holzforschung 73: 663–672, https://doi.org/10.1515/hf-2018-0188.Search in Google Scholar
Silva, F.G.A., Morais, J.J.L., Dourado, N., Xavier, J., Pereira, F.A.M., and De Moura, M.F.S.F. (2014). Determination of cohesive laws in wood bonded joints under mode II loading using the ENF test. Int. J. Adhesion Adhes. 51: 54–61, https://doi.org/10.1016/j.ijadhadh.2014.02.007.Search in Google Scholar
Silva, M.A.L., de Moura, M.F.S.F., and Morais, J.J.L. (2006). Numerical analysis of the ENF test for mode II wood fracture. Compos. Part A-Appl. S 37: 1334–1344, https://doi.org/10.1016/j.compositesa.2005.08.014.Search in Google Scholar
Silva, M.A.L., Morais, J.J.L., de Moura, M.F.S.F., and Lousada, J.L. (2007). Mode II wood fracture characterization using the ELS test. Eng. Fract. Mech. 74: 2133–2147, https://doi.org/10.1016/j.engfracmech.2006.10.012.Search in Google Scholar
Stoeckel, F., Konnerth, J., and Gindl-Altmutter, W. (2013). Mechanical properties of adhesives for bonding wood—a review. Int. J. Adhesion Adhes. 45: 32–41, https://doi.org/10.1016/j.ijadhadh.2013.03.013.Search in Google Scholar
Tapia, C. and Aicher, S. (2018). A stochastic finite element model for glulam beams of hardwoods. World Conference for Timber Engineering (WCTE), Seoul, South Korea.Search in Google Scholar
Troughton, M.J. (Ed.) (2009). Chapter 17 - adhesive bonding in handbook of plastics joining, a practical guide, 2nd ed. William Andrew Publishing, pp. 145–173. Cambridge, UK, ISBN 9780815515814.10.1016/B978-0-8155-1581-4.50019-6Search in Google Scholar
Uzel, M., Togay, A., Anil, Ö., and Söğütlü, C. (2018). Experimental investigation of flexural behavior of glulam beams reinforced with different bonding surface materials. Construct. Build. Mater. 158: 149–163, https://doi.org/10.1016/j.conbuildmat.2017.10.033.Search in Google Scholar
Vallée, T., Tannert, T., and Fecht, S. (2017). Adhesively bonded connections in the context of timber engineering – a review. J. Adhes. 93: 257–287, https://doi.org/10.1080/00218464.2015.1071255.Search in Google Scholar
Wang, J. and Qiao, P. (2004). Novel beam analysis of end notched flexure specimen for mode-II fracture. Eng. Fract. Mech. 71: 219–231, https://doi.org/10.1016/s0013-7944(03)00096-1.Search in Google Scholar
Wang, W.X., Nakata, M., Takao, Y., and Matsubara, T. (2009). Experimental investigation on test methods for mode II interlaminar fracture testing of carbon fiber reinforced composites. Compos. Part A-Appl 40: 1447–1455, https://doi.org/10.1016/j.compositesa.2009.04.029.Search in Google Scholar
Xavier, J., Morais, J., Dourado, N., and De Moura, M.F.S.F. (2011). Measurement of mode I and mode II fracture properties of wood-bonded joints. J. Adhes. Sci. Technol. 25: 2881–2895.10.1163/016942411X576563Search in Google Scholar
Xavier, J., Oliveira, M., Morais, J.J.L., and De Moura, M.F.S.F. (2014). Determining mode II cohesive law of Pinus pinaster by combining the end-notched flexure test with digital image correlation. Construct. Build. Mater. 71: 109–115, https://doi.org/10.1016/j.conbuildmat.2014.08.021.Search in Google Scholar
Yoshihara, H. (2001). Influence of span/depth ratio on the measurement of mode II fracture toughness of wood by end-notched flexure test. J. Wood Sci. 47: 8–12, https://doi.org/10.1007/bf00776638.Search in Google Scholar
Yoshihara, H. (2005). Mode II initiation fracture toughness analysis for wood obtained by 3-ENF test. Compos. Sci. Technol. 65: 2198–2207, https://doi.org/10.1016/j.compscitech.2005.04.019.Search in Google Scholar
Yoshihara, H. (2010). Mode I and mode II initiation fracture toughness and resistance curve of medium density fiberboard measured by double cantilever beam and three-point bend end-notched flexure tests. Eng. Fract. Mech. 77: 2537–2549, https://doi.org/10.1016/j.engfracmech.2010.06.015.Search in Google Scholar
Yoshihara, H. and Ohta, M. (2000). Measurement of mode II fracture toughness of wood by the end-notched flexure test. J. Wood Sci. 46: 273–278, https://doi.org/10.1007/bf00766216.Search in Google Scholar
© 2020 Václav Sebera et al., published by De Gruyter, Berlin/Boston
This work is licensed under the Creative Commons Attribution 4.0 International License.
Articles in the same Issue
- Frontmatter
- Original articles
- Wood identification of two anatomically similar Cupressaceae species based on two-dimensional microfibril angle mapping
- Treatment of wood with atmospheric plasma discharge: study of the treatment process, dynamic wettability and interactions with a waterborne coating
- Impact of hygrothermal treatment on the physical properties and chemical composition of Moso bamboo (Phyllostachys edulis)
- Inverse characterisation of gradient distribution of the modulus of bamboo using a four-point bending test
- Correlation between bacterial decay and chemical changes in waterlogged archaeological wood analysed by light microscopy and Py-GC/MS
- Artificial neural networks modelling based on visual analysis of coated cross laminated timber (CLT) to predict color change during outdoor exposure
- Wood-adhesive bond loaded in mode II: experimental and numerical analysis using elasto-plastic and fracture mechanics models
- Influences of liquefied lignin content on the properties of waterborne polyurethane prepared with different chain extenders
- Composition and antioxidant properties of extracts from Douglas fir bark