A study into strain sensor of cement-based material using CPW transmission lines
-
Chunyan Song


Abstract
Based on the theory of coplanar waveguide (CPW) transmission line, a novel microwave non-destructive strain monitoring sensor specifically designed for cement-based material structures is presented in this study. The aim is to establish the relationship between the variation of the S11 phase parameter of the CPW strain sensor and the structural strain, utilizing a linear analysis. The feasibility of the strain monitoring by the CPW sensor is validated through simulations and experiments. The obtained results demonstrate a strong linear correlation between the phase change of the S11 parameter and the strain, with a goodness of fit of 0.987. The simulated strain sensor exhibits a sensitivity of 48.83 ppm/με, while the experimental measurement sensor shows a sensitivity of 65.82 ppm/με. These findings highlight the potential significance of the proposed method, offering a new approach that is characterized by high sensitivity, low cost, and simplicity for strain monitoring in concrete structures. Among them, the sensor cement mortar matrix made in this study was mixed with the recycled material made of waste glass steel FRP after a certain treatment process. The development of this method holds promise for the advancement of health monitoring in concrete structures.
1 Introduction
In order to accurately assess the deterioration of civil engineering structures, structural health monitoring systems have gradually developed over the past few decades. Structural health monitoring refers to the use of on-site, non-destructive monitoring methods to obtain internal information about the structure, including various characteristics of structural responses. This helps to understand changes in the structure due to damage or degradation [1]. Sensors are placed at critical locations of the building, such as columns, beams, and joints, to monitor the stress and strain of concrete structures. Through parameter analysis, the real-time health condition of the structure is determined. Prompt remedial measures can be taken in the event of dangerous cracks or damage, ensuring the safety of the structure to a great extent [2].
Concrete currently plays an irreplaceable role in civil engineering and national economic development due to its advantages of low cost and high performance [3]. Since the reform and opening up, advances in science and technology have led to rapid development in various scales of infrastructure construction. China’s construction industry is currently in a period of high-speed development, with widespread social attention on the construction quality of various large-scale buildings, bridges, roads, etc., [4]. Whether now or in the future, concrete is the most important part of many building materials, the annual use is very huge, and the application prospect is still wide [5]. Like all building materials, concrete structures also age and deteriorate over time. The degradation of concrete structures can be caused by various factors, such as material aging, exposure to harsh environmental conditions, overuse, overloading, insufficient maintenance, and lack of appropriate inspection methods and repair strategies [6]. All of these factors can lead to a progressive degradation of the structure, because the development of internal and external damage can have detrimental effects on its safety and structural integrity [7]. According to statistics, the concrete structure due to cracking and other problems of the annual maintenance cost is also quite huge, and the maintenance work needs a long time, need to cost huge human and financial resources [8]. Thus, how to monitor the structural health of civil engineering infrastructure construction, ensure that the civil engineering infrastructure is in good working condition, preventing emergencies and then avoiding irreparable losses is a key research topic in the field of civil engineering. At present, the most commonly used strain sensor is resistance strain gauge; its advantages are large measurement range and small size. However, the problems of complex wiring, disposable use and greatly affected by the environment limit its application scope [9]. In recent years, various structural health monitoring methods in the field of civil engineering have been gradually developing to overcome the limitations of traditional sensors. Among them, Blazquez-Bello [10] and others proposed a topology for microwave planar dielectric constant sensors with a focus on simplicity of manufacturing. Their experimental results indicate that resonator-based sensors can be obtained on PCB technology using environmentally friendly substrate materials such as liquid crystal polymer (LCP) or paper. These eco-friendly substrate materials have the advantages of being ultra-low-cost and biodegradable, making them suitable for applications involving low-loss materials. Ozbey et al. [11] propose and demonstrate a wireless, passive, metamaterials-based sensor that can remotely monitor sub-micron shifts in a millimeter range. The sensor includes a probe consisting of multiple nested split ring resonators (NSRRs) in a double-comb structure coupled to an external antenna in the near field. The near-field excitation response of the NSRR is very sensitive to displacement comb teeth within wide intervals, and the wireless sensing system has relatively high resolution (<1 µ m) and large dynamic range (over 7 mm), and high levels of linearity (R 2 > 0.99 in the 5 mm range) and sensitivity (>12.7 MHz/mm in the 1–3 mm range). Roshan [12] studied the use of multi-walled carbon nanotubes (MWCNTs) and graphene nanoplates (GNPs) in cement-stabilized sand. MWCNTs and GNPs can not only improve the mechanical properties of cement stabilized sand, but also transform the traditional cement stabilized sand into an inherent self-test material. Under cyclic loading to detect strain, cracks, and damage. To identify different degrees of injury, various macro-and microscopic analyses were performed to explain the self-perceived ability of the composite, which is important for structural health monitoring. With the rapid development of various structural health monitoring methods, the antenna sensors have gradually shown their advantages in recent years. The antenna sensor is based on the transmission line theory, applying the knowledge of electromagnetism to various structures, and monitors the strain of the structure through the parameter change of the transmission line. Among them, Pittella et al. [13] proposed a structural health monitoring system based on the open resonant ring network, with the aim of realizing a very sensitive structural health monitoring system. The network consists of sensors with different resonance frequencies, which can both monitor and locate the cracks. The simulation results show that the sensor can detect the crack in concrete by analyzing the resonance frequency. However, the proposed SSR (resonator) network design process is complicated, and too many parameters need to be determined, and the actual measurement requires two-port wiring measurement, and the wiring is complicated. Ke [14] systematically summarized the design method of microstrip antenna sensors, elucidating their feeding mechanism and impedance matching calculation method. They derived the mathematical relationship between the resonant frequency of microstrip antenna sensors and strain based on the “transmission line model”, providing theoretical criteria for strain measurement. They combined HFSS (High Frequency Structure Simulator) simulations and experimental studies to investigate the strain response characteristics of the sensors. The main conclusion drawn from their research is that microstrip antenna sensors can measure strains along their length and width directions, and the measurement sensitivity is determined by the initial resonant frequency. Wang et al. [15] proposed a newly developed impedance-based method for measuring changes in multi-directional strain using sensors based on nearly circular patches. They designed a novel three-dimensional feeding mechanism implemented by 90° bent microstrip lines for strain detection in any direction on the metal surface azimuthal plane. They found that the normalized impedance shows a linear relationship with multi-directional strain, with a sensitivity of approximately 100 ppm/με. The relationship between sensitivity and the sensor direction is derived as a cosine function. There are many studies on antenna type sensors at home and abroad, but most of them are based on microstrip lines and applied to precision metal components.
Coplanar waveguide (CPW) transmission line is developed on the basis of the traditional micro strip transmission line. It forms the metal floor of the micro strip line and the metal strip on the same plane, with simple structure and simple design process. At present, the application of CPW mainly focuses on transmission lines and microwave millimeter-wave integrated components, such as CPW plane antenna, CPW coupler, CPW filter and various CPW adapters, etc., [16]. This study presents a novel microwave non-destructive strain monitoring sensor for concrete structures based on CPW transmission line theory. Its advantages include high measurement sensitivity, compatibility with concrete structures, simple wiring, flexible design dimensions, and low production costs. The use of CST electromagnetic simulation software was employed to simulate the linear relationship between the S11 phase of the CPW sensor and structural strain, demonstrating excellent linearity between the two. To optimize the attachment position of the CPW sensor on the target structure, it was verified that bending the CPW sensor by 90° does not affect its impedance characteristics. In addition, the study investigated the influence of incorporating waste FRP on the mechanical properties of cement mortar. An optimized mix ratio was used to produce FRP cement mortar panels, and an experimental platform was set up to simulate strain occurring in concrete beams, slabs, and other structures under real-world conditions. The CPW sensors were tested and validated against the simulation results, showing a high level of agreement between the experimental and simulated outcomes. This study represents the first integration of CPW transmission lines with concrete strain monitoring, exploring the feasibility of applying CPW planar transmission lines in the field of concrete strain monitoring.
2 CPW strain sensor design and simulation
2.1 Determination of sensor materials and dimensions
In the process of simulation and actual measurement, it is necessary to consider the dielectric properties of the test material and the smoothness of the material surface. CPW transmission lines consist of three parts: the lower dielectric substrate, the upper metal ground plane, and the center conductor. The selection of the dielectric material mainly considers the substrate’s performance, aiming to achieve good adhesion with the cement-based material, ensuring a strong bond and excellent elasticity to prevent cracking at the interface between the substrate and the sensor during cement mortar deformation [17]. Rogers 6010LM is a ceramic-filled PTFE composite material with a relatively low Young’s modulus, which adheres well to cement mortar. This material also exhibits strict control over dielectric constant and thickness, low moisture absorption, and good thermal and mechanical stability. Therefore, a substrate with a thickness of 0.635 mm and a dielectric constant of 10.7, using Rogers 6010LM, is chosen as the material for manufacturing the sensor [18].
In practical applications, a 50 Ω transmission line offers a balance between voltage resistance, power transmission, and loss. The N5222A vector network analyzer was used in this experiment, which has a frequency measurement range of 10 MHz–26.5 GHz and features two ports. The center frequency of the transmission line was selected as 2.45 GHz, corresponding to the ISM frequency band.
This paper, based on known substrate material dielectric constants, a characteristic impedance of 50 Ω, and a center frequency of 2.45 GHz, calculates the preliminary dimensions of the CPW sensor directly using TX Line software. And the schematic diagram of the sensor cross-section is shown in Figure 1. The center conductor width of the CPW sensor is fine-tuned to achieve a 50 Ω impedance match. The software calculations primarily involve approximate formulas for characteristic impedance. Characteristic impedance refers to the impedance magnitude within an infinitely long unit length along the transmission direction on the transmission line. The value of characteristic impedance depends on factors such as the geometric shape, electrical properties, and electromagnetic environment of the transmission line. On the same transmission line, characteristic impedance remains constant and does not change with variations in signal frequency. An ideal CPW refers to both air and substrate on both sides being infinitely thick, considering the approximate quasi-TEM mode. The formula for calculating characteristic impedance can be expressed as:

Schematic diagram of the sensor cross-section.
ε r – The effective dielectric constant;
E – A function of a/b.
The sensor geometry and the sizes of various parameters are described in Figure 2 and Table 1, respectively.

Illustration of the CPW sensor: (a) CPW sensor front view. (b) CPW sensor side view.
Values of each parameter of the sensor.
| Parameters | Significance | Value (mm) |
|---|---|---|
| L | Sensor length | 40.5 |
| L 1 | Ground plane length | 15 |
| w | Center conductor width | 1.0 |
| g | Sensor gap width | 0.5 |
| h | Dielectric material thickness | 0.635 |
| ε r | Dielectric material permittivity | 10.7 (no unit) |
2.2 Sensor modeling and sensitivity analysis
2.2.1 Initial sensor design
To accurately predict the performance of the CPW strain sensor, CST electromagnetic simulation design software was used for modeling and analysis. Since this CPW sensor is intended for strain monitoring in mortar applications and does not require good radiation performance, and single-port testing is much simpler in terms of wiring compared to dual-port design is much simpler in terms of wiring compared to dual-port counterparts, as shown in Figure 3.

Preliminary design of the sensor: (a) Simulation waveguide port configuration and (b) CPW sensor impedance matching.
Ideally, the port width can be set to three times the width of the center conductor plus the width of two gaps [19]. However, due to geometric constraints, this needs to be reduced to approximately twice the sum of the center conductor width and the gap width. For an ungrounded CPW, the port should be expanded to at least half of the center conductor width plus the width of the gaps on each side. In the case of a grounded coplanar transmission line, the width on both sides of the center conductor should be the same, but the port should be made large enough to contact the underlying metal ground plane. The height of the port should be greater than four times the dielectric layer thickness or the gap width (whichever is larger).
In this study, the S11 phase variation of the CPW strain sensor was calculated for seven strain levels by scanning the parameter L (length of the CPW strain sensor) with a step size of 0.02 mm.
As shown in Figures 4 and 5, with the increase of strain applied to the sensor, there is a regular decrease in the phase of (reflection coefficient) S11. The linear fitting between the transmission line length L and the S11 phase has an excellent goodness of fit with a value of 0.998, indicating a strong linear relationship between the two. Since strain is commonly represented in micro-strain (με), which is strain multiplied by 10−6, the x-axis is represented in micro-strain units. The y-axis, representing the S11 phase, is scaled in ppm and is also normalized. The formula for the normalization process is as follows:
In the equation, D με represents the S11 phase after strain is applied, and D 0 represents the S11 phase without any strain, both measured in deg.

Variation of S11 phase with sensor dimension changes.

Linear relationship between L and S11 phase.
As shown in Figure 6, the linear fitting relationship between the normalized S11 phase and microstrain (με) for the sensor has a goodness of fit of 0.984. The slope of the fitted line represents the sensitivity sensor, which is 100.44 ppm/με. This sensitivity value indicates that for every 1 με of microstrain applied to the sensor in the length direction, the S11 phase of the sensor will change by 100.44 ppm.

Reflection coefficient (S11) phase versus microstrain.
2.2.2 3D strain sensor
To facilitate the welding of SMA connectors and the adhesion to the cement mortar substrate, in the simulation process, one side of the sensor was bent at a 90° angle. In this section, we studied the effects of the sensor’s 90° bending on impedance matching and sensor sensitivity. The 3D CPW strain sensor model is shown in Figure 7.

3D strain sensor model.
As shown in Figure 8, the port characteristic impedances (Impedance 1 and Impedance 2) represent the impedance matching before and after the bending, respectively. There is a difference of approximately 0.02 Ω between them due to the bending effect. This small difference can be considered negligible.

The impact of 90° bending on impedance matching of the sensor.
As shown in Figures 9 and 10, the linear fitting relationship between the normalized S11 phase and microstrain for this 3D strain sensor simulation has a goodness of fit of 0.987. The sensitivity has decreased to 48.83 ppm/με compared to before the bending.

Phase variation with 3D sensor dimension changes.

Microstrain – normalized S11 phase linear fitting relationship.
3 Fabrication of CPW strain sensor
The simulation results demonstrate that there is a good linear relationship between the CPW strain sensor’s S11 phase parameter and structural strain. The CPW transmission line theoretically can be used to monitor changes in structural strain with high sensitivity. However, real applications may differ from the software simulation. The simulation process may not fully reflect various issues that arise during the application. For example, the simulation ignores the strain transfer efficiency between the sensor and the cement mortar. Cement mortar is an internally non-uniform and anisotropic material with numerous surface voids, and it needs verification whether the sensor and the cement mortar can deform synchronously upon adhesion [20]. Additionally, the actual application environment can have varying effects on electromagnetic signals, which also require experimental study.
In this experiment, the CPW strain sensor was fabricated using the LPKF ProtoMat S63 laser engraving machine from the LPKF Group, and its technical indicators are shown in Table 2.
Technical specifications of LPKF ProtoMat S63 laser engraving machine.
| Model | Resolution ratio (μm) | Sheet size (mm) | Minimum insulation spacing (mm) | Minimum drilling diameter (mm) | Accuracy of the positioning hole system (mm) |
|---|---|---|---|---|---|
| ProtoMat S63 | 0.5 | 305 × 229 | 0.1 | 0.15 | ±0.02 |
LPKF provides two types of cutting tools based on their length: 36 mm for surface processing and 38 mm for drilling and cutting processing. After synchronizing the machine with the accompanying software, the processing workflow and selection wizard (double-sided processing) are set first. The pre-prepared DXF format file is imported, and the graphics are closed after being processed. The substrate material, center conductor, and ground plane are assigned to their respective layers, and the remaining copper foil parts need to be filled. Fiducials, with a diameter of generally 1 mm or 1.5 mm, are inserted for positioning. Insulation and contour milling cutter paths are generated to calculate the cutting paths of the laser engraving machine. The minimum line width and spacing for mechanical engraving cannot be less than 0.1 mm. For the selected substrate and this experiment, lines with spacings above 0.2 mm only require the selection of universal cutter 0.2 mm and end mill 1 mm (or end mill 0.8 mm) for copper stripping. After calculating and generating the toolpaths, the tools need to be allocated in the tool tray (the tool tray can accommodate up to 15 tools simultaneously). Before starting the machining, the milling width and depth of the tools should be checked and adjusted. The Rogers 6010 ML material is securely attached to the processing area with adhesive paper, and material settings (material type, copper foil thickness, material thickness) are done. Using the processing view, the processing graphics are moved to the appropriate position using the mouse, and then the processing is carried out based on the prompts.
After the engraving process is completed, the sensor needs to be removed, and then one side of the ground plane is bent and SMA connectors are soldered. These processes are all done manually. To prevent the sensor’s surface from being scratched, the sensor is covered with a soft cotton non-woven fabric. Then, using pliers, the sensor is slowly bent at the ground plane position to a 90° angle. Subsequently, an electric soldering iron is used to solder the SMA connectors to the end of the sensor, ensuring a firm connection between the ground plane and the flange, as well as between the center conductor and the connector pins. The specific production process is shown in Figure 11.
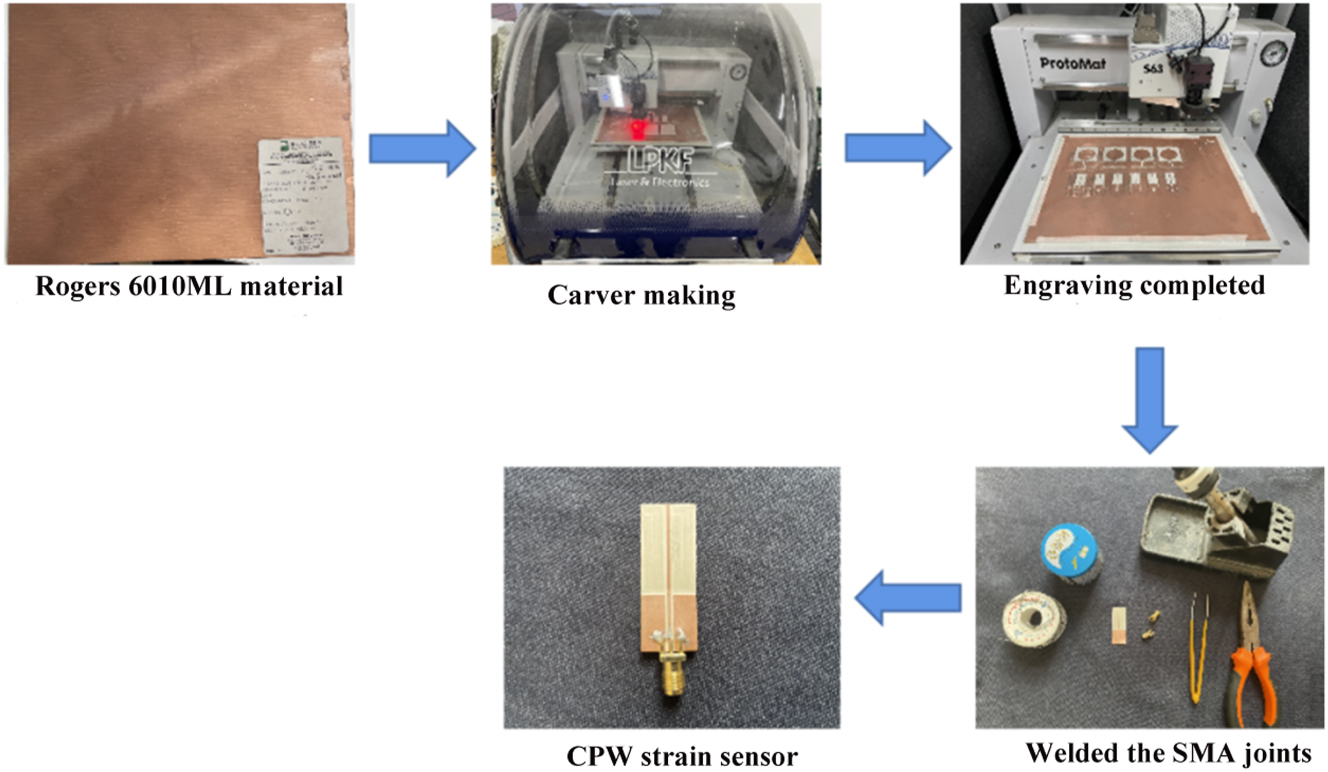
CPW strain sensor fabrication process.
4 Fabrication of waste FRP mortar test platform substrate
In response to the national policy of solid waste recycling, this study incorporated recycled materials made from waste Glass Fiber Reinforced Polymer (FRP) into the production of cement mortar substrates. The research investigates the impact of the substitution of natural sand with recycled FRP sand on the basic mechanical properties of cement mortar, including flowability, compressive strength, and flexural strength [21]. The flowability of the cement mortar was tested using the “Method for Flowability Test of Cement Grout” (GB/T2419-2016) through a slump test. Compressive and flexural strength tests were conducted following the “Method for Strength Testing of Cement Grout (ISO Method)” (GB/T17671-2021).
4.1 Determine the mix ratio of the waste FRP mortar
According to Figure 12(a)–(c), it can be observed that with the increase in the substitution of natural sand with recycled FRP particles, the flowability, compressive strength, and flexural strength of the cement mortar gradually decrease. When the substitution rate reaches 20 %, the cement mortar with FRP waste material shows good basic performance. In this study, the proportion of 20 % recycled FRP particles substituting sand was used as the mixture ratio to fabricate the test sensor cement mortar substrate, based on the baseline mix proportion.

Effect of FRP content on fluidity, compressive strength and flexural strength: (a) Effect of FRP incorporation on folding intensity, (b) Effect of FRP incorporation on the compressive strength and (c) Effect of FRP incorporation on the fluidity.
5 Experiment platform setup
According to the provided FRP cement mortar mix proportion for the experiment, a cement mortar board with dimensions of 400 mm × 100 mm × 10 mm was fabricated. The two ends of the board were fixed, and pressure was applied in the middle section using weights to simulate the strain generated by the force on beams or other concrete structures [22], as shown in Figure 13.

Schematic diagram of the test platform construction.
The fabricated CPW strain sensor has a dielectric material on its bottom surface, which adheres well to the cement mortar [23]. The adhesive process is similar to that used for traditional resistive strain sensors. Before attaching the sensor, the surface of the specimen is smoothed using coarse sandpaper, and any remaining powder from the smoothing process is wiped off. The CPW strain sensor is securely attached to the center of the tensile side of the specimen using strong adhesive. On both sides of the sensor (in the width direction of the specimen), a resistive strain gauge is attached to collect strain data. The strain is gradually applied to the center of the specimen by adding weights. During the process of generating each strain level, the S11 phase of the strain gauge is collected using a handheld network analyzer, and two sets of strain data are collected and averaged using a strain data acquisition instrument. Each sensor parameter value corresponds to a strain value. As the surface of the cement mortar and the sensor’s dielectric substrate are made of different materials and bonded with adhesive, the transmission efficiency at the interface may decrease [24]. Two sets of test specimens, M1 and M2, were prepared. M2 specimens were used to collect sensor parameters and strain values for data analysis and assessing the degree of linear fit. M1 specimens were used to test the strain transfer ratio after the sensor was attached to the specimen’s surface. A resistive strain gauge was attached to the sensor’s surface to measure the strain, and the ratio of the sensor’s strain to the specimen’s strain was calculated.
6 Analysis of test results
The CPW sensor test cross-section schematic and strain transfer ratio test M1 samples are shown in Figure 14. Several weights were used to simulate six levels of loads, and six sets of strain values for both the mortar and the sensor were obtained after loading. From Table 3, it can be observed that under the six levels of strain loading, the strain transfer efficiency of the sensor remains above 80 %, with an average strain transfer efficiency of 83.8 %. This indicates that the sensor’s dielectric substrate is well-adhered to the cement mortar, and there was no detachment of the sensor or breaking of the center conductor within the range of around 2000 microstrains.

Schematic diagram of the pilot test: (a) Schematic of the cross section of CPW sensor test and (b) Strain transfer ratio test M1 sample.
Strain transfer ratio measurement results of M1 samples.
| Mass of the weights | 200 g | 600 g | 1000 g | 2000g | 3000 g | 4000 g |
| Cement mortar strain (με) | 36 | 243 | 596 | 925 | 1609 | 2297 |
| CPW strain sensor strain (με) | 31 | 205 | 510 | 759 | 1344 | 1867 |
| The strain transmission ratio | 86.1 | 84.4 | 85.6 | 82.1 | 83.5 | 81.3 |
The test results of the CPW sensor test platform and test are shown in Figure 15 and Table 4, respectively. The cement mortar strain obtained from the experimental test is linearly fitted with the standardized S11 phase parameter of the sensor, and the fitting relationship is shown in Figure 16, wherein the goodness of fit (R 2) is recorded as 0.96 whereas the test sensitivity reaches 65.82 ppm/με. There is a difference of about 17 ppm/με compared to the simulated one, which is attributed to the uncertainties caused by handcrafting errors in sensor fabrication, engraving precision, and testing environment, among other factors [25].

The CPW sensor test platform.
M2 sample strain of cement mortar and phase parameters of sensor S11.
| Mass of the weights (g) | Restrain 1 (με) | Restrain 2 (με) | Average strain (με) | S11 phase (deg) |
|---|---|---|---|---|
| 200 | 27 | 33 | 30 | 8.82 |
| 600 | 114 | 102 | 108 | 8.70 |
| 1000 | 229 | 207 | 218 | 8.59 |
| 2000 | 545 | 514 | 529.5 | 8.41 |
| 3000 | 604 | 596 | 600 | 8.25 |
| 4000 | 942 | 997 | 969.5 | 7.98 |
| 5000 | 1647 | 1732 | 1689.5 | 7.73 |
| 6000 | 2344 | 2475 | 2409.5 | 7.42 |

Measured microstrain-normalized S11 phase linear fitting relationship.
7 Conclusions
There is a good linear relationship between the CPW strain sensor’s S11 phase parameter variation and its size change. In this study, the CPW sensor showed a high level of linear fit with a sensitivity of 65.82 ppm/με. The experimental results indicate the feasibility of applying CPW transmission line theory to concrete structure strain monitoring.
The research results show that bending the CPW sensor does not affect its characteristic impedance, making it convenient for SMA connector soldering. However, after the sensor is bent, the baseline value of the S11 phase will change, which in turn affects the sensor’s sensitivity.
The Rogers 6010LM board has excellent overall performance, with a relatively high dielectric constant. The CPW strain sensor made with Rogers 6010LM as the substrate exhibits good co-planar adhesion with the cement mortar, and the strain transfer efficiency between the two can reach over 80 %.
Compared to traditional resistive strain gauges, the CPW sensor shows higher sensitivity and a higher level of linear fit. Moreover, ordinary PCB materials are cost-effective, allowing for cost-efficient mass production of CPW sensors with the potential for multiple reuses. The design of the single-port CPW sensor only requires a single wire connection to the handheld network analyzer, eliminating the need for complex wiring operations.
The simulation analysis using CST design software ignores the influence of complex material mechanical deformation and various environmental factors, leading to less accurate representation of real-world conditions. As a result, there may be discrepancies between the simulation and actual measurement results. During the experimental process, the sensor engraving and fabrication, as well as the testing environment, can also affect the experimental outcomes.
-
Research ethics: Not applicable.
-
Author contributions: For research articles with several authors, a short paragraph specifying their individual contributions must be provided. Data curation, Weidong Zhang; Methodology, Chunyan Song; Supervision, Xiaodong Wu; Writing – original draft, Song Gao; Writing - review & editing, Mo Li.
-
Competing interests: The authors declare that they have no conflict of interest.
-
Research funding: None declared.
-
Data availability: The raw data can be obtained on request from the corresponding author.
References
[1] C. C. Ciang, J. R. Lee, and H. J. Bang, “Structural health monitoring for a wind turbine system: A review of damage detection methods,” Meas. Sci. Technol., vol. 19, no. 12, p. 122001, 2008, https://doi.org/10.1088/0957-0233/19/12/122001.Search in Google Scholar
[2] N. Adamo, N. Al-Ansari, V. Sissakian, J. Laue, and S. Knutsson, “Dams safety: Inspections, safety reviews, and legislations,” J. Earth Sci. Geotech. Eng., vol. 11, no. 1, pp. 109–143, 2021, https://doi.org/10.47260/jesge/1114.Search in Google Scholar
[3] G. Hao, et al.., “Distributed feedback fiber laser acoustic emission sensor for concrete structure health monitoring,” in 23rd International Conference on Optical Fibre Sensors, vol. 9157, pp. 77–80, 2014.10.1117/12.2058301Search in Google Scholar
[4] Q. He, J. Xu, T. Wang, and A. P. C. Chan, “Identifying the driving factors of successful megaproject construction management: Findings from three Chinese cases,” Front. Eng. Manag., vol. 8, no. 1, pp. 5–16, 2021, https://doi.org/10.1007/s42524-019-0058-8.Search in Google Scholar
[5] M. Schneider, M. Romer, M. Tschudin, and H. Bolio, “Sustainable cement production – present and future,” Cement Concr. Res., vol. 41, no. 7, pp. 642–650, 2011, https://doi.org/10.1016/j.cemconres.2011.03.019.Search in Google Scholar
[6] J. Kevern, “Maintenance and repair options for pervious concrete,” in Low Impact Development 2010: Redefining Water in the City, 2010, pp. 113–125.10.1061/41099(367)12Search in Google Scholar
[7] Frangopol, D. M. and Soliman, M., Life-cycle of Structural Systems: Recent Achievements and Future Directions[M]//Structures andIinfrastructure Systems, London, Routledge, 2019, pp. 46–65.10.1201/9781351182805-3Search in Google Scholar
[8] Babashamsi, P., Yusoff, N. I. M., Ceylan, H., Ghani, N., and Hashem, J., “Evaluation of pavement life cycle cost analysis: Review and analysis[J],” Int. J. Pavement Res. Technol., vol. 9, no. 4, pp. 241–254, 2016. http://doi.org/10.1016/j.ijprt.2016.08.004.10.1016/j.ijprt.2016.08.004Search in Google Scholar
[9] Fu, J., Cano, Z. P., Park, M. G., Yu, A., Fowler, M., and Chen, Z., “Electrically rechargeable zinc–air batteries: progress, challenges, and perspectives[J],” Adv. Mater., vol. 29, no. 7, p. 1604685, 2017. https://doi.org/10.1002/adma.201604685.Search in Google Scholar PubMed
[10] Blazquez-Bello, S., Campos-Roca, Y., Bangert, A., and Sandhagen, C., “Impact of substrate and bending angle on the performance of microwave PCB sensors for permittivity measurements,” Measurement, vol. 175, p. 109114, 2021. https://doi.org/10.1016/j.measurement.2021.109114.Search in Google Scholar
[11] B. Ozbey, et al., “Wireless displacement sensing enabled by metamaterial probes for remote structural health monitoring,” Sensors, vol. 14, no. 1, pp. 1691–1704, 2014, https://doi.org/10.3390/s140101691.Search in Google Scholar PubMed PubMed Central
[12] M. J. Roshan, M. Abedi, A. G. Correia, and R. Fangueiro, “Application of self-sensing cement-stabilized sand for damage detection,” Constr. Build. Mater., vol. 403, p. 133080, 2023, https://doi.org/10.1016/j.conbuildmat.2023.133080.Search in Google Scholar
[13] E. Pittella, L. Angrisani, A. Cataldo, E. Piuzzi, and F. Fabbrocino, “Embedded split ring resonator network for health monitoring in concrete structures,” IEEE Instrum. Meas. Mag., vol. 23, no. 9, pp. 14–20, 2020, https://doi.org/10.1109/mim.2020.9289070.Search in Google Scholar
[14] Ke, L., Strain Measurement and Crack Recognition Method Based on Microstrip Antenna Sensor, Wuhan, Wuhan University of Technology, 2018.Search in Google Scholar
[15] Wang, L., Chung, K., Gao, S., Ma, M., Luo, J., and Li, Y., “A novel multidirectional strain sensor realized by a 3D microstrip-line fed near-circular patch antenna,” Appl. Comput. Electromagn. Soc. J., vol. 36, pp. 1237–1247, 2021. https://doi.org/10.47037/2021.aces.j.360917.Search in Google Scholar
[16] Liu, X., “Application of coplanar waveguide transmission line in antenna feeder design,” Inf. Syst. Eng., vol. 10, no. 10, pp. 87–89, 2011.Search in Google Scholar
[17] Su, Y. F., Hang, G., Kong, Z., Nantung, T., and Lu, N., “Embeddable piezoelectric sensors for strength gain monitoring of cementitious materials: The influence of coating materials[J],” Eng. Sci., vol. 11, no. 10, pp. 66–75, 2020. https://doi.org/10.30919/es8d1114.Search in Google Scholar
[18] K. Chung, M. Ghannam, and C. Zhang, “Effect of specimen shapes on compressive strength of engineered cementitious composites (ECCs),” Arabian J. Sci. Eng., vol. 43, no. 4, pp. 1825–1837, 2017, https://doi.org/10.1007/s13369-017-2776-8.Search in Google Scholar
[19] S. Luo, A. Mancini, R. Berté, B. H. Hoff, S. A. Maier, and J. C. de Mello, “Massively parallel arrays of size-controlled metallic nanogaps with gap-widths down to the sub-3-nm level,” Adv. Mater., vol. 33, no. 20, p. 2100491, 2021, https://doi.org/10.1002/adma.202100491.Search in Google Scholar PubMed
[20] L. Wang, Y. Yao, J. Li, Y. Tao, and K. Liu, “Review of visualization technique and its application of road aggregates based on morphological features,” Appl. Sci., vol. 12, no. 20, p. 10571, 2022, https://doi.org/10.3390/app122010571.Search in Google Scholar
[21] K. Chung, L. Yuan, S. Ji, L. Sun, C. Qu, and C. Zhang, “Dielectric characterization of Chinese standard concrete for compressive strength evaluation,” Appl. Sci., vol. 7, no. 2, p. 177, 2017, https://doi.org/10.3390/app7020177.Search in Google Scholar
[22] K. Chung, L. Wang, M. Ghannam, M. Guan, and J. Luo, “Prediction of concrete compressive strength based on early-age effective conductivity measurement,” J. Build. Eng., vol. 35, p. 101998, 2021, https://doi.org/10.1016/j.jobe.2020.101998.Search in Google Scholar
[23] Hu, J., et al., “Development of electromagnetic microwave absorbers in cementitious materials,” Compos. Struct., vol. 312, p. 116886, 2023. https://doi.org/10.1016/j.compstruct.2023.116886.Search in Google Scholar
[24] Lim, Y. Y., Smith, S. T., Padilla, R. V., and Soh, C. K., “Monitoring of concrete curing using the electromechanical impedance technique: Review and path forward,” Structural Health Monitoring, vol. 20, no. 2, pp. 604–636, 2021.10.1177/1475921719893069Search in Google Scholar
[25] Fan, S. K. S., Hsu, C. Y., Luo, Y., Abidian, M. R., Ahn, J. H., Akinwande, D., Andrews, A. M., Antonietti, M., and Chen, X., “Technology roadmap for flexible sensors,” ACS nano., vol. 46, pp. 5211–5295, 2023.Search in Google Scholar
© 2024 the author(s), published by De Gruyter, Berlin/Boston
This work is licensed under the Creative Commons Attribution 4.0 International License.
Articles in the same Issue
- Frontmatter
- Research Articles
- A calibration method for vector network analyzers using a line and three or more offset-reflect standards
- A fast convergent solution of wave propagation for multilayer inhomogeneous cylindrical dielectric waveguides using a semianalytical method
- Imaging of cylindrical inhomogeneites in a parallel plate waveguide with reverse time migration method
- A high-selectivity ceramic bandpass filter with controllable transmission zeros
- Review Article
- Revolutionizing healthcare with metamaterial-enhanced antennas: a comprehensive review and future directions
- Research Articles
- A study into strain sensor of cement-based material using CPW transmission lines
- Gain enhancement in octagonal shaped frequency reconfigurable antenna using metasurface superstrate
- High gain and high-efficiency compact resonator antennas based on spoof surface plasmon polaritons
- Gain enhancement of ultra-wideband hexagonal slot antenna using tessellated rhombic loops based reflector
- Terahertz MIMO antenna array for future generation of wireless applications